Brockton, MT Map & Demographics
Brockton Map
Brockton Overview
$11,182
PER CAPITA INCOME
$35,000
AVG FAMILY INCOME
37.7%
WAGE / INCOME GAP [ % ]
62.3¢/ $1
WAGE / INCOME GAP [ $ ]
0.54
INEQUALITY / GINI INDEX
459
TOTAL POPULATION
263
MALE POPULATION
196
FEMALE POPULATION
134.18
MALES / 100 FEMALES
74.52
FEMALES / 100 MALES
27.9
MEDIAN AGE
5.9
AVG FAMILY SIZE
4.6
AVG HOUSEHOLD SIZE
97
LABOR FORCE [ PEOPLE ]
32.0%
PERCENT IN LABOR FORCE
1.0%
UNEMPLOYMENT RATE
Brockton Zip Codes
Brockton Area Codes
Income in Brockton
Income Overview in Brockton
| Characteristic | Number | Measure |
| Per Capita Income | 459 | $11,182 |
| Median Family Income | 70 | $35,000 |
| Mean Family Income | 70 | $40,189 |
| Median Household Income | 100 | $0 |
| Mean Household Income | 100 | $36,049 |
| Income Deficit | 70 | $0 |
| Wage / Income Gap (%) | 459 | 37.71% |
| Wage / Income Gap ($) | 459 | 62.29¢ per $1 |
| Gini / Inequality Index | 459 | 0.54 |
Earnings by Sex in Brockton
Average Earnings in Brockton are $35,000, $49,167 for men and $30,625 for women, a difference of 37.7%.
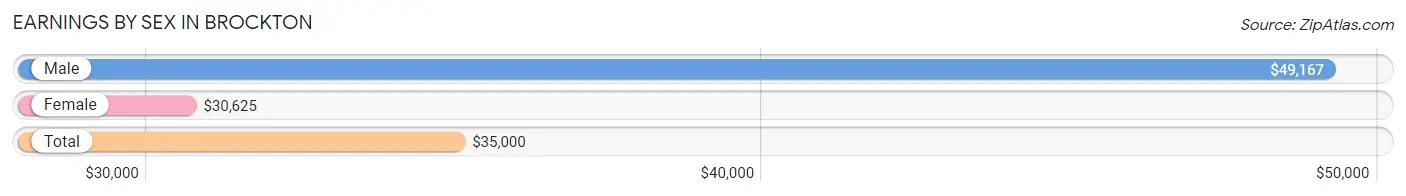
| Sex | Number | Average Earnings |
| Male | 52 (47.3%) | $49,167 |
| Female | 58 (52.7%) | $30,625 |
| Total | 110 (100.0%) | $35,000 |
Earnings by Sex by Income Bracket in Brockton
The most common earnings brackets in Brockton are $65,000 to $74,999 for men (22 | 42.3%) and $25,000 to $29,999 for women (12 | 20.7%).
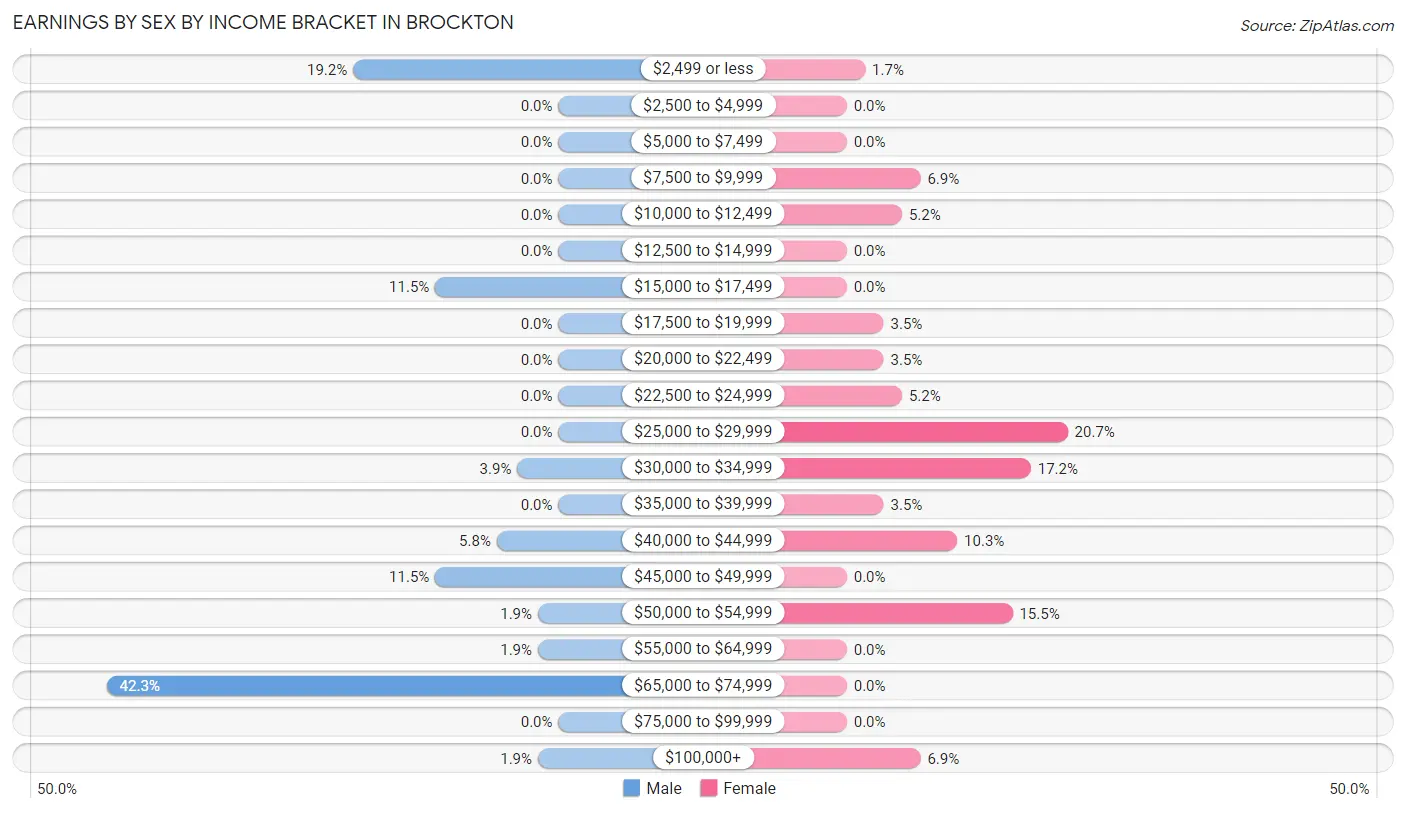
| Income | Male | Female |
| $2,499 or less | 10 (19.2%) | 1 (1.7%) |
| $2,500 to $4,999 | 0 (0.0%) | 0 (0.0%) |
| $5,000 to $7,499 | 0 (0.0%) | 0 (0.0%) |
| $7,500 to $9,999 | 0 (0.0%) | 4 (6.9%) |
| $10,000 to $12,499 | 0 (0.0%) | 3 (5.2%) |
| $12,500 to $14,999 | 0 (0.0%) | 0 (0.0%) |
| $15,000 to $17,499 | 6 (11.5%) | 0 (0.0%) |
| $17,500 to $19,999 | 0 (0.0%) | 2 (3.5%) |
| $20,000 to $22,499 | 0 (0.0%) | 2 (3.5%) |
| $22,500 to $24,999 | 0 (0.0%) | 3 (5.2%) |
| $25,000 to $29,999 | 0 (0.0%) | 12 (20.7%) |
| $30,000 to $34,999 | 2 (3.8%) | 10 (17.2%) |
| $35,000 to $39,999 | 0 (0.0%) | 2 (3.5%) |
| $40,000 to $44,999 | 3 (5.8%) | 6 (10.3%) |
| $45,000 to $49,999 | 6 (11.5%) | 0 (0.0%) |
| $50,000 to $54,999 | 1 (1.9%) | 9 (15.5%) |
| $55,000 to $64,999 | 1 (1.9%) | 0 (0.0%) |
| $65,000 to $74,999 | 22 (42.3%) | 0 (0.0%) |
| $75,000 to $99,999 | 0 (0.0%) | 0 (0.0%) |
| $100,000+ | 1 (1.9%) | 4 (6.9%) |
| Total | 52 (100.0%) | 58 (100.0%) |
Earnings by Sex by Educational Attainment in Brockton
Average earnings in Brockton are $48,750 for men and $30,313 for women, a difference of 37.8%. Men with an educational attainment of college or associate's degree enjoy the highest average annual earnings of $66,406, while those with high school diploma education earn the least with $2,499. Women with an educational attainment of high school diploma earn the most with the average annual earnings of $30,313, while those with college or associate's degree education have the smallest earnings of $29,722.
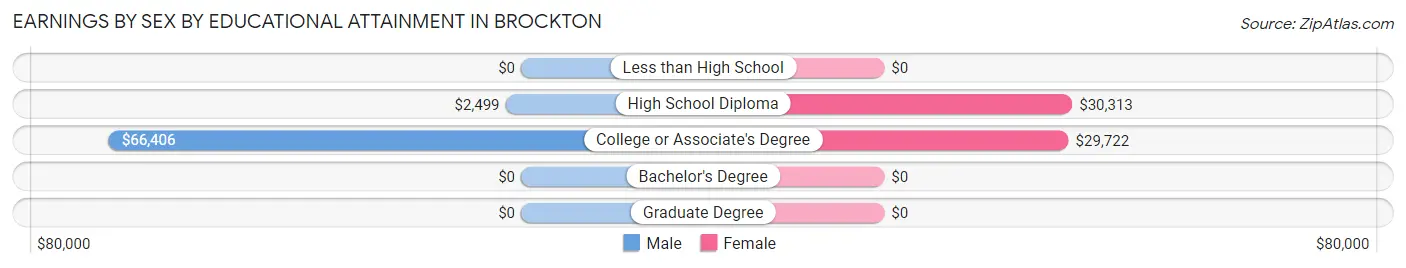
| Educational Attainment | Male Income | Female Income |
| Less than High School | - | - |
| High School Diploma | $2,499 | $30,313 |
| College or Associate's Degree | $66,406 | $29,722 |
| Bachelor's Degree | - | - |
| Graduate Degree | - | - |
| Total | $48,750 | $30,313 |
Family Income in Brockton
Family Income Brackets in Brockton
According to the Brockton family income data, there are 15 families falling into the less than $10,000 income range, which is the most common income bracket and makes up 21.4% of all families.
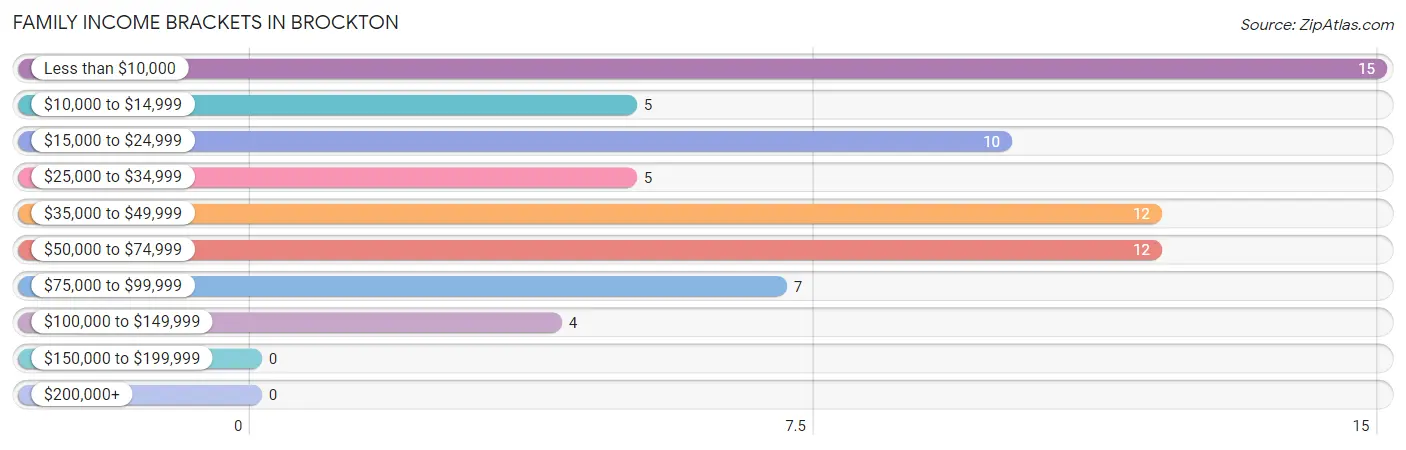
| Income Bracket | # Families | % Families |
| Less than $10,000 | 15 | 21.4% |
| $10,000 to $14,999 | 5 | 7.1% |
| $15,000 to $24,999 | 10 | 14.3% |
| $25,000 to $34,999 | 5 | 7.1% |
| $35,000 to $49,999 | 12 | 17.1% |
| $50,000 to $74,999 | 12 | 17.1% |
| $75,000 to $99,999 | 7 | 10.0% |
| $100,000 to $149,999 | 4 | 5.7% |
| $150,000 to $199,999 | 0 | 0.0% |
| $200,000+ | 0 | 0.0% |
Family Income by Famaliy Size in Brockton
| Income Bracket | # Families | Median Income |
| 2-Person Families | 26 (37.1%) | $0 |
| 3-Person Families | 7 (10.0%) | $0 |
| 4-Person Families | 14 (20.0%) | $0 |
| 5-Person Families | 14 (20.0%) | $0 |
| 6-Person Families | 4 (5.7%) | $0 |
| 7+ Person Families | 5 (7.1%) | $0 |
| Total | 70 (100.0%) | $35,000 |
Family Income by Number of Earners in Brockton
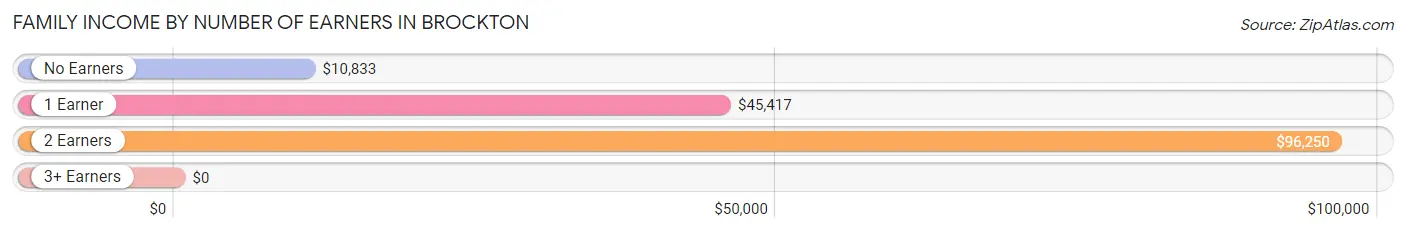
| Number of Earners | # Families | Median Income |
| No Earners | 24 (34.3%) | $10,833 |
| 1 Earner | 35 (50.0%) | $45,417 |
| 2 Earners | 9 (12.9%) | $96,250 |
| 3+ Earners | 2 (2.9%) | $0 |
| Total | 70 (100.0%) | $35,000 |
Household Income in Brockton
Household Income Brackets in Brockton
With 32 households falling in the category, the less than $10,000 income range is the most frequent in Brockton, accounting for 32.0% of all households.
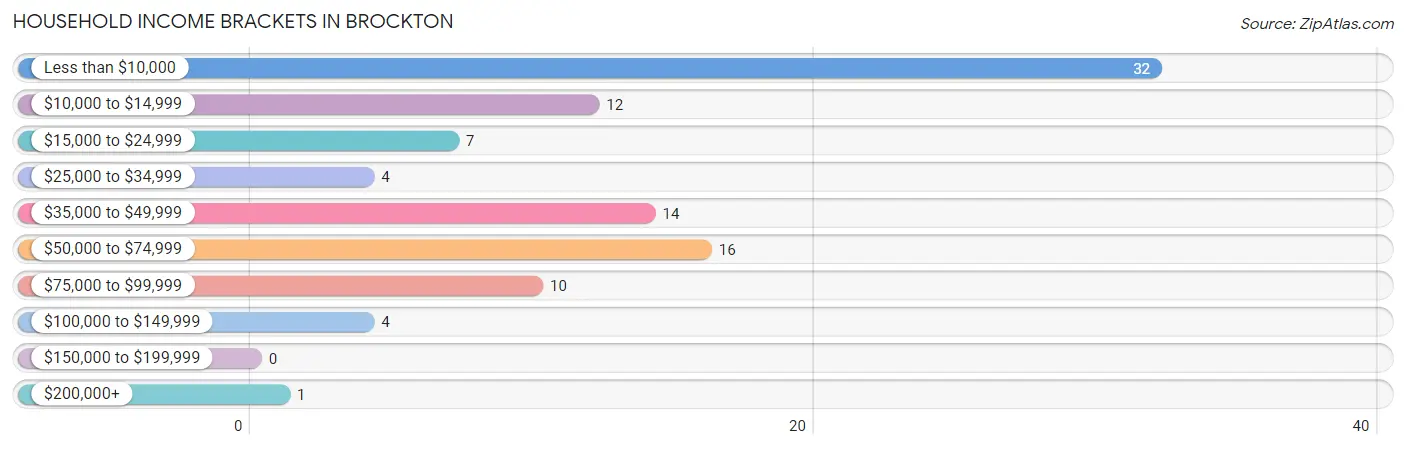
| Income Bracket | # Households | % Households |
| Less than $10,000 | 32 | 32.0% |
| $10,000 to $14,999 | 12 | 12.0% |
| $15,000 to $24,999 | 7 | 7.0% |
| $25,000 to $34,999 | 4 | 4.0% |
| $35,000 to $49,999 | 14 | 14.0% |
| $50,000 to $74,999 | 16 | 16.0% |
| $75,000 to $99,999 | 10 | 10.0% |
| $100,000 to $149,999 | 4 | 4.0% |
| $150,000 to $199,999 | 0 | 0.0% |
| $200,000+ | 1 | 1.0% |
Household Income by Householder Age in Brockton
The median household income in Brockton is $0, with the highest median household income of $42,292 found in the 25 to 44 years age bracket for the primary householder. A total of 37 households (37.0%) fall into this category. Meanwhile, the 15 to 24 years age bracket for the primary householder has the lowest median household income of $0, with 2 households (2.0%) in this group.
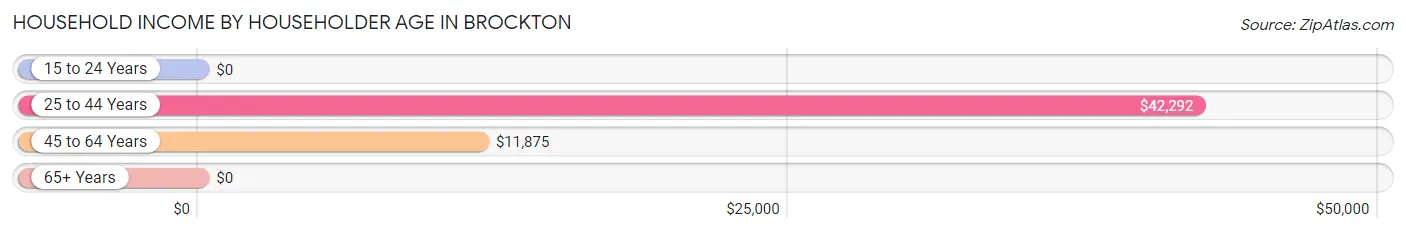
| Income Bracket | # Households | Median Income |
| 15 to 24 Years | 2 (2.0%) | $0 |
| 25 to 44 Years | 37 (37.0%) | $42,292 |
| 45 to 64 Years | 39 (39.0%) | $11,875 |
| 65+ Years | 22 (22.0%) | $0 |
| Total | 100 (100.0%) | $0 |
Poverty in Brockton
Income Below Poverty by Sex and Age in Brockton
With 52.1% poverty level for males and 62.3% for females among the residents of Brockton, 65 to 74 year old males and under 5 year old females are the most vulnerable to poverty, with 10 males (100.0%) and 21 females (100.0%) in their respective age groups living below the poverty level.
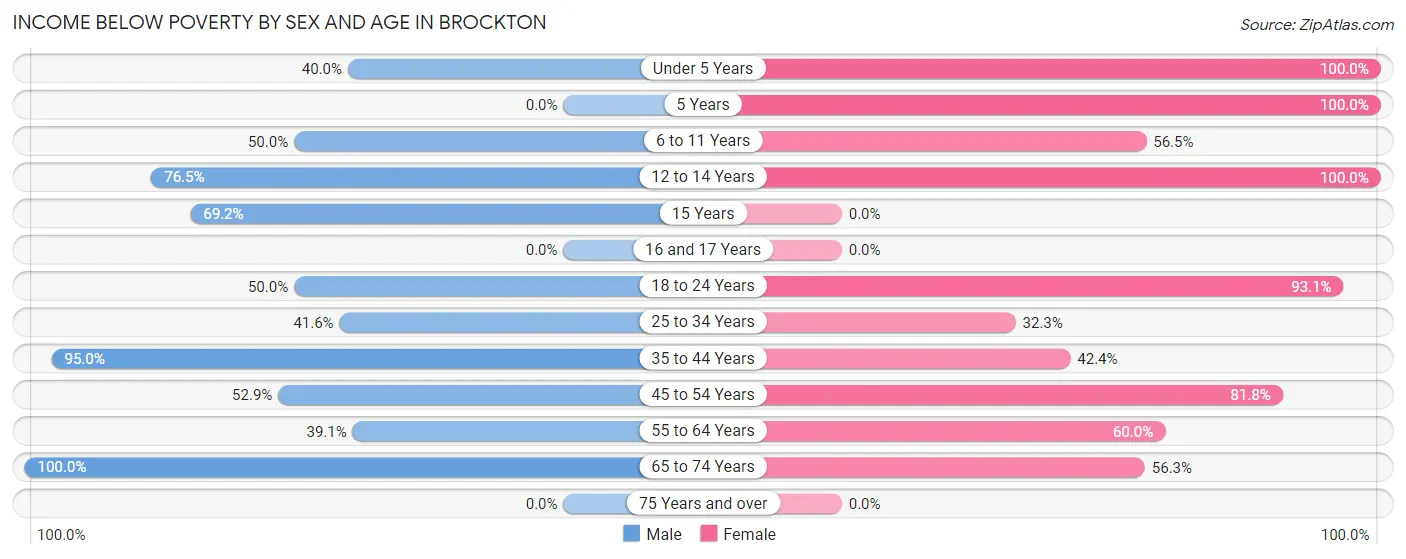
| Age Bracket | Male | Female |
| Under 5 Years | 14 (40.0%) | 21 (100.0%) |
| 5 Years | 0 (0.0%) | 5 (100.0%) |
| 6 to 11 Years | 16 (50.0%) | 13 (56.5%) |
| 12 to 14 Years | 13 (76.5%) | 2 (100.0%) |
| 15 Years | 9 (69.2%) | 0 (0.0%) |
| 16 and 17 Years | 0 (0.0%) | 0 (0.0%) |
| 18 to 24 Years | 6 (50.0%) | 27 (93.1%) |
| 25 to 34 Years | 32 (41.6%) | 10 (32.3%) |
| 35 to 44 Years | 19 (95.0%) | 14 (42.4%) |
| 45 to 54 Years | 9 (52.9%) | 9 (81.8%) |
| 55 to 64 Years | 9 (39.1%) | 9 (60.0%) |
| 65 to 74 Years | 10 (100.0%) | 9 (56.2%) |
| 75 Years and over | 0 (0.0%) | 0 (0.0%) |
| Total | 137 (52.1%) | 119 (62.3%) |
Income Above Poverty by Sex and Age in Brockton
According to the poverty statistics in Brockton, males aged 16 and 17 years and females aged 15 years are the age groups that are most secure financially, with 100.0% of males and 100.0% of females in these age groups living above the poverty line.
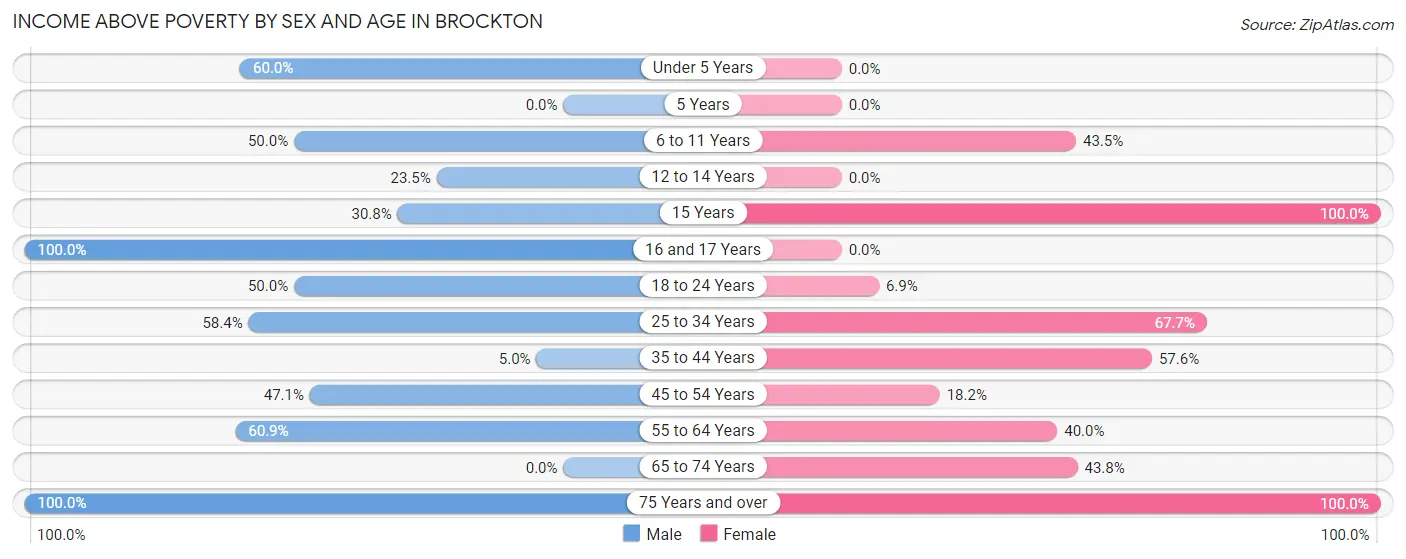
| Age Bracket | Male | Female |
| Under 5 Years | 21 (60.0%) | 0 (0.0%) |
| 5 Years | 0 (0.0%) | 0 (0.0%) |
| 6 to 11 Years | 16 (50.0%) | 10 (43.5%) |
| 12 to 14 Years | 4 (23.5%) | 0 (0.0%) |
| 15 Years | 4 (30.8%) | 3 (100.0%) |
| 16 and 17 Years | 5 (100.0%) | 0 (0.0%) |
| 18 to 24 Years | 6 (50.0%) | 2 (6.9%) |
| 25 to 34 Years | 45 (58.4%) | 21 (67.7%) |
| 35 to 44 Years | 1 (5.0%) | 19 (57.6%) |
| 45 to 54 Years | 8 (47.1%) | 2 (18.2%) |
| 55 to 64 Years | 14 (60.9%) | 6 (40.0%) |
| 65 to 74 Years | 0 (0.0%) | 7 (43.8%) |
| 75 Years and over | 2 (100.0%) | 2 (100.0%) |
| Total | 126 (47.9%) | 72 (37.7%) |
Income Below Poverty Among Married-Couple Families in Brockton
The poverty statistics for married-couple families in Brockton show that 19.1% or 4 of the total 21 families live below the poverty line. Families with no children have the highest poverty rate of 100.0%, comprising of 2 families. On the other hand, families with 3 or 4 children have the lowest poverty rate of 0.0%, which includes 0 families.
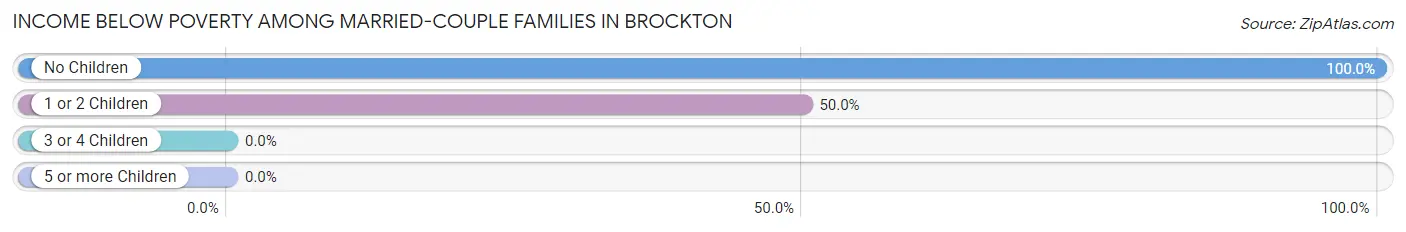
| Children | Above Poverty | Below Poverty |
| No Children | 0 (0.0%) | 2 (100.0%) |
| 1 or 2 Children | 2 (50.0%) | 2 (50.0%) |
| 3 or 4 Children | 15 (100.0%) | 0 (0.0%) |
| 5 or more Children | 0 (0.0%) | 0 (0.0%) |
| Total | 17 (80.9%) | 4 (19.1%) |
Income Below Poverty Among Single-Parent Households in Brockton
According to the poverty data in Brockton, 90.0% or 9 single-father households and 64.1% or 25 single-mother households are living below the poverty line. Among single-father households, those with no children have the highest poverty rate, with 7 households (100.0%) experiencing poverty. Likewise, among single-mother households, those with 3 or 4 children have the highest poverty rate, with 12 households (100.0%) falling below the poverty line.
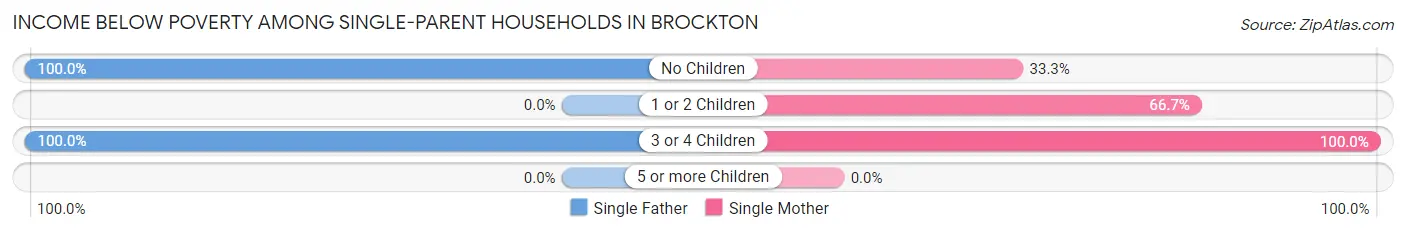
| Children | Single Father | Single Mother |
| No Children | 7 (100.0%) | 5 (33.3%) |
| 1 or 2 Children | 0 (0.0%) | 8 (66.7%) |
| 3 or 4 Children | 2 (100.0%) | 12 (100.0%) |
| 5 or more Children | 0 (0.0%) | 0 (0.0%) |
| Total | 9 (90.0%) | 25 (64.1%) |
Income Below Poverty Among Married-Couple vs Single-Parent Households in Brockton
The poverty data for Brockton shows that 4 of the married-couple family households (19.1%) and 34 of the single-parent households (69.4%) are living below the poverty level. Within the married-couple family households, those with no children have the highest poverty rate, with 2 households (100.0%) falling below the poverty line. Among the single-parent households, those with 3 or 4 children have the highest poverty rate, with 14 household (100.0%) living below poverty.
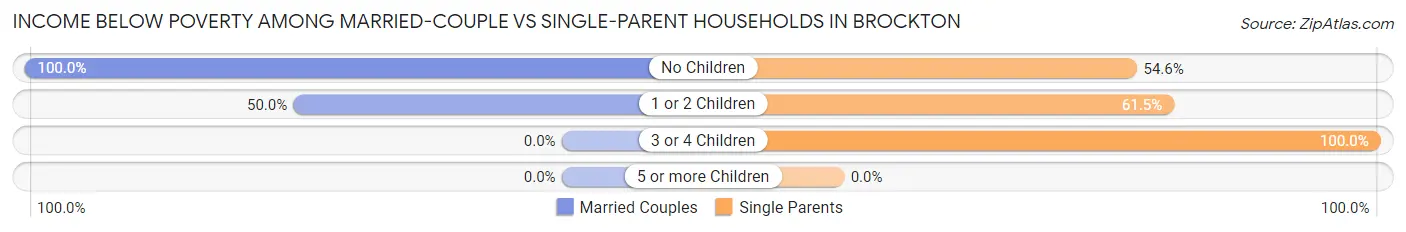
| Children | Married-Couple Families | Single-Parent Households |
| No Children | 2 (100.0%) | 12 (54.5%) |
| 1 or 2 Children | 2 (50.0%) | 8 (61.5%) |
| 3 or 4 Children | 0 (0.0%) | 14 (100.0%) |
| 5 or more Children | 0 (0.0%) | 0 (0.0%) |
| Total | 4 (19.1%) | 34 (69.4%) |
Race in Brockton
The most populous races in Brockton are Native / Alaskan (452 | 98.5%), and White / Caucasian (7 | 1.5%).
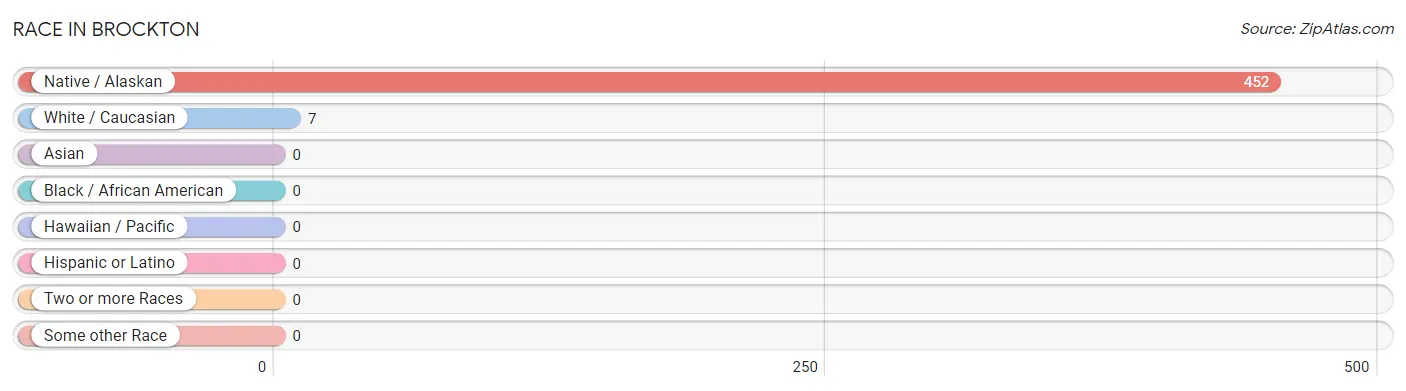
| Race | # Population | % Population |
| Asian | 0 | 0.0% |
| Black / African American | 0 | 0.0% |
| Hawaiian / Pacific | 0 | 0.0% |
| Hispanic or Latino | 0 | 0.0% |
| Native / Alaskan | 452 | 98.5% |
| White / Caucasian | 7 | 1.5% |
| Two or more Races | 0 | 0.0% |
| Some other Race | 0 | 0.0% |
| Total | 459 | 100.0% |
Ancestry in Brockton
The most populous ancestries reported in Brockton are Sioux (35 | 7.6%), Irish (4 | 0.9%), German (3 | 0.6%), and American (2 | 0.4%), together accounting for 9.6% of all Brockton residents.
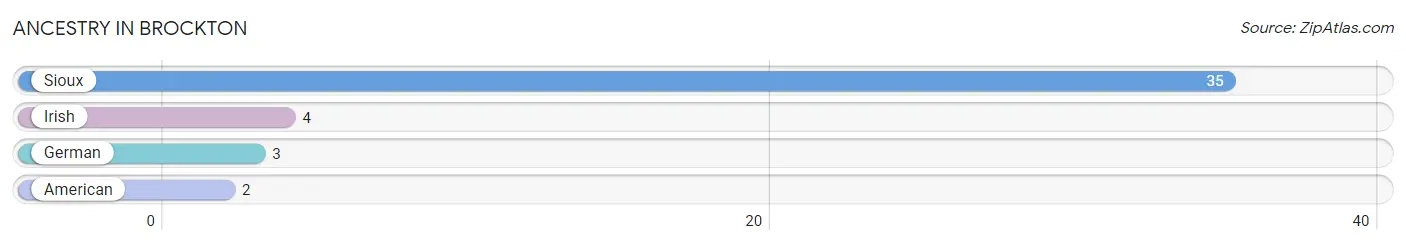
| Ancestry | # Population | % Population |
| American | 2 | 0.4% |
| German | 3 | 0.6% |
| Irish | 4 | 0.9% |
| Sioux | 35 | 7.6% | View All 4 Rows |
Immigrants in Brockton

| Immigration Origin | # Population | % Population | View All 0 Rows |
Sex and Age in Brockton
Sex and Age in Brockton
The most populous age groups in Brockton are 30 to 34 Years (48 | 18.2%) for men and Under 5 Years (26 | 13.3%) for women.
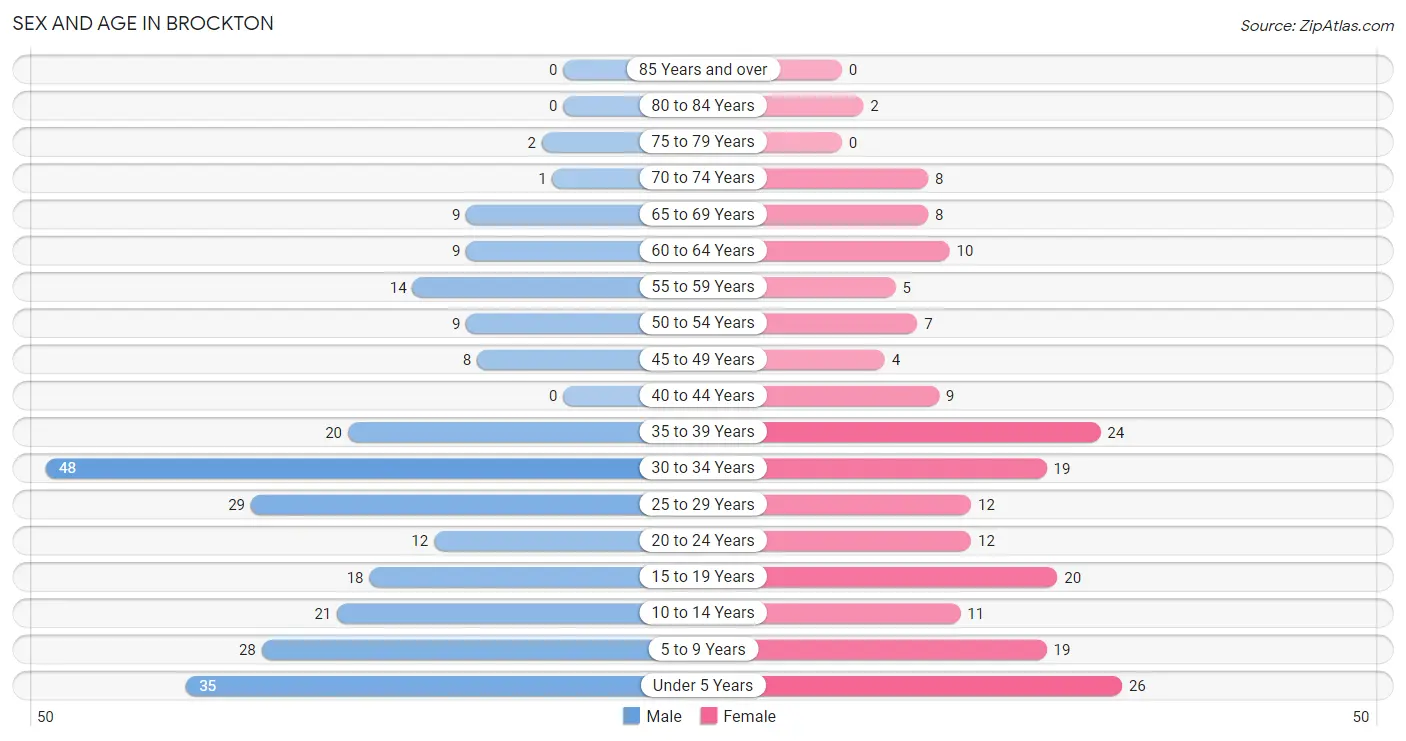
| Age Bracket | Male | Female |
| Under 5 Years | 35 (13.3%) | 26 (13.3%) |
| 5 to 9 Years | 28 (10.6%) | 19 (9.7%) |
| 10 to 14 Years | 21 (8.0%) | 11 (5.6%) |
| 15 to 19 Years | 18 (6.8%) | 20 (10.2%) |
| 20 to 24 Years | 12 (4.6%) | 12 (6.1%) |
| 25 to 29 Years | 29 (11.0%) | 12 (6.1%) |
| 30 to 34 Years | 48 (18.2%) | 19 (9.7%) |
| 35 to 39 Years | 20 (7.6%) | 24 (12.2%) |
| 40 to 44 Years | 0 (0.0%) | 9 (4.6%) |
| 45 to 49 Years | 8 (3.0%) | 4 (2.0%) |
| 50 to 54 Years | 9 (3.4%) | 7 (3.6%) |
| 55 to 59 Years | 14 (5.3%) | 5 (2.5%) |
| 60 to 64 Years | 9 (3.4%) | 10 (5.1%) |
| 65 to 69 Years | 9 (3.4%) | 8 (4.1%) |
| 70 to 74 Years | 1 (0.4%) | 8 (4.1%) |
| 75 to 79 Years | 2 (0.8%) | 0 (0.0%) |
| 80 to 84 Years | 0 (0.0%) | 2 (1.0%) |
| 85 Years and over | 0 (0.0%) | 0 (0.0%) |
| Total | 263 (100.0%) | 196 (100.0%) |
Families and Households in Brockton
Median Family Size in Brockton
The median family size in Brockton is 5.91 persons per family, with single female/mother families (39 | 55.7%) accounting for the largest median family size of 6.85 persons per family. On the other hand, married-couple families (21 | 30.0%) represent the smallest median family size with 4.71 persons per family.
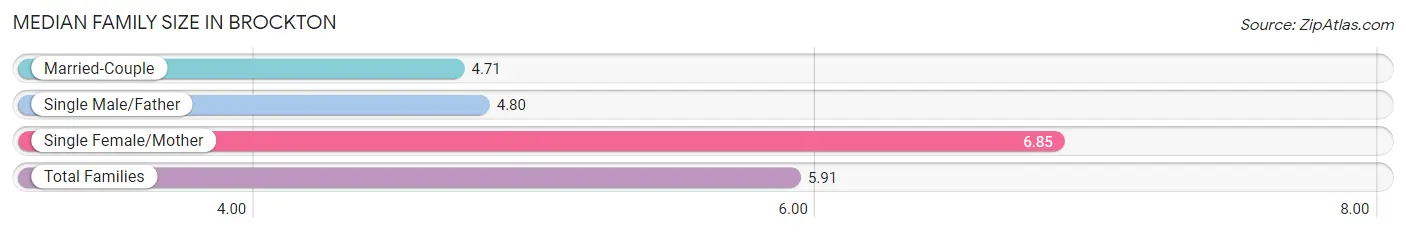
| Family Type | # Families | Family Size |
| Married-Couple | 21 (30.0%) | 4.71 |
| Single Male/Father | 10 (14.3%) | 4.80 |
| Single Female/Mother | 39 (55.7%) | 6.85 |
| Total Families | 70 (100.0%) | 5.91 |
Median Household Size in Brockton
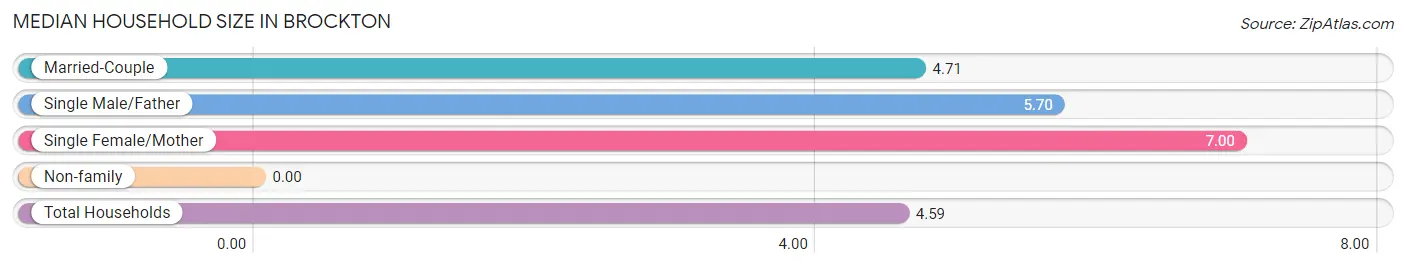
| Household Type | # Households | Household Size |
| Married-Couple | 21 (21.0%) | 4.71 |
| Single Male/Father | 10 (10.0%) | 5.70 |
| Single Female/Mother | 39 (39.0%) | 7.00 |
| Non-family | 30 (30.0%) | - |
| Total Households | 100 (100.0%) | 4.59 |
Household Size by Marriage Status in Brockton
Out of a total of 100 households in Brockton, 70 (70.0%) are family households, while 30 (30.0%) are nonfamily households. The most numerous type of family households are 2-person households, comprising 24, and the most common type of nonfamily households are 1-person households, comprising 30.
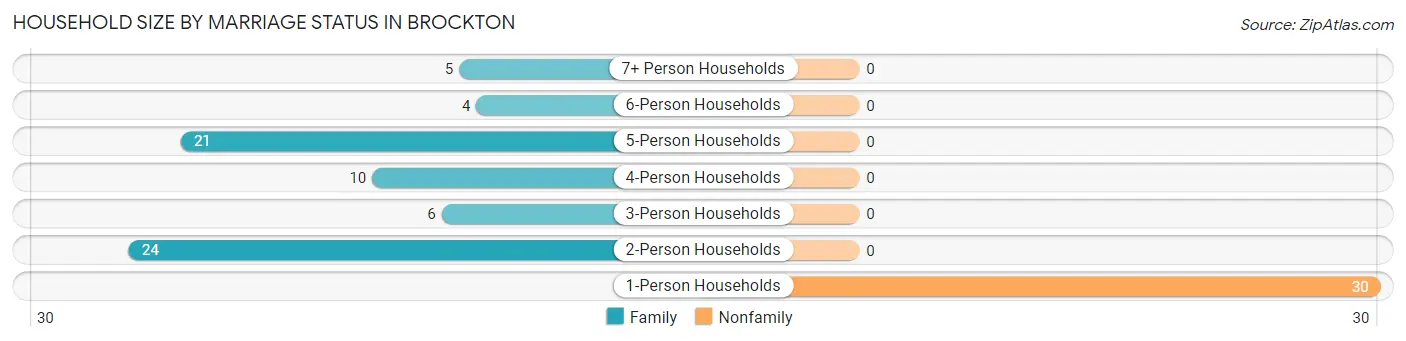
| Household Size | Family Households | Nonfamily Households |
| 1-Person Households | - | 30 (30.0%) |
| 2-Person Households | 24 (24.0%) | 0 (0.0%) |
| 3-Person Households | 6 (6.0%) | 0 (0.0%) |
| 4-Person Households | 10 (10.0%) | 0 (0.0%) |
| 5-Person Households | 21 (21.0%) | 0 (0.0%) |
| 6-Person Households | 4 (4.0%) | 0 (0.0%) |
| 7+ Person Households | 5 (5.0%) | 0 (0.0%) |
| Total | 70 (70.0%) | 30 (30.0%) |
Female Fertility in Brockton
Fertility by Age in Brockton
Average fertility rate in Brockton is 58.0 births per 1,000 women. Women in the age bracket of 20 to 34 years have the highest fertility rate with 140.0 births per 1,000 women. Women in the age bracket of 20 to 34 years acount for 100.0% of all women with births.
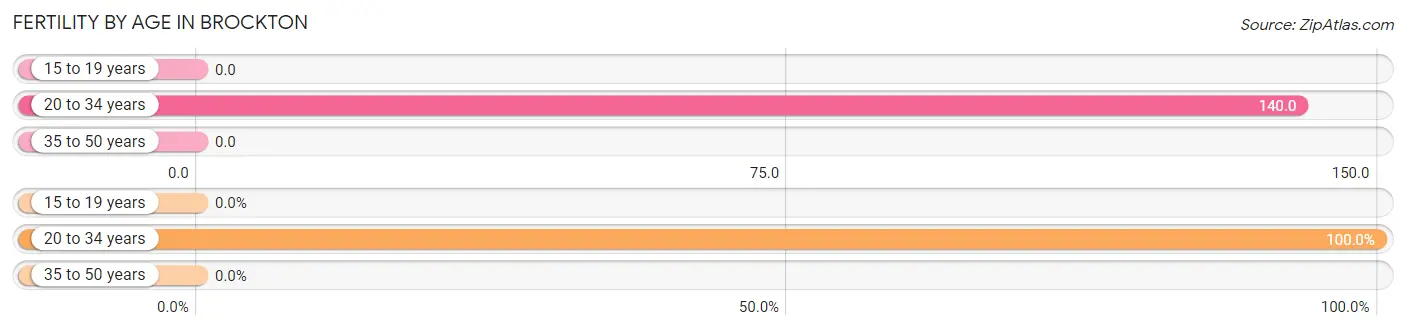
| Age Bracket | Women with Births | Births / 1,000 Women |
| 15 to 19 years | 0 (0.0%) | 0.0 |
| 20 to 34 years | 6 (100.0%) | 140.0 |
| 35 to 50 years | 0 (0.0%) | 0.0 |
| Total | 6 (100.0%) | 58.0 |
Fertility by Age by Marriage Status in Brockton
50.0% of women with births (6) in Brockton are married. The highest percentage of unmarried women with births falls into 20 to 34 years age bracket with 50.0% of them unmarried at the time of birth, while the lowest percentage of unmarried women with births belong to 20 to 34 years age bracket with 50.0% of them unmarried.
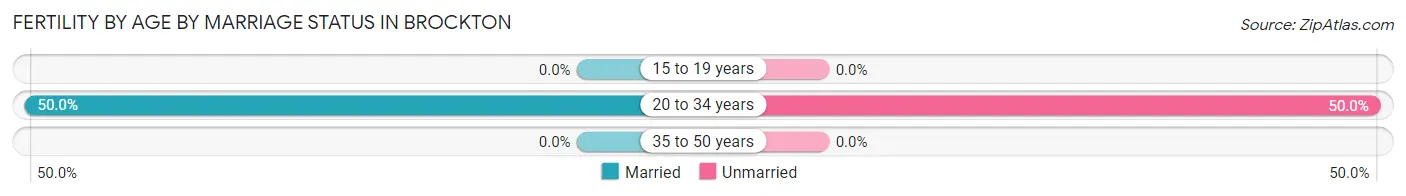
| Age Bracket | Married | Unmarried |
| 15 to 19 years | 0 (0.0%) | 0 (0.0%) |
| 20 to 34 years | 3 (50.0%) | 3 (50.0%) |
| 35 to 50 years | 0 (0.0%) | 0 (0.0%) |
| Total | 3 (50.0%) | 3 (50.0%) |
Fertility by Education in Brockton
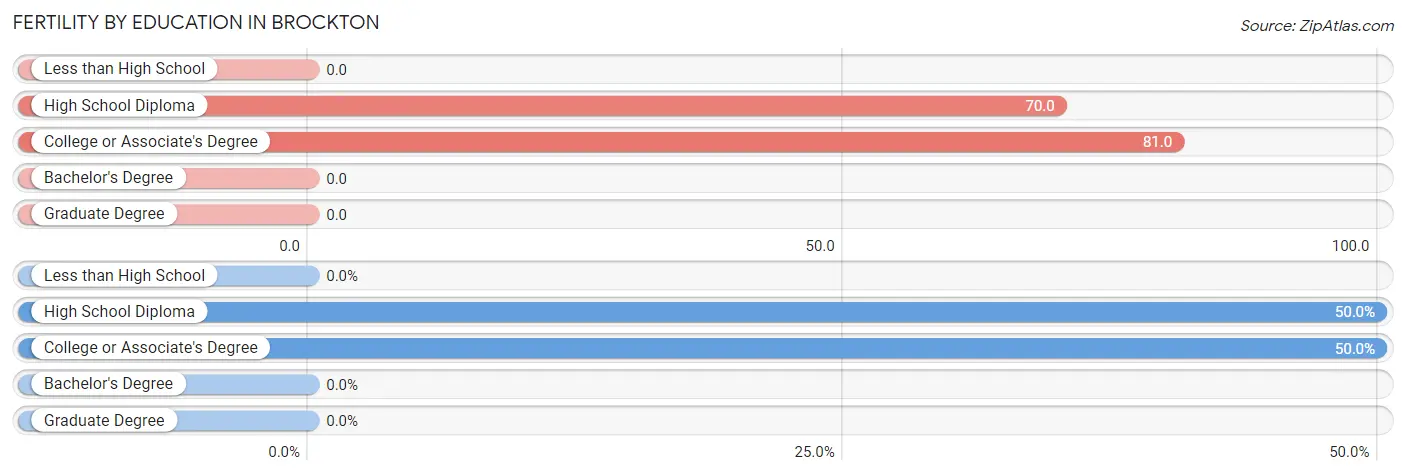
| Educational Attainment | Women with Births | Births / 1,000 Women |
| Less than High School | 0 (0.0%) | 0.0 |
| High School Diploma | 3 (50.0%) | 70.0 |
| College or Associate's Degree | 3 (50.0%) | 81.0 |
| Bachelor's Degree | 0 (0.0%) | 0.0 |
| Graduate Degree | 0 (0.0%) | 0.0 |
| Total | 6 (100.0%) | 58.0 |
Fertility by Education by Marriage Status in Brockton
50.0% of women with births in Brockton are unmarried. Women with the educational attainment of high school diploma are most likely to be married with 100.0% of them married at childbirth, while women with the educational attainment of college or associate's degree are least likely to be married with 100.0% of them unmarried at childbirth.
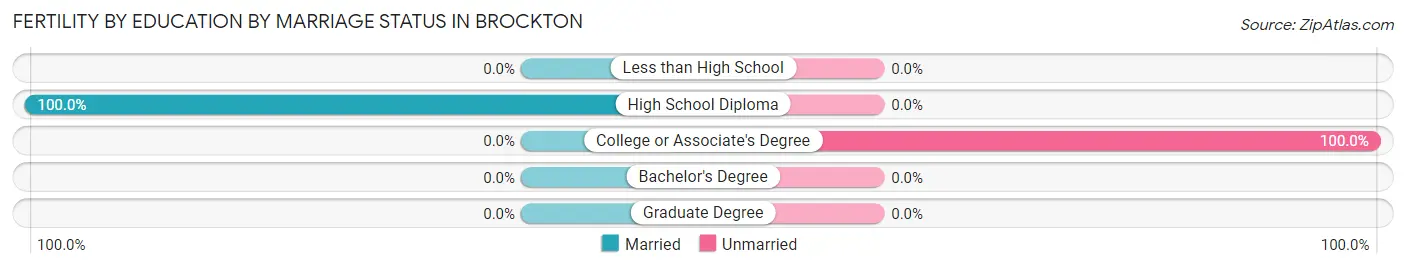
| Educational Attainment | Married | Unmarried |
| Less than High School | 0 (0.0%) | 0 (0.0%) |
| High School Diploma | 3 (100.0%) | 0 (0.0%) |
| College or Associate's Degree | 0 (0.0%) | 3 (100.0%) |
| Bachelor's Degree | 0 (0.0%) | 0 (0.0%) |
| Graduate Degree | 0 (0.0%) | 0 (0.0%) |
| Total | 3 (50.0%) | 3 (50.0%) |
Employment Characteristics in Brockton
Employment by Class of Employer in Brockton
Among the 96 employed individuals in Brockton, private company employees (28 | 29.2%), local government employees (26 | 27.1%), and federal government employees (26 | 27.1%) make up the most common classes of employment.
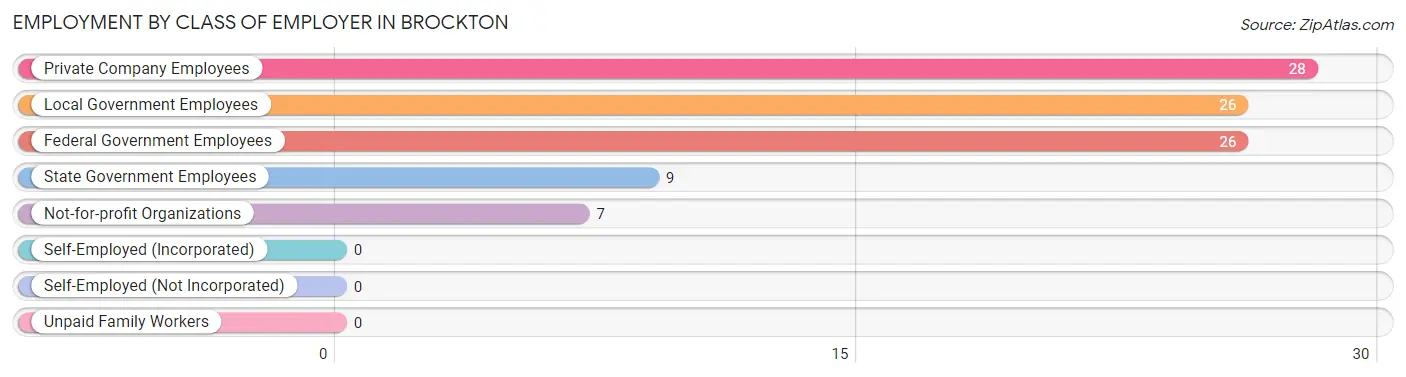
| Employer Class | # Employees | % Employees |
| Private Company Employees | 28 | 29.2% |
| Self-Employed (Incorporated) | 0 | 0.0% |
| Self-Employed (Not Incorporated) | 0 | 0.0% |
| Not-for-profit Organizations | 7 | 7.3% |
| Local Government Employees | 26 | 27.1% |
| State Government Employees | 9 | 9.4% |
| Federal Government Employees | 26 | 27.1% |
| Unpaid Family Workers | 0 | 0.0% |
| Total | 96 | 100.0% |
Employment Status by Age in Brockton
According to the labor force statistics for Brockton, out of the total population over 16 years of age (303), 32.0% or 97 individuals are in the labor force, with 1.0% or 1 of them unemployed. The age group with the highest labor force participation rate is 55 to 59 years, with 73.7% or 14 individuals in the labor force. Within the labor force, the 35 to 44 years age range has the highest percentage of unemployed individuals, with 6.7% or 1 of them being unemployed.
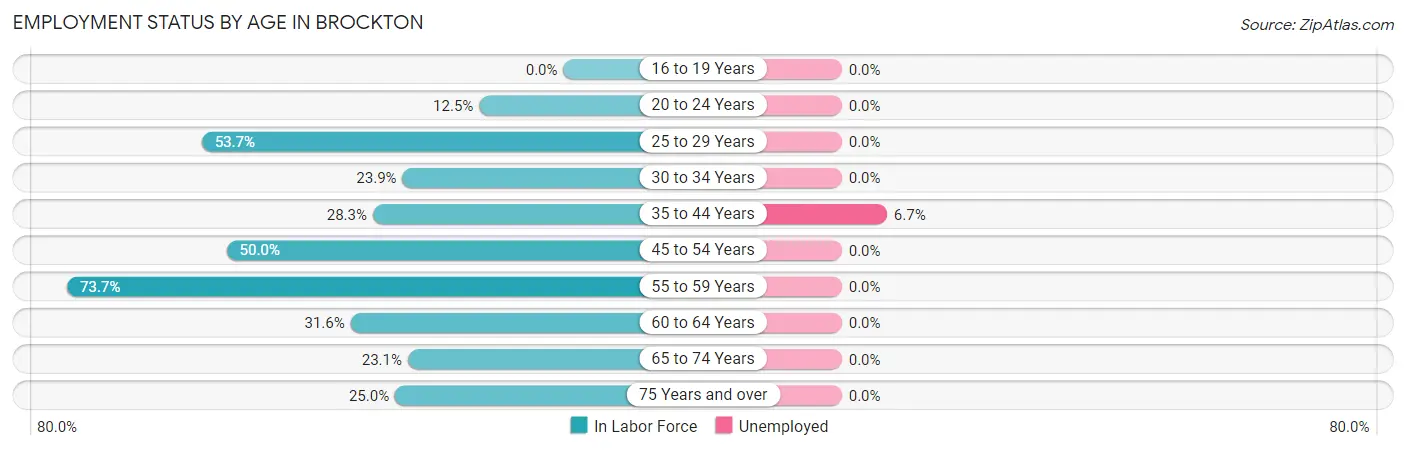
| Age Bracket | In Labor Force | Unemployed |
| 16 to 19 Years | 0 (0.0%) | 0 (0.0%) |
| 20 to 24 Years | 3 (12.5%) | 0 (0.0%) |
| 25 to 29 Years | 22 (53.7%) | 0 (0.0%) |
| 30 to 34 Years | 16 (23.9%) | 0 (0.0%) |
| 35 to 44 Years | 15 (28.3%) | 1 (6.7%) |
| 45 to 54 Years | 14 (50.0%) | 0 (0.0%) |
| 55 to 59 Years | 14 (73.7%) | 0 (0.0%) |
| 60 to 64 Years | 6 (31.6%) | 0 (0.0%) |
| 65 to 74 Years | 6 (23.1%) | 0 (0.0%) |
| 75 Years and over | 1 (25.0%) | 0 (0.0%) |
| Total | 97 (32.0%) | 1 (1.0%) |
Employment Status by Educational Attainment in Brockton
According to labor force statistics for Brockton, 38.3% of individuals (87) out of the total population between 25 and 64 years of age (227) are in the labor force, with 1.1% or 1 of them being unemployed. The group with the highest labor force participation rate are those with the educational attainment of college / associate degree, with 76.4% or 55 individuals in the labor force. Within the labor force, individuals with college / associate degree education have the highest percentage of unemployment, with 1.8% or 1 of them being unemployed.
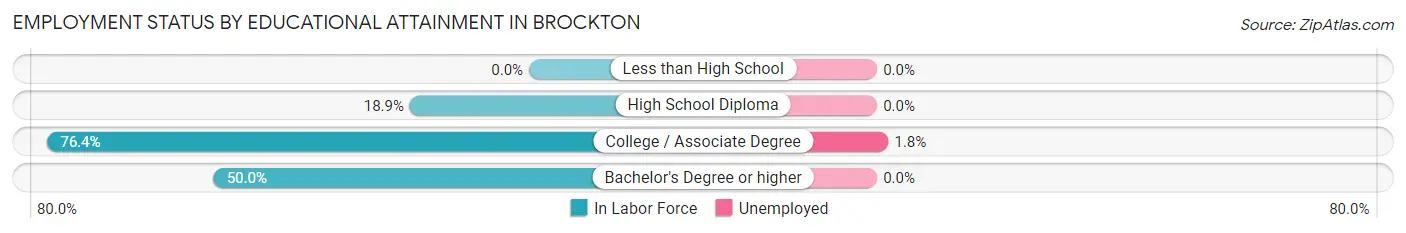
| Educational Attainment | In Labor Force | Unemployed |
| Less than High School | 0 (0.0%) | 0 (0.0%) |
| High School Diploma | 25 (18.9%) | 0 (0.0%) |
| College / Associate Degree | 55 (76.4%) | 1 (1.8%) |
| Bachelor's Degree or higher | 7 (50.0%) | 0 (0.0%) |
| Total | 87 (38.3%) | 2 (1.1%) |
Employment Occupations by Sex in Brockton
Management, Business, Science and Arts Occupations
The most common Management, Business, Science and Arts occupations in Brockton are Management (21 | 21.9%), Community & Social Service (12 | 12.5%), Education Instruction & Library (12 | 12.5%), Business & Financial (5 | 5.2%), and Computers, Engineering & Science (2 | 2.1%).
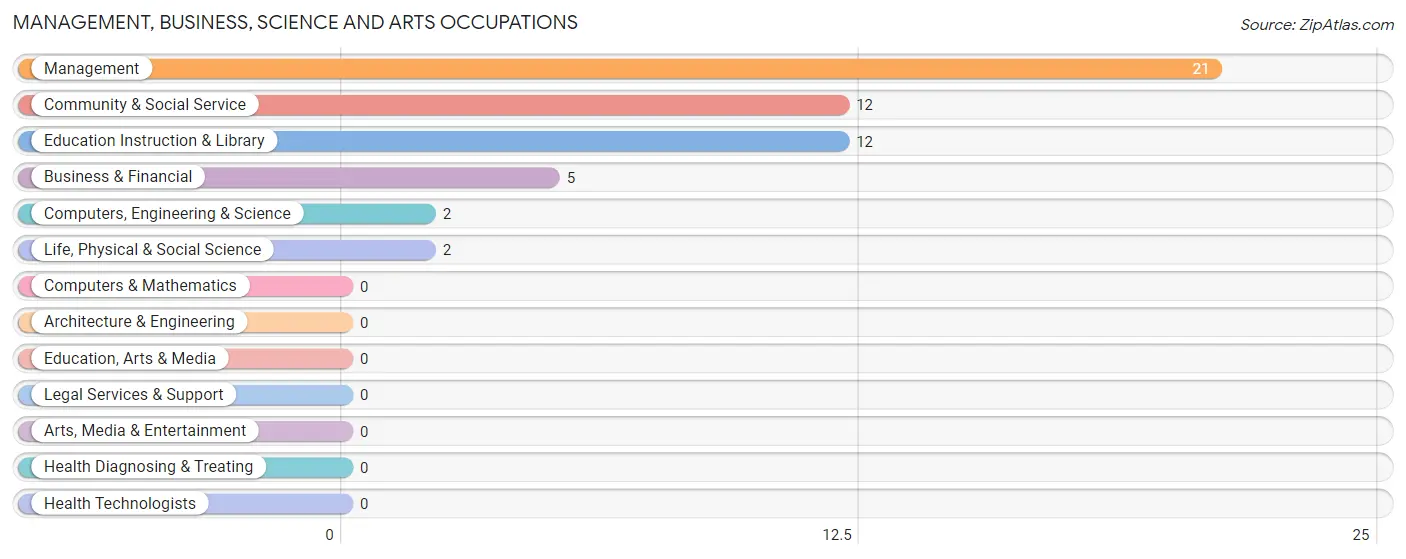
Management, Business, Science and Arts Occupations by Sex
Within the Management, Business, Science and Arts occupations in Brockton, the most male-oriented occupations are Business & Financial (100.0%), and Management (4.8%), while the most female-oriented occupations are Computers, Engineering & Science (100.0%), Life, Physical & Social Science (100.0%), and Community & Social Service (100.0%).
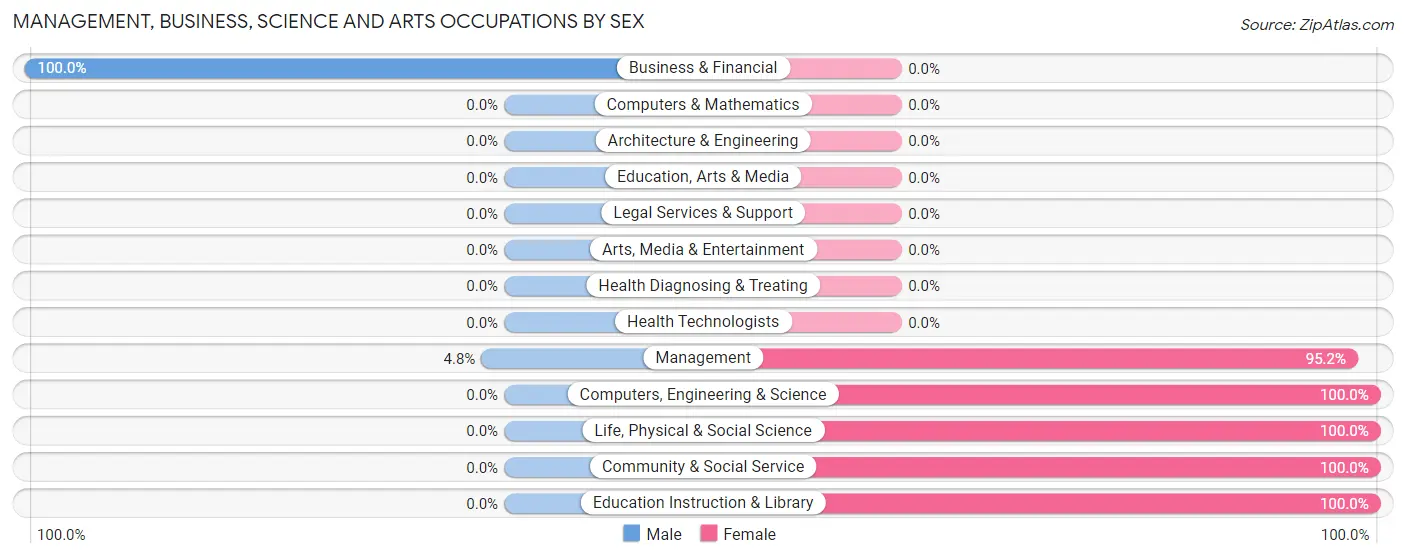
| Occupation | Male | Female |
| Management | 1 (4.8%) | 20 (95.2%) |
| Business & Financial | 5 (100.0%) | 0 (0.0%) |
| Computers, Engineering & Science | 0 (0.0%) | 2 (100.0%) |
| Computers & Mathematics | 0 (0.0%) | 0 (0.0%) |
| Architecture & Engineering | 0 (0.0%) | 0 (0.0%) |
| Life, Physical & Social Science | 0 (0.0%) | 2 (100.0%) |
| Community & Social Service | 0 (0.0%) | 12 (100.0%) |
| Education, Arts & Media | 0 (0.0%) | 0 (0.0%) |
| Legal Services & Support | 0 (0.0%) | 0 (0.0%) |
| Education Instruction & Library | 0 (0.0%) | 12 (100.0%) |
| Arts, Media & Entertainment | 0 (0.0%) | 0 (0.0%) |
| Health Diagnosing & Treating | 0 (0.0%) | 0 (0.0%) |
| Health Technologists | 0 (0.0%) | 0 (0.0%) |
| Total (Category) | 6 (15.0%) | 34 (85.0%) |
| Total (Overall) | 42 (43.8%) | 54 (56.2%) |
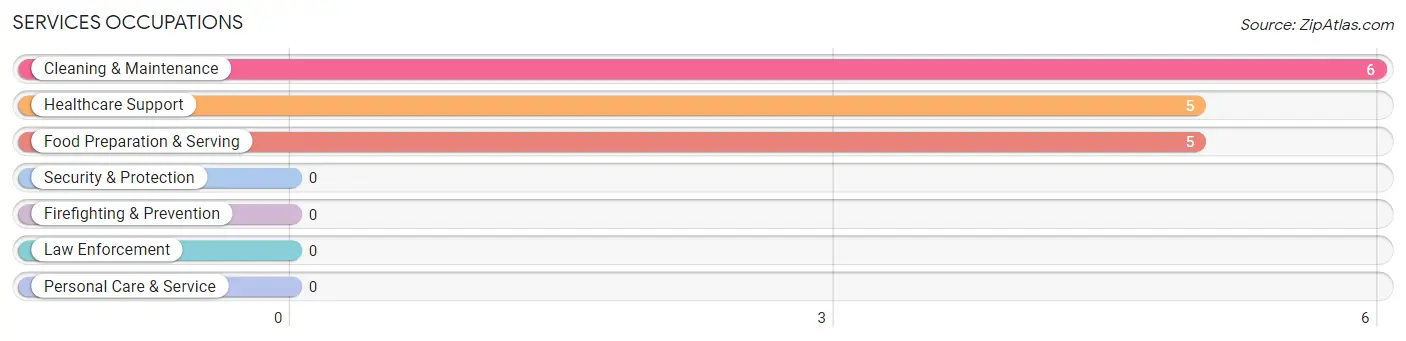
Services Occupations
The most common Services occupations in Brockton are Cleaning & Maintenance (6 | 6.2%), Healthcare Support (5 | 5.2%), and Food Preparation & Serving (5 | 5.2%).
Services Occupations by Sex
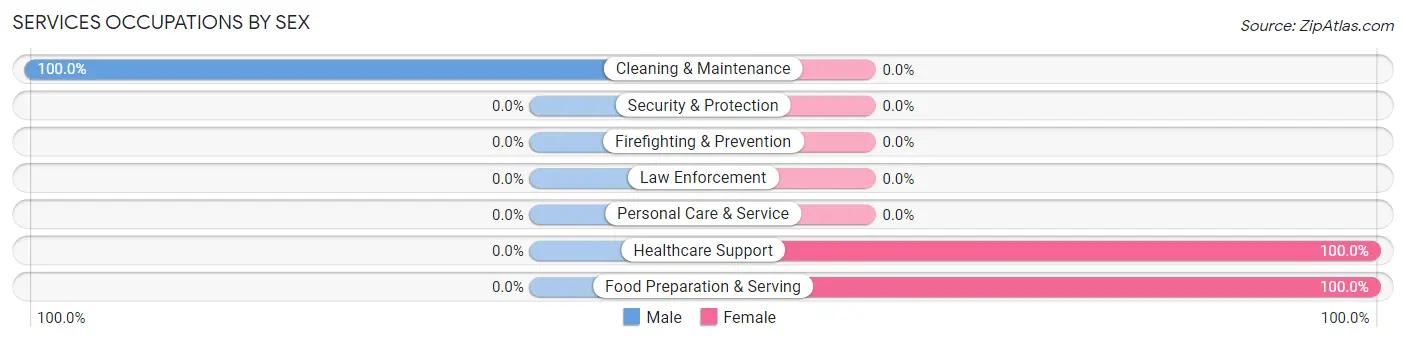
| Occupation | Male | Female |
| Healthcare Support | 0 (0.0%) | 5 (100.0%) |
| Security & Protection | 0 (0.0%) | 0 (0.0%) |
| Firefighting & Prevention | 0 (0.0%) | 0 (0.0%) |
| Law Enforcement | 0 (0.0%) | 0 (0.0%) |
| Food Preparation & Serving | 0 (0.0%) | 5 (100.0%) |
| Cleaning & Maintenance | 6 (100.0%) | 0 (0.0%) |
| Personal Care & Service | 0 (0.0%) | 0 (0.0%) |
| Total (Category) | 6 (37.5%) | 10 (62.5%) |
| Total (Overall) | 42 (43.8%) | 54 (56.2%) |
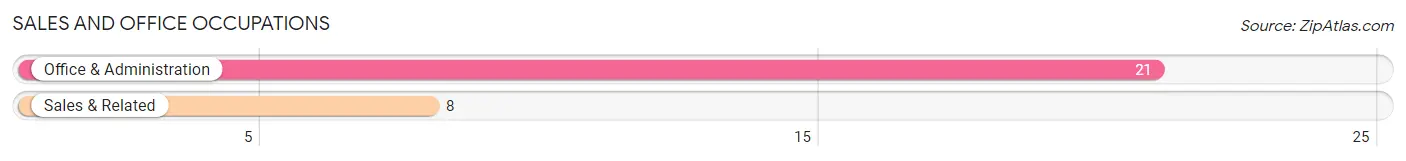
Sales and Office Occupations
The most common Sales and Office occupations in Brockton are Office & Administration (21 | 21.9%), and Sales & Related (8 | 8.3%).
Sales and Office Occupations by Sex
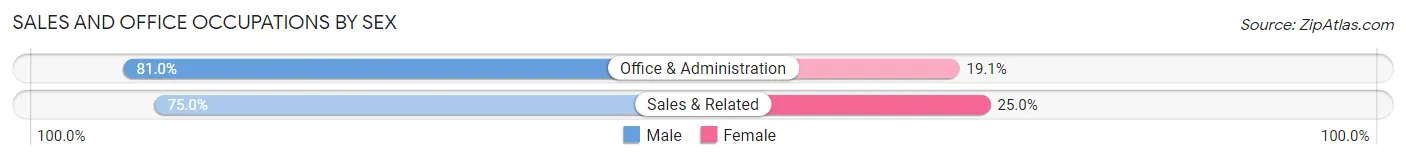
| Occupation | Male | Female |
| Sales & Related | 6 (75.0%) | 2 (25.0%) |
| Office & Administration | 17 (80.9%) | 4 (19.1%) |
| Total (Category) | 23 (79.3%) | 6 (20.7%) |
| Total (Overall) | 42 (43.8%) | 54 (56.2%) |
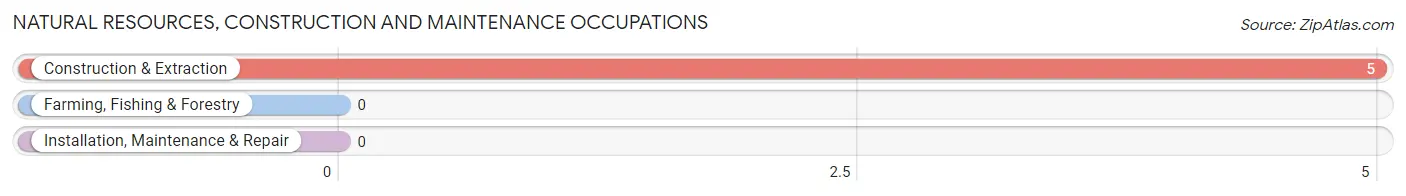
Natural Resources, Construction and Maintenance Occupations
The most common Natural Resources, Construction and Maintenance occupations in Brockton are , and Construction & Extraction (5 | 5.2%).
Natural Resources, Construction and Maintenance Occupations by Sex
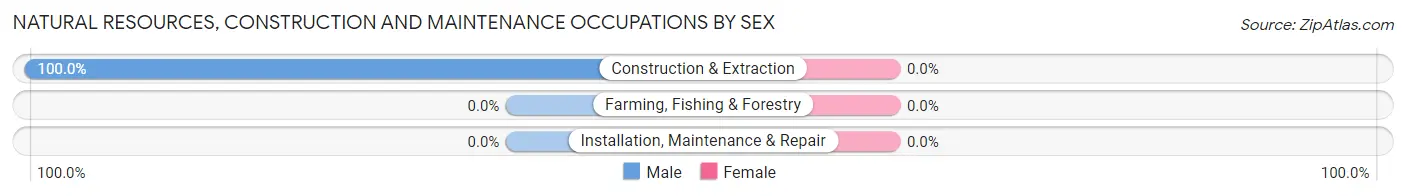
| Occupation | Male | Female |
| Farming, Fishing & Forestry | 0 (0.0%) | 0 (0.0%) |
| Construction & Extraction | 5 (100.0%) | 0 (0.0%) |
| Installation, Maintenance & Repair | 0 (0.0%) | 0 (0.0%) |
| Total (Category) | 5 (100.0%) | 0 (0.0%) |
| Total (Overall) | 42 (43.8%) | 54 (56.2%) |
Production, Transportation and Moving Occupations
The most common Production, Transportation and Moving occupations in Brockton are Material Moving (4 | 4.2%), and Transportation (2 | 2.1%).
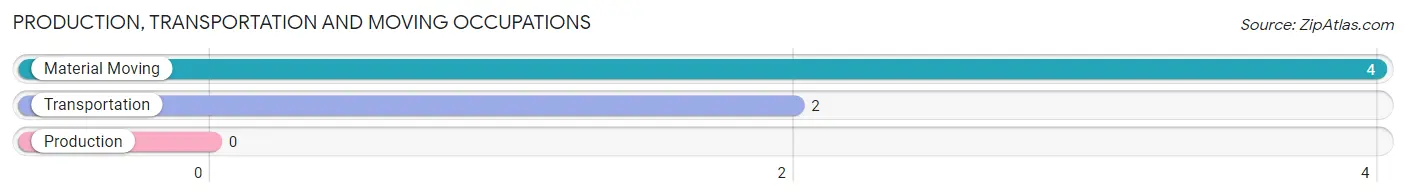
Production, Transportation and Moving Occupations by Sex
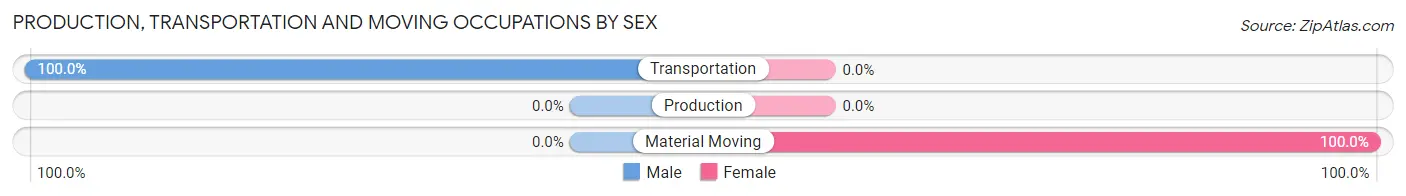
| Occupation | Male | Female |
| Production | 0 (0.0%) | 0 (0.0%) |
| Transportation | 2 (100.0%) | 0 (0.0%) |
| Material Moving | 0 (0.0%) | 4 (100.0%) |
| Total (Category) | 2 (33.3%) | 4 (66.7%) |
| Total (Overall) | 42 (43.8%) | 54 (56.2%) |
Employment Industries by Sex in Brockton
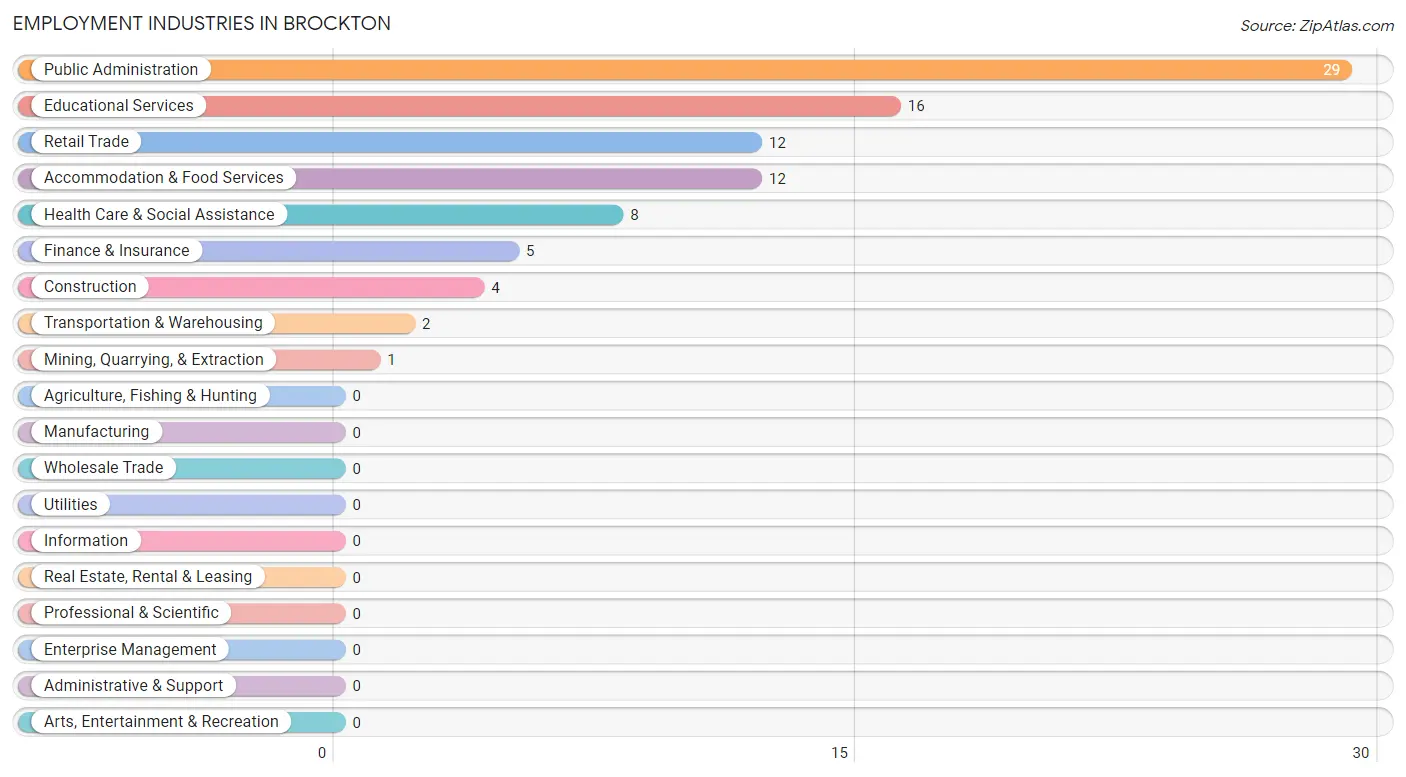
Employment Industries in Brockton
The major employment industries in Brockton include Public Administration (29 | 30.2%), Educational Services (16 | 16.7%), Retail Trade (12 | 12.5%), Accommodation & Food Services (12 | 12.5%), and Health Care & Social Assistance (8 | 8.3%).
Employment Industries by Sex in Brockton
The Brockton industries that see more men than women are Mining, Quarrying, & Extraction (100.0%), Construction (100.0%), and Transportation & Warehousing (100.0%), whereas the industries that tend to have a higher number of women are Health Care & Social Assistance (100.0%), Accommodation & Food Services (100.0%), and Educational Services (81.2%).
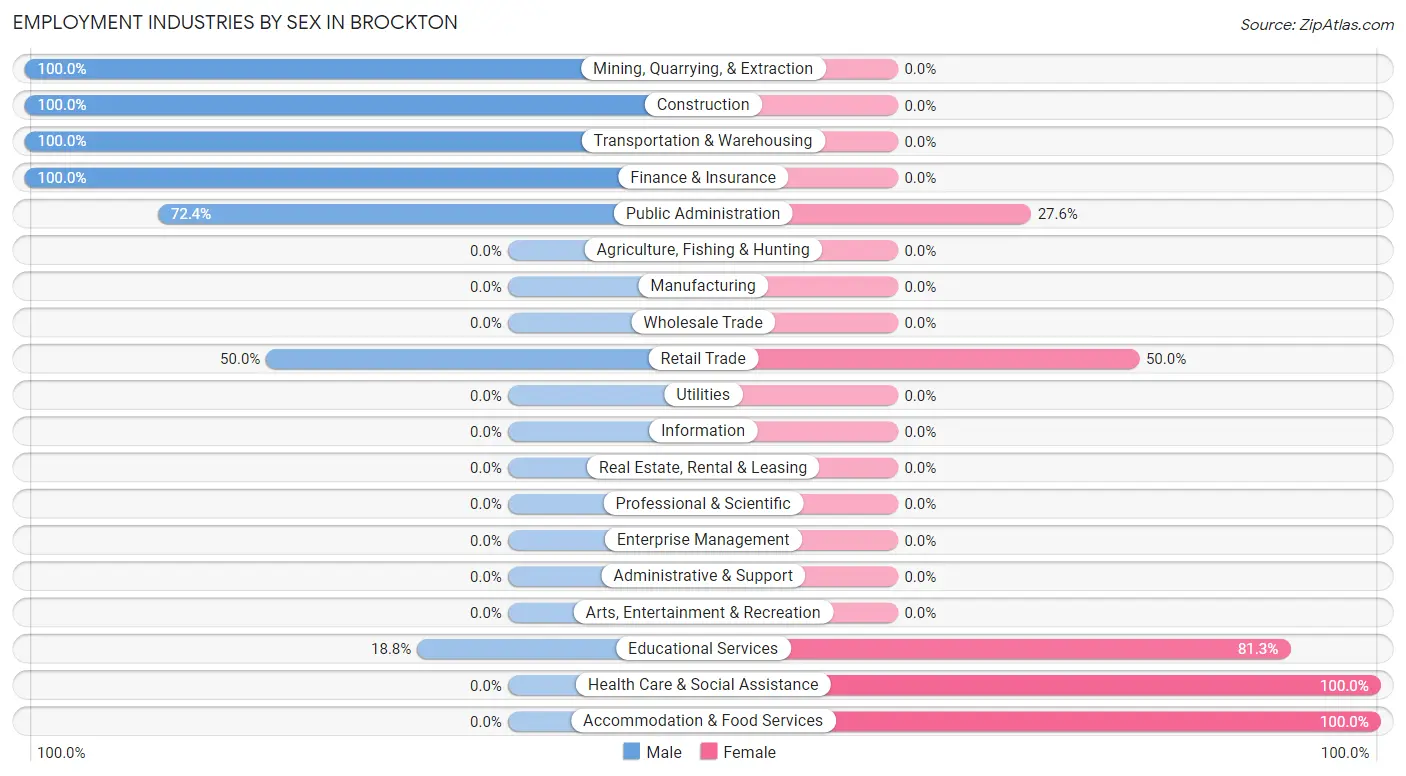
| Industry | Male | Female |
| Agriculture, Fishing & Hunting | 0 (0.0%) | 0 (0.0%) |
| Mining, Quarrying, & Extraction | 1 (100.0%) | 0 (0.0%) |
| Construction | 4 (100.0%) | 0 (0.0%) |
| Manufacturing | 0 (0.0%) | 0 (0.0%) |
| Wholesale Trade | 0 (0.0%) | 0 (0.0%) |
| Retail Trade | 6 (50.0%) | 6 (50.0%) |
| Transportation & Warehousing | 2 (100.0%) | 0 (0.0%) |
| Utilities | 0 (0.0%) | 0 (0.0%) |
| Information | 0 (0.0%) | 0 (0.0%) |
| Finance & Insurance | 5 (100.0%) | 0 (0.0%) |
| Real Estate, Rental & Leasing | 0 (0.0%) | 0 (0.0%) |
| Professional & Scientific | 0 (0.0%) | 0 (0.0%) |
| Enterprise Management | 0 (0.0%) | 0 (0.0%) |
| Administrative & Support | 0 (0.0%) | 0 (0.0%) |
| Educational Services | 3 (18.8%) | 13 (81.2%) |
| Health Care & Social Assistance | 0 (0.0%) | 8 (100.0%) |
| Arts, Entertainment & Recreation | 0 (0.0%) | 0 (0.0%) |
| Accommodation & Food Services | 0 (0.0%) | 12 (100.0%) |
| Public Administration | 21 (72.4%) | 8 (27.6%) |
| Total | 42 (43.8%) | 54 (56.2%) |
Education in Brockton
School Enrollment in Brockton
The most common levels of schooling among the 136 students in Brockton are high school (42 | 30.9%), elementary school (32 | 23.5%), and middle school (24 | 17.6%).
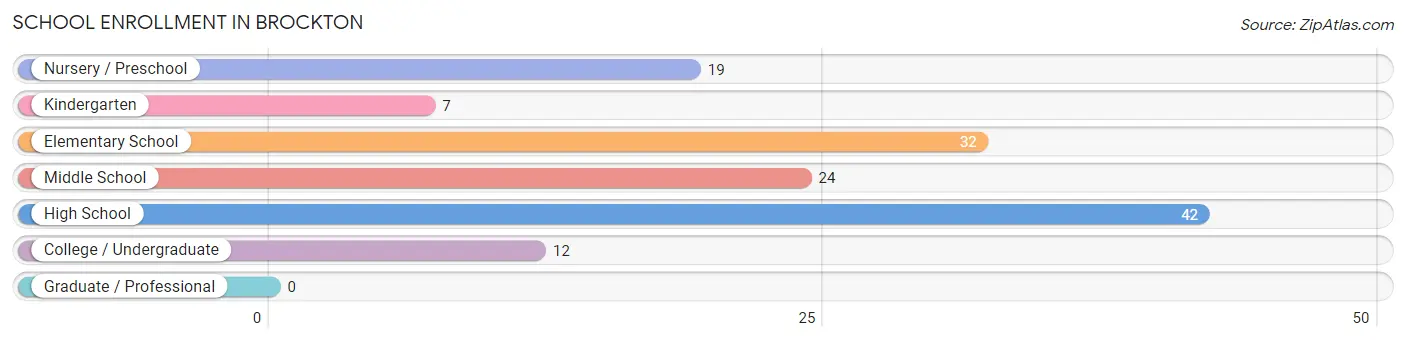
| School Level | # Students | % Students |
| Nursery / Preschool | 19 | 14.0% |
| Kindergarten | 7 | 5.1% |
| Elementary School | 32 | 23.5% |
| Middle School | 24 | 17.6% |
| High School | 42 | 30.9% |
| College / Undergraduate | 12 | 8.8% |
| Graduate / Professional | 0 | 0.0% |
| Total | 136 | 100.0% |
School Enrollment by Age by Funding Source in Brockton
Out of a total of 136 students who are enrolled in schools in Brockton, 3 (2.2%) attend a private institution, while the remaining 133 (97.8%) are enrolled in public schools. The age group of 5 to 9 year old has the highest likelihood of being enrolled in private schools, with 3 (7.9% in the age bracket) enrolled. Conversely, the age group of 3 to 4 year olds has the lowest likelihood of being enrolled in a private school, with 16 (100.0% in the age bracket) attending a public institution.
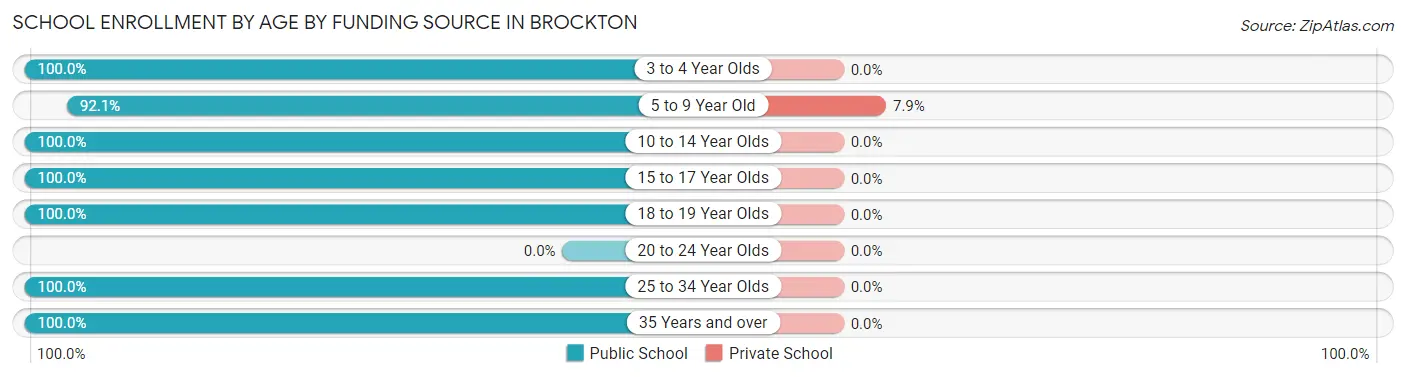
| Age Bracket | Public School | Private School |
| 3 to 4 Year Olds | 16 (100.0%) | 0 (0.0%) |
| 5 to 9 Year Old | 35 (92.1%) | 3 (7.9%) |
| 10 to 14 Year Olds | 32 (100.0%) | 0 (0.0%) |
| 15 to 17 Year Olds | 21 (100.0%) | 0 (0.0%) |
| 18 to 19 Year Olds | 17 (100.0%) | 0 (0.0%) |
| 20 to 24 Year Olds | 0 (0.0%) | 0 (0.0%) |
| 25 to 34 Year Olds | 6 (100.0%) | 0 (0.0%) |
| 35 Years and over | 6 (100.0%) | 0 (0.0%) |
| Total | 133 (97.8%) | 3 (2.2%) |
Educational Attainment by Field of Study in Brockton
Liberal arts & history (7 | 50.0%), business (5 | 35.7%), and bio, nature & agricultural (2 | 14.3%) are the most common fields of study among 14 individuals in Brockton who have obtained a bachelor's degree or higher.
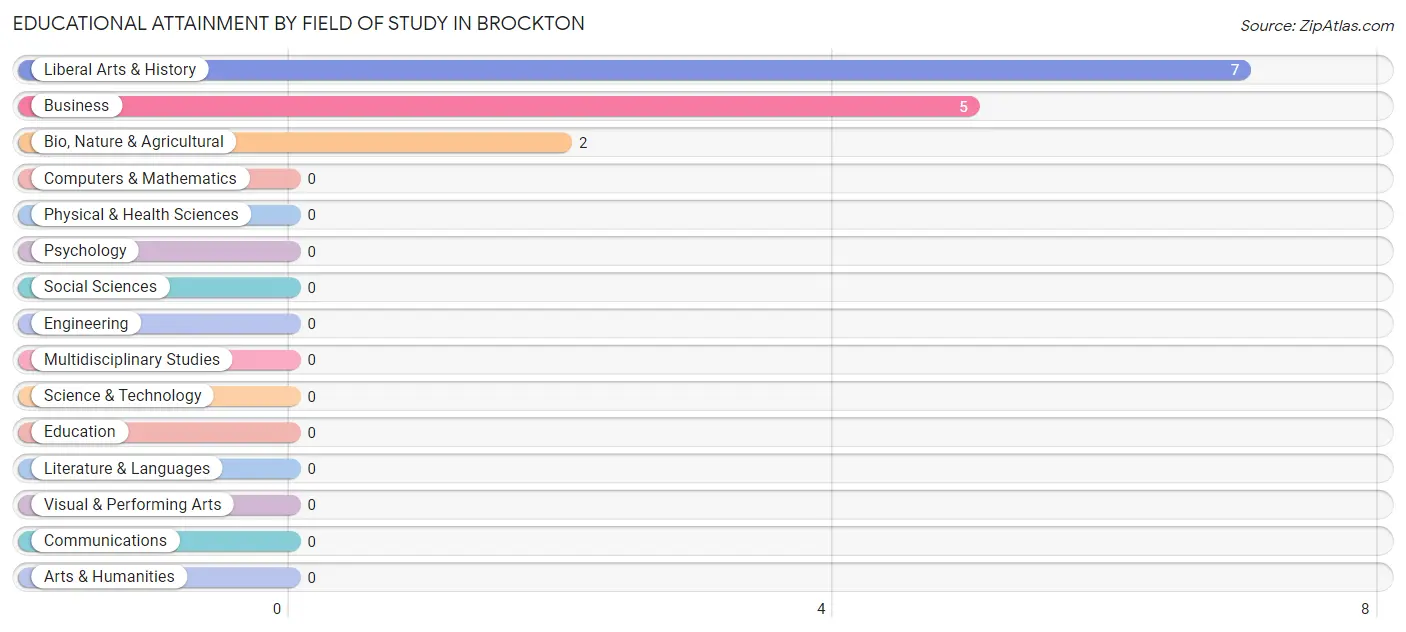
| Field of Study | # Graduates | % Graduates |
| Computers & Mathematics | 0 | 0.0% |
| Bio, Nature & Agricultural | 2 | 14.3% |
| Physical & Health Sciences | 0 | 0.0% |
| Psychology | 0 | 0.0% |
| Social Sciences | 0 | 0.0% |
| Engineering | 0 | 0.0% |
| Multidisciplinary Studies | 0 | 0.0% |
| Science & Technology | 0 | 0.0% |
| Business | 5 | 35.7% |
| Education | 0 | 0.0% |
| Literature & Languages | 0 | 0.0% |
| Liberal Arts & History | 7 | 50.0% |
| Visual & Performing Arts | 0 | 0.0% |
| Communications | 0 | 0.0% |
| Arts & Humanities | 0 | 0.0% |
| Total | 14 | 100.0% |
Transportation & Commute in Brockton
Vehicle Availability by Sex in Brockton
The most prevalent vehicle ownership categories in Brockton are males with 2 vehicles (25, accounting for 59.5%) and females with 2 vehicles (16, making up 46.3%).
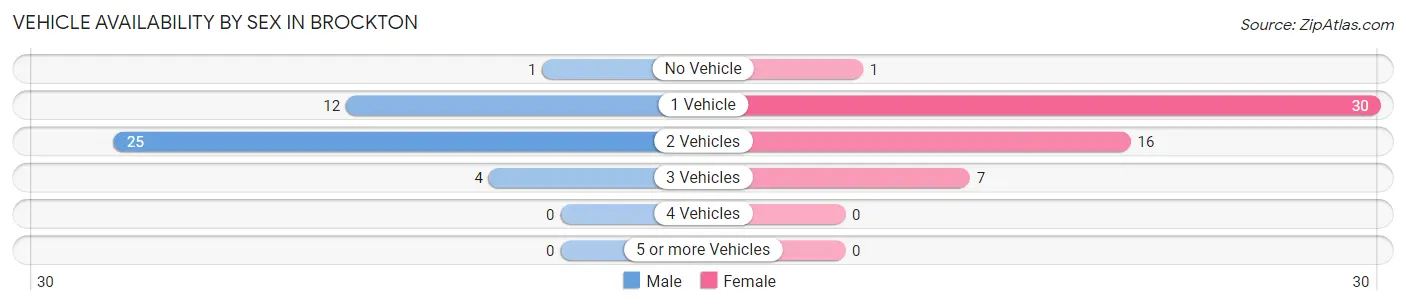
| Vehicles Available | Male | Female |
| No Vehicle | 1 (2.4%) | 1 (1.8%) |
| 1 Vehicle | 12 (28.6%) | 30 (55.6%) |
| 2 Vehicles | 25 (59.5%) | 16 (29.6%) |
| 3 Vehicles | 4 (9.5%) | 7 (13.0%) |
| 4 Vehicles | 0 (0.0%) | 0 (0.0%) |
| 5 or more Vehicles | 0 (0.0%) | 0 (0.0%) |
| Total | 42 (100.0%) | 54 (100.0%) |
Commute Time in Brockton
The most frequently occuring commute durations in Brockton are 30 to 34 minutes (34 commuters, 35.4%), 20 to 24 minutes (16 commuters, 16.7%), and 5 to 9 minutes (14 commuters, 14.6%).
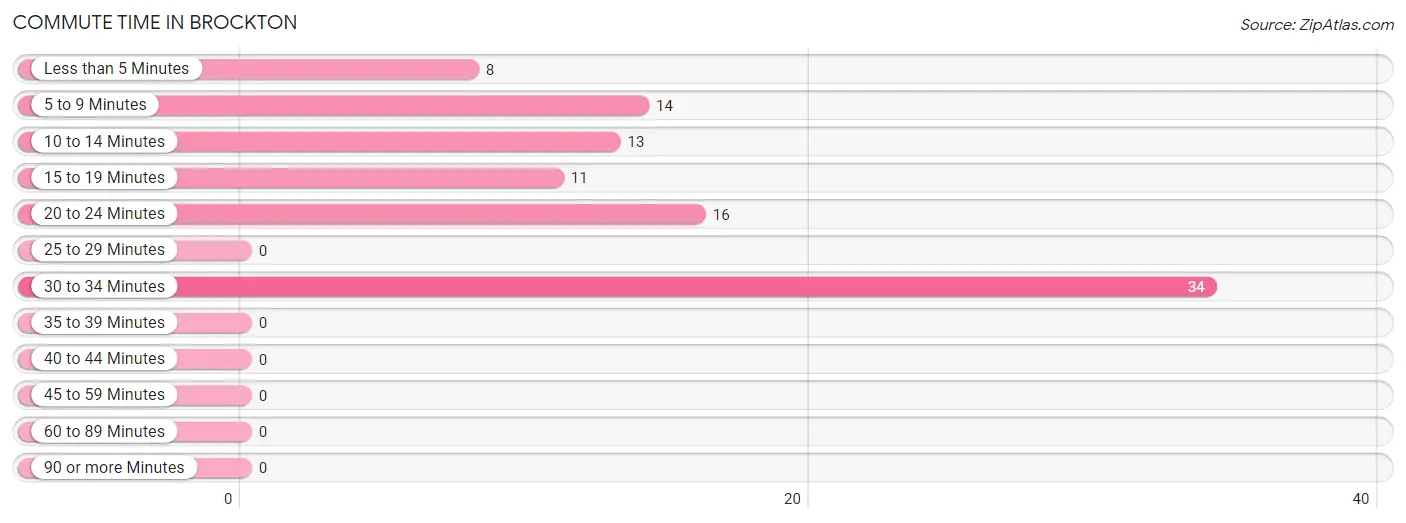
| Commute Time | # Commuters | % Commuters |
| Less than 5 Minutes | 8 | 8.3% |
| 5 to 9 Minutes | 14 | 14.6% |
| 10 to 14 Minutes | 13 | 13.5% |
| 15 to 19 Minutes | 11 | 11.5% |
| 20 to 24 Minutes | 16 | 16.7% |
| 25 to 29 Minutes | 0 | 0.0% |
| 30 to 34 Minutes | 34 | 35.4% |
| 35 to 39 Minutes | 0 | 0.0% |
| 40 to 44 Minutes | 0 | 0.0% |
| 45 to 59 Minutes | 0 | 0.0% |
| 60 to 89 Minutes | 0 | 0.0% |
| 90 or more Minutes | 0 | 0.0% |
Commute Time by Sex in Brockton
The most common commute times in Brockton are 30 to 34 minutes (27 commuters, 64.3%) for males and 20 to 24 minutes (16 commuters, 29.6%) for females.
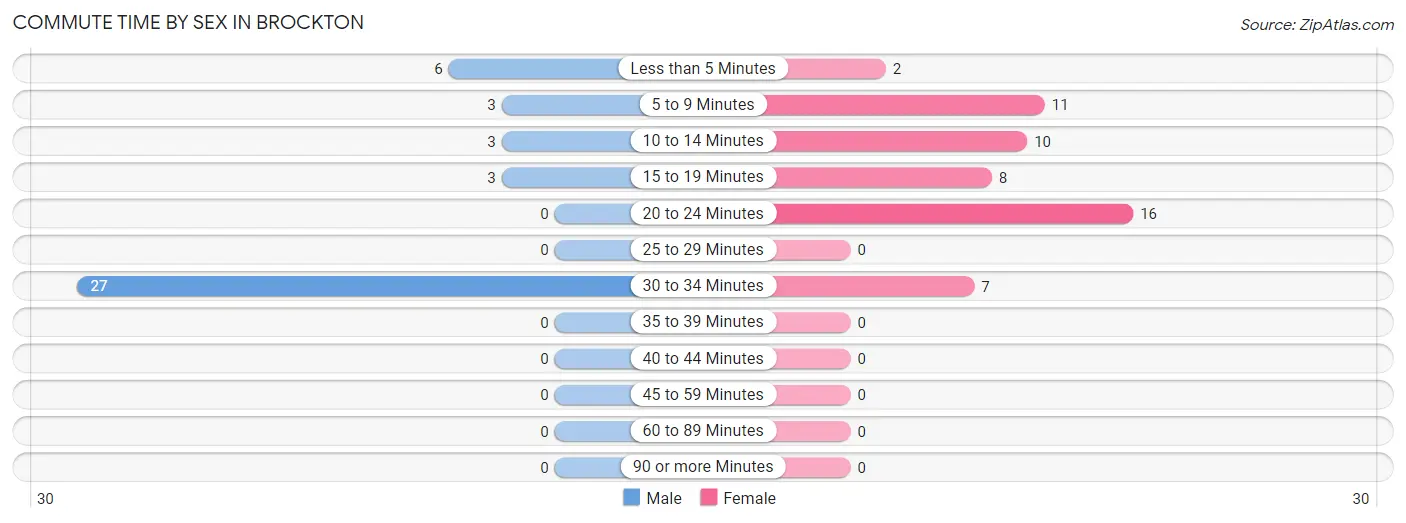
| Commute Time | Male | Female |
| Less than 5 Minutes | 6 (14.3%) | 2 (3.7%) |
| 5 to 9 Minutes | 3 (7.1%) | 11 (20.4%) |
| 10 to 14 Minutes | 3 (7.1%) | 10 (18.5%) |
| 15 to 19 Minutes | 3 (7.1%) | 8 (14.8%) |
| 20 to 24 Minutes | 0 (0.0%) | 16 (29.6%) |
| 25 to 29 Minutes | 0 (0.0%) | 0 (0.0%) |
| 30 to 34 Minutes | 27 (64.3%) | 7 (13.0%) |
| 35 to 39 Minutes | 0 (0.0%) | 0 (0.0%) |
| 40 to 44 Minutes | 0 (0.0%) | 0 (0.0%) |
| 45 to 59 Minutes | 0 (0.0%) | 0 (0.0%) |
| 60 to 89 Minutes | 0 (0.0%) | 0 (0.0%) |
| 90 or more Minutes | 0 (0.0%) | 0 (0.0%) |
Time of Departure to Work by Sex in Brockton
The most frequent times of departure to work in Brockton are 7:30 AM to 7:59 AM (27, 64.3%) for males and 7:30 AM to 7:59 AM (22, 40.7%) for females.
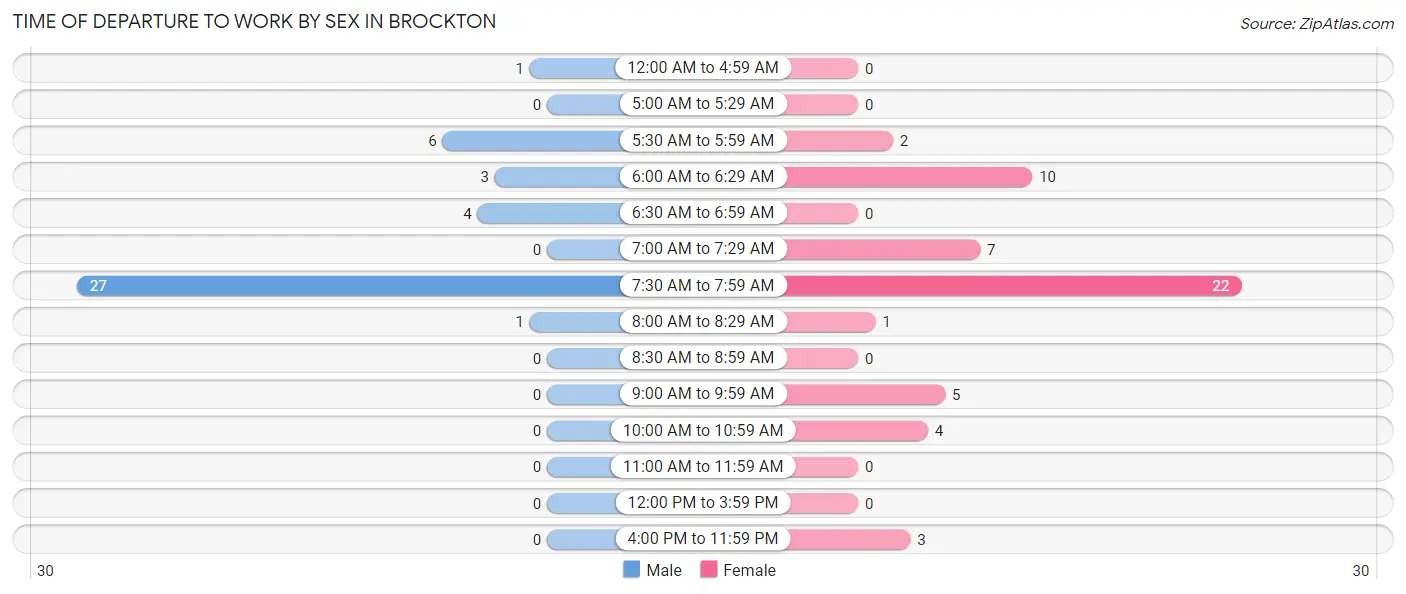
| Time of Departure | Male | Female |
| 12:00 AM to 4:59 AM | 1 (2.4%) | 0 (0.0%) |
| 5:00 AM to 5:29 AM | 0 (0.0%) | 0 (0.0%) |
| 5:30 AM to 5:59 AM | 6 (14.3%) | 2 (3.7%) |
| 6:00 AM to 6:29 AM | 3 (7.1%) | 10 (18.5%) |
| 6:30 AM to 6:59 AM | 4 (9.5%) | 0 (0.0%) |
| 7:00 AM to 7:29 AM | 0 (0.0%) | 7 (13.0%) |
| 7:30 AM to 7:59 AM | 27 (64.3%) | 22 (40.7%) |
| 8:00 AM to 8:29 AM | 1 (2.4%) | 1 (1.8%) |
| 8:30 AM to 8:59 AM | 0 (0.0%) | 0 (0.0%) |
| 9:00 AM to 9:59 AM | 0 (0.0%) | 5 (9.3%) |
| 10:00 AM to 10:59 AM | 0 (0.0%) | 4 (7.4%) |
| 11:00 AM to 11:59 AM | 0 (0.0%) | 0 (0.0%) |
| 12:00 PM to 3:59 PM | 0 (0.0%) | 0 (0.0%) |
| 4:00 PM to 11:59 PM | 0 (0.0%) | 3 (5.6%) |
| Total | 42 (100.0%) | 54 (100.0%) |
Housing Occupancy in Brockton
Occupancy by Ownership in Brockton
Of the total 100 dwellings in Brockton, owner-occupied units account for 71 (71.0%), while renter-occupied units make up 29 (29.0%).
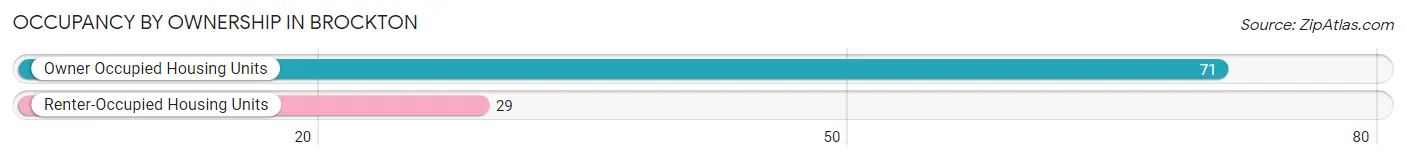
| Occupancy | # Housing Units | % Housing Units |
| Owner Occupied Housing Units | 71 | 71.0% |
| Renter-Occupied Housing Units | 29 | 29.0% |
| Total Occupied Housing Units | 100 | 100.0% |
Occupancy by Household Size in Brockton
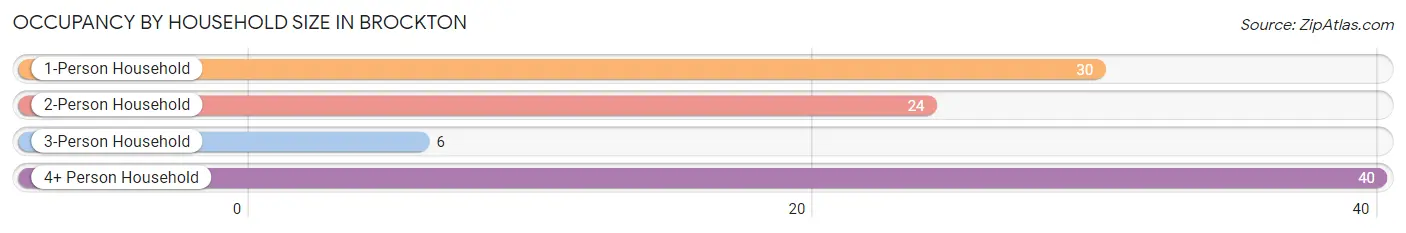
| Household Size | # Housing Units | % Housing Units |
| 1-Person Household | 30 | 30.0% |
| 2-Person Household | 24 | 24.0% |
| 3-Person Household | 6 | 6.0% |
| 4+ Person Household | 40 | 40.0% |
| Total Housing Units | 100 | 100.0% |
Occupancy by Ownership by Household Size in Brockton
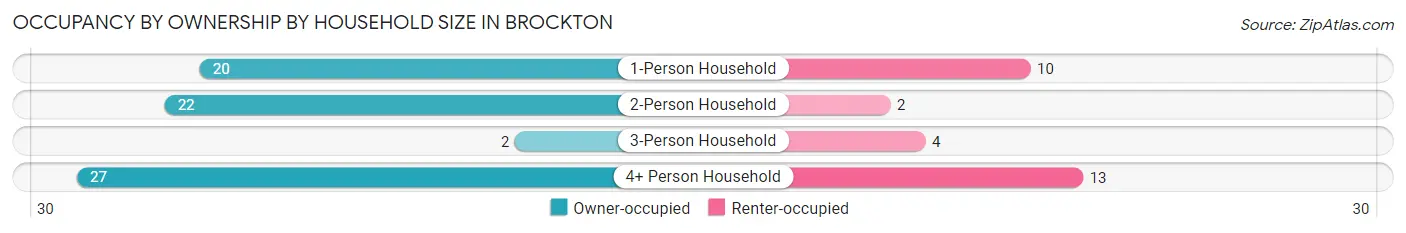
| Household Size | Owner-occupied | Renter-occupied |
| 1-Person Household | 20 (66.7%) | 10 (33.3%) |
| 2-Person Household | 22 (91.7%) | 2 (8.3%) |
| 3-Person Household | 2 (33.3%) | 4 (66.7%) |
| 4+ Person Household | 27 (67.5%) | 13 (32.5%) |
| Total Housing Units | 71 (71.0%) | 29 (29.0%) |
Occupancy by Educational Attainment in Brockton
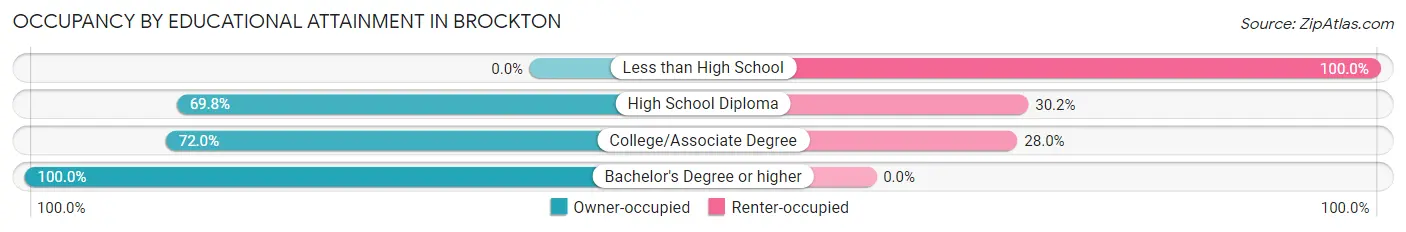
| Household Size | Owner-occupied | Renter-occupied |
| Less than High School | 0 (0.0%) | 3 (100.0%) |
| High School Diploma | 44 (69.8%) | 19 (30.2%) |
| College/Associate Degree | 18 (72.0%) | 7 (28.0%) |
| Bachelor's Degree or higher | 9 (100.0%) | 0 (0.0%) |
Occupancy by Age of Householder in Brockton
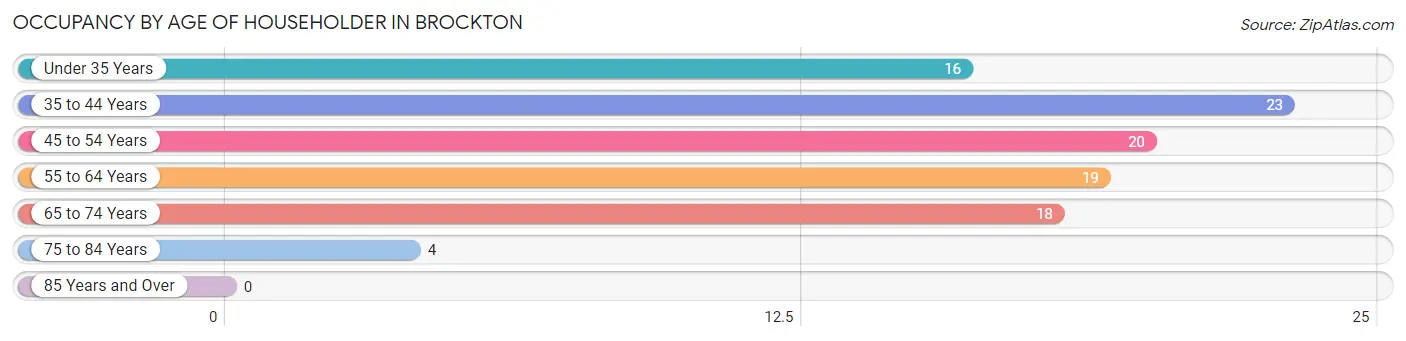
| Age Bracket | # Households | % Households |
| Under 35 Years | 16 | 16.0% |
| 35 to 44 Years | 23 | 23.0% |
| 45 to 54 Years | 20 | 20.0% |
| 55 to 64 Years | 19 | 19.0% |
| 65 to 74 Years | 18 | 18.0% |
| 75 to 84 Years | 4 | 4.0% |
| 85 Years and Over | 0 | 0.0% |
| Total | 100 | 100.0% |
Housing Finances in Brockton
Median Income by Occupancy in Brockton
| Occupancy Type | # Households | Median Income |
| Owner-Occupied | 71 (71.0%) | $0 |
| Renter-Occupied | 29 (29.0%) | $0 |
| Average | 100 (100.0%) | $0 |
Occupancy by Householder Income Bracket in Brockton

| Income Bracket | Owner-occupied | Renter-occupied |
| Less than $5,000 | 11 (15.5%) | 11 (37.9%) |
| $5,000 to $9,999 | 8 (11.3%) | 2 (6.9%) |
| $10,000 to $14,999 | 10 (14.1%) | 2 (6.9%) |
| $15,000 to $19,999 | 7 (9.9%) | 0 (0.0%) |
| $20,000 to $24,999 | 0 (0.0%) | 0 (0.0%) |
| $25,000 to $34,999 | 1 (1.4%) | 3 (10.3%) |
| $35,000 to $49,999 | 9 (12.7%) | 5 (17.2%) |
| $50,000 to $74,999 | 13 (18.3%) | 3 (10.3%) |
| $75,000 to $99,999 | 7 (9.9%) | 3 (10.3%) |
| $100,000 to $149,999 | 4 (5.6%) | 0 (0.0%) |
| $150,000 or more | 1 (1.4%) | 0 (0.0%) |
| Total | 71 (100.0%) | 29 (100.0%) |
Monthly Housing Cost Tiers in Brockton
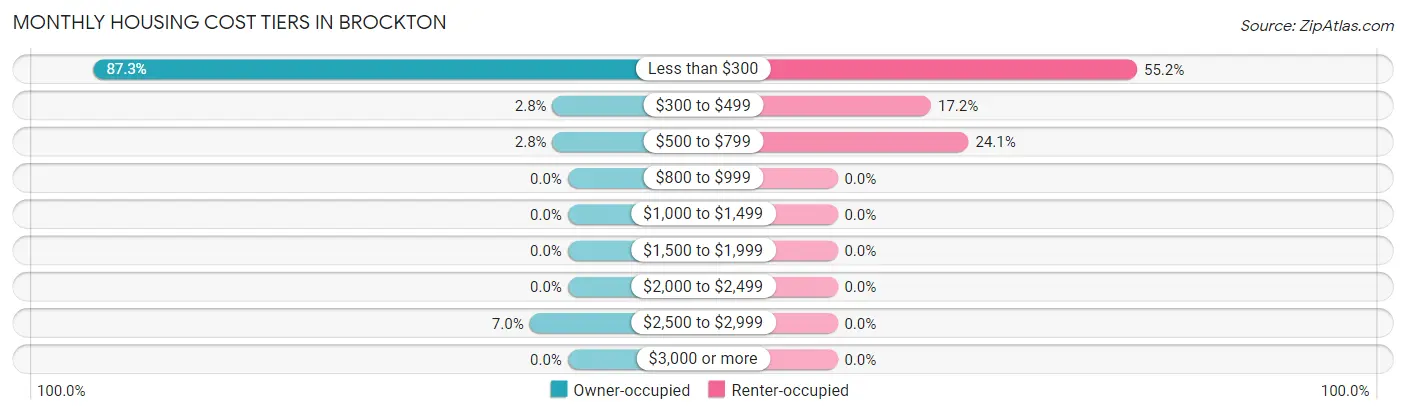
| Monthly Cost | Owner-occupied | Renter-occupied |
| Less than $300 | 62 (87.3%) | 16 (55.2%) |
| $300 to $499 | 2 (2.8%) | 5 (17.2%) |
| $500 to $799 | 2 (2.8%) | 7 (24.1%) |
| $800 to $999 | 0 (0.0%) | 0 (0.0%) |
| $1,000 to $1,499 | 0 (0.0%) | 0 (0.0%) |
| $1,500 to $1,999 | 0 (0.0%) | 0 (0.0%) |
| $2,000 to $2,499 | 0 (0.0%) | 0 (0.0%) |
| $2,500 to $2,999 | 5 (7.0%) | 0 (0.0%) |
| $3,000 or more | 0 (0.0%) | 0 (0.0%) |
| Total | 71 (100.0%) | 29 (100.0%) |
Physical Housing Characteristics in Brockton
Housing Structures in Brockton
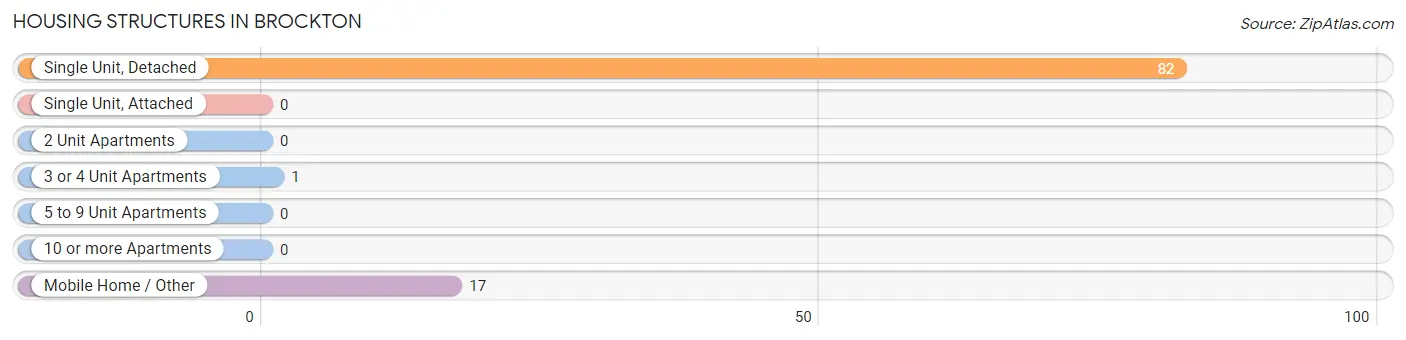
| Structure Type | # Housing Units | % Housing Units |
| Single Unit, Detached | 82 | 82.0% |
| Single Unit, Attached | 0 | 0.0% |
| 2 Unit Apartments | 0 | 0.0% |
| 3 or 4 Unit Apartments | 1 | 1.0% |
| 5 to 9 Unit Apartments | 0 | 0.0% |
| 10 or more Apartments | 0 | 0.0% |
| Mobile Home / Other | 17 | 17.0% |
| Total | 100 | 100.0% |
Housing Structures by Occupancy in Brockton
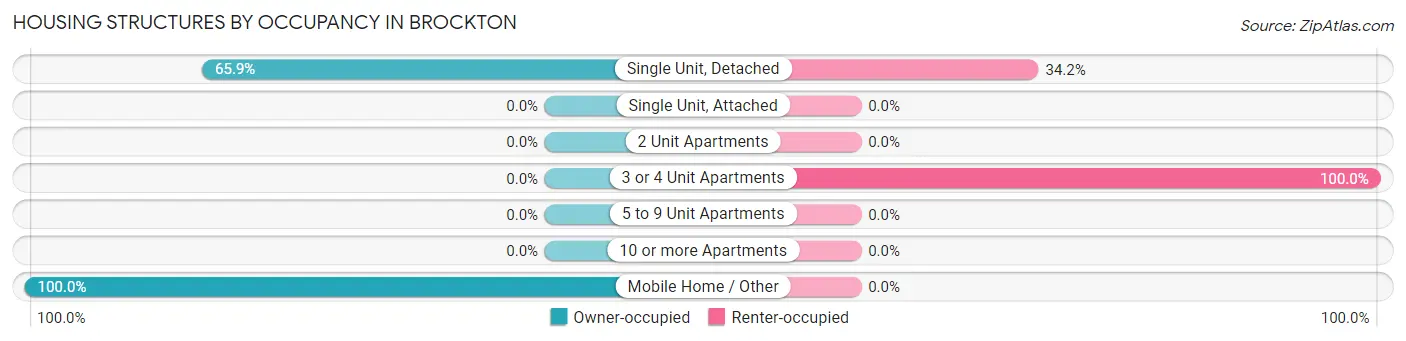
| Structure Type | Owner-occupied | Renter-occupied |
| Single Unit, Detached | 54 (65.8%) | 28 (34.2%) |
| Single Unit, Attached | 0 (0.0%) | 0 (0.0%) |
| 2 Unit Apartments | 0 (0.0%) | 0 (0.0%) |
| 3 or 4 Unit Apartments | 0 (0.0%) | 1 (100.0%) |
| 5 to 9 Unit Apartments | 0 (0.0%) | 0 (0.0%) |
| 10 or more Apartments | 0 (0.0%) | 0 (0.0%) |
| Mobile Home / Other | 17 (100.0%) | 0 (0.0%) |
| Total | 71 (71.0%) | 29 (29.0%) |
Housing Structures by Number of Rooms in Brockton
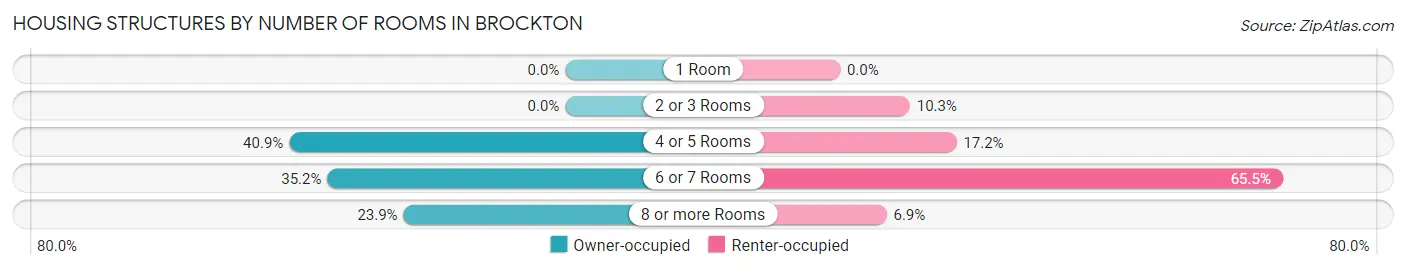
| Number of Rooms | Owner-occupied | Renter-occupied |
| 1 Room | 0 (0.0%) | 0 (0.0%) |
| 2 or 3 Rooms | 0 (0.0%) | 3 (10.3%) |
| 4 or 5 Rooms | 29 (40.8%) | 5 (17.2%) |
| 6 or 7 Rooms | 25 (35.2%) | 19 (65.5%) |
| 8 or more Rooms | 17 (23.9%) | 2 (6.9%) |
| Total | 71 (100.0%) | 29 (100.0%) |
Housing Structure by Heating Type in Brockton
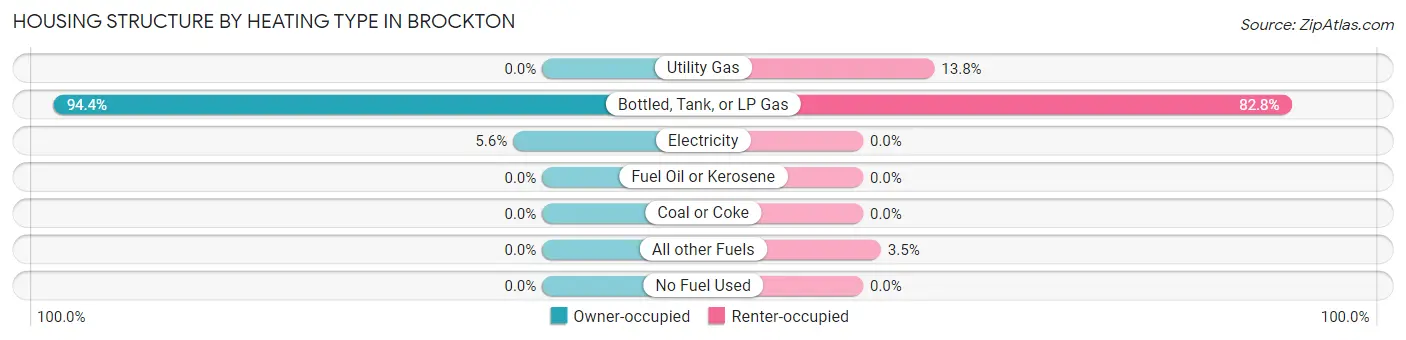
| Heating Type | Owner-occupied | Renter-occupied |
| Utility Gas | 0 (0.0%) | 4 (13.8%) |
| Bottled, Tank, or LP Gas | 67 (94.4%) | 24 (82.8%) |
| Electricity | 4 (5.6%) | 0 (0.0%) |
| Fuel Oil or Kerosene | 0 (0.0%) | 0 (0.0%) |
| Coal or Coke | 0 (0.0%) | 0 (0.0%) |
| All other Fuels | 0 (0.0%) | 1 (3.5%) |
| No Fuel Used | 0 (0.0%) | 0 (0.0%) |
| Total | 71 (100.0%) | 29 (100.0%) |
Household Vehicle Usage in Brockton
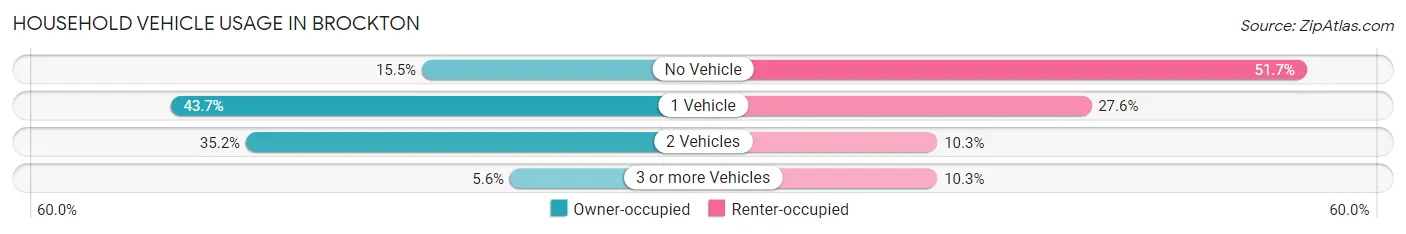
| Vehicles per Household | Owner-occupied | Renter-occupied |
| No Vehicle | 11 (15.5%) | 15 (51.7%) |
| 1 Vehicle | 31 (43.7%) | 8 (27.6%) |
| 2 Vehicles | 25 (35.2%) | 3 (10.3%) |
| 3 or more Vehicles | 4 (5.6%) | 3 (10.3%) |
| Total | 71 (100.0%) | 29 (100.0%) |
Real Estate & Mortgages in Brockton
Real Estate and Mortgage Overview in Brockton
| Characteristic | Without Mortgage | With Mortgage |
| Housing Units | 71 | 0 |
| Median Property Value | $48,500 | $0 |
| Median Household Income | - | - |
| Monthly Housing Costs | $184 | $0 |
| Real Estate Taxes | - | - |
Property Value by Mortgage Status in Brockton
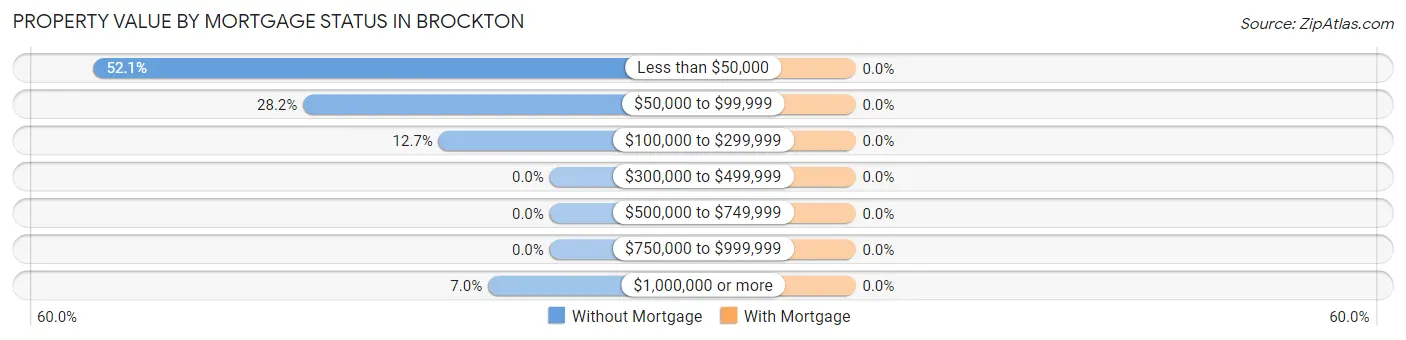
| Property Value | Without Mortgage | With Mortgage |
| Less than $50,000 | 37 (52.1%) | 0 (0.0%) |
| $50,000 to $99,999 | 20 (28.2%) | 0 (0.0%) |
| $100,000 to $299,999 | 9 (12.7%) | 0 (0.0%) |
| $300,000 to $499,999 | 0 (0.0%) | 0 (0.0%) |
| $500,000 to $749,999 | 0 (0.0%) | 0 (0.0%) |
| $750,000 to $999,999 | 0 (0.0%) | 0 (0.0%) |
| $1,000,000 or more | 5 (7.0%) | 0 (0.0%) |
| Total | 71 (100.0%) | 0 (0.0%) |
Household Income by Mortgage Status in Brockton
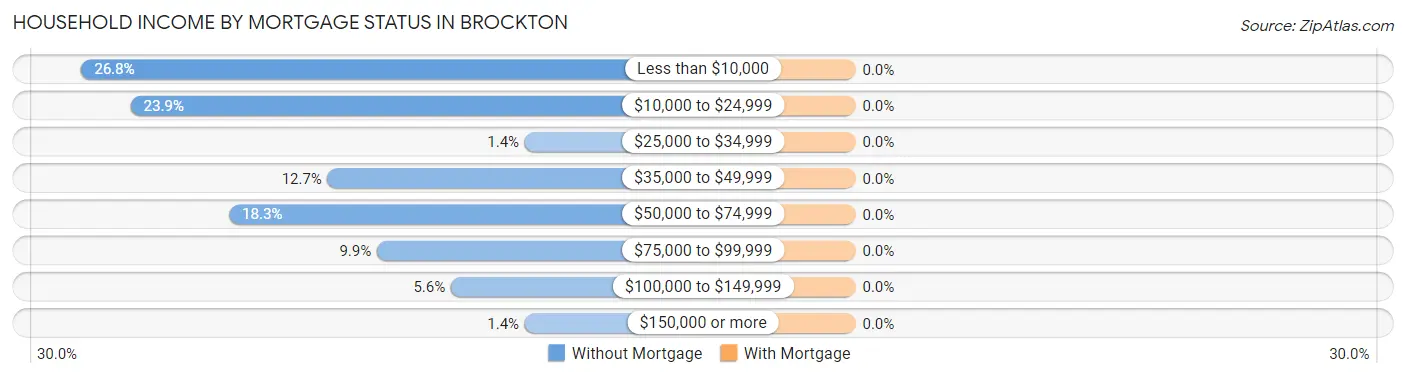
| Household Income | Without Mortgage | With Mortgage |
| Less than $10,000 | 19 (26.8%) | 0 (0.0%) |
| $10,000 to $24,999 | 17 (23.9%) | 0 (0.0%) |
| $25,000 to $34,999 | 1 (1.4%) | 0 (0.0%) |
| $35,000 to $49,999 | 9 (12.7%) | 0 (0.0%) |
| $50,000 to $74,999 | 13 (18.3%) | 0 (0.0%) |
| $75,000 to $99,999 | 7 (9.9%) | 0 (0.0%) |
| $100,000 to $149,999 | 4 (5.6%) | 0 (0.0%) |
| $150,000 or more | 1 (1.4%) | 0 (0.0%) |
| Total | 71 (100.0%) | 0 (0.0%) |
Property Value to Household Income Ratio in Brockton
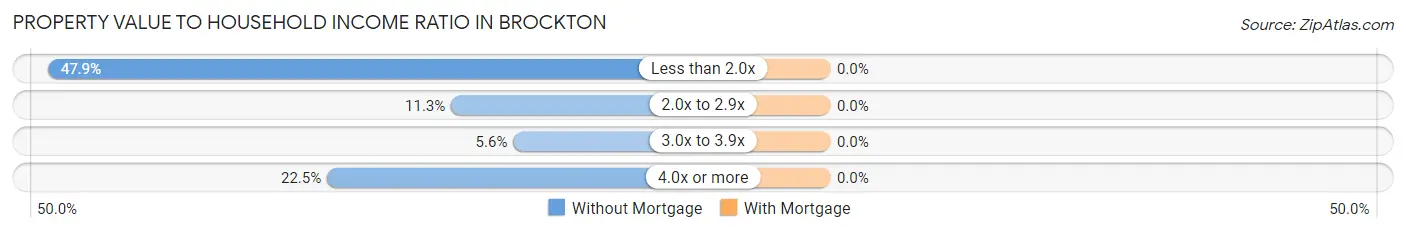
| Value-to-Income Ratio | Without Mortgage | With Mortgage |
| Less than 2.0x | 34 (47.9%) | 0 (0.0%) |
| 2.0x to 2.9x | 8 (11.3%) | 0 (0.0%) |
| 3.0x to 3.9x | 4 (5.6%) | 0 (0.0%) |
| 4.0x or more | 16 (22.5%) | 0 (0.0%) |
| Total | 71 (100.0%) | 0 (0.0%) |
Real Estate Taxes by Mortgage Status in Brockton
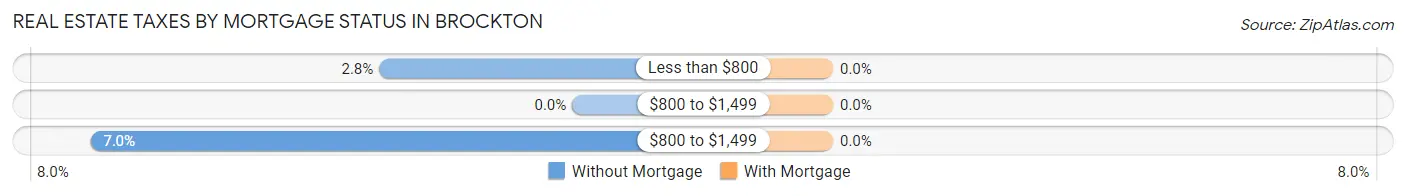
| Property Taxes | Without Mortgage | With Mortgage |
| Less than $800 | 2 (2.8%) | 0 (0.0%) |
| $800 to $1,499 | 0 (0.0%) | 0 (0.0%) |
| $800 to $1,499 | 5 (7.0%) | 0 (0.0%) |
| Total | 71 (100.0%) | 0 (0.0%) |
Health & Disability in Brockton
Health Insurance Coverage by Age in Brockton
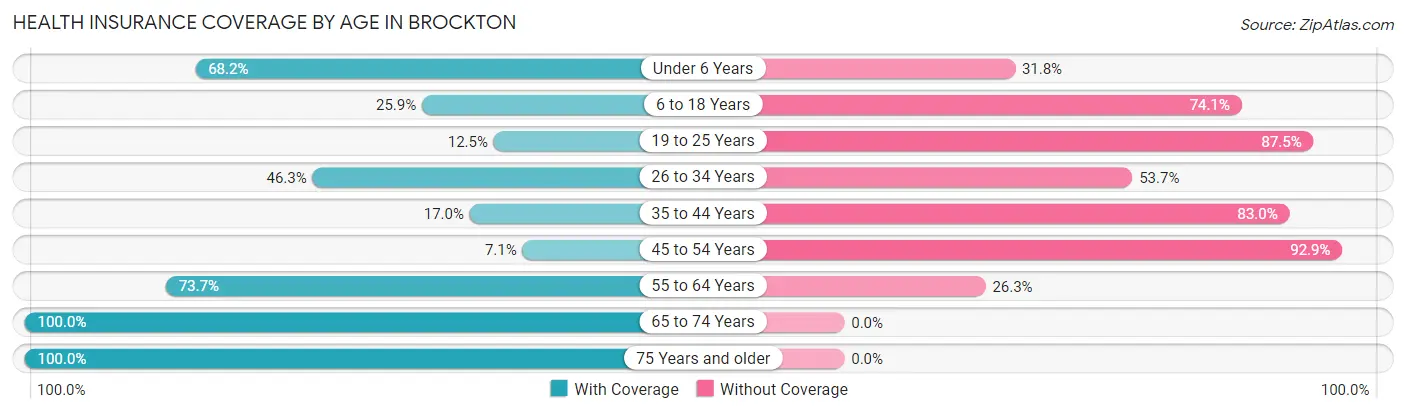
| Age Bracket | With Coverage | Without Coverage |
| Under 6 Years | 45 (68.2%) | 21 (31.8%) |
| 6 to 18 Years | 29 (25.9%) | 83 (74.1%) |
| 19 to 25 Years | 3 (12.5%) | 21 (87.5%) |
| 26 to 34 Years | 50 (46.3%) | 58 (53.7%) |
| 35 to 44 Years | 9 (17.0%) | 44 (83.0%) |
| 45 to 54 Years | 2 (7.1%) | 26 (92.9%) |
| 55 to 64 Years | 28 (73.7%) | 10 (26.3%) |
| 65 to 74 Years | 26 (100.0%) | 0 (0.0%) |
| 75 Years and older | 4 (100.0%) | 0 (0.0%) |
| Total | 196 (42.7%) | 263 (57.3%) |
Health Insurance Coverage by Citizenship Status in Brockton
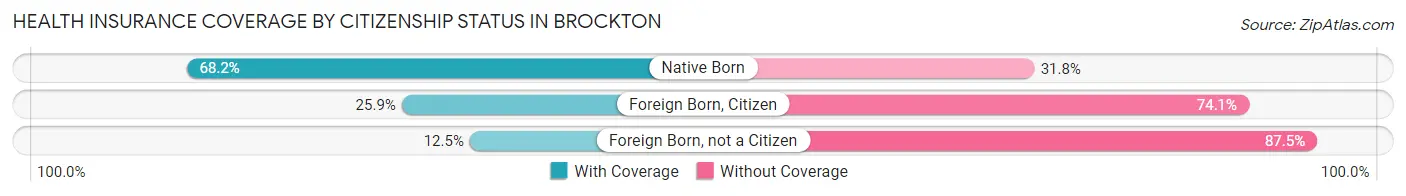
| Citizenship Status | With Coverage | Without Coverage |
| Native Born | 45 (68.2%) | 21 (31.8%) |
| Foreign Born, Citizen | 29 (25.9%) | 83 (74.1%) |
| Foreign Born, not a Citizen | 3 (12.5%) | 21 (87.5%) |
Health Insurance Coverage by Household Income in Brockton
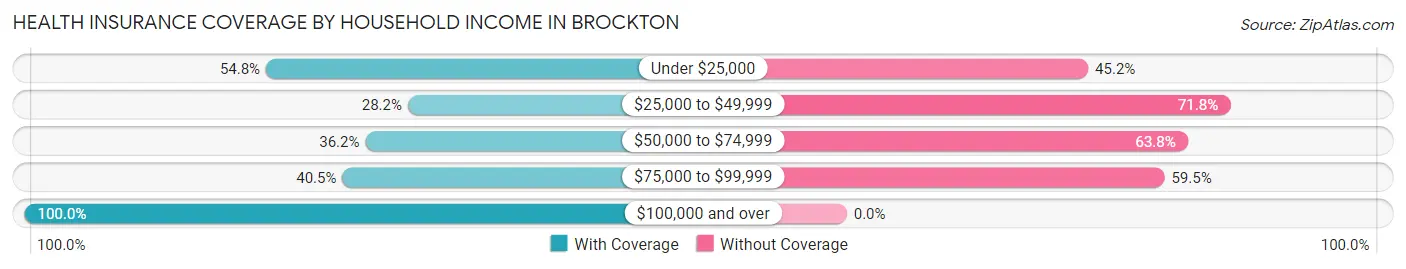
| Household Income | With Coverage | Without Coverage |
| Under $25,000 | 86 (54.8%) | 71 (45.2%) |
| $25,000 to $49,999 | 44 (28.2%) | 112 (71.8%) |
| $50,000 to $74,999 | 17 (36.2%) | 30 (63.8%) |
| $75,000 to $99,999 | 34 (40.5%) | 50 (59.5%) |
| $100,000 and over | 15 (100.0%) | 0 (0.0%) |
Public vs Private Health Insurance Coverage by Age in Brockton
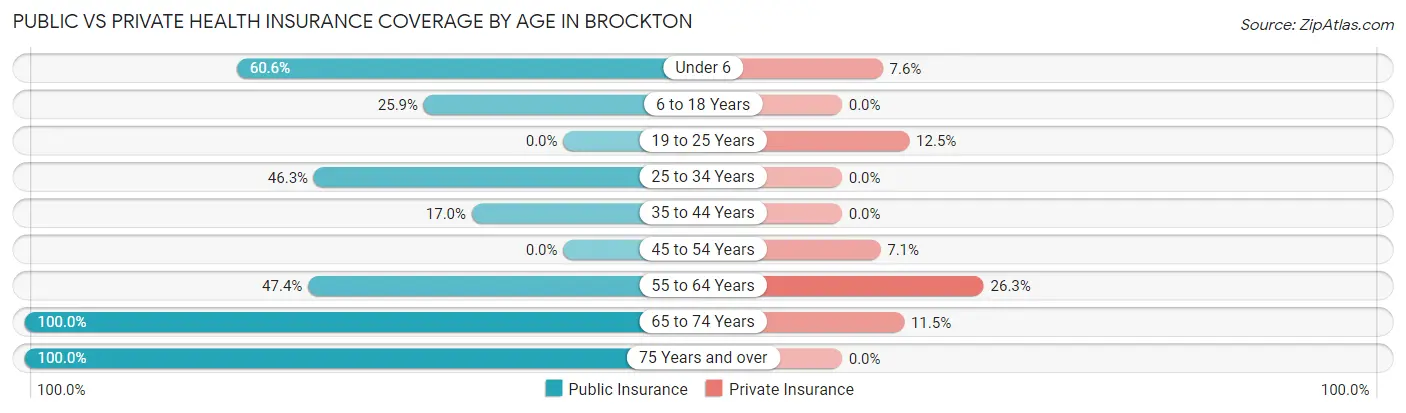
| Age Bracket | Public Insurance | Private Insurance |
| Under 6 | 40 (60.6%) | 5 (7.6%) |
| 6 to 18 Years | 29 (25.9%) | 0 (0.0%) |
| 19 to 25 Years | 0 (0.0%) | 3 (12.5%) |
| 25 to 34 Years | 50 (46.3%) | 0 (0.0%) |
| 35 to 44 Years | 9 (17.0%) | 0 (0.0%) |
| 45 to 54 Years | 0 (0.0%) | 2 (7.1%) |
| 55 to 64 Years | 18 (47.4%) | 10 (26.3%) |
| 65 to 74 Years | 26 (100.0%) | 3 (11.5%) |
| 75 Years and over | 4 (100.0%) | 0 (0.0%) |
| Total | 176 (38.3%) | 23 (5.0%) |
Disability Status by Sex by Age in Brockton
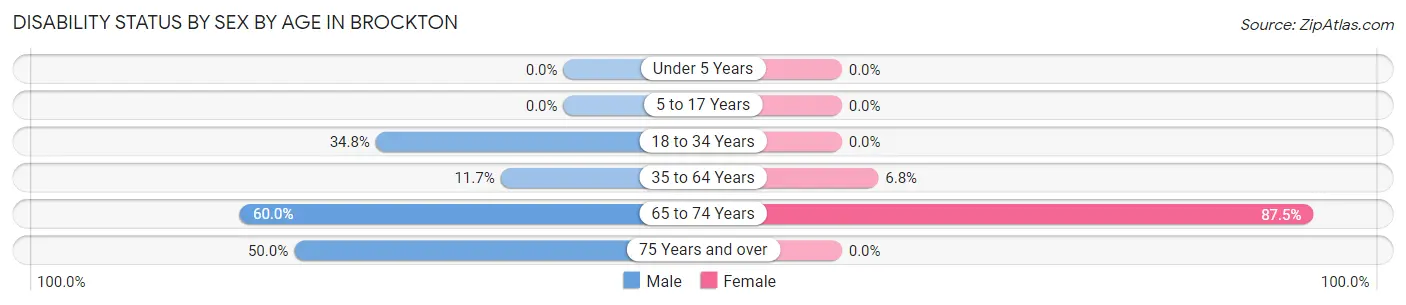
| Age Bracket | Male | Female |
| Under 5 Years | 0 (0.0%) | 0 (0.0%) |
| 5 to 17 Years | 0 (0.0%) | 0 (0.0%) |
| 18 to 34 Years | 31 (34.8%) | 0 (0.0%) |
| 35 to 64 Years | 7 (11.7%) | 4 (6.8%) |
| 65 to 74 Years | 6 (60.0%) | 14 (87.5%) |
| 75 Years and over | 1 (50.0%) | 0 (0.0%) |
Disability Class by Sex by Age in Brockton
Disability Class: Hearing Difficulty
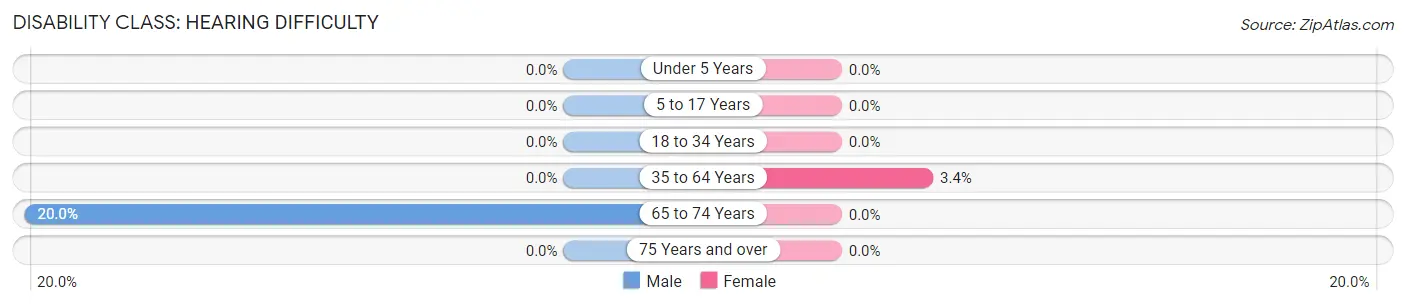
| Age Bracket | Male | Female |
| Under 5 Years | 0 (0.0%) | 0 (0.0%) |
| 5 to 17 Years | 0 (0.0%) | 0 (0.0%) |
| 18 to 34 Years | 0 (0.0%) | 0 (0.0%) |
| 35 to 64 Years | 0 (0.0%) | 2 (3.4%) |
| 65 to 74 Years | 2 (20.0%) | 0 (0.0%) |
| 75 Years and over | 0 (0.0%) | 0 (0.0%) |
Disability Class: Vision Difficulty
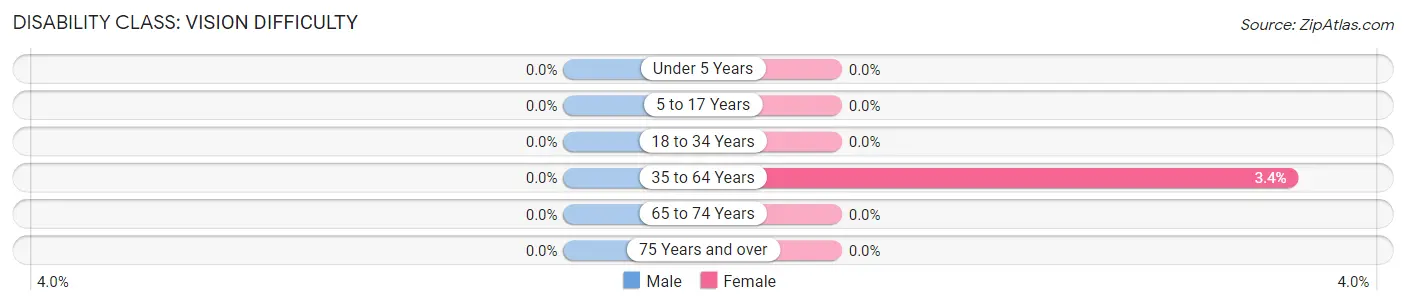
| Age Bracket | Male | Female |
| Under 5 Years | 0 (0.0%) | 0 (0.0%) |
| 5 to 17 Years | 0 (0.0%) | 0 (0.0%) |
| 18 to 34 Years | 0 (0.0%) | 0 (0.0%) |
| 35 to 64 Years | 0 (0.0%) | 2 (3.4%) |
| 65 to 74 Years | 0 (0.0%) | 0 (0.0%) |
| 75 Years and over | 0 (0.0%) | 0 (0.0%) |
Disability Class: Cognitive Difficulty
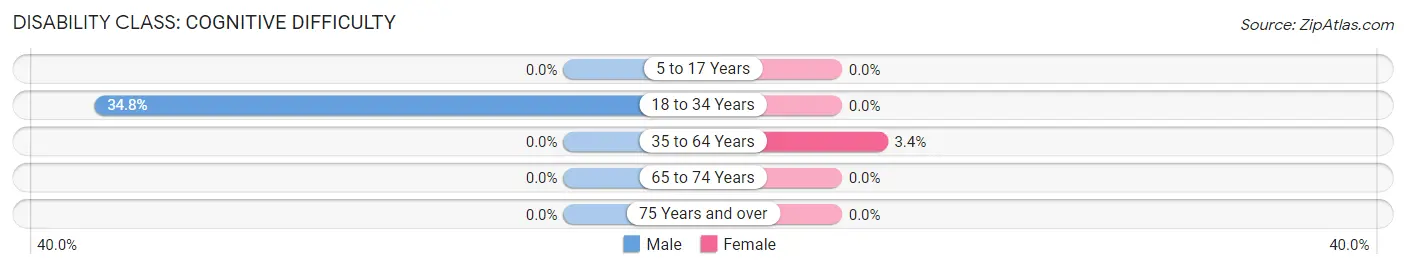
| Age Bracket | Male | Female |
| 5 to 17 Years | 0 (0.0%) | 0 (0.0%) |
| 18 to 34 Years | 31 (34.8%) | 0 (0.0%) |
| 35 to 64 Years | 0 (0.0%) | 2 (3.4%) |
| 65 to 74 Years | 0 (0.0%) | 0 (0.0%) |
| 75 Years and over | 0 (0.0%) | 0 (0.0%) |
Disability Class: Ambulatory Difficulty
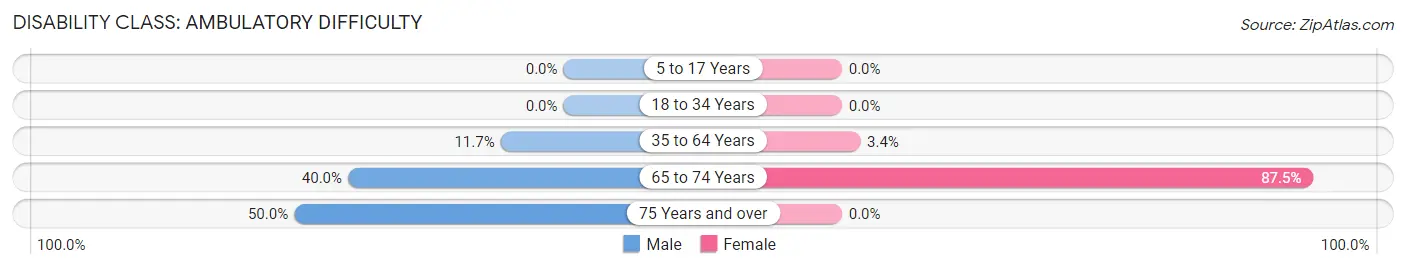
| Age Bracket | Male | Female |
| 5 to 17 Years | 0 (0.0%) | 0 (0.0%) |
| 18 to 34 Years | 0 (0.0%) | 0 (0.0%) |
| 35 to 64 Years | 7 (11.7%) | 2 (3.4%) |
| 65 to 74 Years | 4 (40.0%) | 14 (87.5%) |
| 75 Years and over | 1 (50.0%) | 0 (0.0%) |
Disability Class: Self-Care Difficulty
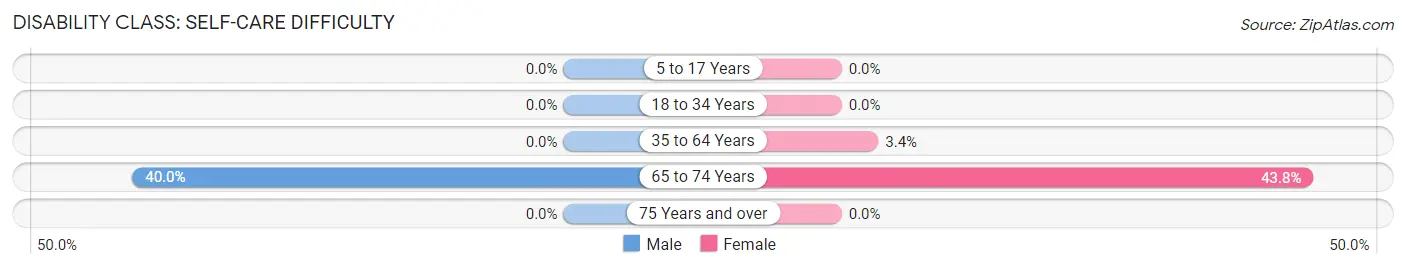
| Age Bracket | Male | Female |
| 5 to 17 Years | 0 (0.0%) | 0 (0.0%) |
| 18 to 34 Years | 0 (0.0%) | 0 (0.0%) |
| 35 to 64 Years | 0 (0.0%) | 2 (3.4%) |
| 65 to 74 Years | 4 (40.0%) | 7 (43.8%) |
| 75 Years and over | 0 (0.0%) | 0 (0.0%) |
Technology Access in Brockton
Computing Device Access in Brockton
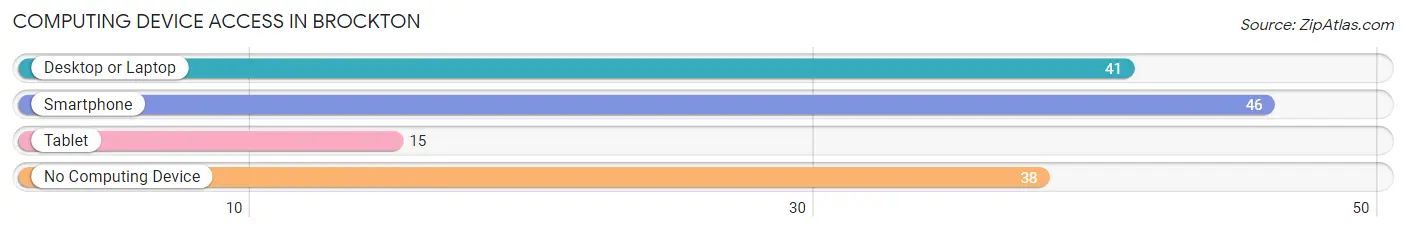
| Device Type | # Households | % Households |
| Desktop or Laptop | 41 | 41.0% |
| Smartphone | 46 | 46.0% |
| Tablet | 15 | 15.0% |
| No Computing Device | 38 | 38.0% |
| Total | 100 | 100.0% |
Internet Access in Brockton
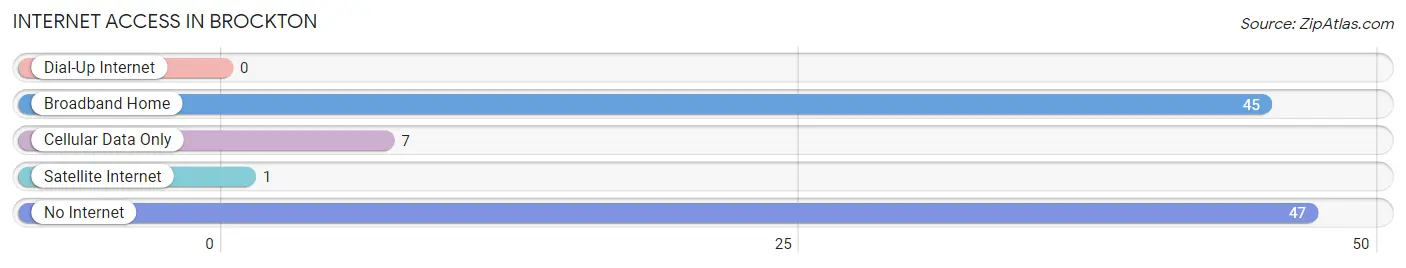
| Internet Type | # Households | % Households |
| Dial-Up Internet | 0 | 0.0% |
| Broadband Home | 45 | 45.0% |
| Cellular Data Only | 7 | 7.0% |
| Satellite Internet | 1 | 1.0% |
| No Internet | 47 | 47.0% |
| Total | 100 | 100.0% |
Brockton Summary
Brockton, Montana is a small town located in the southeastern corner of the state, near the border with Wyoming. It is situated in the foothills of the Rocky Mountains, and is surrounded by rolling hills and grasslands. The town has a population of just over 1,000 people, and is the county seat of Sweet Grass County.
History
Brockton was founded in 1882 by a group of settlers from the Midwest. The town was named after a local rancher, William Brockton, who had a large ranch in the area. The town quickly grew, and by the early 1900s, it had become a bustling center of commerce and industry. The town was home to several businesses, including a bank, a hotel, a general store, and a post office.
In the early 1900s, the town was also home to a large number of immigrants from Europe, particularly from Germany and Scandinavia. These immigrants brought with them their own culture and traditions, which still influence the town today.
Geography
Brockton is located in the southeastern corner of Montana, near the border with Wyoming. It is situated in the foothills of the Rocky Mountains, and is surrounded by rolling hills and grasslands. The town is located at an elevation of 4,000 feet, and has a semi-arid climate.
The town is located on the banks of the Yellowstone River, which is a major source of water for the area. The river is also a popular destination for fishing and other recreational activities.
Economy
Brockton’s economy is largely based on agriculture and ranching. The town is home to several large ranches, which produce beef, sheep, and other livestock. The town is also home to several small businesses, including a general store, a bank, and a post office.
The town is also home to a number of tourist attractions, including the Yellowstone National Park, which is located just a few miles away. The park is a popular destination for visitors from all over the world, and is a major source of income for the town.
Demographics
As of the 2010 census, the population of Brockton was 1,072. The town is predominantly white, with a small minority population of Native Americans, Hispanics, and African Americans. The median household income in the town is $37,000, and the median age is 44.
The town is home to a number of churches, including the First Presbyterian Church, the First Baptist Church, and the Church of Jesus Christ of Latter-day Saints. The town also has a public library, a museum, and a number of parks and recreational facilities.
Conclusion
Brockton, Montana is a small town located in the southeastern corner of the state, near the border with Wyoming. It is situated in the foothills of the Rocky Mountains, and is surrounded by rolling hills and grasslands. The town has a population of just over 1,000 people, and is the county seat of Sweet Grass County. The town’s economy is largely based on agriculture and ranching, and it is also home to a number of tourist attractions, including the Yellowstone National Park. The town is predominantly white, with a small minority population of Native Americans, Hispanics, and African Americans.
Common Questions
What is Per Capita Income in Brockton?
Per Capita income in Brockton is $11,182.
What is the Median Family Income in Brockton?
Median Family Income in Brockton is $35,000.
What is Income or Wage Gap in Brockton?
Income or Wage Gap in Brockton is 37.7%.
Women in Brockton earn 62.3 cents for every dollar earned by a man.
What is Inequality or Gini Index in Brockton?
Inequality or Gini Index in Brockton is 0.54.
What is the Total Population of Brockton?
Total Population of Brockton is 459.
What is the Total Male Population of Brockton?
Total Male Population of Brockton is 263.
What is the Total Female Population of Brockton?
Total Female Population of Brockton is 196.
What is the Ratio of Males per 100 Females in Brockton?
There are 134.18 Males per 100 Females in Brockton.
What is the Ratio of Females per 100 Males in Brockton?
There are 74.52 Females per 100 Males in Brockton.
What is the Median Population Age in Brockton?
Median Population Age in Brockton is 27.9 Years.
What is the Average Family Size in Brockton
Average Family Size in Brockton is 5.9 People.
What is the Average Household Size in Brockton
Average Household Size in Brockton is 4.6 People.
How Large is the Labor Force in Brockton?
There are 97 People in the Labor Forcein in Brockton.
What is the Percentage of People in the Labor Force in Brockton?
32.0% of People are in the Labor Force in Brockton.
What is the Unemployment Rate in Brockton?
Unemployment Rate in Brockton is 1.0%.