Zip Codes with the Highest Percentage of Households with Income Below $10,000 in Missoula, MT
RELATED REPORTS & OPTIONS
Household Income | $0-10k
Missoula
Compare Zip Codes
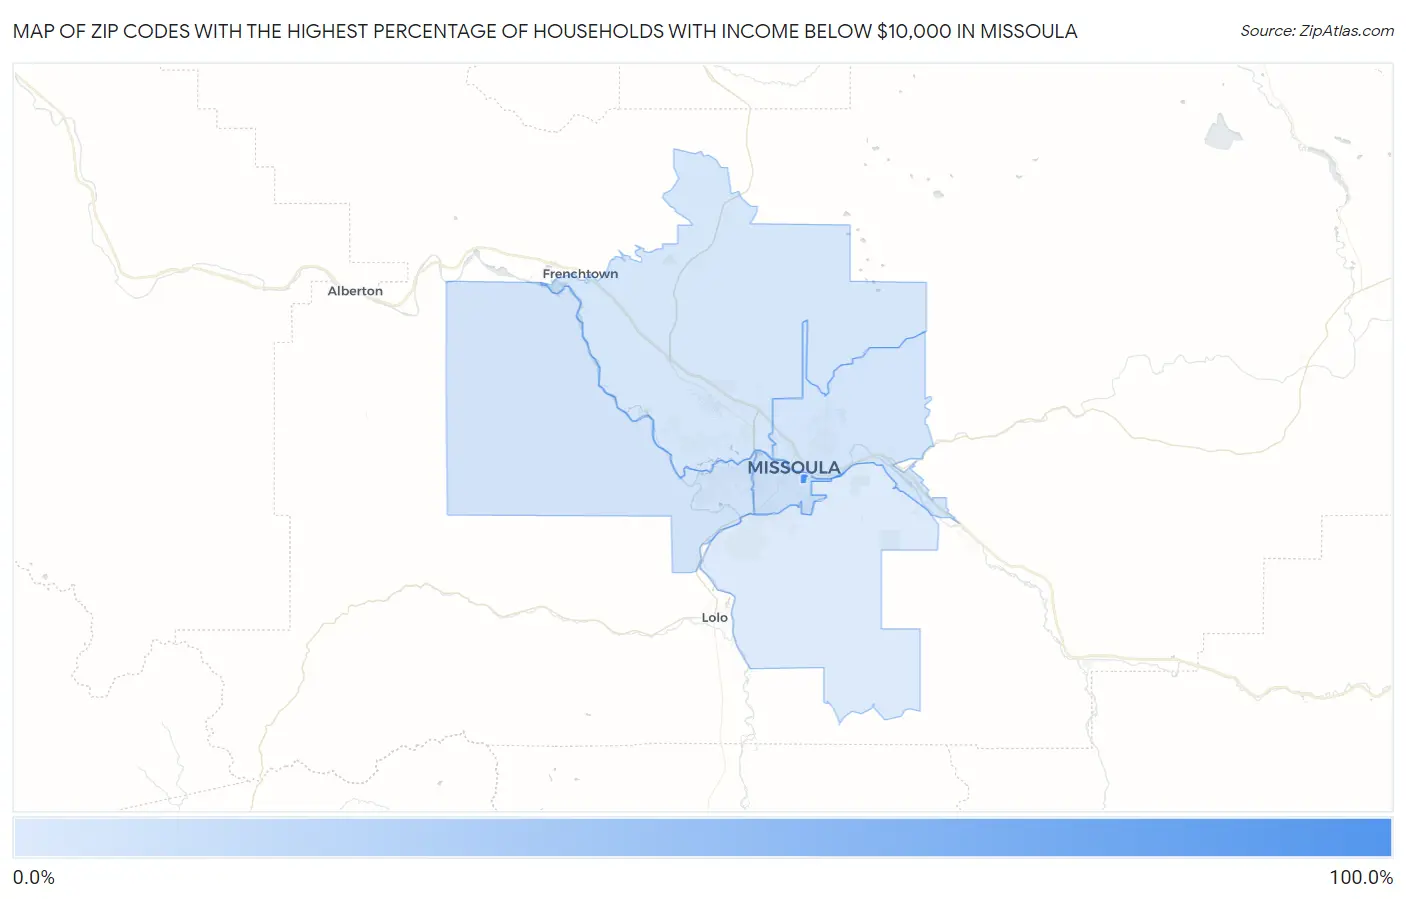
Map of Zip Codes with the Highest Percentage of Households with Income Below $10,000 in Missoula
0.40%
100.0%
Zip Codes with the Highest Percentage of Households with Income Below $10,000 in Missoula, MT
| Zip Code | Households with Income < $10k | vs State | vs National | |
| 1. | 59812 | 100.0% | 4.6%(+95.4)#1 | 4.9%(+95.1)#8 |
| 2. | 59801 | 7.6% | 4.6%(+3.00)#77 | 4.9%(+2.70)#6,063 |
| 3. | 59804 | 5.6% | 4.6%(+1.000)#114 | 4.9%(+0.700)#10,039 |
| 4. | 59802 | 4.4% | 4.6%(-0.200)#156 | 4.9%(-0.500)#13,745 |
| 5. | 59808 | 3.8% | 4.6%(-0.800)#178 | 4.9%(-1.10)#16,057 |
| 6. | 59803 | 0.40% | 4.6%(-4.20)#278 | 4.9%(-4.50)#27,993 |
1
Common Questions
What are the Top 5 Zip Codes with the Highest Percentage of Households with Income Below $10,000 in Missoula, MT?
Top 5 Zip Codes with the Highest Percentage of Households with Income Below $10,000 in Missoula, MT are:
What zip code has the Highest Percentage of Households with Income Below $10,000 in Missoula, MT?
59812 has the Highest Percentage of Households with Income Below $10,000 in Missoula, MT with 100.0%.
What is the Percentage of Households with Income Below $10,000 in Missoula, MT?
Percentage of Households with Income Below $10,000 in Missoula is 4.9%.
What is the Percentage of Households with Income Below $10,000 in Montana?
Percentage of Households with Income Below $10,000 in Montana is 4.6%.
What is the Percentage of Households with Income Below $10,000 in the United States?
Percentage of Households with Income Below $10,000 in the United States is 4.9%.