Judith Gap, MT Map & Demographics
Judith Gap Map
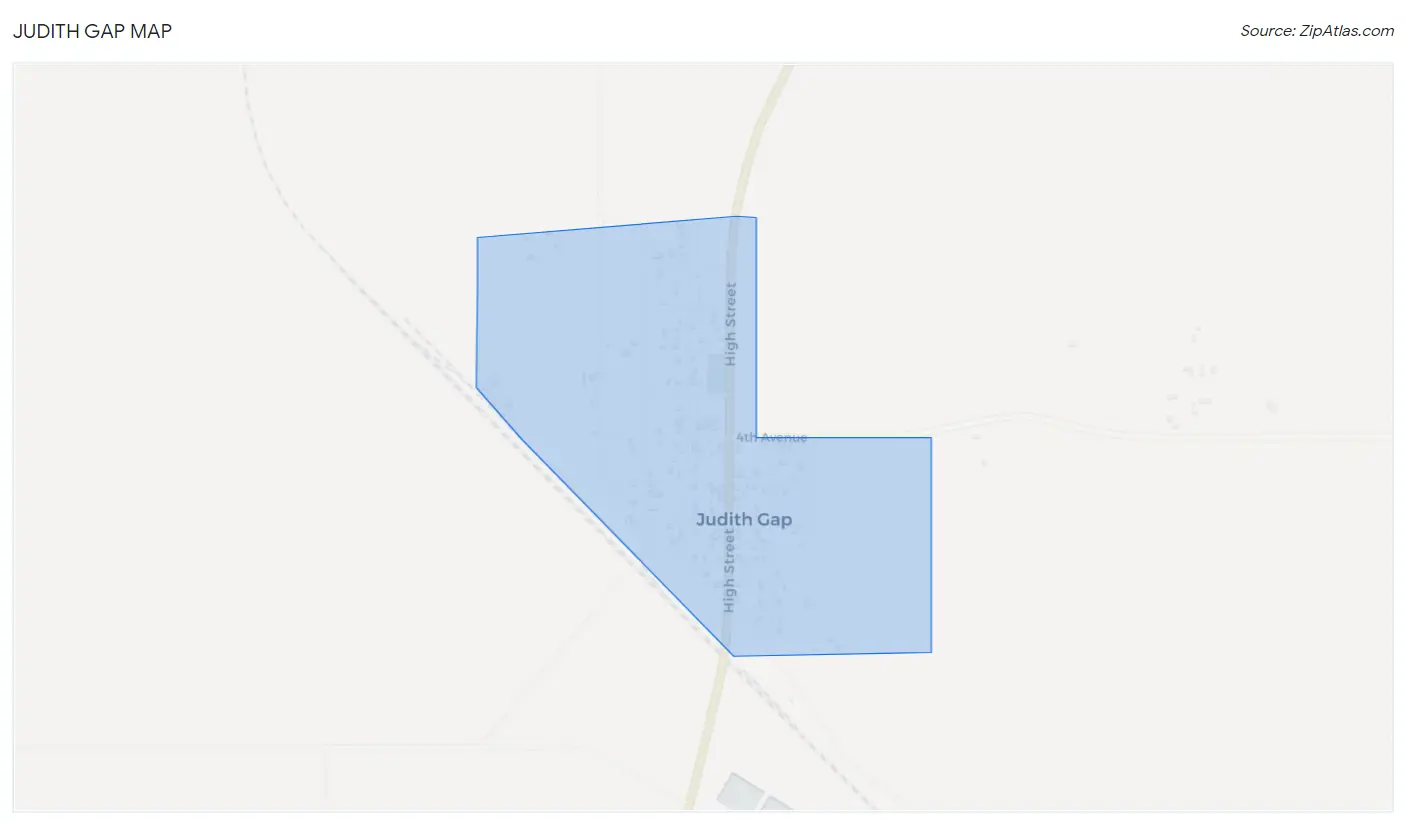
Judith Gap Overview
$19,328
PER CAPITA INCOME
$42,500
AVG FAMILY INCOME
$31,042
AVG HOUSEHOLD INCOME
53.1%
WAGE / INCOME GAP [ % ]
46.9¢/ $1
WAGE / INCOME GAP [ $ ]
0.51
INEQUALITY / GINI INDEX
140
TOTAL POPULATION
86
MALE POPULATION
54
FEMALE POPULATION
159.26
MALES / 100 FEMALES
62.79
FEMALES / 100 MALES
63.2
MEDIAN AGE
2.8
AVG FAMILY SIZE
1.8
AVG HOUSEHOLD SIZE
61
LABOR FORCE [ PEOPLE ]
53.0%
PERCENT IN LABOR FORCE
3.3%
UNEMPLOYMENT RATE
Judith Gap Zip Codes
Judith Gap Area Codes
Income in Judith Gap
Income Overview in Judith Gap
Per Capita Income in Judith Gap is $19,328, while median incomes of families and households are $42,500 and $31,042 respectively.
| Characteristic | Number | Measure |
| Per Capita Income | 140 | $19,328 |
| Median Family Income | 28 | $42,500 |
| Mean Family Income | 28 | $51,104 |
| Median Household Income | 77 | $31,042 |
| Mean Household Income | 77 | $33,983 |
| Income Deficit | 28 | $0 |
| Wage / Income Gap (%) | 140 | 53.10% |
| Wage / Income Gap ($) | 140 | 46.90¢ per $1 |
| Gini / Inequality Index | 140 | 0.51 |
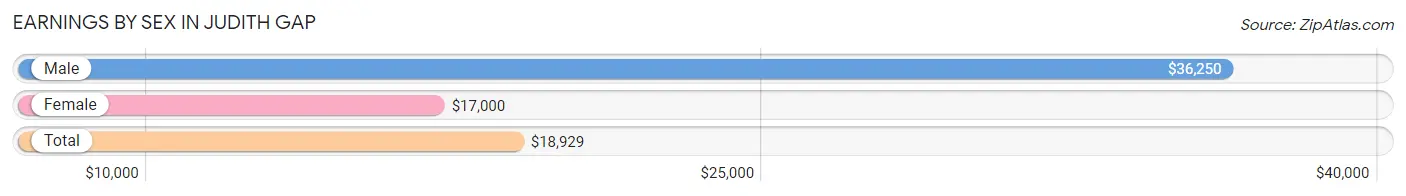
Earnings by Sex in Judith Gap
Average Earnings in Judith Gap are $18,929, $36,250 for men and $17,000 for women, a difference of 53.1%.
| Sex | Number | Average Earnings |
| Male | 32 (50.0%) | $36,250 |
| Female | 32 (50.0%) | $17,000 |
| Total | 64 (100.0%) | $18,929 |
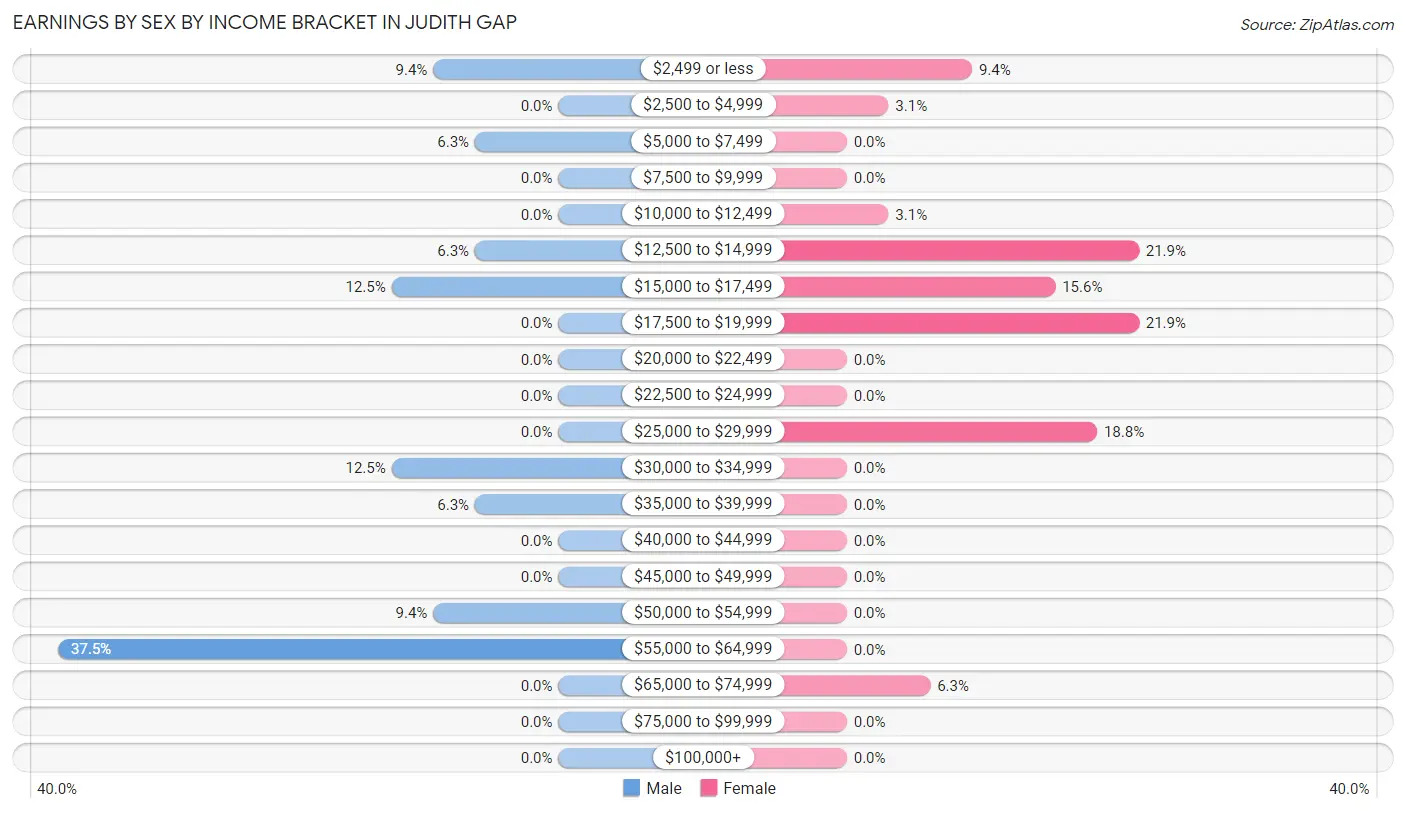
Earnings by Sex by Income Bracket in Judith Gap
The most common earnings brackets in Judith Gap are $55,000 to $64,999 for men (12 | 37.5%) and $12,500 to $14,999 for women (7 | 21.9%).
| Income | Male | Female |
| $2,499 or less | 3 (9.4%) | 3 (9.4%) |
| $2,500 to $4,999 | 0 (0.0%) | 1 (3.1%) |
| $5,000 to $7,499 | 2 (6.2%) | 0 (0.0%) |
| $7,500 to $9,999 | 0 (0.0%) | 0 (0.0%) |
| $10,000 to $12,499 | 0 (0.0%) | 1 (3.1%) |
| $12,500 to $14,999 | 2 (6.2%) | 7 (21.9%) |
| $15,000 to $17,499 | 4 (12.5%) | 5 (15.6%) |
| $17,500 to $19,999 | 0 (0.0%) | 7 (21.9%) |
| $20,000 to $22,499 | 0 (0.0%) | 0 (0.0%) |
| $22,500 to $24,999 | 0 (0.0%) | 0 (0.0%) |
| $25,000 to $29,999 | 0 (0.0%) | 6 (18.8%) |
| $30,000 to $34,999 | 4 (12.5%) | 0 (0.0%) |
| $35,000 to $39,999 | 2 (6.2%) | 0 (0.0%) |
| $40,000 to $44,999 | 0 (0.0%) | 0 (0.0%) |
| $45,000 to $49,999 | 0 (0.0%) | 0 (0.0%) |
| $50,000 to $54,999 | 3 (9.4%) | 0 (0.0%) |
| $55,000 to $64,999 | 12 (37.5%) | 0 (0.0%) |
| $65,000 to $74,999 | 0 (0.0%) | 2 (6.2%) |
| $75,000 to $99,999 | 0 (0.0%) | 0 (0.0%) |
| $100,000+ | 0 (0.0%) | 0 (0.0%) |
| Total | 32 (100.0%) | 32 (100.0%) |
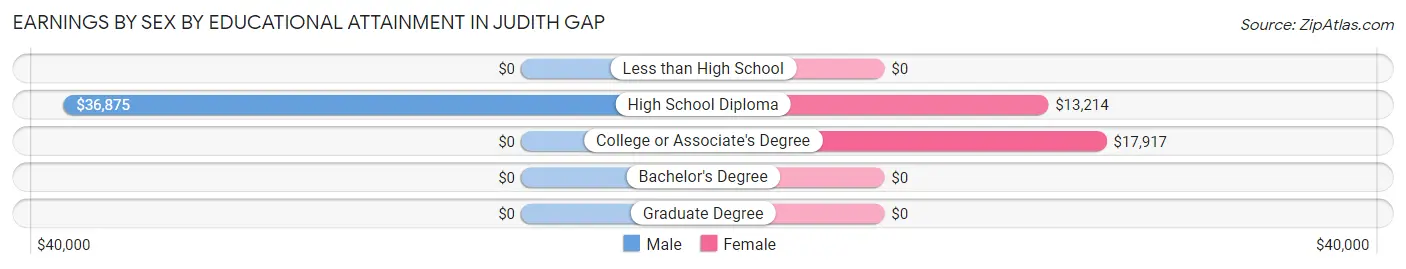
Earnings by Sex by Educational Attainment in Judith Gap
Average earnings in Judith Gap are $36,250 for men and $17,000 for women, a difference of 53.1%. Men with an educational attainment of high school diploma enjoy the highest average annual earnings of $36,875, while those with high school diploma education earn the least with $36,875. Women with an educational attainment of college or associate's degree earn the most with the average annual earnings of $17,917, while those with high school diploma education have the smallest earnings of $13,214.
| Educational Attainment | Male Income | Female Income |
| Less than High School | - | - |
| High School Diploma | $36,875 | $13,214 |
| College or Associate's Degree | - | - |
| Bachelor's Degree | - | - |
| Graduate Degree | - | - |
| Total | $36,250 | $17,000 |
Family Income in Judith Gap
Family Income Brackets in Judith Gap
According to the Judith Gap family income data, there are 9 families falling into the $25,000 to $34,999 income range, which is the most common income bracket and makes up 32.1% of all families.
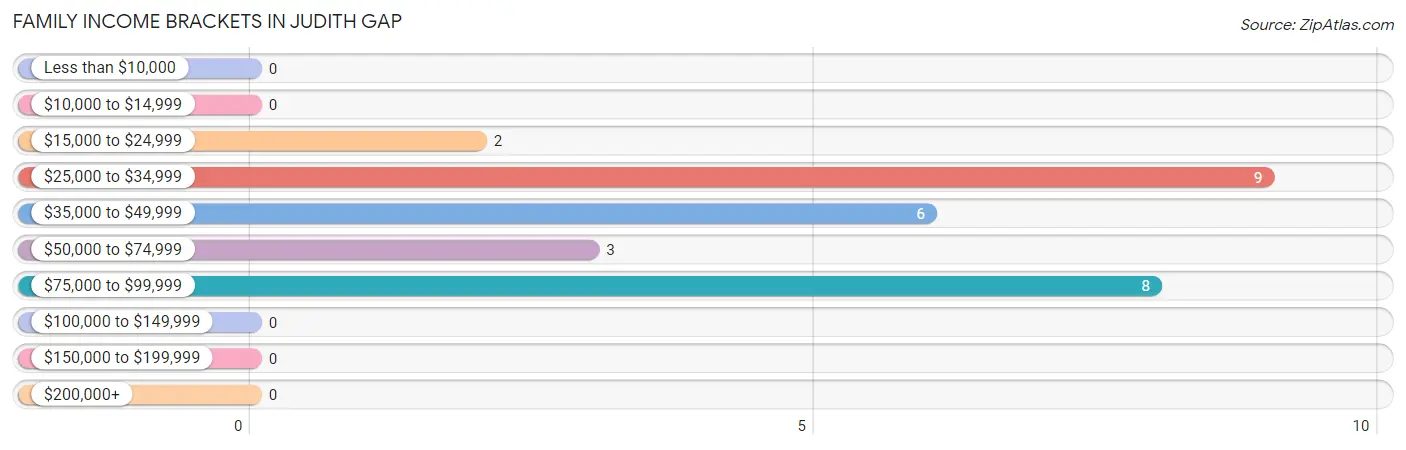
| Income Bracket | # Families | % Families |
| Less than $10,000 | 0 | 0.0% |
| $10,000 to $14,999 | 0 | 0.0% |
| $15,000 to $24,999 | 2 | 7.1% |
| $25,000 to $34,999 | 9 | 32.1% |
| $35,000 to $49,999 | 6 | 21.4% |
| $50,000 to $74,999 | 3 | 10.7% |
| $75,000 to $99,999 | 8 | 28.6% |
| $100,000 to $149,999 | 0 | 0.0% |
| $150,000 to $199,999 | 0 | 0.0% |
| $200,000+ | 0 | 0.0% |
Family Income by Famaliy Size in Judith Gap
3-person families (5 | 17.9%) account for the highest median family income in Judith Gap with $37,917 per family, while 2-person families (17 | 60.7%) have the highest median income of $17,188 per family member.
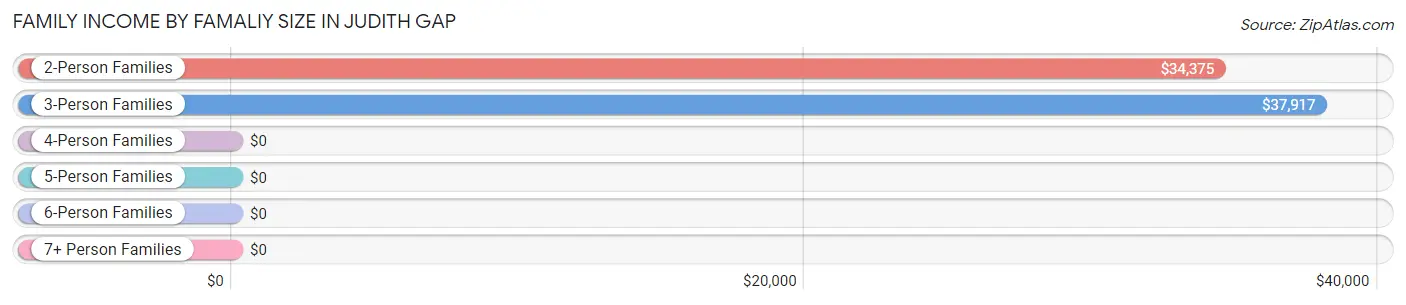
| Income Bracket | # Families | Median Income |
| 2-Person Families | 17 (60.7%) | $34,375 |
| 3-Person Families | 5 (17.9%) | $37,917 |
| 4-Person Families | 6 (21.4%) | $0 |
| 5-Person Families | 0 (0.0%) | $0 |
| 6-Person Families | 0 (0.0%) | $0 |
| 7+ Person Families | 0 (0.0%) | $0 |
| Total | 28 (100.0%) | $42,500 |
Family Income by Number of Earners in Judith Gap
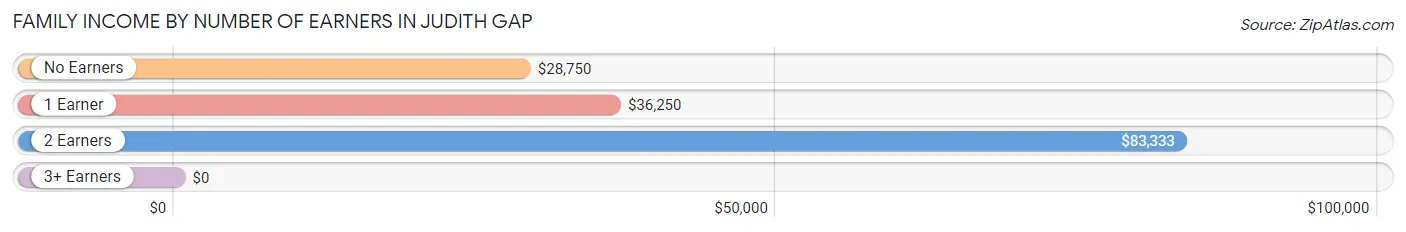
| Number of Earners | # Families | Median Income |
| No Earners | 8 (28.6%) | $28,750 |
| 1 Earner | 8 (28.6%) | $36,250 |
| 2 Earners | 12 (42.9%) | $83,333 |
| 3+ Earners | 0 (0.0%) | $0 |
| Total | 28 (100.0%) | $42,500 |
Household Income in Judith Gap
Household Income Brackets in Judith Gap
With 25 households falling in the category, the less than $10,000 income range is the most frequent in Judith Gap, accounting for 32.5% of all households.
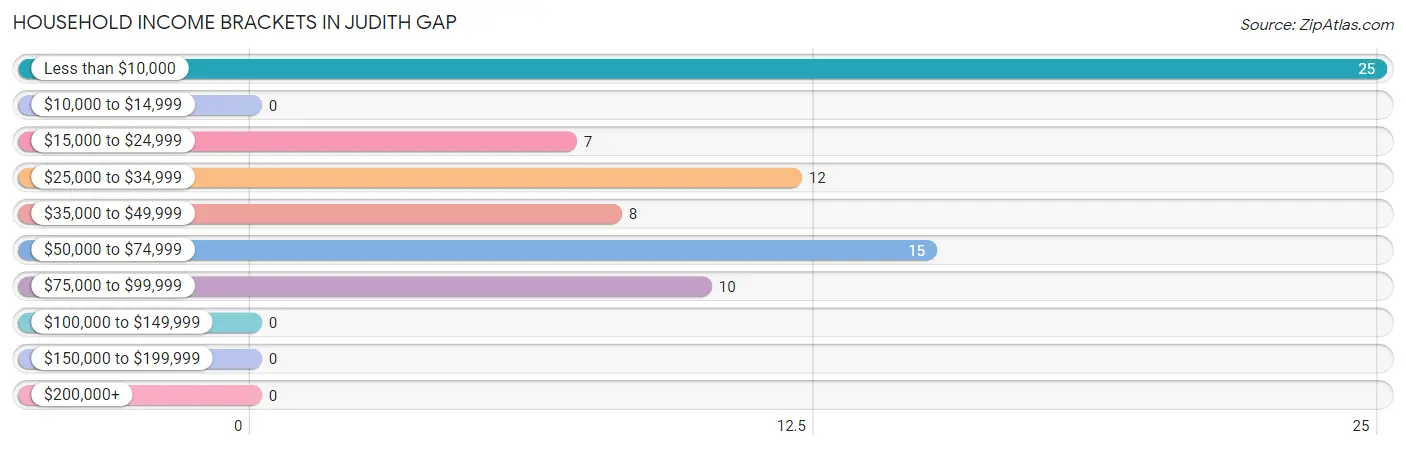
| Income Bracket | # Households | % Households |
| Less than $10,000 | 25 | 32.5% |
| $10,000 to $14,999 | 0 | 0.0% |
| $15,000 to $24,999 | 7 | 9.1% |
| $25,000 to $34,999 | 12 | 15.6% |
| $35,000 to $49,999 | 8 | 10.4% |
| $50,000 to $74,999 | 15 | 19.5% |
| $75,000 to $99,999 | 10 | 13.0% |
| $100,000 to $149,999 | 0 | 0.0% |
| $150,000 to $199,999 | 0 | 0.0% |
| $200,000+ | 0 | 0.0% |
Household Income by Householder Age in Judith Gap
The median household income in Judith Gap is $31,042, with the highest median household income of $70,208 found in the 45 to 64 years age bracket for the primary householder. A total of 15 households (19.5%) fall into this category.
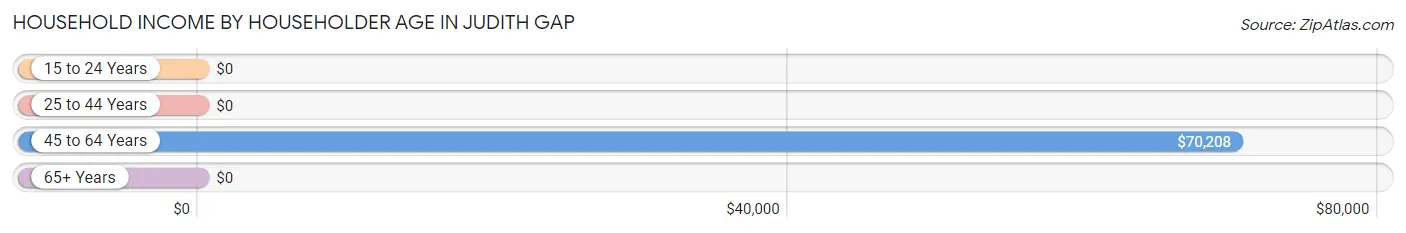
| Income Bracket | # Households | Median Income |
| 15 to 24 Years | 0 (0.0%) | $0 |
| 25 to 44 Years | 7 (9.1%) | $0 |
| 45 to 64 Years | 15 (19.5%) | $70,208 |
| 65+ Years | 55 (71.4%) | $0 |
| Total | 77 (100.0%) | $31,042 |
Poverty in Judith Gap
Income Below Poverty by Sex and Age in Judith Gap
With 29.1% poverty level for males and 18.5% for females among the residents of Judith Gap, 75 year old and over males and 25 to 34 year old females are the most vulnerable to poverty, with 25 males (71.4%) and 3 females (75.0%) in their respective age groups living below the poverty level.
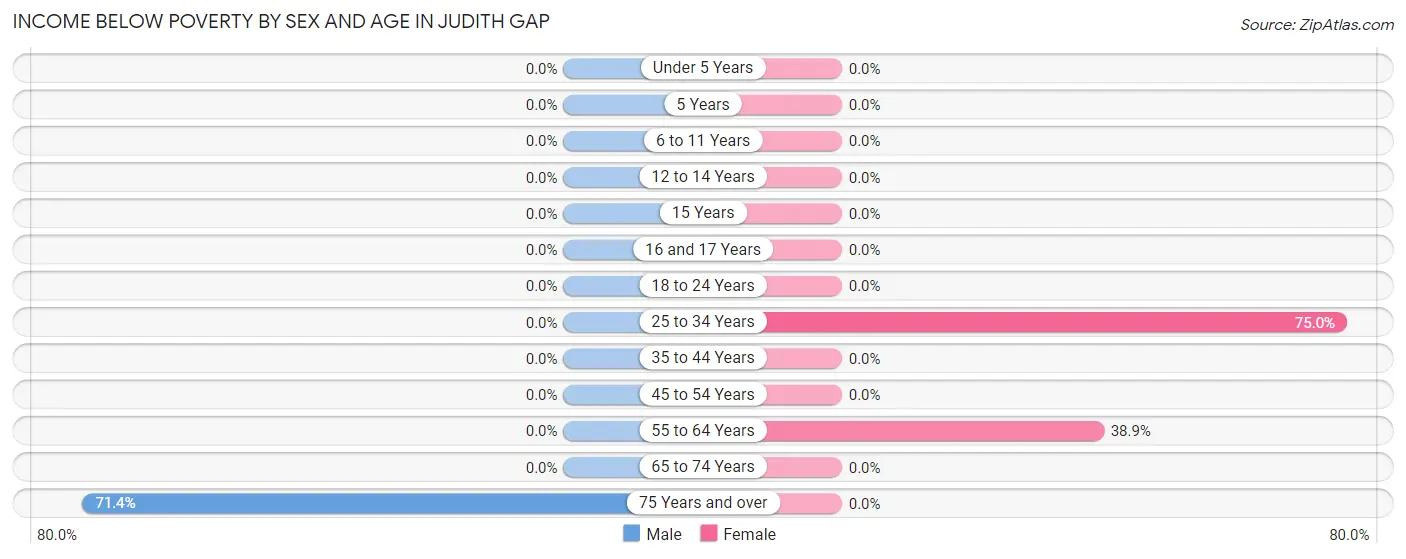
| Age Bracket | Male | Female |
| Under 5 Years | 0 (0.0%) | 0 (0.0%) |
| 5 Years | 0 (0.0%) | 0 (0.0%) |
| 6 to 11 Years | 0 (0.0%) | 0 (0.0%) |
| 12 to 14 Years | 0 (0.0%) | 0 (0.0%) |
| 15 Years | 0 (0.0%) | 0 (0.0%) |
| 16 and 17 Years | 0 (0.0%) | 0 (0.0%) |
| 18 to 24 Years | 0 (0.0%) | 0 (0.0%) |
| 25 to 34 Years | 0 (0.0%) | 3 (75.0%) |
| 35 to 44 Years | 0 (0.0%) | 0 (0.0%) |
| 45 to 54 Years | 0 (0.0%) | 0 (0.0%) |
| 55 to 64 Years | 0 (0.0%) | 7 (38.9%) |
| 65 to 74 Years | 0 (0.0%) | 0 (0.0%) |
| 75 Years and over | 25 (71.4%) | 0 (0.0%) |
| Total | 25 (29.1%) | 10 (18.5%) |
Income Above Poverty by Sex and Age in Judith Gap
According to the poverty statistics in Judith Gap, males aged under 5 years and females aged 12 to 14 years are the age groups that are most secure financially, with 100.0% of males and 100.0% of females in these age groups living above the poverty line.
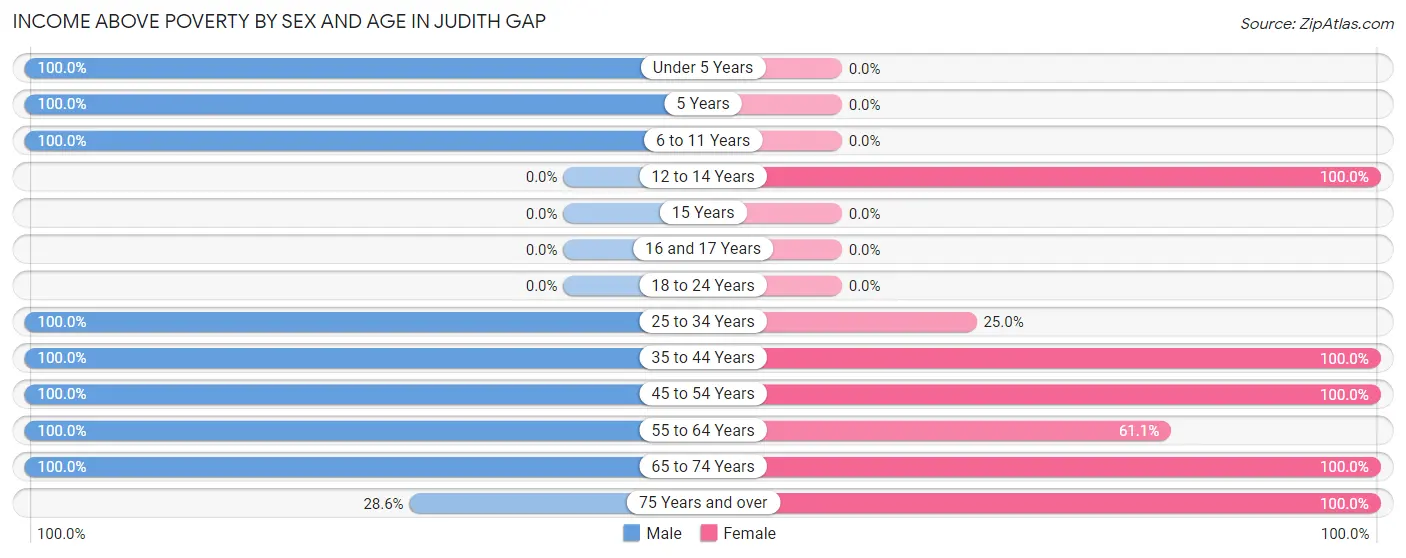
| Age Bracket | Male | Female |
| Under 5 Years | 5 (100.0%) | 0 (0.0%) |
| 5 Years | 2 (100.0%) | 0 (0.0%) |
| 6 to 11 Years | 8 (100.0%) | 0 (0.0%) |
| 12 to 14 Years | 0 (0.0%) | 10 (100.0%) |
| 15 Years | 0 (0.0%) | 0 (0.0%) |
| 16 and 17 Years | 0 (0.0%) | 0 (0.0%) |
| 18 to 24 Years | 0 (0.0%) | 0 (0.0%) |
| 25 to 34 Years | 2 (100.0%) | 1 (25.0%) |
| 35 to 44 Years | 6 (100.0%) | 4 (100.0%) |
| 45 to 54 Years | 4 (100.0%) | 2 (100.0%) |
| 55 to 64 Years | 10 (100.0%) | 11 (61.1%) |
| 65 to 74 Years | 14 (100.0%) | 8 (100.0%) |
| 75 Years and over | 10 (28.6%) | 8 (100.0%) |
| Total | 61 (70.9%) | 44 (81.5%) |
Income Below Poverty Among Married-Couple Families in Judith Gap
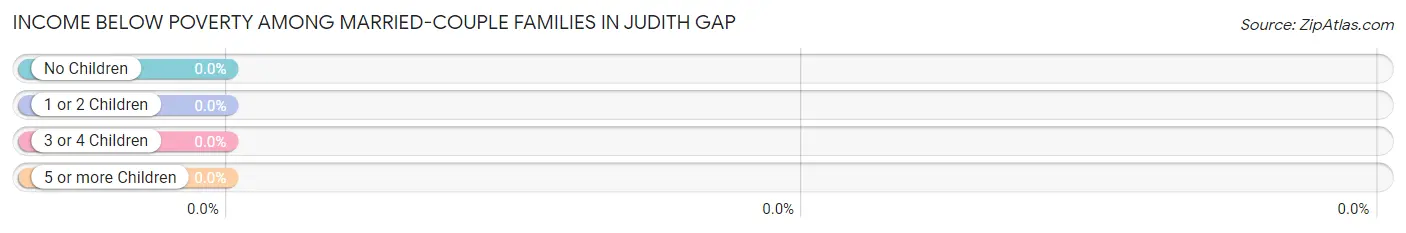
| Children | Above Poverty | Below Poverty |
| No Children | 15 (100.0%) | 0 (0.0%) |
| 1 or 2 Children | 9 (100.0%) | 0 (0.0%) |
| 3 or 4 Children | 0 (0.0%) | 0 (0.0%) |
| 5 or more Children | 0 (0.0%) | 0 (0.0%) |
| Total | 24 (100.0%) | 0 (0.0%) |
Income Below Poverty Among Single-Parent Households in Judith Gap
| Children | Single Father | Single Mother |
| No Children | 0 (0.0%) | 0 (0.0%) |
| 1 or 2 Children | 0 (0.0%) | 0 (0.0%) |
| 3 or 4 Children | 0 (0.0%) | 0 (0.0%) |
| 5 or more Children | 0 (0.0%) | 0 (0.0%) |
| Total | 0 (0.0%) | 0 (0.0%) |
Income Below Poverty Among Married-Couple vs Single-Parent Households in Judith Gap
| Children | Married-Couple Families | Single-Parent Households |
| No Children | 0 (0.0%) | 0 (0.0%) |
| 1 or 2 Children | 0 (0.0%) | 0 (0.0%) |
| 3 or 4 Children | 0 (0.0%) | 0 (0.0%) |
| 5 or more Children | 0 (0.0%) | 0 (0.0%) |
| Total | 0 (0.0%) | 0 (0.0%) |
Race in Judith Gap
The most populous races in Judith Gap are , and White / Caucasian (140 | 100.0%).
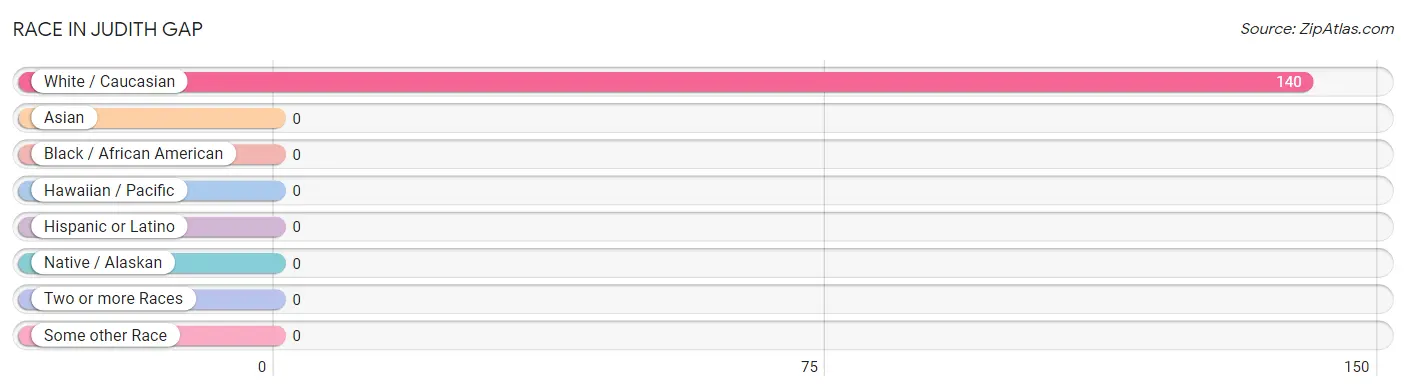
| Race | # Population | % Population |
| Asian | 0 | 0.0% |
| Black / African American | 0 | 0.0% |
| Hawaiian / Pacific | 0 | 0.0% |
| Hispanic or Latino | 0 | 0.0% |
| Native / Alaskan | 0 | 0.0% |
| White / Caucasian | 140 | 100.0% |
| Two or more Races | 0 | 0.0% |
| Some other Race | 0 | 0.0% |
| Total | 140 | 100.0% |
Ancestry in Judith Gap
The most populous ancestries reported in Judith Gap are Italian (24 | 17.1%), Norwegian (24 | 17.1%), German (18 | 12.9%), American (11 | 7.9%), and French (6 | 4.3%), together accounting for 59.3% of all Judith Gap residents.
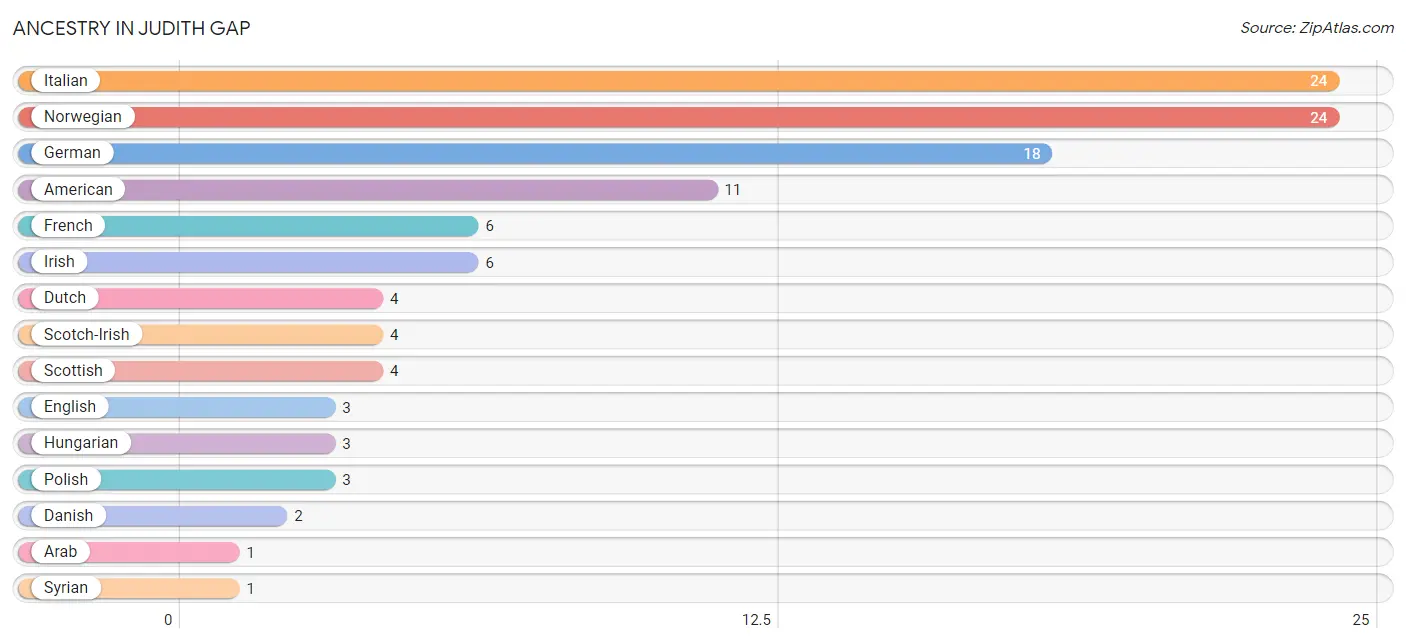
| Ancestry | # Population | % Population |
| American | 11 | 7.9% |
| Arab | 1 | 0.7% |
| Danish | 2 | 1.4% |
| Dutch | 4 | 2.9% |
| English | 3 | 2.1% |
| French | 6 | 4.3% |
| German | 18 | 12.9% |
| Hungarian | 3 | 2.1% |
| Irish | 6 | 4.3% |
| Italian | 24 | 17.1% |
| Norwegian | 24 | 17.1% |
| Polish | 3 | 2.1% |
| Scotch-Irish | 4 | 2.9% |
| Scottish | 4 | 2.9% |
| Syrian | 1 | 0.7% | View All 15 Rows |
Immigrants in Judith Gap

| Immigration Origin | # Population | % Population | View All 0 Rows |
Sex and Age in Judith Gap
Sex and Age in Judith Gap
The most populous age groups in Judith Gap are 75 to 79 Years (29 | 33.7%) for men and 60 to 64 Years (15 | 27.8%) for women.
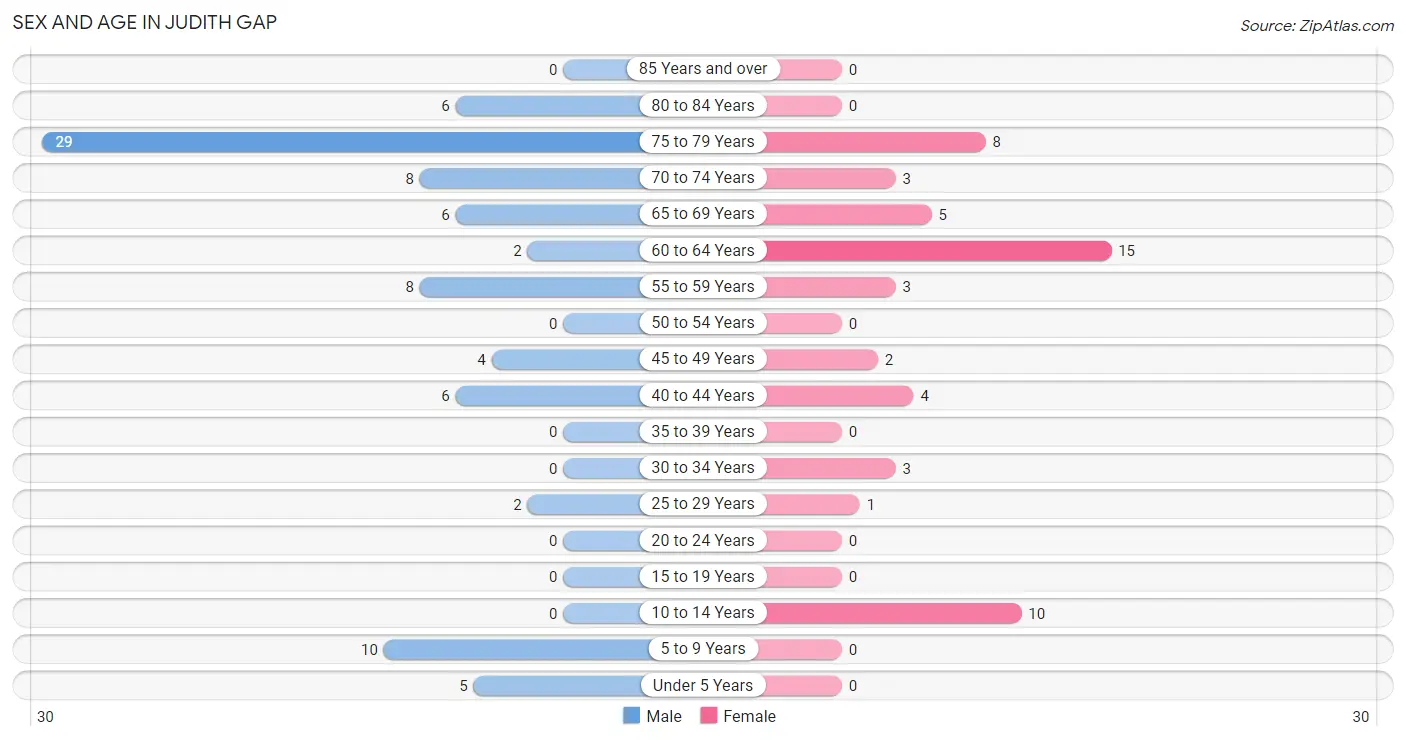
| Age Bracket | Male | Female |
| Under 5 Years | 5 (5.8%) | 0 (0.0%) |
| 5 to 9 Years | 10 (11.6%) | 0 (0.0%) |
| 10 to 14 Years | 0 (0.0%) | 10 (18.5%) |
| 15 to 19 Years | 0 (0.0%) | 0 (0.0%) |
| 20 to 24 Years | 0 (0.0%) | 0 (0.0%) |
| 25 to 29 Years | 2 (2.3%) | 1 (1.8%) |
| 30 to 34 Years | 0 (0.0%) | 3 (5.6%) |
| 35 to 39 Years | 0 (0.0%) | 0 (0.0%) |
| 40 to 44 Years | 6 (7.0%) | 4 (7.4%) |
| 45 to 49 Years | 4 (4.6%) | 2 (3.7%) |
| 50 to 54 Years | 0 (0.0%) | 0 (0.0%) |
| 55 to 59 Years | 8 (9.3%) | 3 (5.6%) |
| 60 to 64 Years | 2 (2.3%) | 15 (27.8%) |
| 65 to 69 Years | 6 (7.0%) | 5 (9.3%) |
| 70 to 74 Years | 8 (9.3%) | 3 (5.6%) |
| 75 to 79 Years | 29 (33.7%) | 8 (14.8%) |
| 80 to 84 Years | 6 (7.0%) | 0 (0.0%) |
| 85 Years and over | 0 (0.0%) | 0 (0.0%) |
| Total | 86 (100.0%) | 54 (100.0%) |
Families and Households in Judith Gap
Median Family Size in Judith Gap
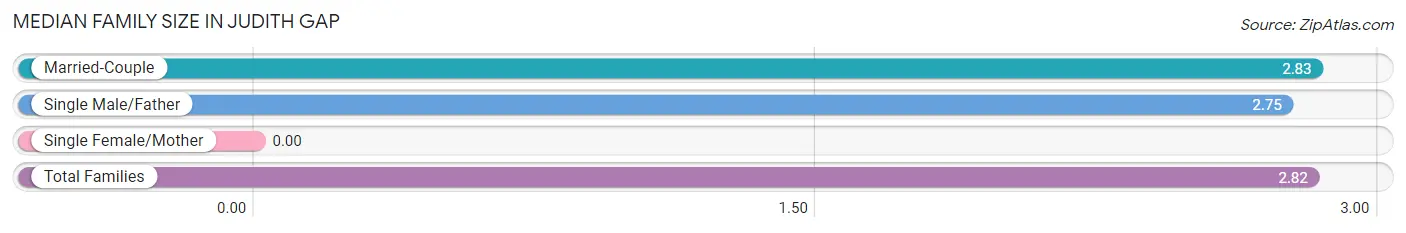
| Family Type | # Families | Family Size |
| Married-Couple | 24 (85.7%) | 2.83 |
| Single Male/Father | 4 (14.3%) | 2.75 |
| Single Female/Mother | 0 (0.0%) | - |
| Total Families | 28 (100.0%) | 2.82 |
Median Household Size in Judith Gap
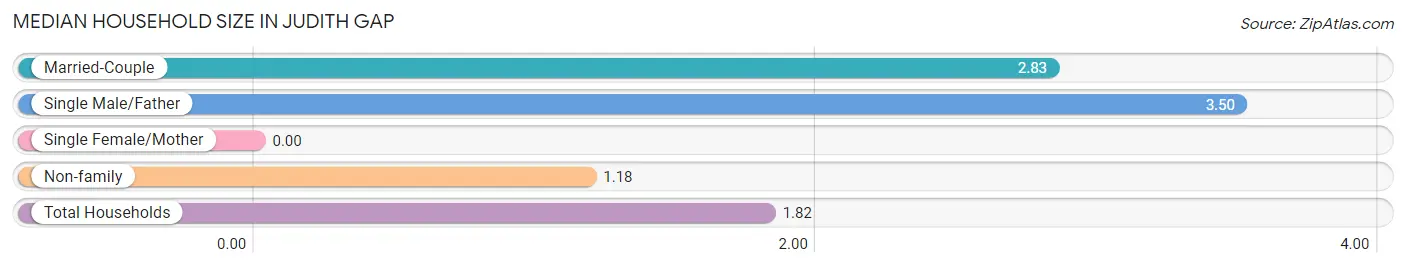
| Household Type | # Households | Household Size |
| Married-Couple | 24 (31.2%) | 2.83 |
| Single Male/Father | 4 (5.2%) | 3.50 |
| Single Female/Mother | 0 (0.0%) | - |
| Non-family | 49 (63.6%) | 1.18 |
| Total Households | 77 (100.0%) | 1.82 |
Household Size by Marriage Status in Judith Gap
Out of a total of 77 households in Judith Gap, 28 (36.4%) are family households, while 49 (63.6%) are nonfamily households. The most numerous type of family households are 2-person households, comprising 15, and the most common type of nonfamily households are 1-person households, comprising 41.
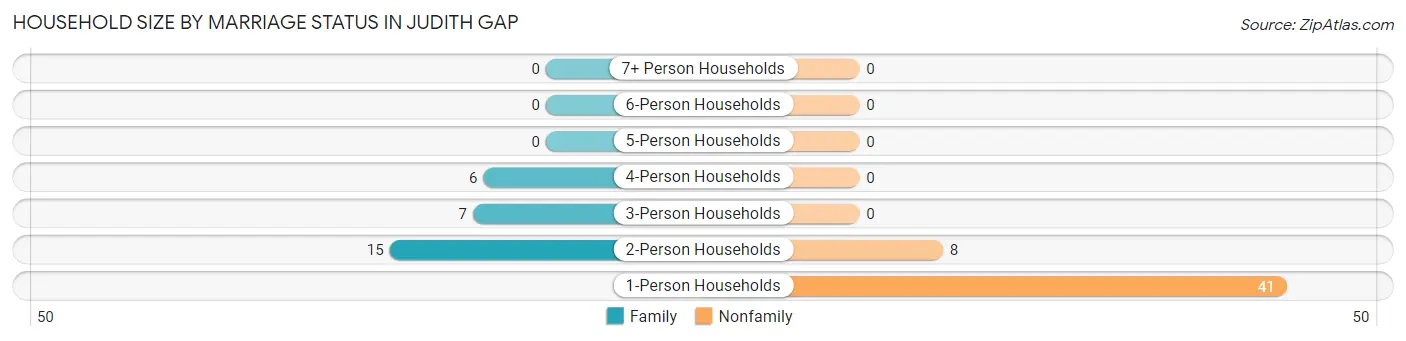
| Household Size | Family Households | Nonfamily Households |
| 1-Person Households | - | 41 (53.2%) |
| 2-Person Households | 15 (19.5%) | 8 (10.4%) |
| 3-Person Households | 7 (9.1%) | 0 (0.0%) |
| 4-Person Households | 6 (7.8%) | 0 (0.0%) |
| 5-Person Households | 0 (0.0%) | 0 (0.0%) |
| 6-Person Households | 0 (0.0%) | 0 (0.0%) |
| 7+ Person Households | 0 (0.0%) | 0 (0.0%) |
| Total | 28 (36.4%) | 49 (63.6%) |
Female Fertility in Judith Gap
Fertility by Age in Judith Gap
| Age Bracket | Women with Births | Births / 1,000 Women |
| 15 to 19 years | 0 (0.0%) | 0.0 |
| 20 to 34 years | 0 (0.0%) | 0.0 |
| 35 to 50 years | 0 (0.0%) | 0.0 |
| Total | 0 (0.0%) | 0.0 |
Fertility by Age by Marriage Status in Judith Gap
| Age Bracket | Married | Unmarried |
| 15 to 19 years | 0 (0.0%) | 0 (0.0%) |
| 20 to 34 years | 0 (0.0%) | 0 (0.0%) |
| 35 to 50 years | 0 (0.0%) | 0 (0.0%) |
| Total | 0 (0.0%) | 0 (0.0%) |
Fertility by Education in Judith Gap
| Educational Attainment | Women with Births | Births / 1,000 Women |
| Less than High School | 0 (0.0%) | 0.0 |
| High School Diploma | 0 (0.0%) | 0.0 |
| College or Associate's Degree | 0 (0.0%) | 0.0 |
| Bachelor's Degree | 0 (0.0%) | 0.0 |
| Graduate Degree | 0 (0.0%) | 0.0 |
| Total | 0 (0.0%) | 0.0 |
Fertility by Education by Marriage Status in Judith Gap
| Educational Attainment | Married | Unmarried |
| Less than High School | 0 (0.0%) | 0 (0.0%) |
| High School Diploma | 0 (0.0%) | 0 (0.0%) |
| College or Associate's Degree | 0 (0.0%) | 0 (0.0%) |
| Bachelor's Degree | 0 (0.0%) | 0 (0.0%) |
| Graduate Degree | 0 (0.0%) | 0 (0.0%) |
| Total | 0 (0.0%) | 0 (0.0%) |
Employment Characteristics in Judith Gap
Employment by Class of Employer in Judith Gap
Among the 52 employed individuals in Judith Gap, private company employees (31 | 59.6%), self-employed (not incorporated) (8 | 15.4%), and not-for-profit organizations (6 | 11.5%) make up the most common classes of employment.
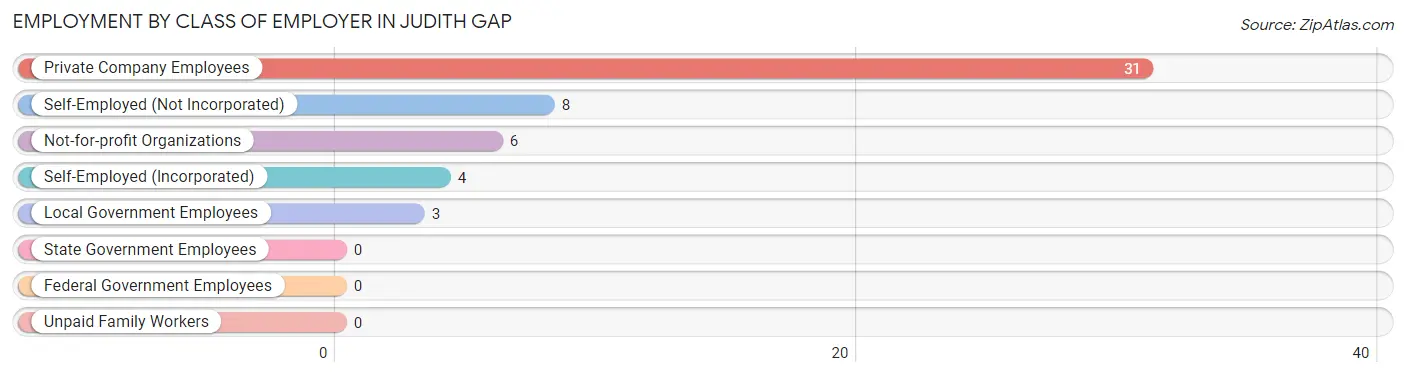
| Employer Class | # Employees | % Employees |
| Private Company Employees | 31 | 59.6% |
| Self-Employed (Incorporated) | 4 | 7.7% |
| Self-Employed (Not Incorporated) | 8 | 15.4% |
| Not-for-profit Organizations | 6 | 11.5% |
| Local Government Employees | 3 | 5.8% |
| State Government Employees | 0 | 0.0% |
| Federal Government Employees | 0 | 0.0% |
| Unpaid Family Workers | 0 | 0.0% |
| Total | 52 | 100.0% |
Employment Status by Age in Judith Gap
According to the labor force statistics for Judith Gap, out of the total population over 16 years of age (115), 53.0% or 61 individuals are in the labor force, with 3.3% or 2 of them unemployed. The age group with the highest labor force participation rate is 25 to 29 years, with 100.0% or 3 individuals in the labor force. Within the labor force, the 45 to 54 years age range has the highest percentage of unemployed individuals, with 33.3% or 2 of them being unemployed.
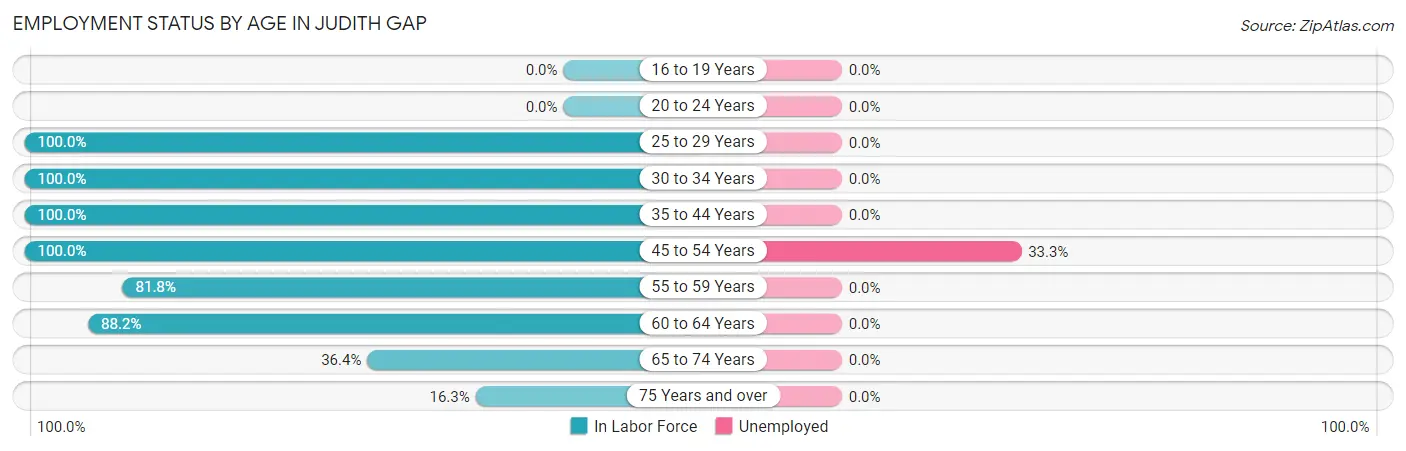
| Age Bracket | In Labor Force | Unemployed |
| 16 to 19 Years | 0 (0.0%) | 0 (0.0%) |
| 20 to 24 Years | 0 (0.0%) | 0 (0.0%) |
| 25 to 29 Years | 3 (100.0%) | 0 (0.0%) |
| 30 to 34 Years | 3 (100.0%) | 0 (0.0%) |
| 35 to 44 Years | 10 (100.0%) | 0 (0.0%) |
| 45 to 54 Years | 6 (100.0%) | 2 (33.3%) |
| 55 to 59 Years | 9 (81.8%) | 0 (0.0%) |
| 60 to 64 Years | 15 (88.2%) | 0 (0.0%) |
| 65 to 74 Years | 8 (36.4%) | 0 (0.0%) |
| 75 Years and over | 7 (16.3%) | 0 (0.0%) |
| Total | 61 (53.0%) | 2 (3.3%) |
Employment Status by Educational Attainment in Judith Gap
According to labor force statistics for Judith Gap, 92.0% of individuals (46) out of the total population between 25 and 64 years of age (50) are in the labor force, with 4.3% or 2 of them being unemployed. The group with the highest labor force participation rate are those with the educational attainment of college / associate degree, with 100.0% or 13 individuals in the labor force. Within the labor force, individuals with college / associate degree education have the highest percentage of unemployment, with 15.4% or 2 of them being unemployed.
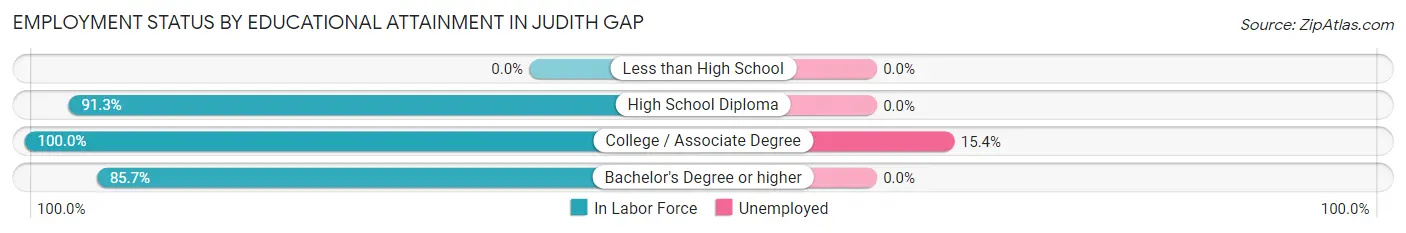
| Educational Attainment | In Labor Force | Unemployed |
| Less than High School | 0 (0.0%) | 0 (0.0%) |
| High School Diploma | 21 (91.3%) | 0 (0.0%) |
| College / Associate Degree | 13 (100.0%) | 2 (15.4%) |
| Bachelor's Degree or higher | 12 (85.7%) | 0 (0.0%) |
| Total | 46 (92.0%) | 2 (4.3%) |
Employment Occupations by Sex in Judith Gap
Management, Business, Science and Arts Occupations
The most common Management, Business, Science and Arts occupations in Judith Gap are Health Diagnosing & Treating (6 | 10.2%), and Management (4 | 6.8%).
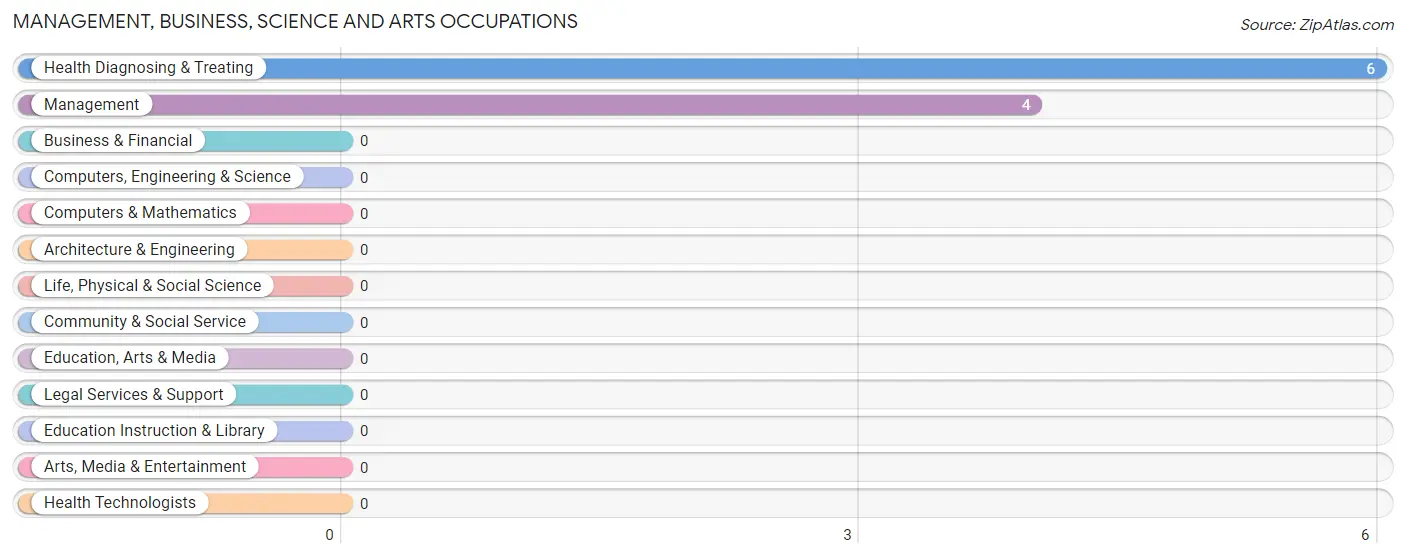
Management, Business, Science and Arts Occupations by Sex
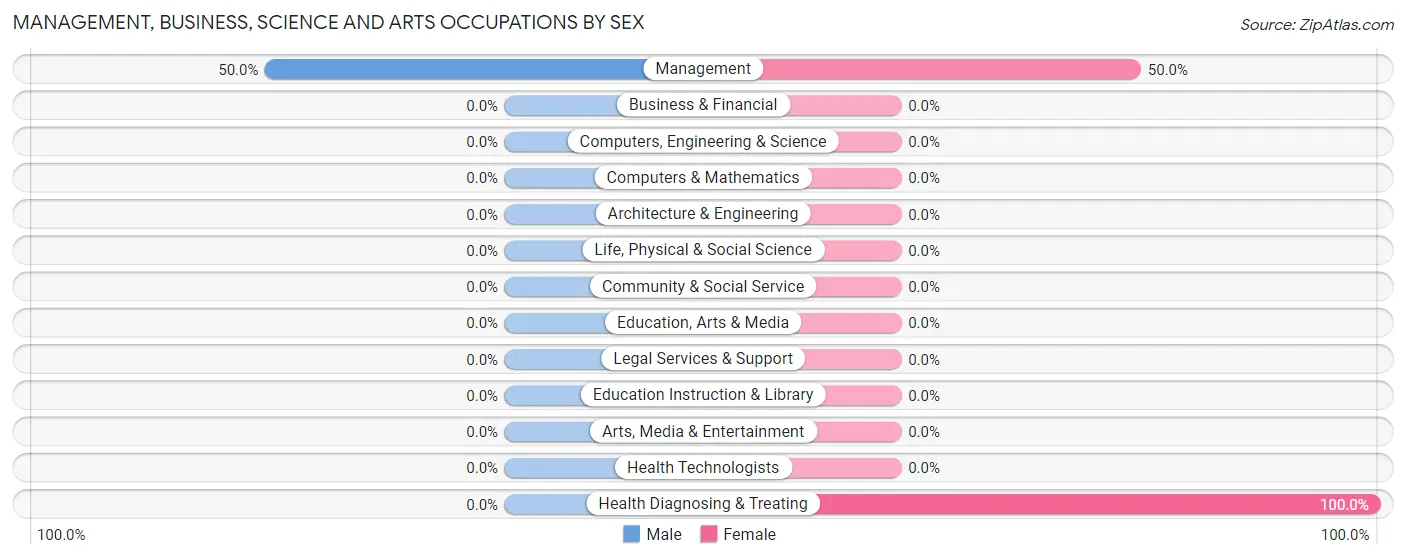
| Occupation | Male | Female |
| Management | 2 (50.0%) | 2 (50.0%) |
| Business & Financial | 0 (0.0%) | 0 (0.0%) |
| Computers, Engineering & Science | 0 (0.0%) | 0 (0.0%) |
| Computers & Mathematics | 0 (0.0%) | 0 (0.0%) |
| Architecture & Engineering | 0 (0.0%) | 0 (0.0%) |
| Life, Physical & Social Science | 0 (0.0%) | 0 (0.0%) |
| Community & Social Service | 0 (0.0%) | 0 (0.0%) |
| Education, Arts & Media | 0 (0.0%) | 0 (0.0%) |
| Legal Services & Support | 0 (0.0%) | 0 (0.0%) |
| Education Instruction & Library | 0 (0.0%) | 0 (0.0%) |
| Arts, Media & Entertainment | 0 (0.0%) | 0 (0.0%) |
| Health Diagnosing & Treating | 0 (0.0%) | 6 (100.0%) |
| Health Technologists | 0 (0.0%) | 0 (0.0%) |
| Total (Category) | 2 (20.0%) | 8 (80.0%) |
| Total (Overall) | 27 (45.8%) | 32 (54.2%) |
Services Occupations
The most common Services occupations in Judith Gap are Food Preparation & Serving (9 | 15.2%), and Healthcare Support (8 | 13.6%).
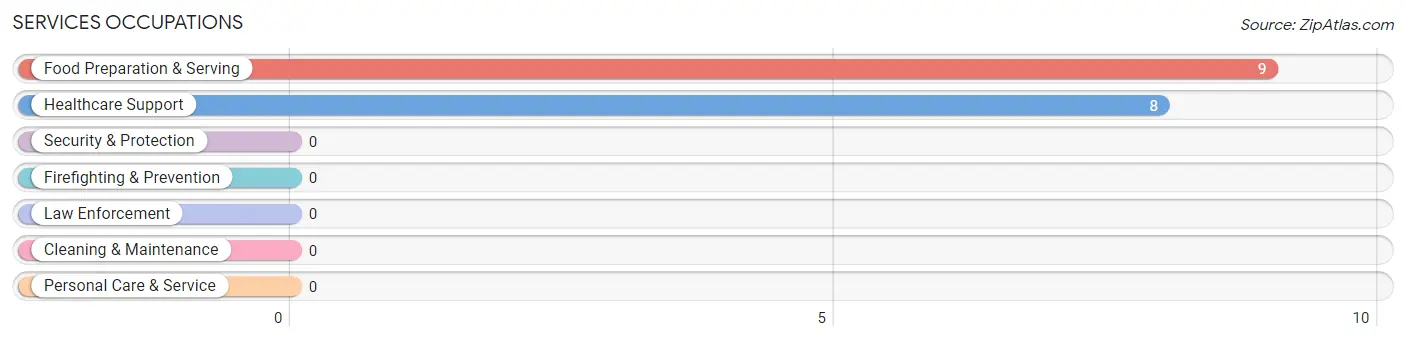
Services Occupations by Sex
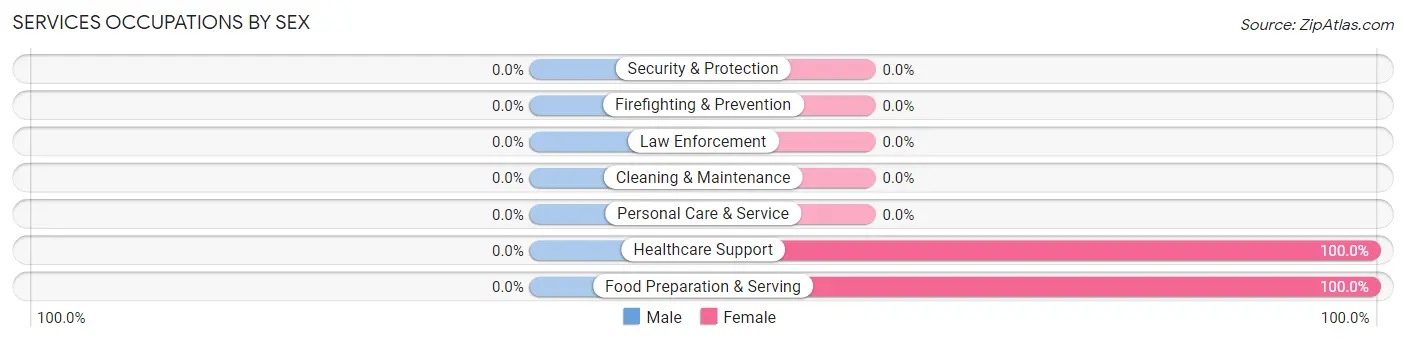
| Occupation | Male | Female |
| Healthcare Support | 0 (0.0%) | 8 (100.0%) |
| Security & Protection | 0 (0.0%) | 0 (0.0%) |
| Firefighting & Prevention | 0 (0.0%) | 0 (0.0%) |
| Law Enforcement | 0 (0.0%) | 0 (0.0%) |
| Food Preparation & Serving | 0 (0.0%) | 9 (100.0%) |
| Cleaning & Maintenance | 0 (0.0%) | 0 (0.0%) |
| Personal Care & Service | 0 (0.0%) | 0 (0.0%) |
| Total (Category) | 0 (0.0%) | 17 (100.0%) |
| Total (Overall) | 27 (45.8%) | 32 (54.2%) |
Sales and Office Occupations
The most common Sales and Office occupations in Judith Gap are , and Office & Administration (4 | 6.8%).
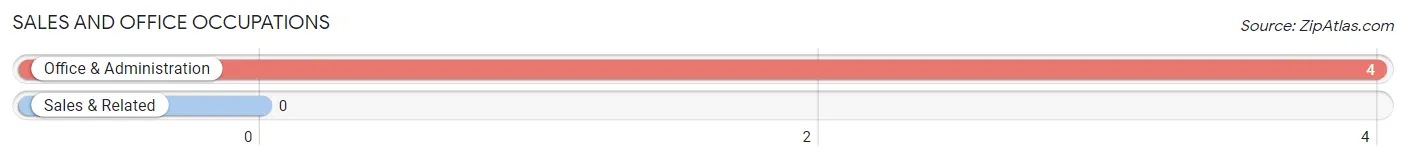
Sales and Office Occupations by Sex
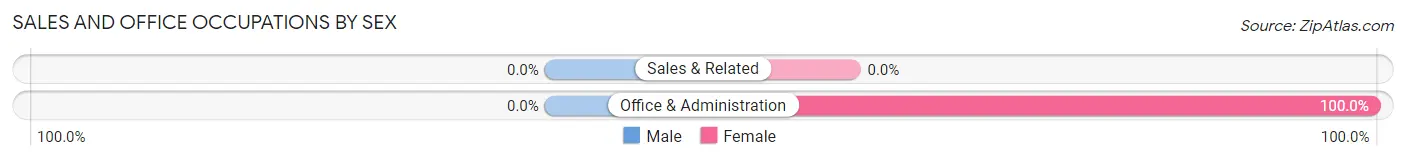
| Occupation | Male | Female |
| Sales & Related | 0 (0.0%) | 0 (0.0%) |
| Office & Administration | 0 (0.0%) | 4 (100.0%) |
| Total (Category) | 0 (0.0%) | 4 (100.0%) |
| Total (Overall) | 27 (45.8%) | 32 (54.2%) |
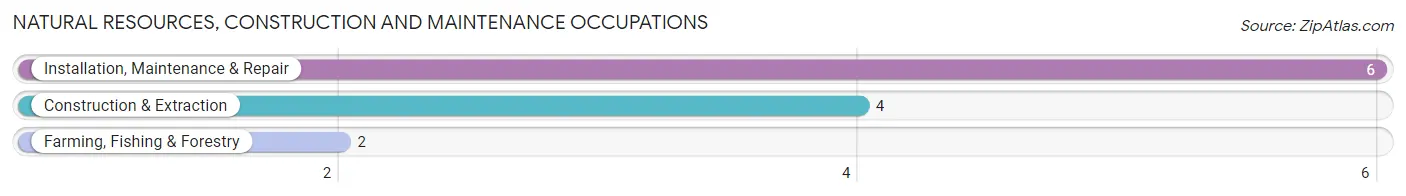
Natural Resources, Construction and Maintenance Occupations
The most common Natural Resources, Construction and Maintenance occupations in Judith Gap are Installation, Maintenance & Repair (6 | 10.2%), Construction & Extraction (4 | 6.8%), and Farming, Fishing & Forestry (2 | 3.4%).
Natural Resources, Construction and Maintenance Occupations by Sex
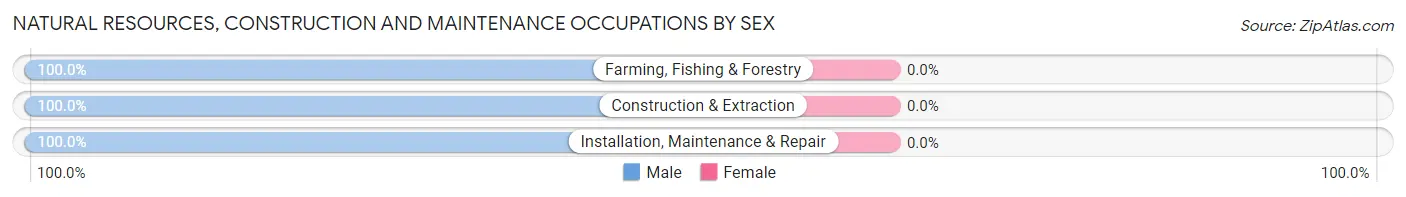
| Occupation | Male | Female |
| Farming, Fishing & Forestry | 2 (100.0%) | 0 (0.0%) |
| Construction & Extraction | 4 (100.0%) | 0 (0.0%) |
| Installation, Maintenance & Repair | 6 (100.0%) | 0 (0.0%) |
| Total (Category) | 12 (100.0%) | 0 (0.0%) |
| Total (Overall) | 27 (45.8%) | 32 (54.2%) |
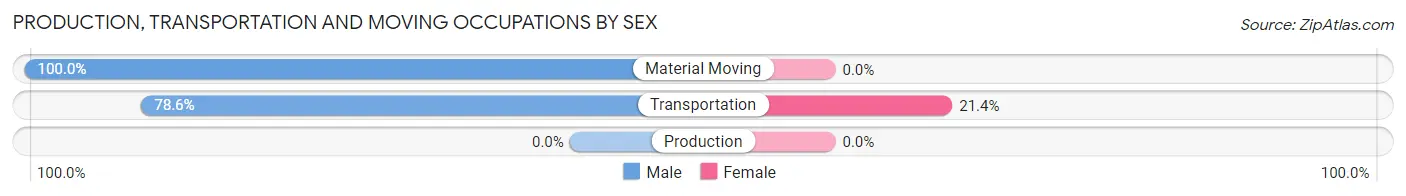
Production, Transportation and Moving Occupations
The most common Production, Transportation and Moving occupations in Judith Gap are Transportation (14 | 23.7%), and Material Moving (2 | 3.4%).
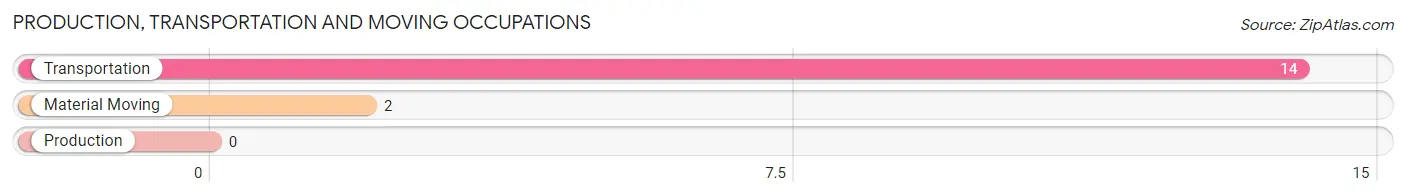
Production, Transportation and Moving Occupations by Sex
| Occupation | Male | Female |
| Production | 0 (0.0%) | 0 (0.0%) |
| Transportation | 11 (78.6%) | 3 (21.4%) |
| Material Moving | 2 (100.0%) | 0 (0.0%) |
| Total (Category) | 13 (81.2%) | 3 (18.8%) |
| Total (Overall) | 27 (45.8%) | 32 (54.2%) |
Employment Industries by Sex in Judith Gap
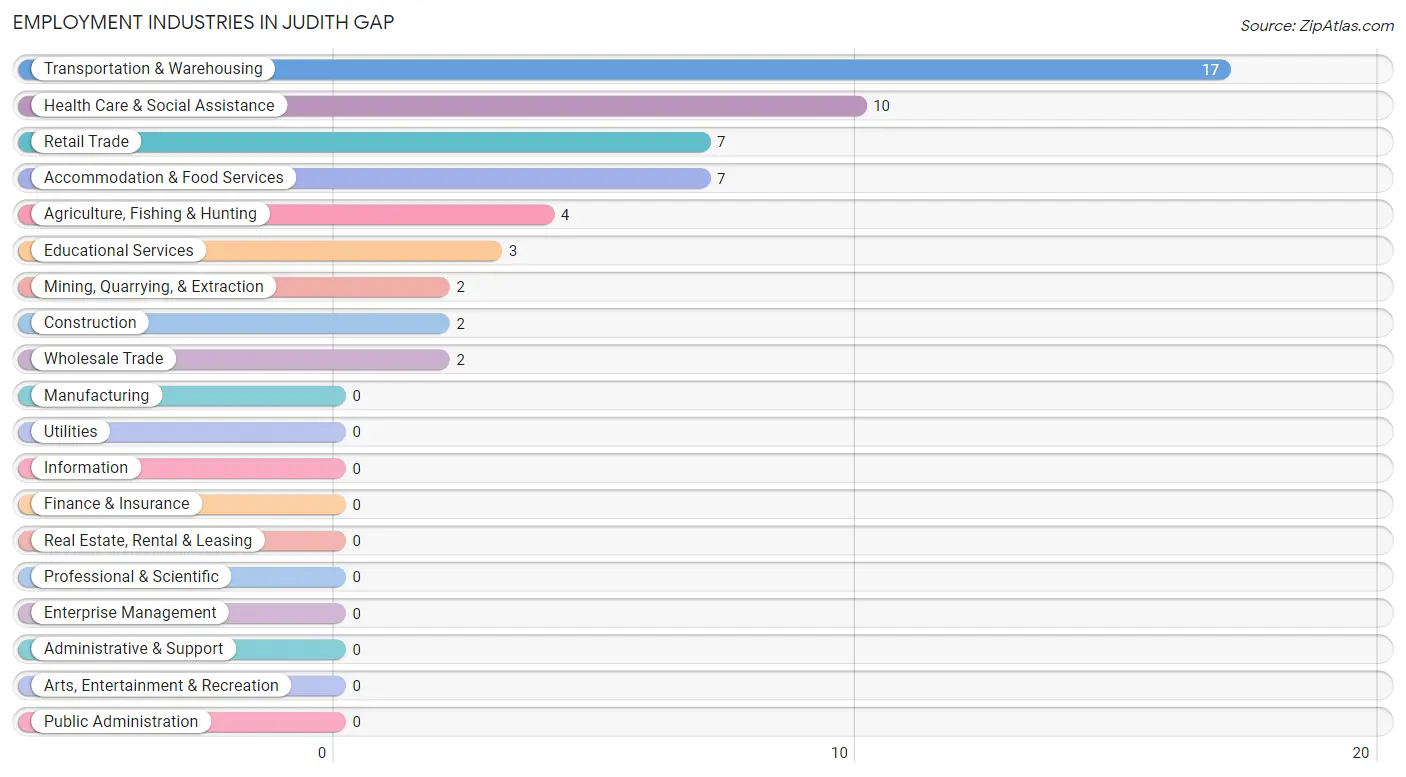
Employment Industries in Judith Gap
The major employment industries in Judith Gap include Transportation & Warehousing (17 | 28.8%), Health Care & Social Assistance (10 | 17.0%), Retail Trade (7 | 11.9%), Accommodation & Food Services (7 | 11.9%), and Agriculture, Fishing & Hunting (4 | 6.8%).
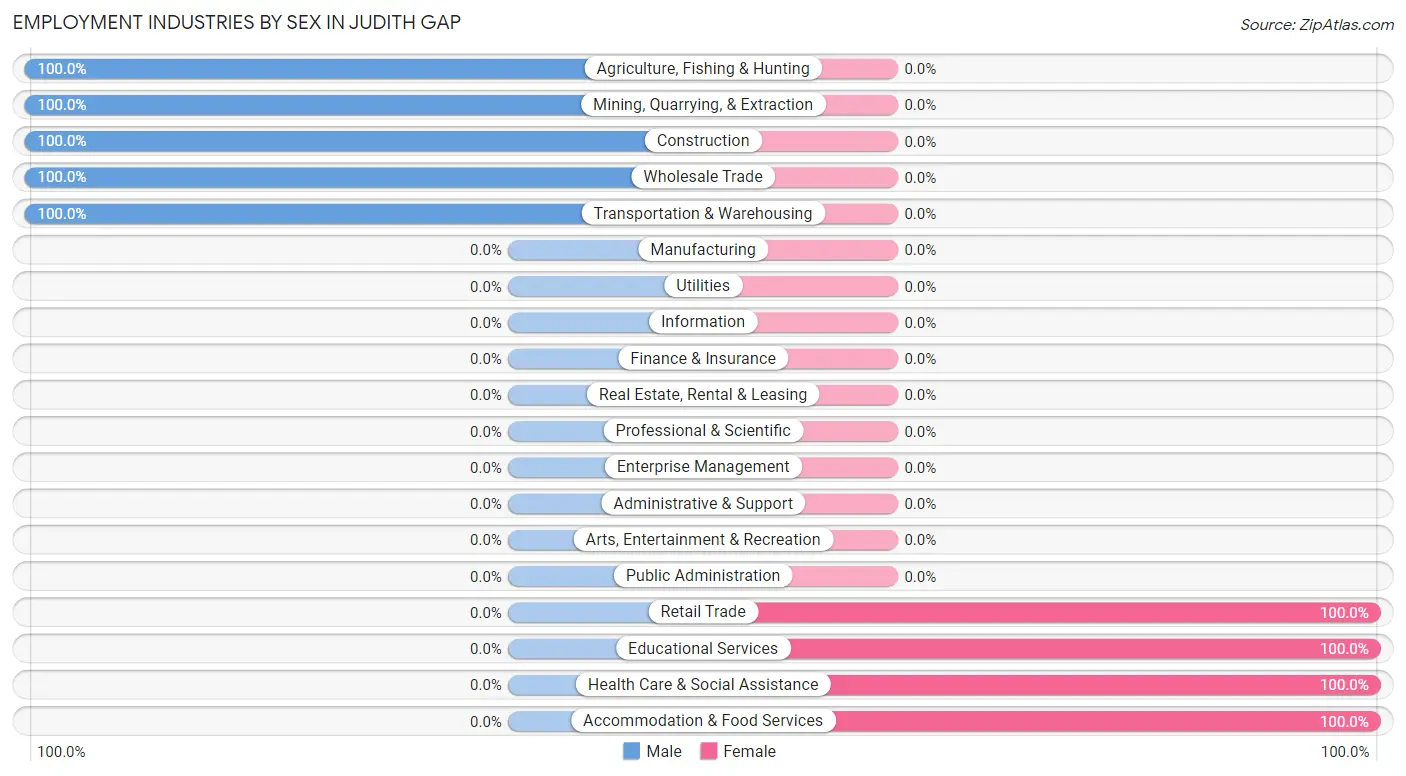
Employment Industries by Sex in Judith Gap
The Judith Gap industries that see more men than women are Agriculture, Fishing & Hunting (100.0%), Mining, Quarrying, & Extraction (100.0%), and Construction (100.0%), whereas the industries that tend to have a higher number of women are Retail Trade (100.0%), Educational Services (100.0%), and Health Care & Social Assistance (100.0%).
| Industry | Male | Female |
| Agriculture, Fishing & Hunting | 4 (100.0%) | 0 (0.0%) |
| Mining, Quarrying, & Extraction | 2 (100.0%) | 0 (0.0%) |
| Construction | 2 (100.0%) | 0 (0.0%) |
| Manufacturing | 0 (0.0%) | 0 (0.0%) |
| Wholesale Trade | 2 (100.0%) | 0 (0.0%) |
| Retail Trade | 0 (0.0%) | 7 (100.0%) |
| Transportation & Warehousing | 17 (100.0%) | 0 (0.0%) |
| Utilities | 0 (0.0%) | 0 (0.0%) |
| Information | 0 (0.0%) | 0 (0.0%) |
| Finance & Insurance | 0 (0.0%) | 0 (0.0%) |
| Real Estate, Rental & Leasing | 0 (0.0%) | 0 (0.0%) |
| Professional & Scientific | 0 (0.0%) | 0 (0.0%) |
| Enterprise Management | 0 (0.0%) | 0 (0.0%) |
| Administrative & Support | 0 (0.0%) | 0 (0.0%) |
| Educational Services | 0 (0.0%) | 3 (100.0%) |
| Health Care & Social Assistance | 0 (0.0%) | 10 (100.0%) |
| Arts, Entertainment & Recreation | 0 (0.0%) | 0 (0.0%) |
| Accommodation & Food Services | 0 (0.0%) | 7 (100.0%) |
| Public Administration | 0 (0.0%) | 0 (0.0%) |
| Total | 27 (45.8%) | 32 (54.2%) |
Education in Judith Gap
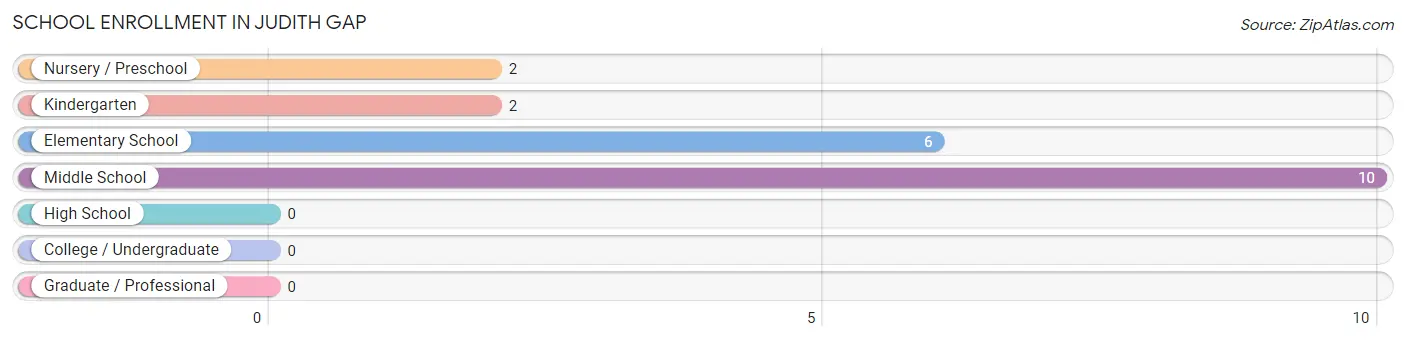
School Enrollment in Judith Gap
The most common levels of schooling among the 20 students in Judith Gap are middle school (10 | 50.0%), elementary school (6 | 30.0%), and nursery / preschool (2 | 10.0%).
| School Level | # Students | % Students |
| Nursery / Preschool | 2 | 10.0% |
| Kindergarten | 2 | 10.0% |
| Elementary School | 6 | 30.0% |
| Middle School | 10 | 50.0% |
| High School | 0 | 0.0% |
| College / Undergraduate | 0 | 0.0% |
| Graduate / Professional | 0 | 0.0% |
| Total | 20 | 100.0% |
School Enrollment by Age by Funding Source in Judith Gap
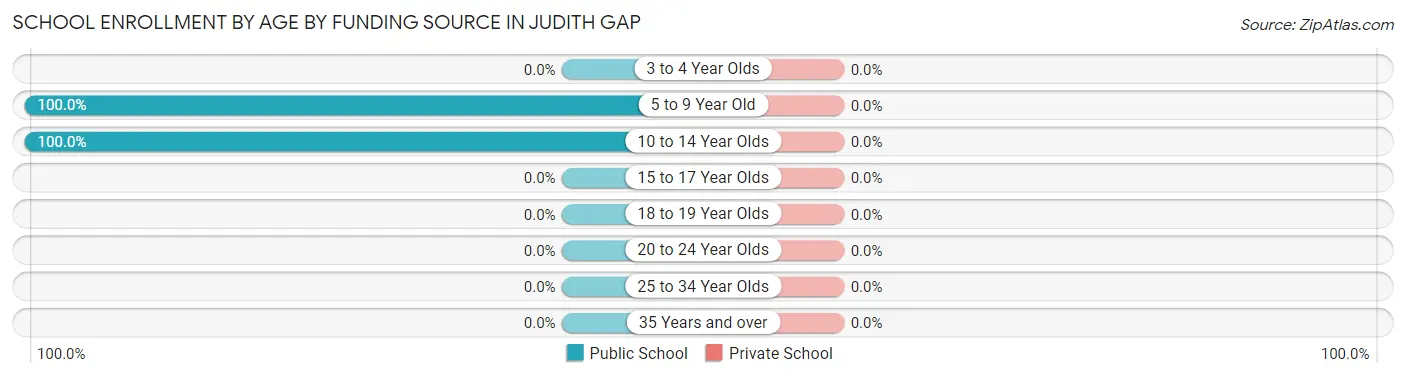
| Age Bracket | Public School | Private School |
| 3 to 4 Year Olds | 0 (0.0%) | 0 (0.0%) |
| 5 to 9 Year Old | 10 (100.0%) | 0 (0.0%) |
| 10 to 14 Year Olds | 10 (100.0%) | 0 (0.0%) |
| 15 to 17 Year Olds | 0 (0.0%) | 0 (0.0%) |
| 18 to 19 Year Olds | 0 (0.0%) | 0 (0.0%) |
| 20 to 24 Year Olds | 0 (0.0%) | 0 (0.0%) |
| 25 to 34 Year Olds | 0 (0.0%) | 0 (0.0%) |
| 35 Years and over | 0 (0.0%) | 0 (0.0%) |
| Total | 20 (100.0%) | 0 (0.0%) |
Educational Attainment by Field of Study in Judith Gap
Business (8 | 47.1%), bio, nature & agricultural (7 | 41.2%), and education (2 | 11.8%) are the most common fields of study among 17 individuals in Judith Gap who have obtained a bachelor's degree or higher.
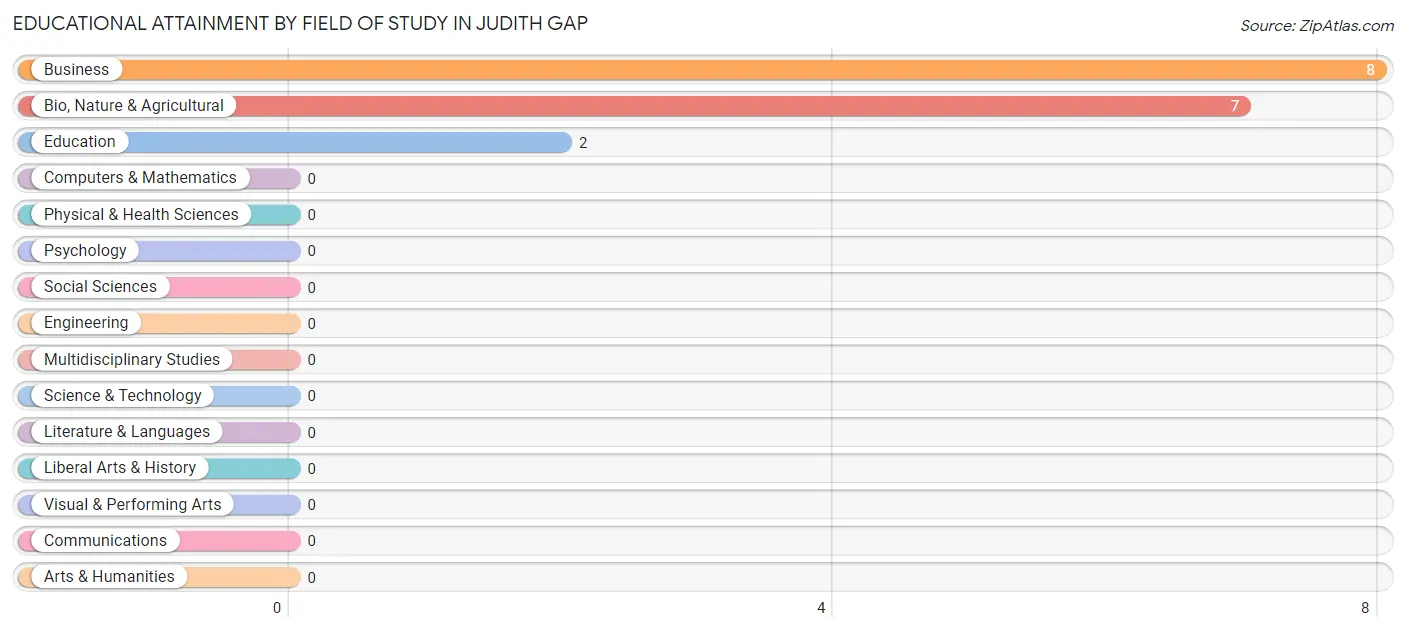
| Field of Study | # Graduates | % Graduates |
| Computers & Mathematics | 0 | 0.0% |
| Bio, Nature & Agricultural | 7 | 41.2% |
| Physical & Health Sciences | 0 | 0.0% |
| Psychology | 0 | 0.0% |
| Social Sciences | 0 | 0.0% |
| Engineering | 0 | 0.0% |
| Multidisciplinary Studies | 0 | 0.0% |
| Science & Technology | 0 | 0.0% |
| Business | 8 | 47.1% |
| Education | 2 | 11.8% |
| Literature & Languages | 0 | 0.0% |
| Liberal Arts & History | 0 | 0.0% |
| Visual & Performing Arts | 0 | 0.0% |
| Communications | 0 | 0.0% |
| Arts & Humanities | 0 | 0.0% |
| Total | 17 | 100.0% |
Transportation & Commute in Judith Gap
Vehicle Availability by Sex in Judith Gap
The most prevalent vehicle ownership categories in Judith Gap are males with 2 vehicles (14, accounting for 51.8%) and females with 2 vehicles (18, making up 56.0%).
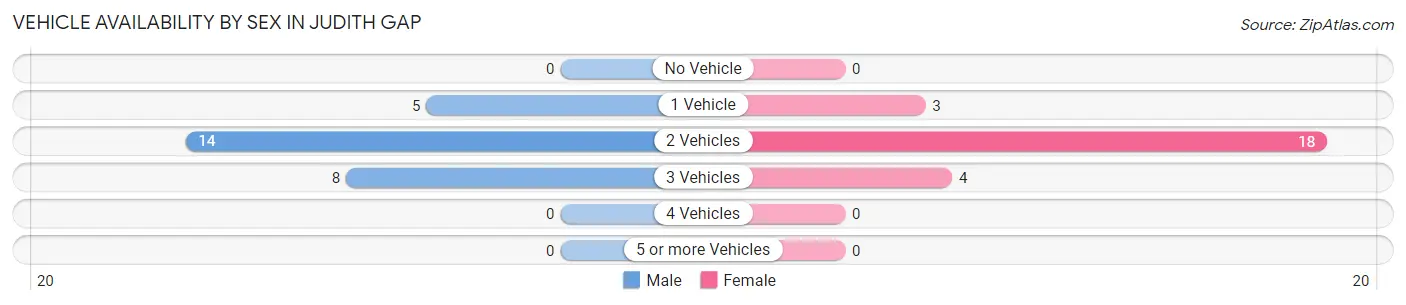
| Vehicles Available | Male | Female |
| No Vehicle | 0 (0.0%) | 0 (0.0%) |
| 1 Vehicle | 5 (18.5%) | 3 (12.0%) |
| 2 Vehicles | 14 (51.8%) | 18 (72.0%) |
| 3 Vehicles | 8 (29.6%) | 4 (16.0%) |
| 4 Vehicles | 0 (0.0%) | 0 (0.0%) |
| 5 or more Vehicles | 0 (0.0%) | 0 (0.0%) |
| Total | 27 (100.0%) | 25 (100.0%) |
Commute Time in Judith Gap
The most frequently occuring commute durations in Judith Gap are less than 5 minutes (18 commuters, 36.0%), 30 to 34 minutes (13 commuters, 26.0%), and 5 to 9 minutes (4 commuters, 8.0%).
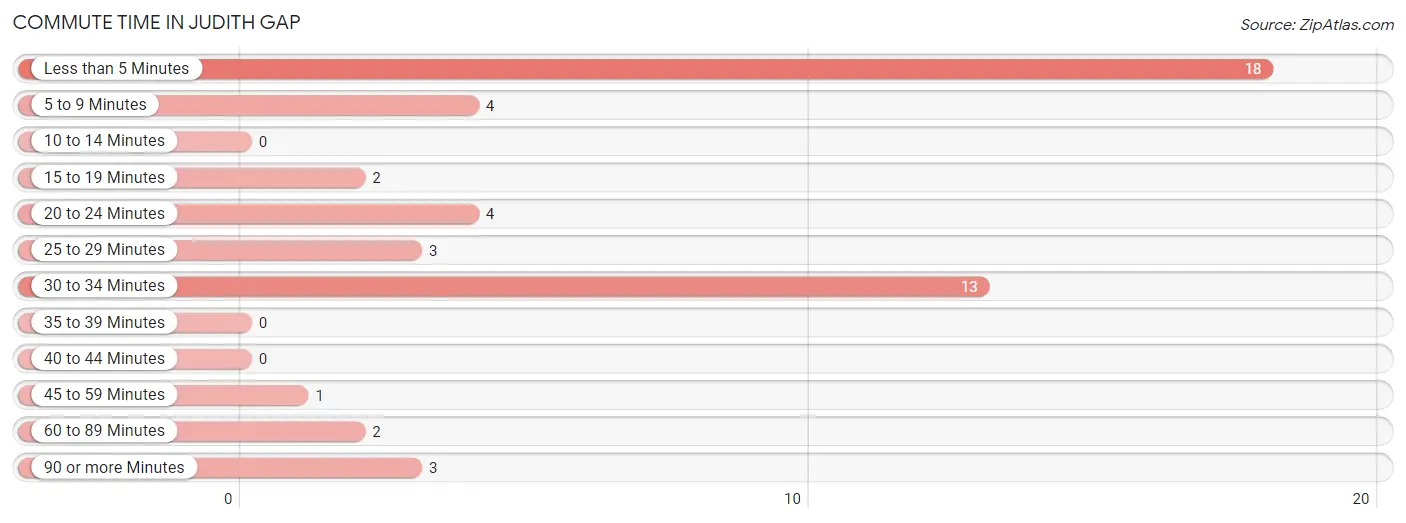
| Commute Time | # Commuters | % Commuters |
| Less than 5 Minutes | 18 | 36.0% |
| 5 to 9 Minutes | 4 | 8.0% |
| 10 to 14 Minutes | 0 | 0.0% |
| 15 to 19 Minutes | 2 | 4.0% |
| 20 to 24 Minutes | 4 | 8.0% |
| 25 to 29 Minutes | 3 | 6.0% |
| 30 to 34 Minutes | 13 | 26.0% |
| 35 to 39 Minutes | 0 | 0.0% |
| 40 to 44 Minutes | 0 | 0.0% |
| 45 to 59 Minutes | 1 | 2.0% |
| 60 to 89 Minutes | 2 | 4.0% |
| 90 or more Minutes | 3 | 6.0% |
Commute Time by Sex in Judith Gap
The most common commute times in Judith Gap are less than 5 minutes (14 commuters, 51.8%) for males and 30 to 34 minutes (11 commuters, 47.8%) for females.
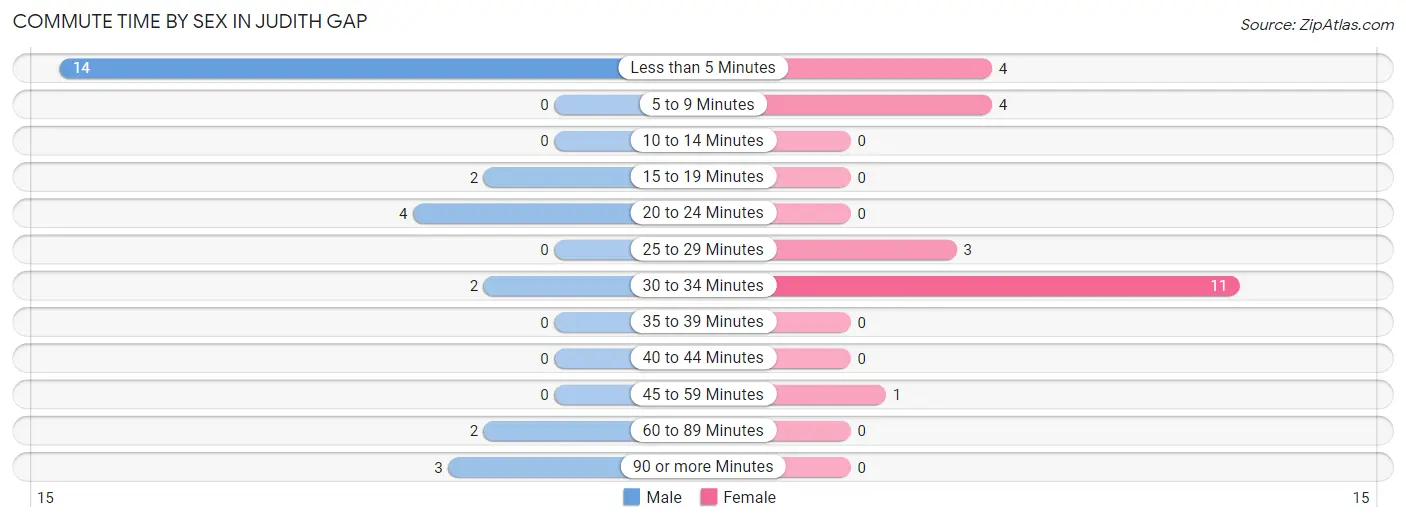
| Commute Time | Male | Female |
| Less than 5 Minutes | 14 (51.8%) | 4 (17.4%) |
| 5 to 9 Minutes | 0 (0.0%) | 4 (17.4%) |
| 10 to 14 Minutes | 0 (0.0%) | 0 (0.0%) |
| 15 to 19 Minutes | 2 (7.4%) | 0 (0.0%) |
| 20 to 24 Minutes | 4 (14.8%) | 0 (0.0%) |
| 25 to 29 Minutes | 0 (0.0%) | 3 (13.0%) |
| 30 to 34 Minutes | 2 (7.4%) | 11 (47.8%) |
| 35 to 39 Minutes | 0 (0.0%) | 0 (0.0%) |
| 40 to 44 Minutes | 0 (0.0%) | 0 (0.0%) |
| 45 to 59 Minutes | 0 (0.0%) | 1 (4.3%) |
| 60 to 89 Minutes | 2 (7.4%) | 0 (0.0%) |
| 90 or more Minutes | 3 (11.1%) | 0 (0.0%) |
Time of Departure to Work by Sex in Judith Gap
The most frequent times of departure to work in Judith Gap are 7:00 AM to 7:29 AM (12, 44.4%) for males and 7:00 AM to 7:29 AM (12, 52.2%) for females.
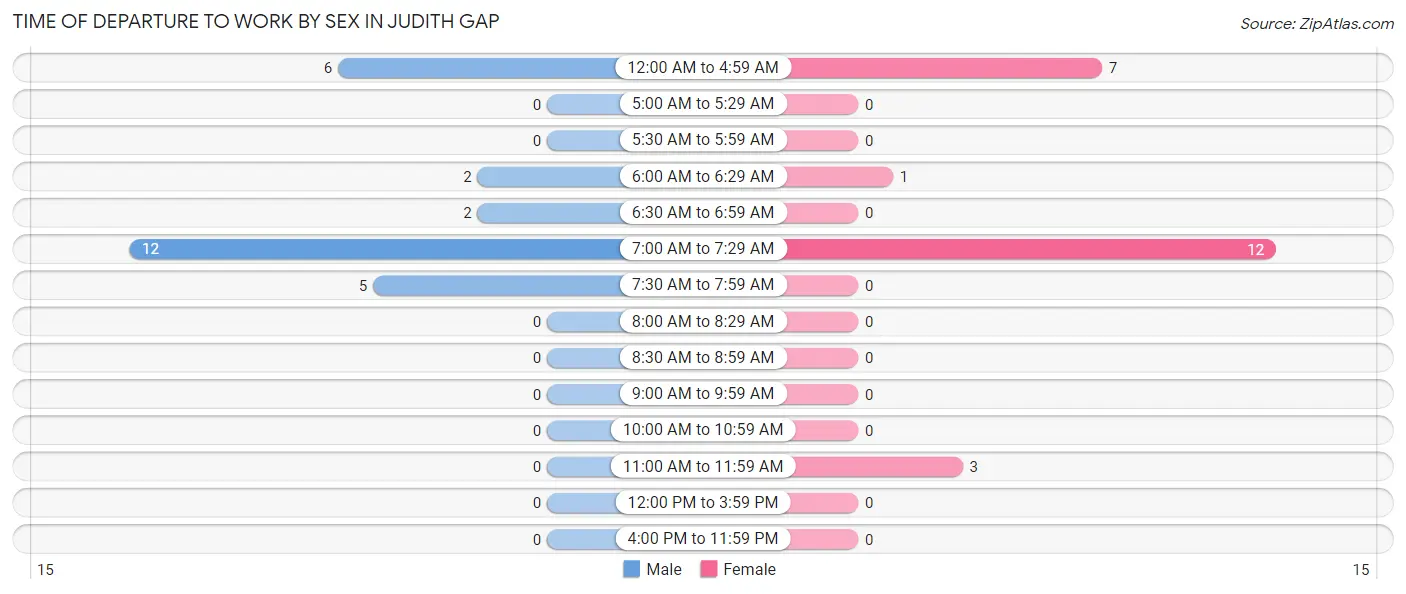
| Time of Departure | Male | Female |
| 12:00 AM to 4:59 AM | 6 (22.2%) | 7 (30.4%) |
| 5:00 AM to 5:29 AM | 0 (0.0%) | 0 (0.0%) |
| 5:30 AM to 5:59 AM | 0 (0.0%) | 0 (0.0%) |
| 6:00 AM to 6:29 AM | 2 (7.4%) | 1 (4.3%) |
| 6:30 AM to 6:59 AM | 2 (7.4%) | 0 (0.0%) |
| 7:00 AM to 7:29 AM | 12 (44.4%) | 12 (52.2%) |
| 7:30 AM to 7:59 AM | 5 (18.5%) | 0 (0.0%) |
| 8:00 AM to 8:29 AM | 0 (0.0%) | 0 (0.0%) |
| 8:30 AM to 8:59 AM | 0 (0.0%) | 0 (0.0%) |
| 9:00 AM to 9:59 AM | 0 (0.0%) | 0 (0.0%) |
| 10:00 AM to 10:59 AM | 0 (0.0%) | 0 (0.0%) |
| 11:00 AM to 11:59 AM | 0 (0.0%) | 3 (13.0%) |
| 12:00 PM to 3:59 PM | 0 (0.0%) | 0 (0.0%) |
| 4:00 PM to 11:59 PM | 0 (0.0%) | 0 (0.0%) |
| Total | 27 (100.0%) | 23 (100.0%) |
Housing Occupancy in Judith Gap
Occupancy by Ownership in Judith Gap
Of the total 77 dwellings in Judith Gap, owner-occupied units account for 58 (75.3%), while renter-occupied units make up 19 (24.7%).
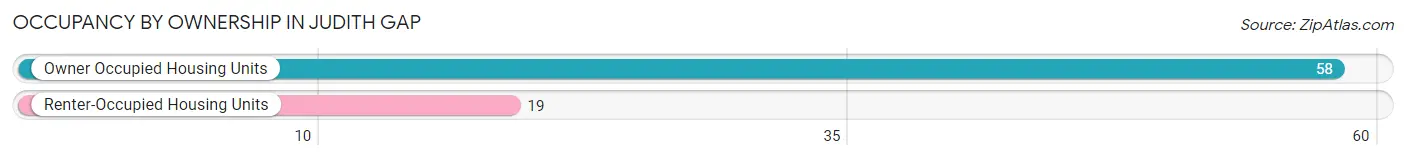
| Occupancy | # Housing Units | % Housing Units |
| Owner Occupied Housing Units | 58 | 75.3% |
| Renter-Occupied Housing Units | 19 | 24.7% |
| Total Occupied Housing Units | 77 | 100.0% |
Occupancy by Household Size in Judith Gap
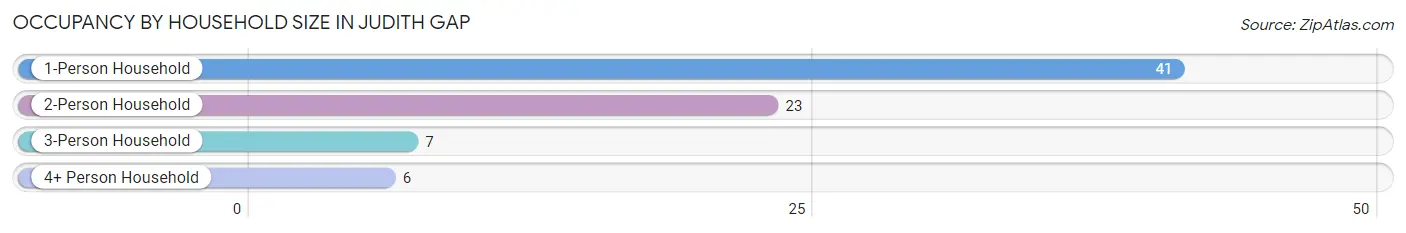
| Household Size | # Housing Units | % Housing Units |
| 1-Person Household | 41 | 53.2% |
| 2-Person Household | 23 | 29.9% |
| 3-Person Household | 7 | 9.1% |
| 4+ Person Household | 6 | 7.8% |
| Total Housing Units | 77 | 100.0% |
Occupancy by Ownership by Household Size in Judith Gap
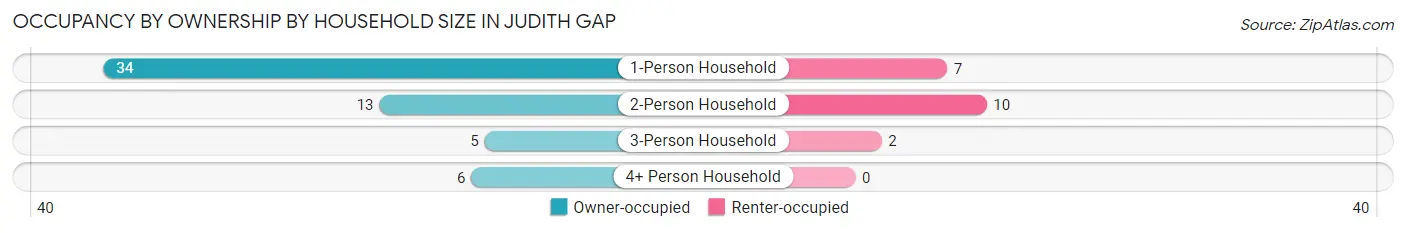
| Household Size | Owner-occupied | Renter-occupied |
| 1-Person Household | 34 (82.9%) | 7 (17.1%) |
| 2-Person Household | 13 (56.5%) | 10 (43.5%) |
| 3-Person Household | 5 (71.4%) | 2 (28.6%) |
| 4+ Person Household | 6 (100.0%) | 0 (0.0%) |
| Total Housing Units | 58 (75.3%) | 19 (24.7%) |
Occupancy by Educational Attainment in Judith Gap
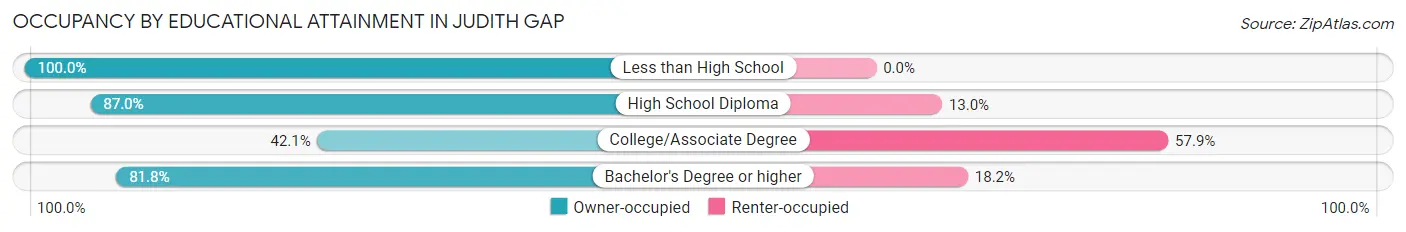
| Household Size | Owner-occupied | Renter-occupied |
| Less than High School | 1 (100.0%) | 0 (0.0%) |
| High School Diploma | 40 (87.0%) | 6 (13.0%) |
| College/Associate Degree | 8 (42.1%) | 11 (57.9%) |
| Bachelor's Degree or higher | 9 (81.8%) | 2 (18.2%) |
Occupancy by Age of Householder in Judith Gap
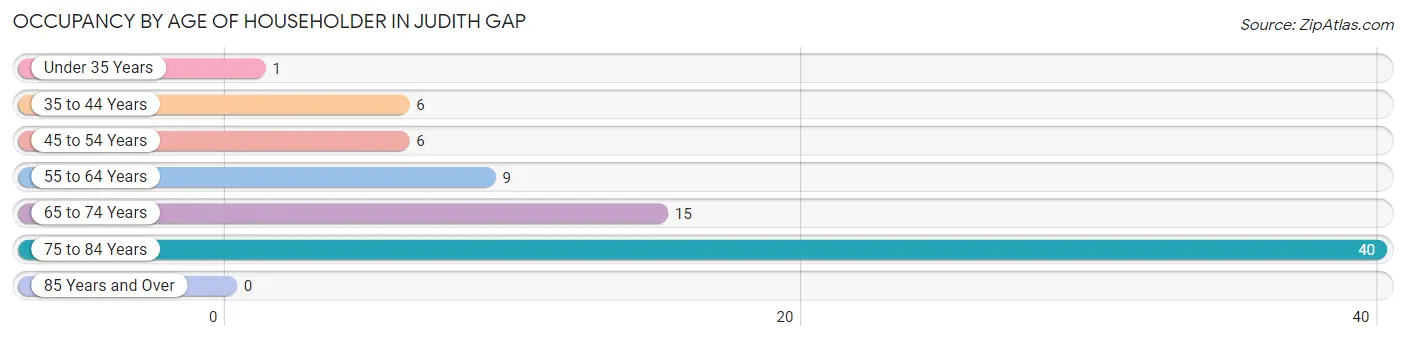
| Age Bracket | # Households | % Households |
| Under 35 Years | 1 | 1.3% |
| 35 to 44 Years | 6 | 7.8% |
| 45 to 54 Years | 6 | 7.8% |
| 55 to 64 Years | 9 | 11.7% |
| 65 to 74 Years | 15 | 19.5% |
| 75 to 84 Years | 40 | 51.9% |
| 85 Years and Over | 0 | 0.0% |
| Total | 77 | 100.0% |
Housing Finances in Judith Gap
Median Income by Occupancy in Judith Gap
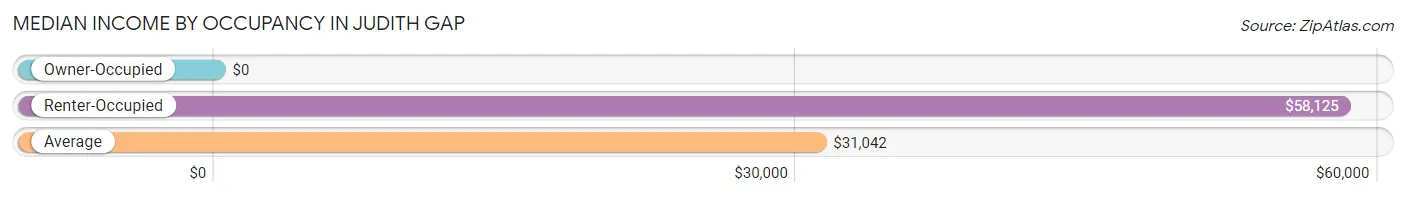
| Occupancy Type | # Households | Median Income |
| Owner-Occupied | 58 (75.3%) | $0 |
| Renter-Occupied | 19 (24.7%) | $58,125 |
| Average | 77 (100.0%) | $31,042 |
Occupancy by Householder Income Bracket in Judith Gap
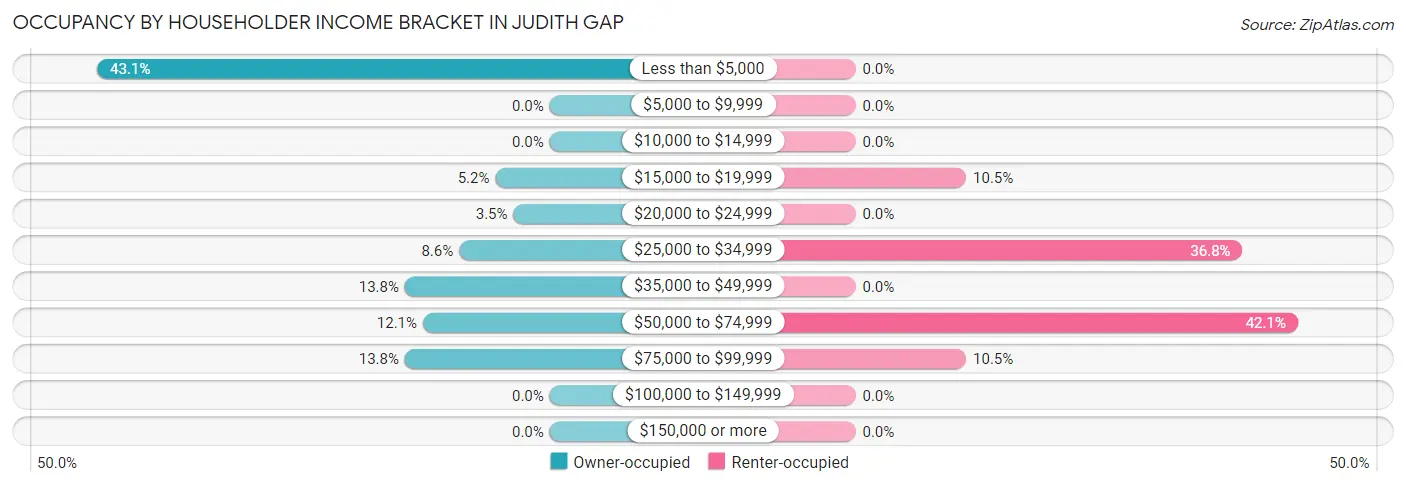
| Income Bracket | Owner-occupied | Renter-occupied |
| Less than $5,000 | 25 (43.1%) | 0 (0.0%) |
| $5,000 to $9,999 | 0 (0.0%) | 0 (0.0%) |
| $10,000 to $14,999 | 0 (0.0%) | 0 (0.0%) |
| $15,000 to $19,999 | 3 (5.2%) | 2 (10.5%) |
| $20,000 to $24,999 | 2 (3.5%) | 0 (0.0%) |
| $25,000 to $34,999 | 5 (8.6%) | 7 (36.8%) |
| $35,000 to $49,999 | 8 (13.8%) | 0 (0.0%) |
| $50,000 to $74,999 | 7 (12.1%) | 8 (42.1%) |
| $75,000 to $99,999 | 8 (13.8%) | 2 (10.5%) |
| $100,000 to $149,999 | 0 (0.0%) | 0 (0.0%) |
| $150,000 or more | 0 (0.0%) | 0 (0.0%) |
| Total | 58 (100.0%) | 19 (100.0%) |
Monthly Housing Cost Tiers in Judith Gap
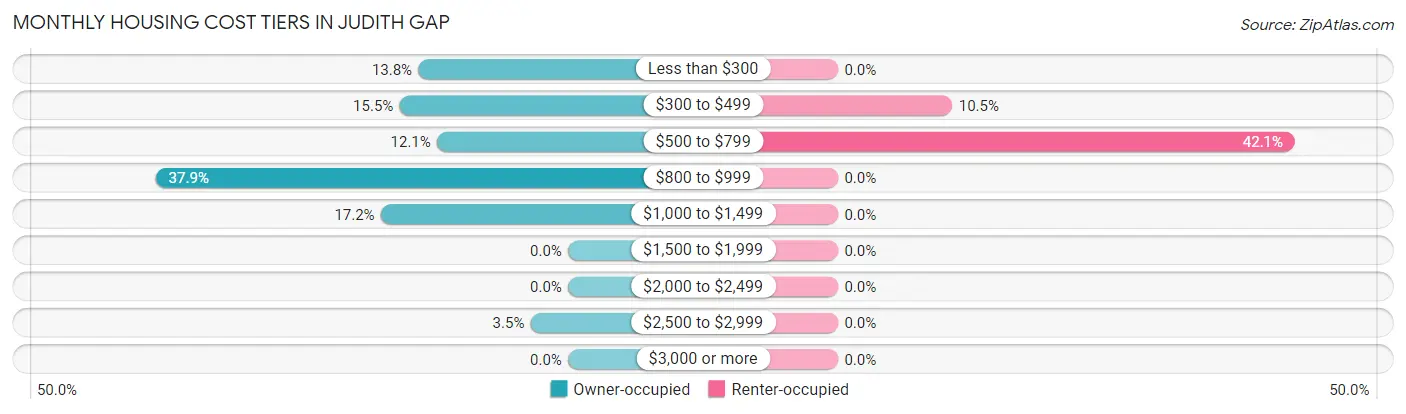
| Monthly Cost | Owner-occupied | Renter-occupied |
| Less than $300 | 8 (13.8%) | 0 (0.0%) |
| $300 to $499 | 9 (15.5%) | 2 (10.5%) |
| $500 to $799 | 7 (12.1%) | 8 (42.1%) |
| $800 to $999 | 22 (37.9%) | 0 (0.0%) |
| $1,000 to $1,499 | 10 (17.2%) | 0 (0.0%) |
| $1,500 to $1,999 | 0 (0.0%) | 0 (0.0%) |
| $2,000 to $2,499 | 0 (0.0%) | 0 (0.0%) |
| $2,500 to $2,999 | 2 (3.5%) | 0 (0.0%) |
| $3,000 or more | 0 (0.0%) | 0 (0.0%) |
| Total | 58 (100.0%) | 19 (100.0%) |
Physical Housing Characteristics in Judith Gap
Housing Structures in Judith Gap
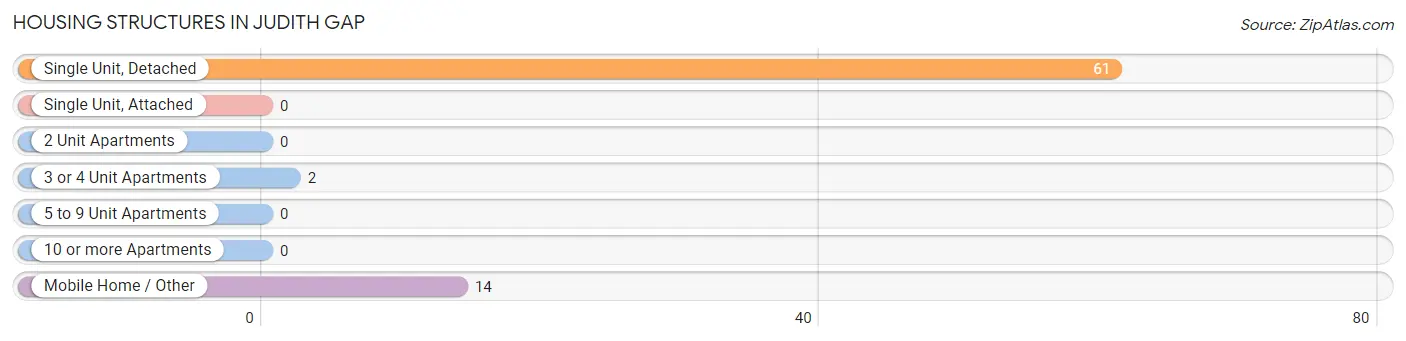
| Structure Type | # Housing Units | % Housing Units |
| Single Unit, Detached | 61 | 79.2% |
| Single Unit, Attached | 0 | 0.0% |
| 2 Unit Apartments | 0 | 0.0% |
| 3 or 4 Unit Apartments | 2 | 2.6% |
| 5 to 9 Unit Apartments | 0 | 0.0% |
| 10 or more Apartments | 0 | 0.0% |
| Mobile Home / Other | 14 | 18.2% |
| Total | 77 | 100.0% |
Housing Structures by Occupancy in Judith Gap
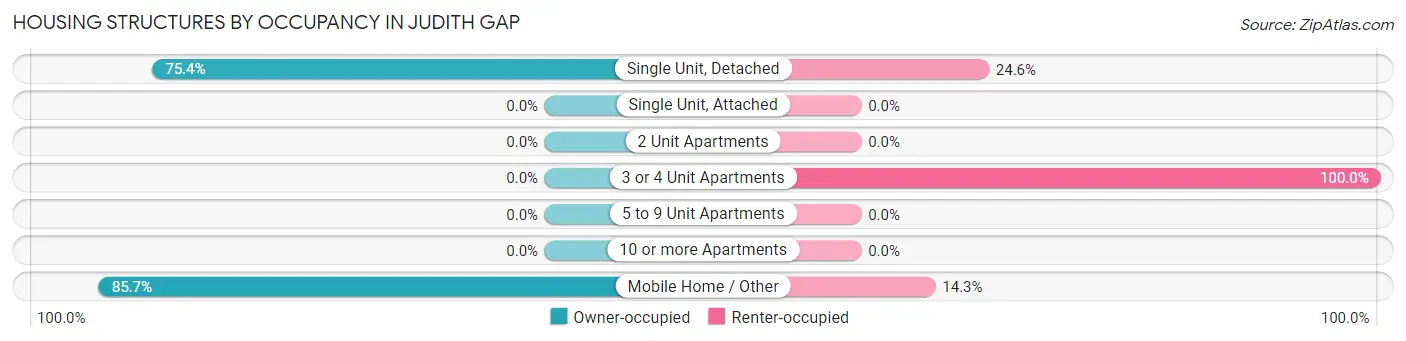
| Structure Type | Owner-occupied | Renter-occupied |
| Single Unit, Detached | 46 (75.4%) | 15 (24.6%) |
| Single Unit, Attached | 0 (0.0%) | 0 (0.0%) |
| 2 Unit Apartments | 0 (0.0%) | 0 (0.0%) |
| 3 or 4 Unit Apartments | 0 (0.0%) | 2 (100.0%) |
| 5 to 9 Unit Apartments | 0 (0.0%) | 0 (0.0%) |
| 10 or more Apartments | 0 (0.0%) | 0 (0.0%) |
| Mobile Home / Other | 12 (85.7%) | 2 (14.3%) |
| Total | 58 (75.3%) | 19 (24.7%) |
Housing Structures by Number of Rooms in Judith Gap
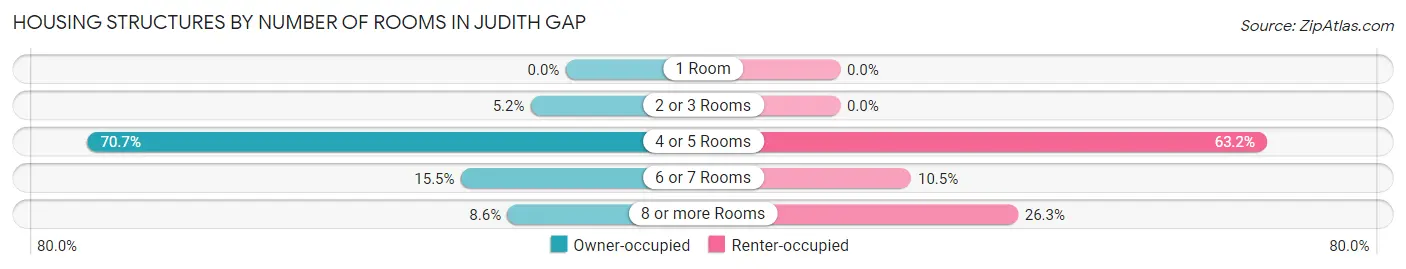
| Number of Rooms | Owner-occupied | Renter-occupied |
| 1 Room | 0 (0.0%) | 0 (0.0%) |
| 2 or 3 Rooms | 3 (5.2%) | 0 (0.0%) |
| 4 or 5 Rooms | 41 (70.7%) | 12 (63.2%) |
| 6 or 7 Rooms | 9 (15.5%) | 2 (10.5%) |
| 8 or more Rooms | 5 (8.6%) | 5 (26.3%) |
| Total | 58 (100.0%) | 19 (100.0%) |
Housing Structure by Heating Type in Judith Gap
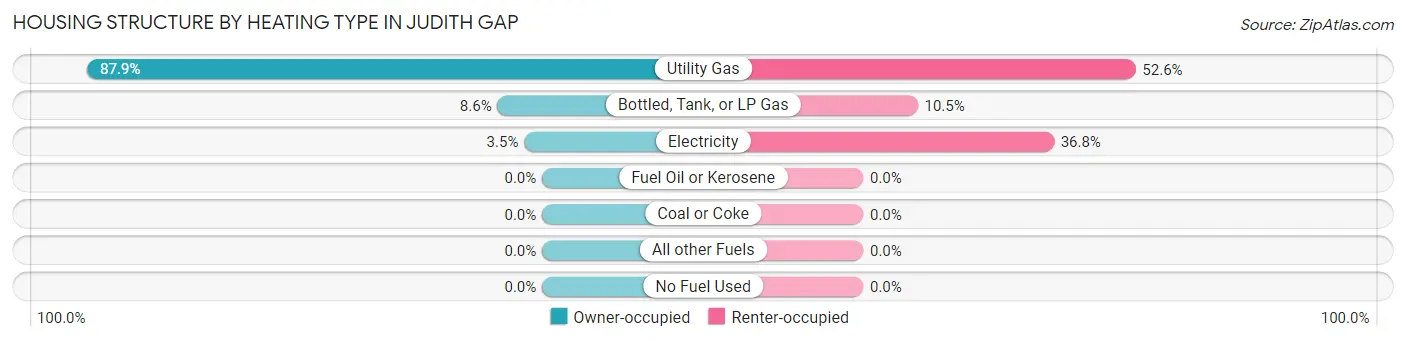
| Heating Type | Owner-occupied | Renter-occupied |
| Utility Gas | 51 (87.9%) | 10 (52.6%) |
| Bottled, Tank, or LP Gas | 5 (8.6%) | 2 (10.5%) |
| Electricity | 2 (3.5%) | 7 (36.8%) |
| Fuel Oil or Kerosene | 0 (0.0%) | 0 (0.0%) |
| Coal or Coke | 0 (0.0%) | 0 (0.0%) |
| All other Fuels | 0 (0.0%) | 0 (0.0%) |
| No Fuel Used | 0 (0.0%) | 0 (0.0%) |
| Total | 58 (100.0%) | 19 (100.0%) |
Household Vehicle Usage in Judith Gap
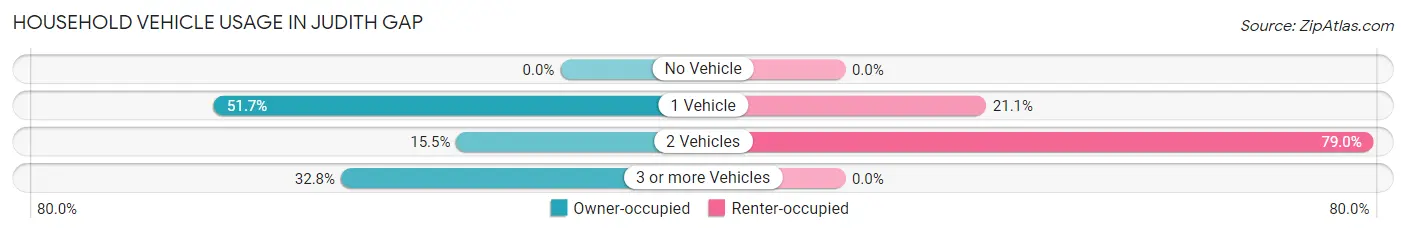
| Vehicles per Household | Owner-occupied | Renter-occupied |
| No Vehicle | 0 (0.0%) | 0 (0.0%) |
| 1 Vehicle | 30 (51.7%) | 4 (21.0%) |
| 2 Vehicles | 9 (15.5%) | 15 (78.9%) |
| 3 or more Vehicles | 19 (32.8%) | 0 (0.0%) |
| Total | 58 (100.0%) | 19 (100.0%) |
Real Estate & Mortgages in Judith Gap
Real Estate and Mortgage Overview in Judith Gap
| Characteristic | Without Mortgage | With Mortgage |
| Housing Units | 21 | 37 |
| Median Property Value | $51,300 | $113,400 |
| Median Household Income | $26,563 | $0 |
| Monthly Housing Costs | $419 | $0 |
| Real Estate Taxes | $375 | $1 |
Property Value by Mortgage Status in Judith Gap
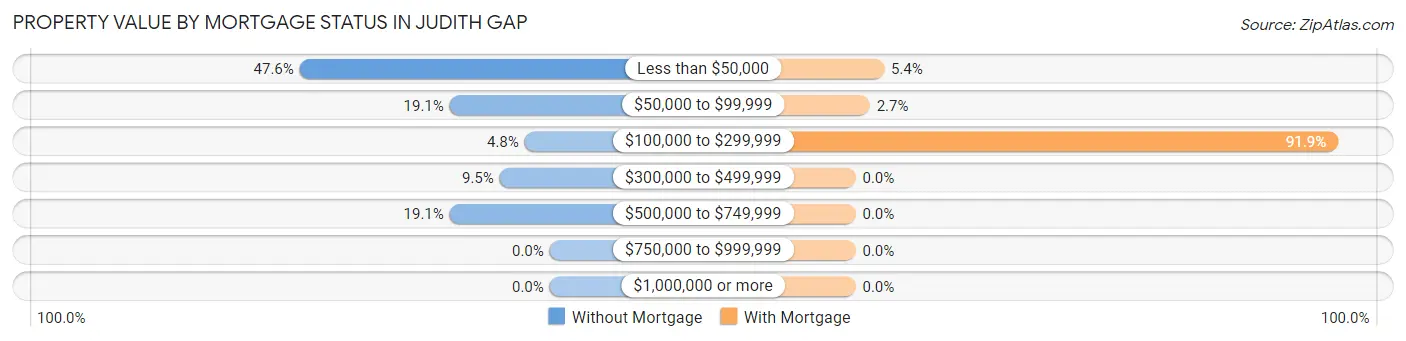
| Property Value | Without Mortgage | With Mortgage |
| Less than $50,000 | 10 (47.6%) | 2 (5.4%) |
| $50,000 to $99,999 | 4 (19.1%) | 1 (2.7%) |
| $100,000 to $299,999 | 1 (4.8%) | 34 (91.9%) |
| $300,000 to $499,999 | 2 (9.5%) | 0 (0.0%) |
| $500,000 to $749,999 | 4 (19.1%) | 0 (0.0%) |
| $750,000 to $999,999 | 0 (0.0%) | 0 (0.0%) |
| $1,000,000 or more | 0 (0.0%) | 0 (0.0%) |
| Total | 21 (100.0%) | 37 (100.0%) |
Household Income by Mortgage Status in Judith Gap
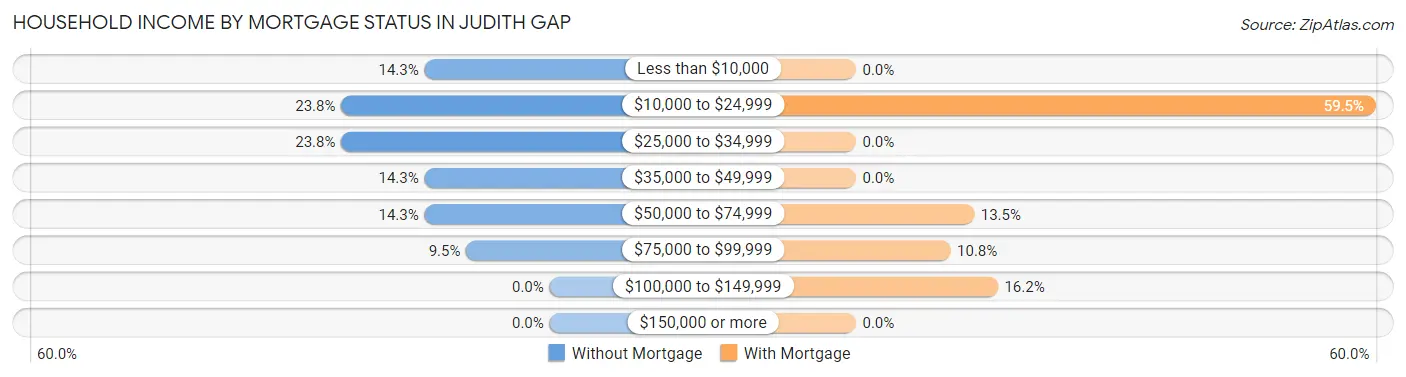
| Household Income | Without Mortgage | With Mortgage |
| Less than $10,000 | 3 (14.3%) | 0 (0.0%) |
| $10,000 to $24,999 | 5 (23.8%) | 22 (59.5%) |
| $25,000 to $34,999 | 5 (23.8%) | 0 (0.0%) |
| $35,000 to $49,999 | 3 (14.3%) | 0 (0.0%) |
| $50,000 to $74,999 | 3 (14.3%) | 5 (13.5%) |
| $75,000 to $99,999 | 2 (9.5%) | 4 (10.8%) |
| $100,000 to $149,999 | 0 (0.0%) | 6 (16.2%) |
| $150,000 or more | 0 (0.0%) | 0 (0.0%) |
| Total | 21 (100.0%) | 37 (100.0%) |
Property Value to Household Income Ratio in Judith Gap
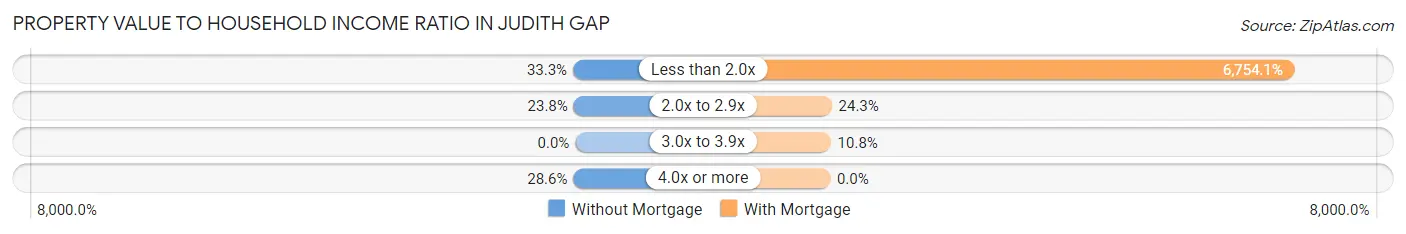
| Value-to-Income Ratio | Without Mortgage | With Mortgage |
| Less than 2.0x | 7 (33.3%) | 2,499 (6,754.0%) |
| 2.0x to 2.9x | 5 (23.8%) | 9 (24.3%) |
| 3.0x to 3.9x | 0 (0.0%) | 4 (10.8%) |
| 4.0x or more | 6 (28.6%) | 0 (0.0%) |
| Total | 21 (100.0%) | 37 (100.0%) |
Real Estate Taxes by Mortgage Status in Judith Gap
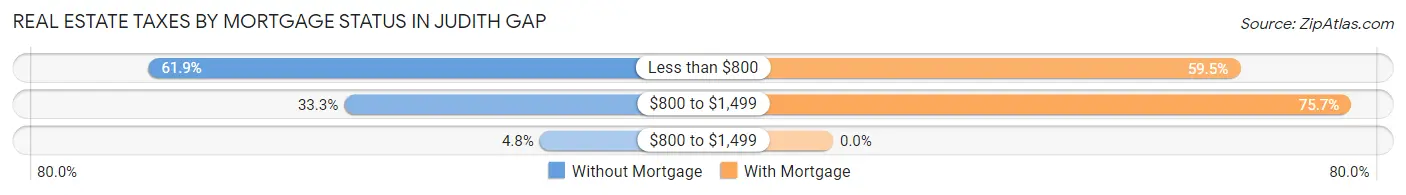
| Property Taxes | Without Mortgage | With Mortgage |
| Less than $800 | 13 (61.9%) | 22 (59.5%) |
| $800 to $1,499 | 7 (33.3%) | 28 (75.7%) |
| $800 to $1,499 | 1 (4.8%) | 0 (0.0%) |
| Total | 21 (100.0%) | 37 (100.0%) |
Health & Disability in Judith Gap
Health Insurance Coverage by Age in Judith Gap
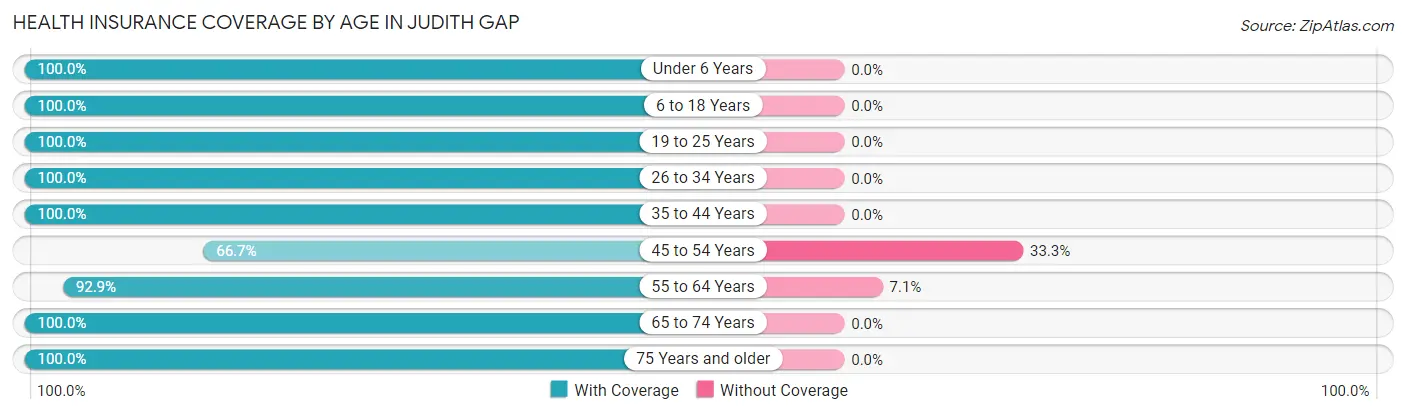
| Age Bracket | With Coverage | Without Coverage |
| Under 6 Years | 7 (100.0%) | 0 (0.0%) |
| 6 to 18 Years | 18 (100.0%) | 0 (0.0%) |
| 19 to 25 Years | 2 (100.0%) | 0 (0.0%) |
| 26 to 34 Years | 4 (100.0%) | 0 (0.0%) |
| 35 to 44 Years | 10 (100.0%) | 0 (0.0%) |
| 45 to 54 Years | 4 (66.7%) | 2 (33.3%) |
| 55 to 64 Years | 26 (92.9%) | 2 (7.1%) |
| 65 to 74 Years | 22 (100.0%) | 0 (0.0%) |
| 75 Years and older | 43 (100.0%) | 0 (0.0%) |
| Total | 136 (97.1%) | 4 (2.9%) |
Health Insurance Coverage by Citizenship Status in Judith Gap
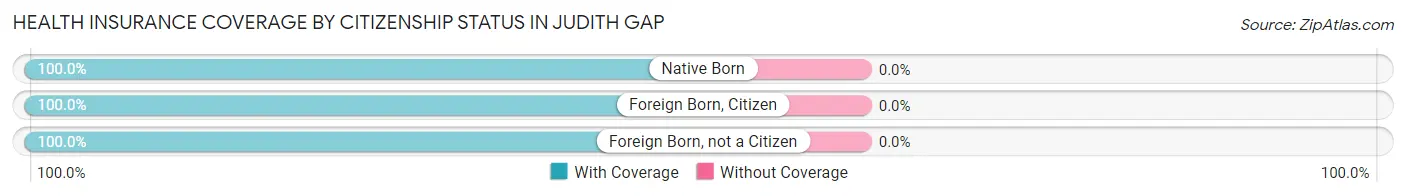
| Citizenship Status | With Coverage | Without Coverage |
| Native Born | 7 (100.0%) | 0 (0.0%) |
| Foreign Born, Citizen | 18 (100.0%) | 0 (0.0%) |
| Foreign Born, not a Citizen | 2 (100.0%) | 0 (0.0%) |
Health Insurance Coverage by Household Income in Judith Gap
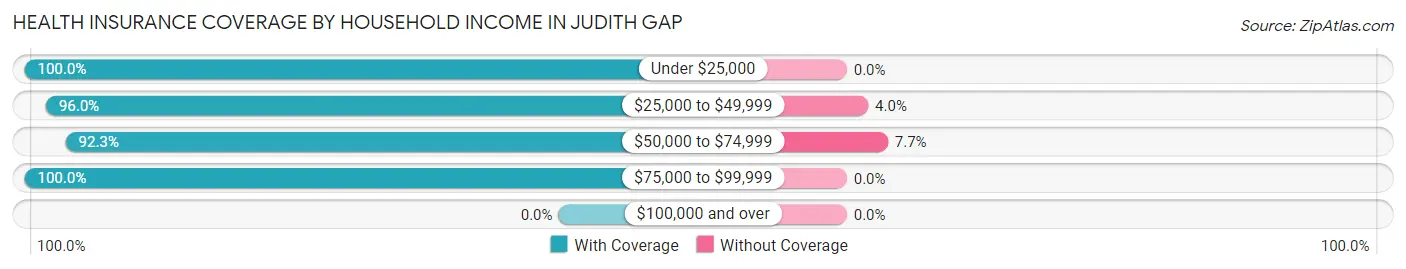
| Household Income | With Coverage | Without Coverage |
| Under $25,000 | 34 (100.0%) | 0 (0.0%) |
| $25,000 to $49,999 | 48 (96.0%) | 2 (4.0%) |
| $50,000 to $74,999 | 24 (92.3%) | 2 (7.7%) |
| $75,000 to $99,999 | 30 (100.0%) | 0 (0.0%) |
| $100,000 and over | 0 (0.0%) | 0 (0.0%) |
Public vs Private Health Insurance Coverage by Age in Judith Gap

| Age Bracket | Public Insurance | Private Insurance |
| Under 6 | 5 (71.4%) | 2 (28.6%) |
| 6 to 18 Years | 4 (22.2%) | 14 (77.8%) |
| 19 to 25 Years | 0 (0.0%) | 2 (100.0%) |
| 25 to 34 Years | 3 (75.0%) | 1 (25.0%) |
| 35 to 44 Years | 0 (0.0%) | 10 (100.0%) |
| 45 to 54 Years | 2 (33.3%) | 2 (33.3%) |
| 55 to 64 Years | 15 (53.6%) | 11 (39.3%) |
| 65 to 74 Years | 20 (90.9%) | 12 (54.5%) |
| 75 Years and over | 42 (97.7%) | 28 (65.1%) |
| Total | 91 (65.0%) | 82 (58.6%) |
Disability Status by Sex by Age in Judith Gap
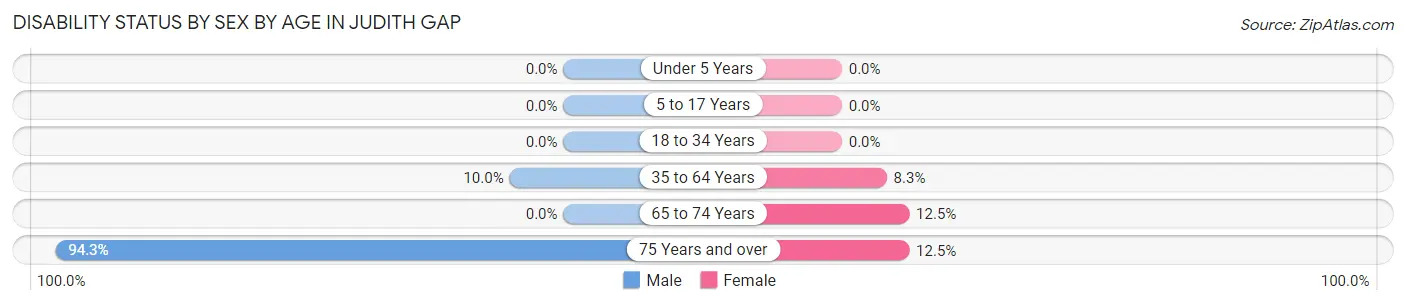
| Age Bracket | Male | Female |
| Under 5 Years | 0 (0.0%) | 0 (0.0%) |
| 5 to 17 Years | 0 (0.0%) | 0 (0.0%) |
| 18 to 34 Years | 0 (0.0%) | 0 (0.0%) |
| 35 to 64 Years | 2 (10.0%) | 2 (8.3%) |
| 65 to 74 Years | 0 (0.0%) | 1 (12.5%) |
| 75 Years and over | 33 (94.3%) | 1 (12.5%) |
Disability Class by Sex by Age in Judith Gap
Disability Class: Hearing Difficulty
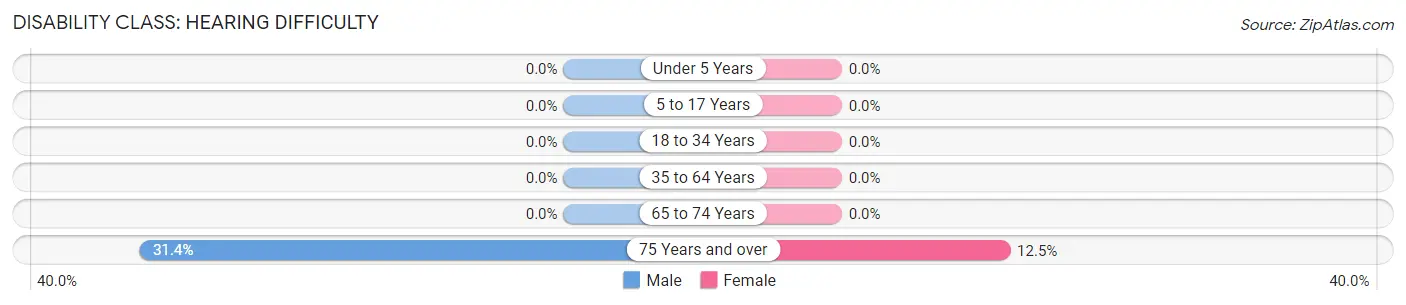
| Age Bracket | Male | Female |
| Under 5 Years | 0 (0.0%) | 0 (0.0%) |
| 5 to 17 Years | 0 (0.0%) | 0 (0.0%) |
| 18 to 34 Years | 0 (0.0%) | 0 (0.0%) |
| 35 to 64 Years | 0 (0.0%) | 0 (0.0%) |
| 65 to 74 Years | 0 (0.0%) | 0 (0.0%) |
| 75 Years and over | 11 (31.4%) | 1 (12.5%) |
Disability Class: Vision Difficulty
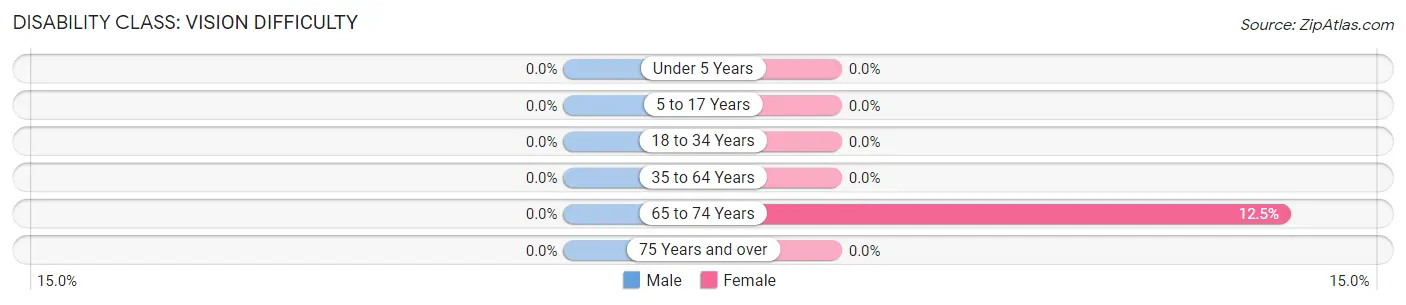
| Age Bracket | Male | Female |
| Under 5 Years | 0 (0.0%) | 0 (0.0%) |
| 5 to 17 Years | 0 (0.0%) | 0 (0.0%) |
| 18 to 34 Years | 0 (0.0%) | 0 (0.0%) |
| 35 to 64 Years | 0 (0.0%) | 0 (0.0%) |
| 65 to 74 Years | 0 (0.0%) | 1 (12.5%) |
| 75 Years and over | 0 (0.0%) | 0 (0.0%) |
Disability Class: Cognitive Difficulty
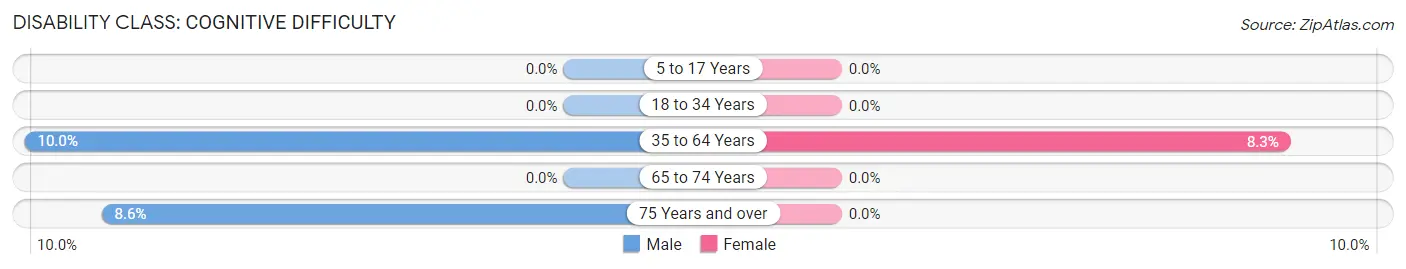
| Age Bracket | Male | Female |
| 5 to 17 Years | 0 (0.0%) | 0 (0.0%) |
| 18 to 34 Years | 0 (0.0%) | 0 (0.0%) |
| 35 to 64 Years | 2 (10.0%) | 2 (8.3%) |
| 65 to 74 Years | 0 (0.0%) | 0 (0.0%) |
| 75 Years and over | 3 (8.6%) | 0 (0.0%) |
Disability Class: Ambulatory Difficulty
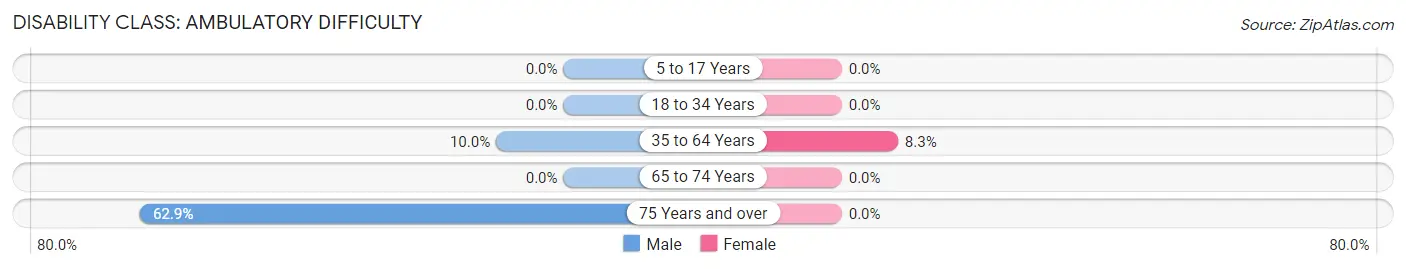
| Age Bracket | Male | Female |
| 5 to 17 Years | 0 (0.0%) | 0 (0.0%) |
| 18 to 34 Years | 0 (0.0%) | 0 (0.0%) |
| 35 to 64 Years | 2 (10.0%) | 2 (8.3%) |
| 65 to 74 Years | 0 (0.0%) | 0 (0.0%) |
| 75 Years and over | 22 (62.9%) | 0 (0.0%) |
Disability Class: Self-Care Difficulty
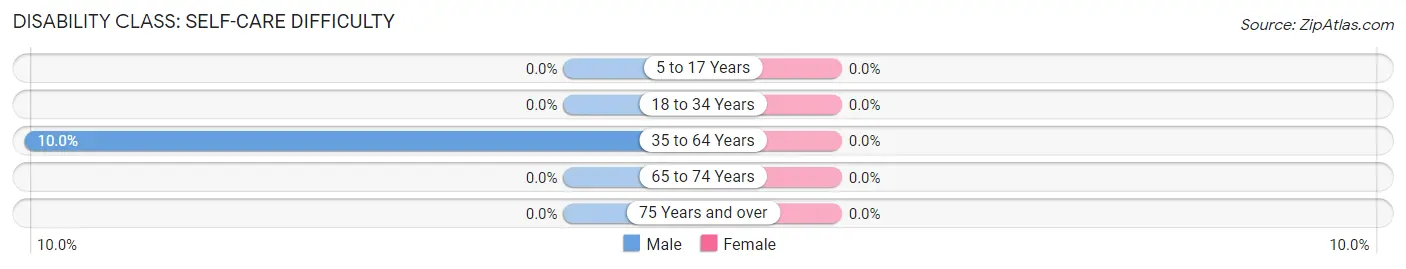
| Age Bracket | Male | Female |
| 5 to 17 Years | 0 (0.0%) | 0 (0.0%) |
| 18 to 34 Years | 0 (0.0%) | 0 (0.0%) |
| 35 to 64 Years | 2 (10.0%) | 0 (0.0%) |
| 65 to 74 Years | 0 (0.0%) | 0 (0.0%) |
| 75 Years and over | 0 (0.0%) | 0 (0.0%) |
Technology Access in Judith Gap
Computing Device Access in Judith Gap
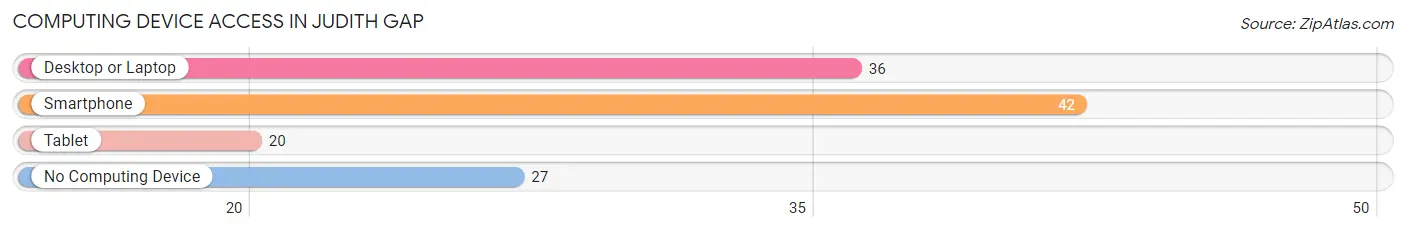
| Device Type | # Households | % Households |
| Desktop or Laptop | 36 | 46.8% |
| Smartphone | 42 | 54.5% |
| Tablet | 20 | 26.0% |
| No Computing Device | 27 | 35.1% |
| Total | 77 | 100.0% |
Internet Access in Judith Gap
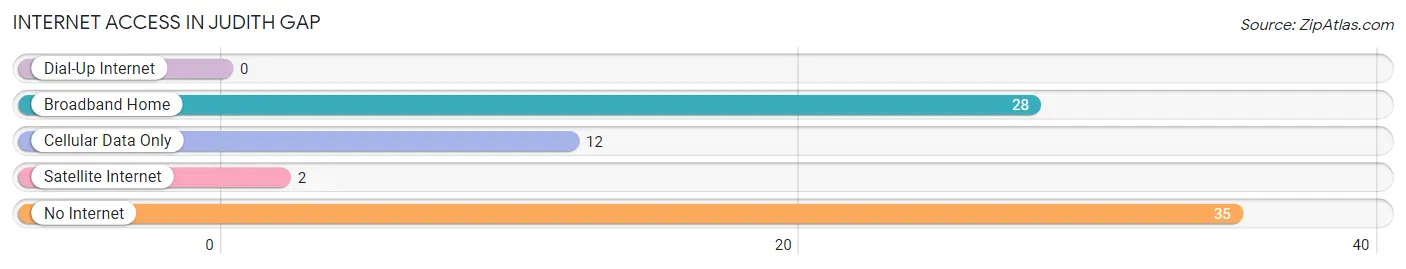
| Internet Type | # Households | % Households |
| Dial-Up Internet | 0 | 0.0% |
| Broadband Home | 28 | 36.4% |
| Cellular Data Only | 12 | 15.6% |
| Satellite Internet | 2 | 2.6% |
| No Internet | 35 | 45.5% |
| Total | 77 | 100.0% |
Judith Gap Summary
Judith Gap is a small unincorporated community located in Wheatland County, Montana. It is situated in the foothills of the Little Belt Mountains, approximately 30 miles south of Great Falls. The town was named after Judith River, which runs through the area. The population of Judith Gap was estimated to be around 200 people in 2000.
History
The area around Judith Gap was first settled in the late 1800s by ranchers and farmers. The town was officially established in 1887 when the Northern Pacific Railway built a line through the area. The town was named after the nearby Judith River, which was named after a Native American woman who lived in the area.
In the early 1900s, Judith Gap was a thriving agricultural community. The town had a general store, a post office, a school, a hotel, and several churches. The town also had a large grain elevator, which was used to store and ship grain to other parts of the state.
In the 1950s, the town began to decline as the railroad line was abandoned and the grain elevator was closed. The population of Judith Gap decreased significantly and the town became a virtual ghost town.
Geography
Judith Gap is located in the foothills of the Little Belt Mountains in Wheatland County, Montana. The town is situated at an elevation of 3,890 feet and is surrounded by rolling hills and grasslands. The Judith River runs through the area and is a popular spot for fishing and camping.
The climate in Judith Gap is semi-arid, with hot summers and cold winters. The average annual temperature is around 50 degrees Fahrenheit. The area receives an average of 16 inches of precipitation per year, most of which falls in the form of snow.
Economy
The economy of Judith Gap is largely based on agriculture. The town is home to several farms and ranches, which produce a variety of crops and livestock. The town also has a few small businesses, including a gas station, a grocery store, and a restaurant.
The town is also home to a small airport, which is used for recreational and business purposes. The airport is also used by the Montana National Guard for training exercises.
Demographics
The population of Judith Gap was estimated to be around 200 people in 2000. The town is predominantly white, with a small Hispanic population. The median household income in Judith Gap is around $30,000, which is lower than the state average. The town has a high poverty rate, with nearly 30% of the population living below the poverty line.
Conclusion
Judith Gap is a small unincorporated community located in Wheatland County, Montana. The town was established in 1887 and was once a thriving agricultural community. Today, the town is largely dependent on agriculture and has a population of around 200 people. The town has a high poverty rate and a median household income that is lower than the state average. Despite its economic struggles, Judith Gap is a beautiful and peaceful place to live.
Common Questions
What is Per Capita Income in Judith Gap?
Per Capita income in Judith Gap is $19,328.
What is the Median Family Income in Judith Gap?
Median Family Income in Judith Gap is $42,500.
What is the Median Household income in Judith Gap?
Median Household Income in Judith Gap is $31,042.
What is Income or Wage Gap in Judith Gap?
Income or Wage Gap in Judith Gap is 53.1%.
Women in Judith Gap earn 46.9 cents for every dollar earned by a man.
What is Inequality or Gini Index in Judith Gap?
Inequality or Gini Index in Judith Gap is 0.51.
What is the Total Population of Judith Gap?
Total Population of Judith Gap is 140.
What is the Total Male Population of Judith Gap?
Total Male Population of Judith Gap is 86.
What is the Total Female Population of Judith Gap?
Total Female Population of Judith Gap is 54.
What is the Ratio of Males per 100 Females in Judith Gap?
There are 159.26 Males per 100 Females in Judith Gap.
What is the Ratio of Females per 100 Males in Judith Gap?
There are 62.79 Females per 100 Males in Judith Gap.
What is the Median Population Age in Judith Gap?
Median Population Age in Judith Gap is 63.2 Years.
What is the Average Family Size in Judith Gap
Average Family Size in Judith Gap is 2.8 People.
What is the Average Household Size in Judith Gap
Average Household Size in Judith Gap is 1.8 People.
How Large is the Labor Force in Judith Gap?
There are 61 People in the Labor Forcein in Judith Gap.
What is the Percentage of People in the Labor Force in Judith Gap?
53.0% of People are in the Labor Force in Judith Gap.
What is the Unemployment Rate in Judith Gap?
Unemployment Rate in Judith Gap is 3.3%.