Zip Codes with the Highest Percentage of Households with Income Below $10,000 in Bozeman, MT
RELATED REPORTS & OPTIONS
Household Income | $0-10k
Bozeman
Compare Zip Codes
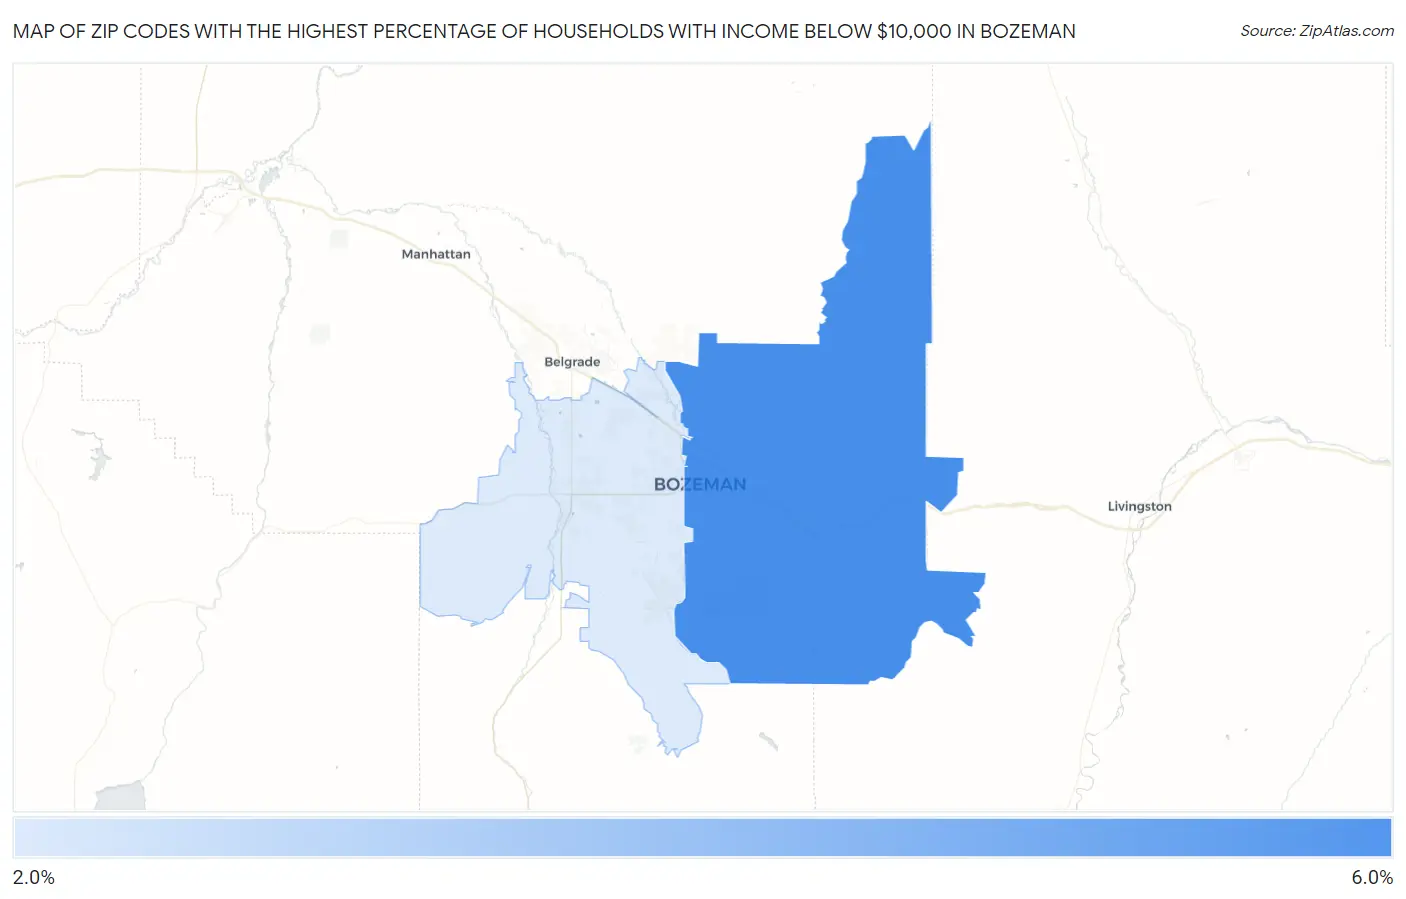
Map of Zip Codes with the Highest Percentage of Households with Income Below $10,000 in Bozeman
2.0%
5.1%
Zip Codes with the Highest Percentage of Households with Income Below $10,000 in Bozeman, MT
| Zip Code | Households with Income < $10k | vs State | vs National | |
| 1. | 59715 | 5.1% | 4.6%(+0.500)#131 | 4.9%(+0.200)#11,347 |
| 2. | 59718 | 2.0% | 4.6%(-2.60)#235 | 4.9%(-2.90)#23,579 |
1
Common Questions
What are the Top Zip Codes with the Highest Percentage of Households with Income Below $10,000 in Bozeman, MT?
Top Zip Codes with the Highest Percentage of Households with Income Below $10,000 in Bozeman, MT are:
What zip code has the Highest Percentage of Households with Income Below $10,000 in Bozeman, MT?
59715 has the Highest Percentage of Households with Income Below $10,000 in Bozeman, MT with 5.1%.
What is the Percentage of Households with Income Below $10,000 in Bozeman, MT?
Percentage of Households with Income Below $10,000 in Bozeman is 4.2%.
What is the Percentage of Households with Income Below $10,000 in Montana?
Percentage of Households with Income Below $10,000 in Montana is 4.6%.
What is the Percentage of Households with Income Below $10,000 in the United States?
Percentage of Households with Income Below $10,000 in the United States is 4.9%.