Plummer, MN Map & Demographics
Plummer Map
Plummer Overview
$36,182
PER CAPITA INCOME
$91,023
AVG FAMILY INCOME
$78,750
AVG HOUSEHOLD INCOME
20.3%
WAGE / INCOME GAP [ % ]
79.7¢/ $1
WAGE / INCOME GAP [ $ ]
0.33
INEQUALITY / GINI INDEX
325
TOTAL POPULATION
178
MALE POPULATION
147
FEMALE POPULATION
121.09
MALES / 100 FEMALES
82.58
FEMALES / 100 MALES
39.5
MEDIAN AGE
2.7
AVG FAMILY SIZE
2.4
AVG HOUSEHOLD SIZE
200
LABOR FORCE [ PEOPLE ]
72.7%
PERCENT IN LABOR FORCE
1.0%
UNEMPLOYMENT RATE
Plummer Zip Codes
Plummer Area Codes
Income in Plummer
Income Overview in Plummer
Per Capita Income in Plummer is $36,182, while median incomes of families and households are $91,023 and $78,750 respectively.
| Characteristic | Number | Measure |
| Per Capita Income | 325 | $36,182 |
| Median Family Income | 99 | $91,023 |
| Mean Family Income | 99 | $103,559 |
| Median Household Income | 137 | $78,750 |
| Mean Household Income | 137 | $87,899 |
| Income Deficit | 99 | $0 |
| Wage / Income Gap (%) | 325 | 20.35% |
| Wage / Income Gap ($) | 325 | 79.65¢ per $1 |
| Gini / Inequality Index | 325 | 0.33 |
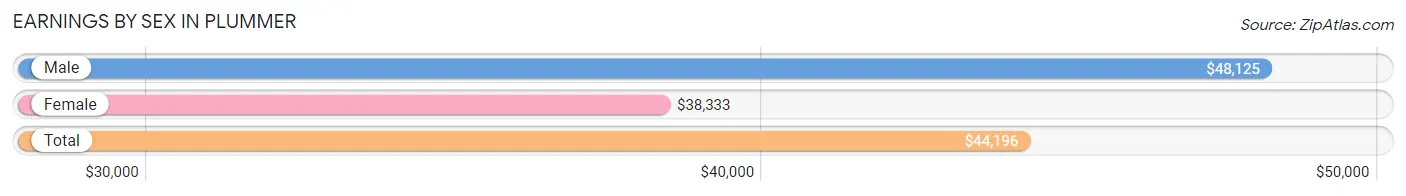
Earnings by Sex in Plummer
Average Earnings in Plummer are $44,196, $48,125 for men and $38,333 for women, a difference of 20.3%.
| Sex | Number | Average Earnings |
| Male | 119 (52.4%) | $48,125 |
| Female | 108 (47.6%) | $38,333 |
| Total | 227 (100.0%) | $44,196 |
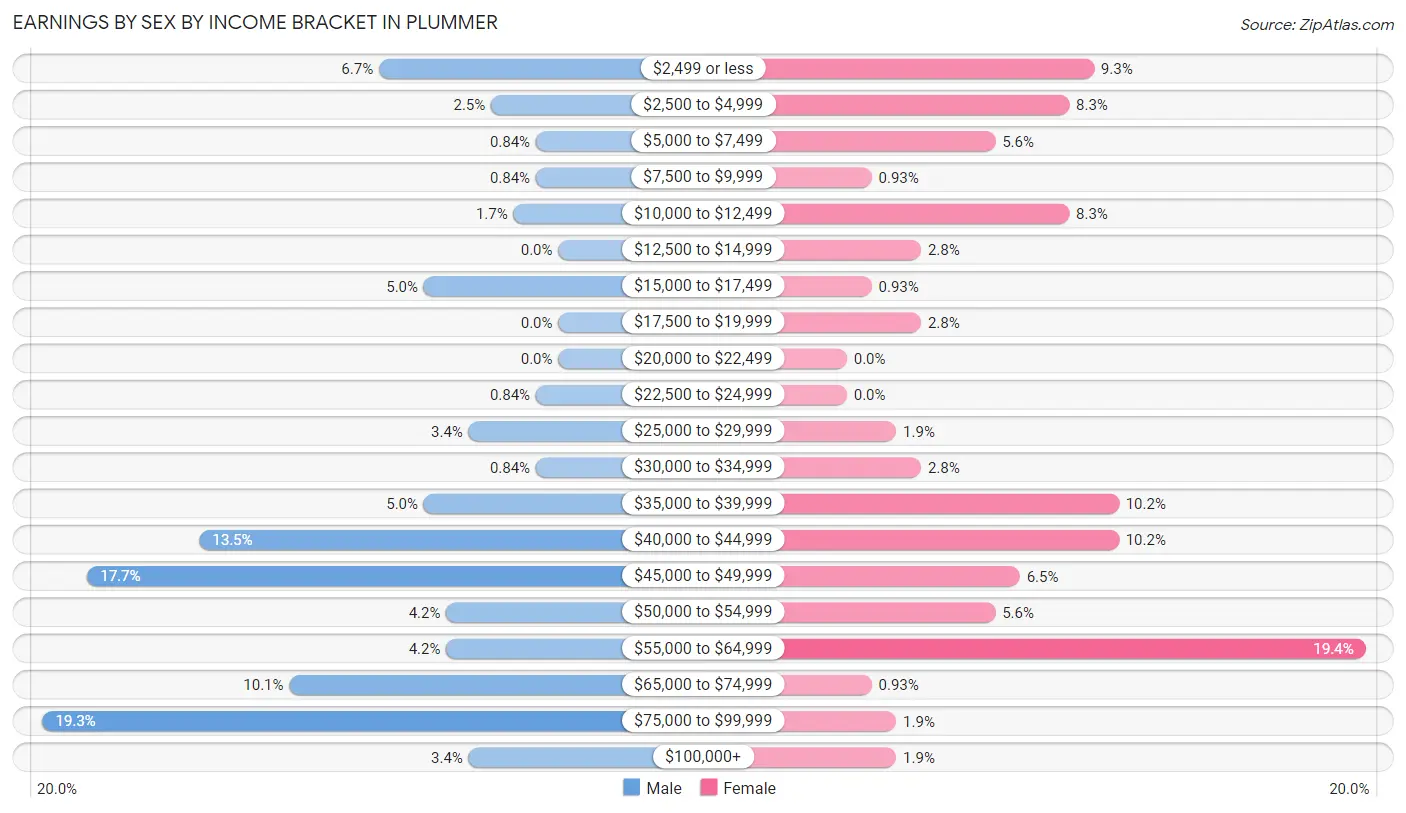
Earnings by Sex by Income Bracket in Plummer
The most common earnings brackets in Plummer are $75,000 to $99,999 for men (23 | 19.3%) and $55,000 to $64,999 for women (21 | 19.4%).
| Income | Male | Female |
| $2,499 or less | 8 (6.7%) | 10 (9.3%) |
| $2,500 to $4,999 | 3 (2.5%) | 9 (8.3%) |
| $5,000 to $7,499 | 1 (0.8%) | 6 (5.6%) |
| $7,500 to $9,999 | 1 (0.8%) | 1 (0.9%) |
| $10,000 to $12,499 | 2 (1.7%) | 9 (8.3%) |
| $12,500 to $14,999 | 0 (0.0%) | 3 (2.8%) |
| $15,000 to $17,499 | 6 (5.0%) | 1 (0.9%) |
| $17,500 to $19,999 | 0 (0.0%) | 3 (2.8%) |
| $20,000 to $22,499 | 0 (0.0%) | 0 (0.0%) |
| $22,500 to $24,999 | 1 (0.8%) | 0 (0.0%) |
| $25,000 to $29,999 | 4 (3.4%) | 2 (1.8%) |
| $30,000 to $34,999 | 1 (0.8%) | 3 (2.8%) |
| $35,000 to $39,999 | 6 (5.0%) | 11 (10.2%) |
| $40,000 to $44,999 | 16 (13.5%) | 11 (10.2%) |
| $45,000 to $49,999 | 21 (17.6%) | 7 (6.5%) |
| $50,000 to $54,999 | 5 (4.2%) | 6 (5.6%) |
| $55,000 to $64,999 | 5 (4.2%) | 21 (19.4%) |
| $65,000 to $74,999 | 12 (10.1%) | 1 (0.9%) |
| $75,000 to $99,999 | 23 (19.3%) | 2 (1.8%) |
| $100,000+ | 4 (3.4%) | 2 (1.8%) |
| Total | 119 (100.0%) | 108 (100.0%) |
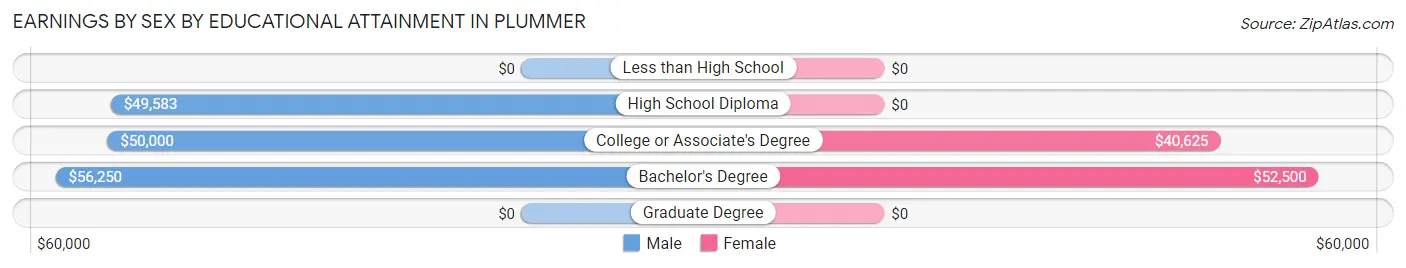
Earnings by Sex by Educational Attainment in Plummer
Average earnings in Plummer are $53,125 for men and $41,806 for women, a difference of 21.3%. Men with an educational attainment of bachelor's degree enjoy the highest average annual earnings of $56,250, while those with high school diploma education earn the least with $49,583. Women with an educational attainment of bachelor's degree earn the most with the average annual earnings of $52,500, while those with college or associate's degree education have the smallest earnings of $40,625.
| Educational Attainment | Male Income | Female Income |
| Less than High School | - | - |
| High School Diploma | $49,583 | $0 |
| College or Associate's Degree | $50,000 | $40,625 |
| Bachelor's Degree | $56,250 | $52,500 |
| Graduate Degree | - | - |
| Total | $53,125 | $41,806 |
Family Income in Plummer
Family Income Brackets in Plummer
According to the Plummer family income data, there are 26 families falling into the $75,000 to $99,999 income range, which is the most common income bracket and makes up 26.3% of all families.
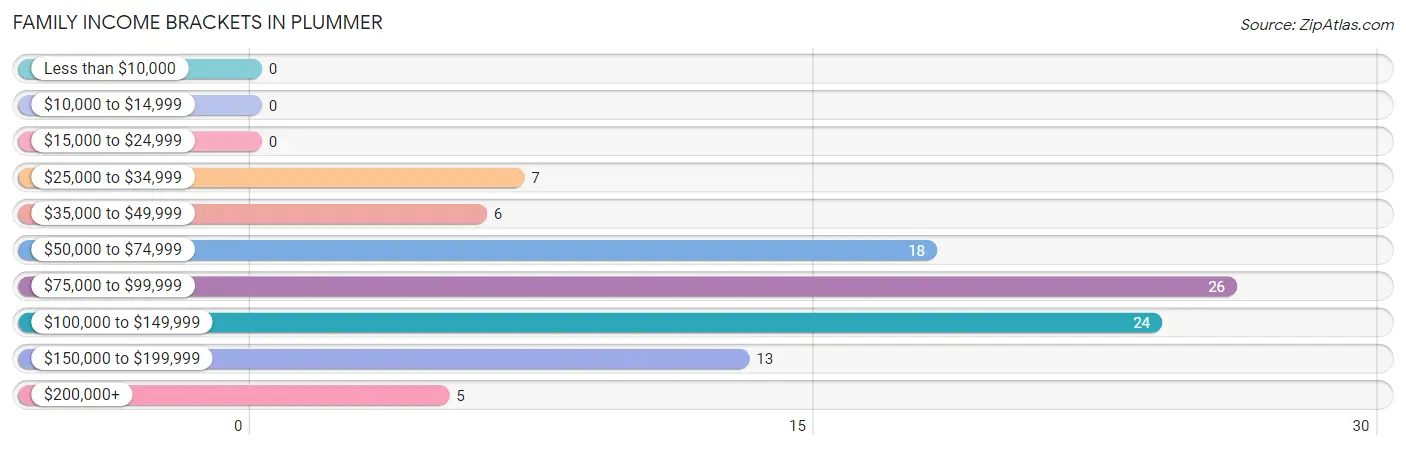
| Income Bracket | # Families | % Families |
| Less than $10,000 | 0 | 0.0% |
| $10,000 to $14,999 | 0 | 0.0% |
| $15,000 to $24,999 | 0 | 0.0% |
| $25,000 to $34,999 | 7 | 7.1% |
| $35,000 to $49,999 | 6 | 6.1% |
| $50,000 to $74,999 | 18 | 18.2% |
| $75,000 to $99,999 | 26 | 26.3% |
| $100,000 to $149,999 | 24 | 24.2% |
| $150,000 to $199,999 | 13 | 13.1% |
| $200,000+ | 5 | 5.1% |
Family Income by Famaliy Size in Plummer
4-person families (32 | 32.3%) account for the highest median family income in Plummer with $125,192 per family, while 2-person families (53 | 53.5%) have the highest median income of $45,284 per family member.
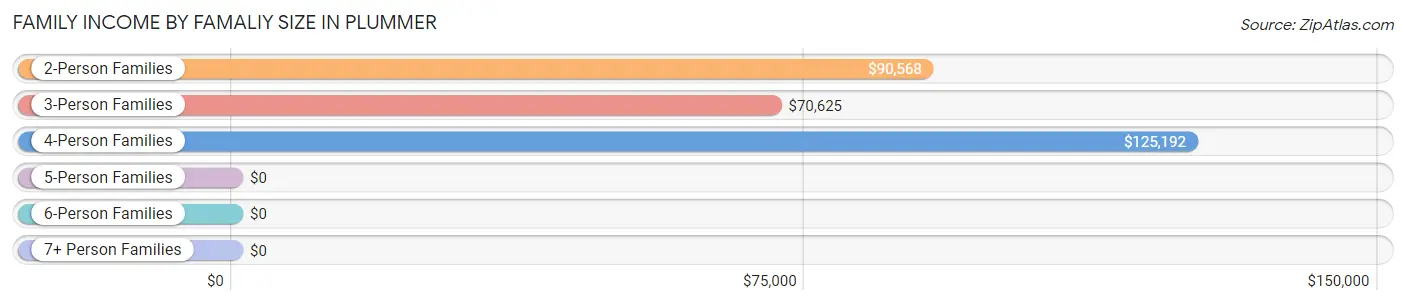
| Income Bracket | # Families | Median Income |
| 2-Person Families | 53 (53.5%) | $90,568 |
| 3-Person Families | 13 (13.1%) | $70,625 |
| 4-Person Families | 32 (32.3%) | $125,192 |
| 5-Person Families | 0 (0.0%) | $0 |
| 6-Person Families | 1 (1.0%) | $0 |
| 7+ Person Families | 0 (0.0%) | $0 |
| Total | 99 (100.0%) | $91,023 |
Family Income by Number of Earners in Plummer
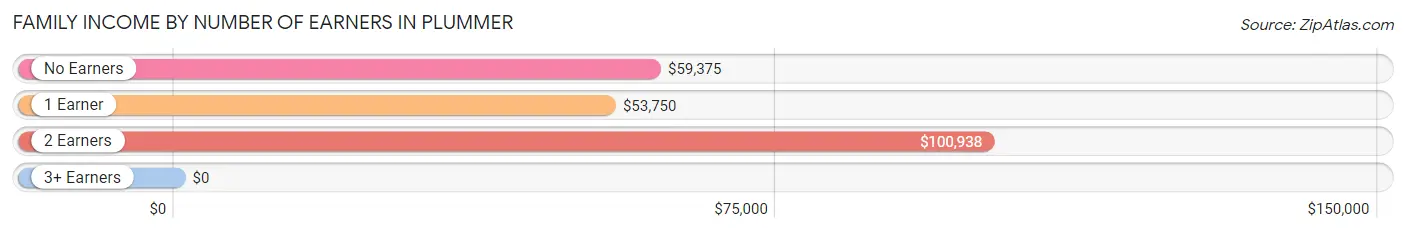
| Number of Earners | # Families | Median Income |
| No Earners | 5 (5.1%) | $59,375 |
| 1 Earner | 14 (14.1%) | $53,750 |
| 2 Earners | 65 (65.7%) | $100,938 |
| 3+ Earners | 15 (15.1%) | $0 |
| Total | 99 (100.0%) | $91,023 |
Household Income in Plummer
Household Income Brackets in Plummer
With 29 households falling in the category, the $75,000 to $99,999 income range is the most frequent in Plummer, accounting for 21.2% of all households.
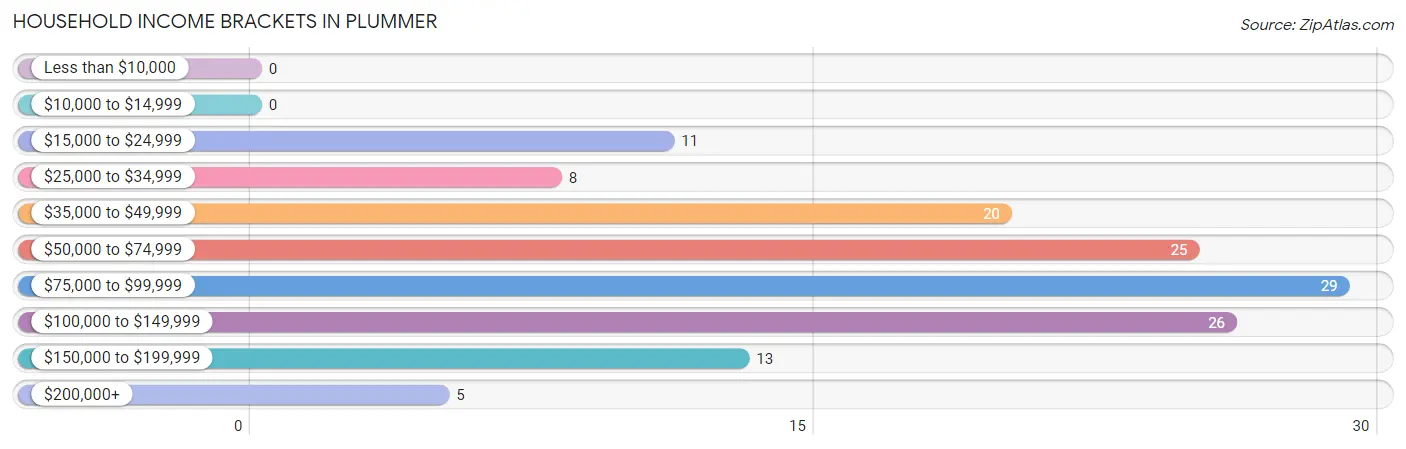
| Income Bracket | # Households | % Households |
| Less than $10,000 | 0 | 0.0% |
| $10,000 to $14,999 | 0 | 0.0% |
| $15,000 to $24,999 | 11 | 8.0% |
| $25,000 to $34,999 | 8 | 5.8% |
| $35,000 to $49,999 | 20 | 14.6% |
| $50,000 to $74,999 | 25 | 18.2% |
| $75,000 to $99,999 | 29 | 21.2% |
| $100,000 to $149,999 | 26 | 19.0% |
| $150,000 to $199,999 | 13 | 9.5% |
| $200,000+ | 5 | 3.6% |
Household Income by Householder Age in Plummer
The median household income in Plummer is $78,750, with the highest median household income of $92,386 found in the 45 to 64 years age bracket for the primary householder. A total of 43 households (31.4%) fall into this category. Meanwhile, the 15 to 24 years age bracket for the primary householder has the lowest median household income of $0, with 3 households (2.2%) in this group.
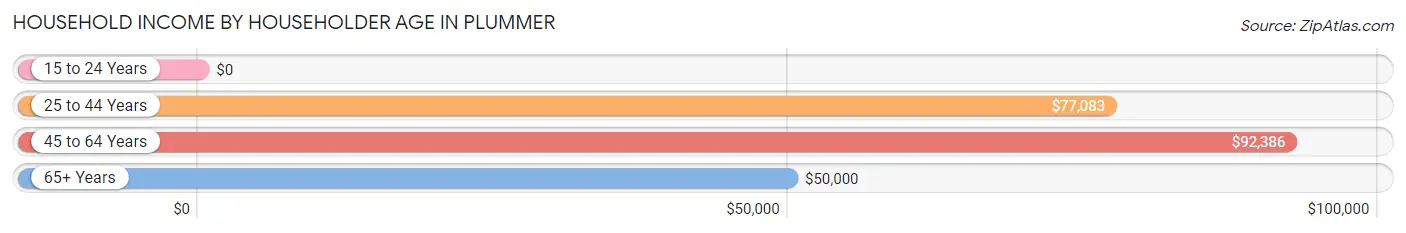
| Income Bracket | # Households | Median Income |
| 15 to 24 Years | 3 (2.2%) | $0 |
| 25 to 44 Years | 49 (35.8%) | $77,083 |
| 45 to 64 Years | 43 (31.4%) | $92,386 |
| 65+ Years | 42 (30.7%) | $50,000 |
| Total | 137 (100.0%) | $78,750 |
Poverty in Plummer
Income Below Poverty by Sex and Age in Plummer
With 5.6% poverty level for males and 4.1% for females among the residents of Plummer, 35 to 44 year old males and 15 year old females are the most vulnerable to poverty, with 5 males (23.8%) and 1 females (100.0%) in their respective age groups living below the poverty level.
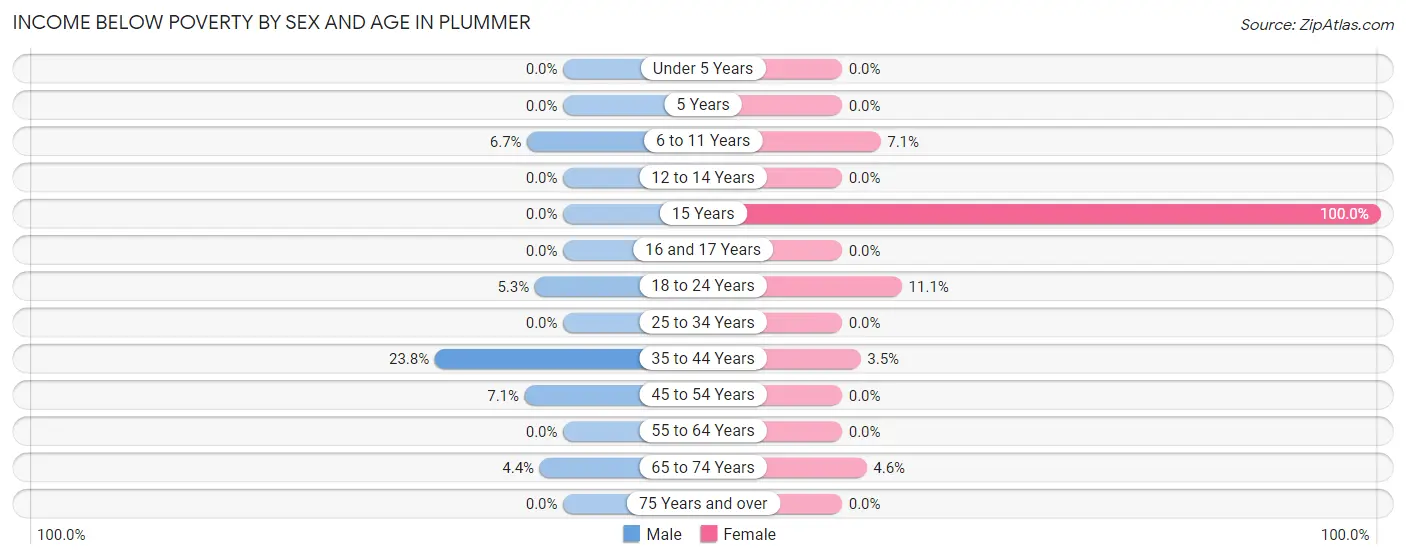
| Age Bracket | Male | Female |
| Under 5 Years | 0 (0.0%) | 0 (0.0%) |
| 5 Years | 0 (0.0%) | 0 (0.0%) |
| 6 to 11 Years | 1 (6.7%) | 1 (7.1%) |
| 12 to 14 Years | 0 (0.0%) | 0 (0.0%) |
| 15 Years | 0 (0.0%) | 1 (100.0%) |
| 16 and 17 Years | 0 (0.0%) | 0 (0.0%) |
| 18 to 24 Years | 1 (5.3%) | 2 (11.1%) |
| 25 to 34 Years | 0 (0.0%) | 0 (0.0%) |
| 35 to 44 Years | 5 (23.8%) | 1 (3.5%) |
| 45 to 54 Years | 2 (7.1%) | 0 (0.0%) |
| 55 to 64 Years | 0 (0.0%) | 0 (0.0%) |
| 65 to 74 Years | 1 (4.3%) | 1 (4.5%) |
| 75 Years and over | 0 (0.0%) | 0 (0.0%) |
| Total | 10 (5.6%) | 6 (4.1%) |
Income Above Poverty by Sex and Age in Plummer
According to the poverty statistics in Plummer, males aged under 5 years and females aged under 5 years are the age groups that are most secure financially, with 100.0% of males and 100.0% of females in these age groups living above the poverty line.
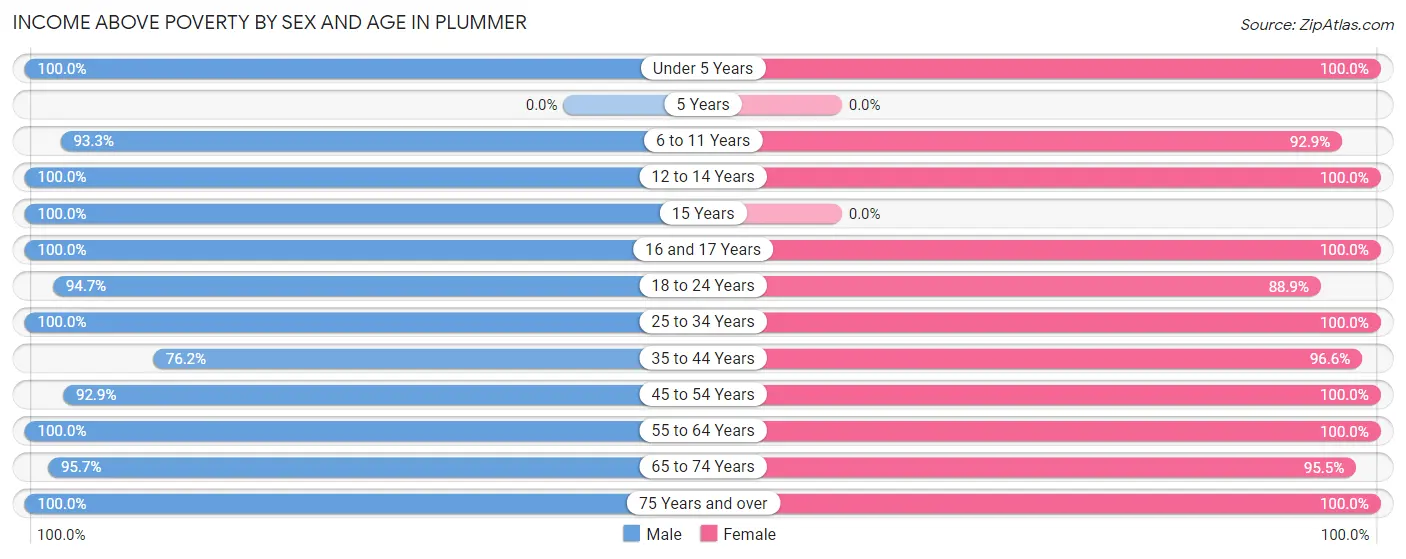
| Age Bracket | Male | Female |
| Under 5 Years | 4 (100.0%) | 5 (100.0%) |
| 5 Years | 0 (0.0%) | 0 (0.0%) |
| 6 to 11 Years | 14 (93.3%) | 13 (92.9%) |
| 12 to 14 Years | 3 (100.0%) | 2 (100.0%) |
| 15 Years | 6 (100.0%) | 0 (0.0%) |
| 16 and 17 Years | 10 (100.0%) | 13 (100.0%) |
| 18 to 24 Years | 18 (94.7%) | 16 (88.9%) |
| 25 to 34 Years | 22 (100.0%) | 5 (100.0%) |
| 35 to 44 Years | 16 (76.2%) | 28 (96.6%) |
| 45 to 54 Years | 26 (92.9%) | 15 (100.0%) |
| 55 to 64 Years | 24 (100.0%) | 14 (100.0%) |
| 65 to 74 Years | 22 (95.7%) | 21 (95.5%) |
| 75 Years and over | 3 (100.0%) | 9 (100.0%) |
| Total | 168 (94.4%) | 141 (95.9%) |
Income Below Poverty Among Married-Couple Families in Plummer
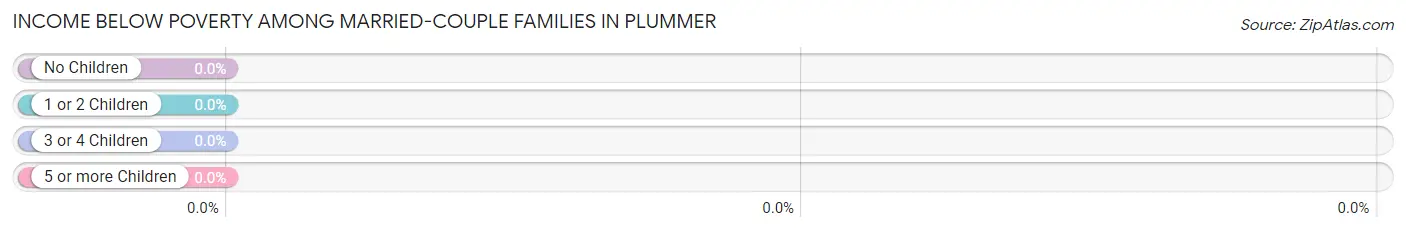
| Children | Above Poverty | Below Poverty |
| No Children | 35 (100.0%) | 0 (0.0%) |
| 1 or 2 Children | 23 (100.0%) | 0 (0.0%) |
| 3 or 4 Children | 0 (0.0%) | 0 (0.0%) |
| 5 or more Children | 0 (0.0%) | 0 (0.0%) |
| Total | 58 (100.0%) | 0 (0.0%) |
Income Below Poverty Among Single-Parent Households in Plummer
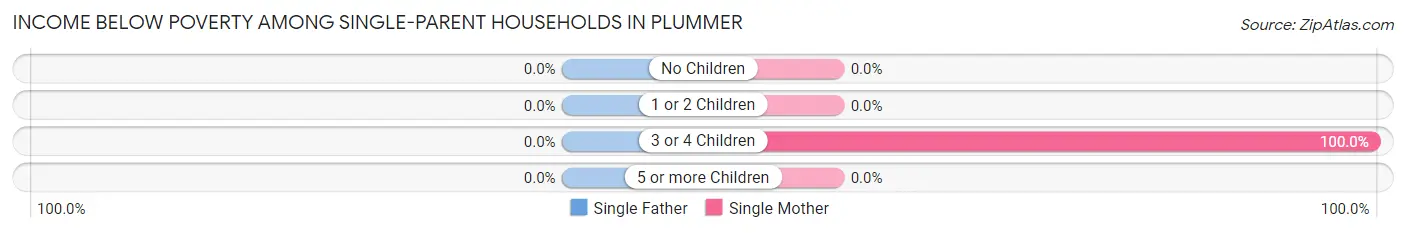
| Children | Single Father | Single Mother |
| No Children | 0 (0.0%) | 0 (0.0%) |
| 1 or 2 Children | 0 (0.0%) | 0 (0.0%) |
| 3 or 4 Children | 0 (0.0%) | 1 (100.0%) |
| 5 or more Children | 0 (0.0%) | 0 (0.0%) |
| Total | 0 (0.0%) | 1 (5.0%) |
Income Below Poverty Among Married-Couple vs Single-Parent Households in Plummer
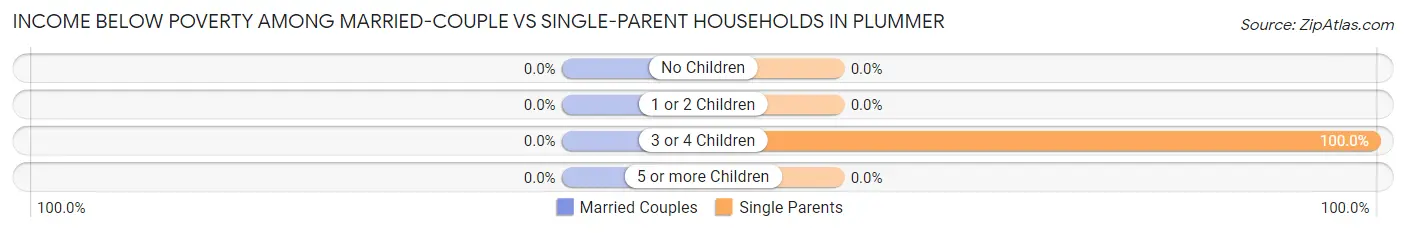
| Children | Married-Couple Families | Single-Parent Households |
| No Children | 0 (0.0%) | 0 (0.0%) |
| 1 or 2 Children | 0 (0.0%) | 0 (0.0%) |
| 3 or 4 Children | 0 (0.0%) | 1 (100.0%) |
| 5 or more Children | 0 (0.0%) | 0 (0.0%) |
| Total | 0 (0.0%) | 1 (2.4%) |
Race in Plummer
The most populous races in Plummer are White / Caucasian (293 | 90.1%), Black / African American (17 | 5.2%), and Hispanic or Latino (14 | 4.3%).
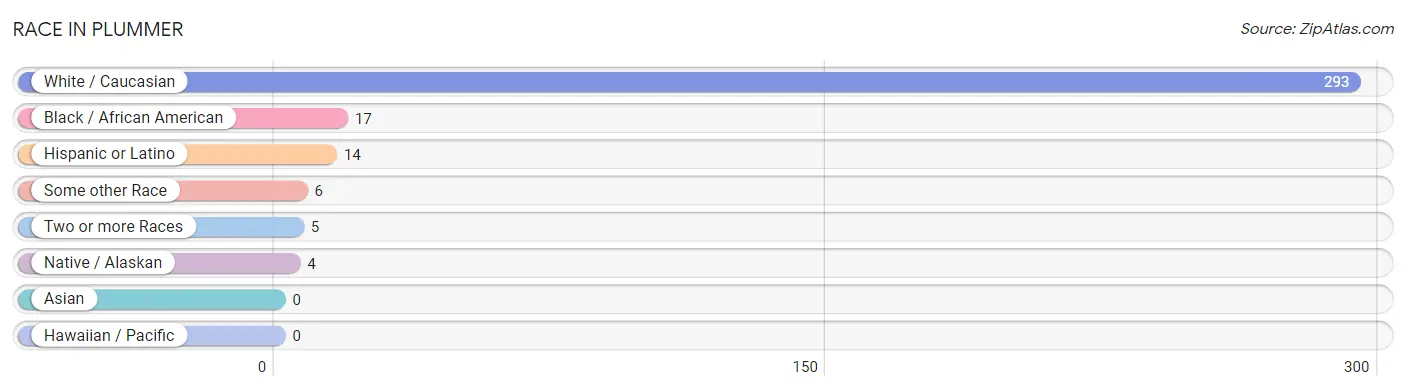
| Race | # Population | % Population |
| Asian | 0 | 0.0% |
| Black / African American | 17 | 5.2% |
| Hawaiian / Pacific | 0 | 0.0% |
| Hispanic or Latino | 14 | 4.3% |
| Native / Alaskan | 4 | 1.2% |
| White / Caucasian | 293 | 90.1% |
| Two or more Races | 5 | 1.5% |
| Some other Race | 6 | 1.8% |
| Total | 325 | 100.0% |
Ancestry in Plummer
The most populous ancestries reported in Plummer are German (122 | 37.5%), Norwegian (82 | 25.2%), French (42 | 12.9%), Swedish (34 | 10.5%), and French Canadian (24 | 7.4%), together accounting for 93.5% of all Plummer residents.
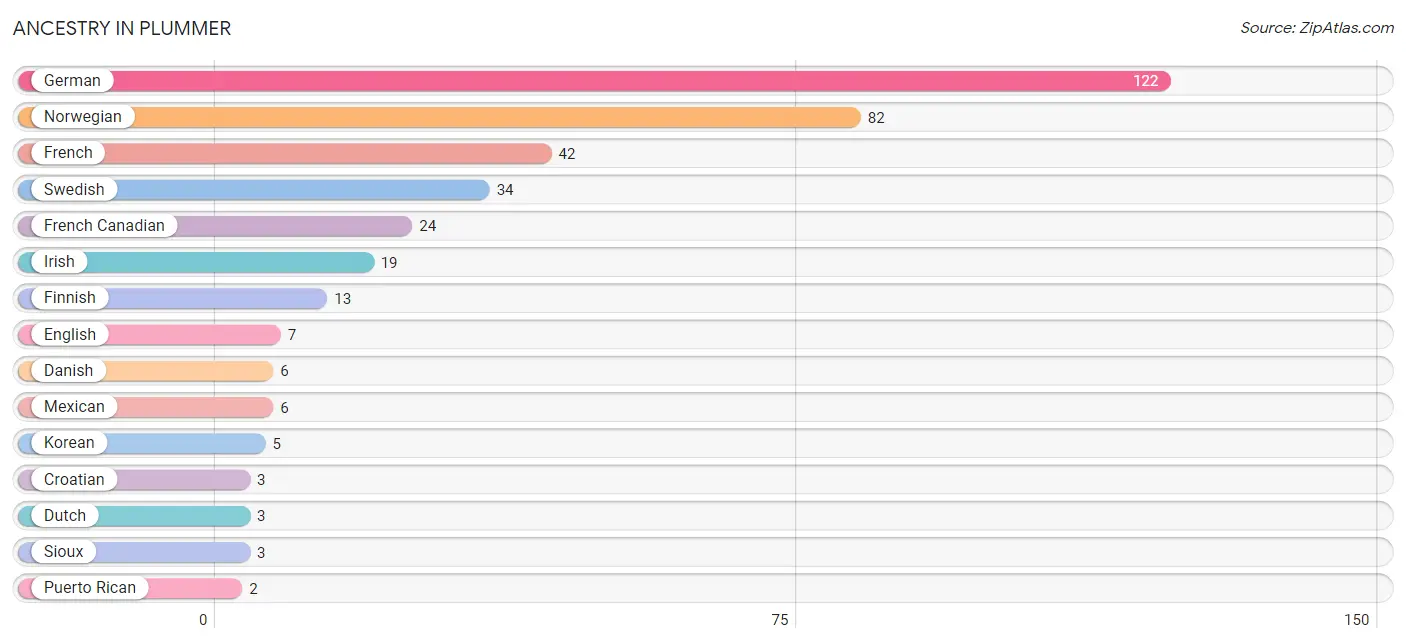
| Ancestry | # Population | % Population |
| Chippewa | 1 | 0.3% |
| Colombian | 1 | 0.3% |
| Croatian | 3 | 0.9% |
| Danish | 6 | 1.8% |
| Dutch | 3 | 0.9% |
| English | 7 | 2.1% |
| Finnish | 13 | 4.0% |
| French | 42 | 12.9% |
| French Canadian | 24 | 7.4% |
| German | 122 | 37.5% |
| Irish | 19 | 5.9% |
| Korean | 5 | 1.5% |
| Mexican | 6 | 1.8% |
| Norwegian | 82 | 25.2% |
| Puerto Rican | 2 | 0.6% |
| Scandinavian | 1 | 0.3% |
| Scottish | 1 | 0.3% |
| Sioux | 3 | 0.9% |
| South American | 1 | 0.3% |
| Swedish | 34 | 10.5% |
| Ukrainian | 1 | 0.3% | View All 21 Rows |
Immigrants in Plummer
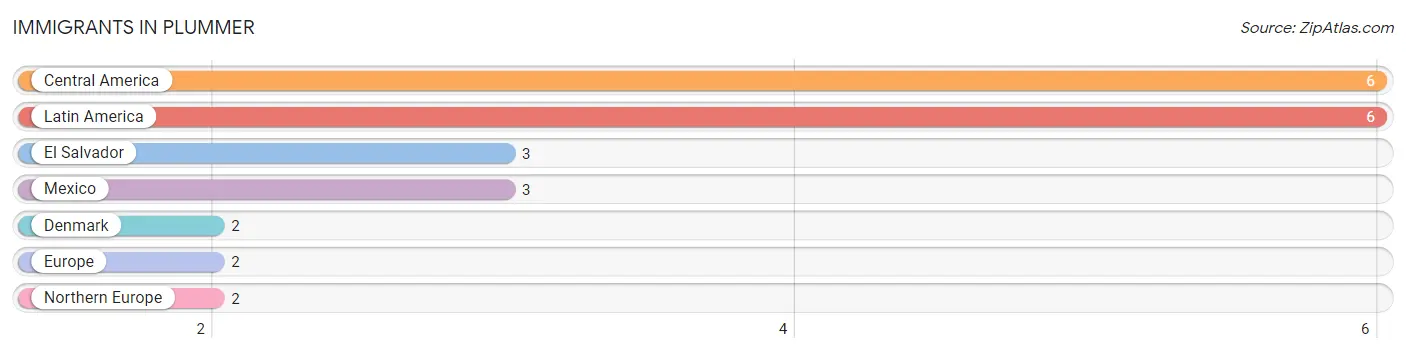
The most numerous immigrant groups reported in Plummer came from Central America (6 | 1.8%), Latin America (6 | 1.8%), El Salvador (3 | 0.9%), Mexico (3 | 0.9%), and Denmark (2 | 0.6%), together accounting for 6.2% of all Plummer residents.
| Immigration Origin | # Population | % Population |
| Central America | 6 | 1.8% |
| Denmark | 2 | 0.6% |
| El Salvador | 3 | 0.9% |
| Europe | 2 | 0.6% |
| Latin America | 6 | 1.8% |
| Mexico | 3 | 0.9% |
| Northern Europe | 2 | 0.6% | View All 7 Rows |
Sex and Age in Plummer
Sex and Age in Plummer
The most populous age groups in Plummer are 15 to 19 Years (20 | 11.2%) for men and 15 to 19 Years (25 | 17.0%) for women.
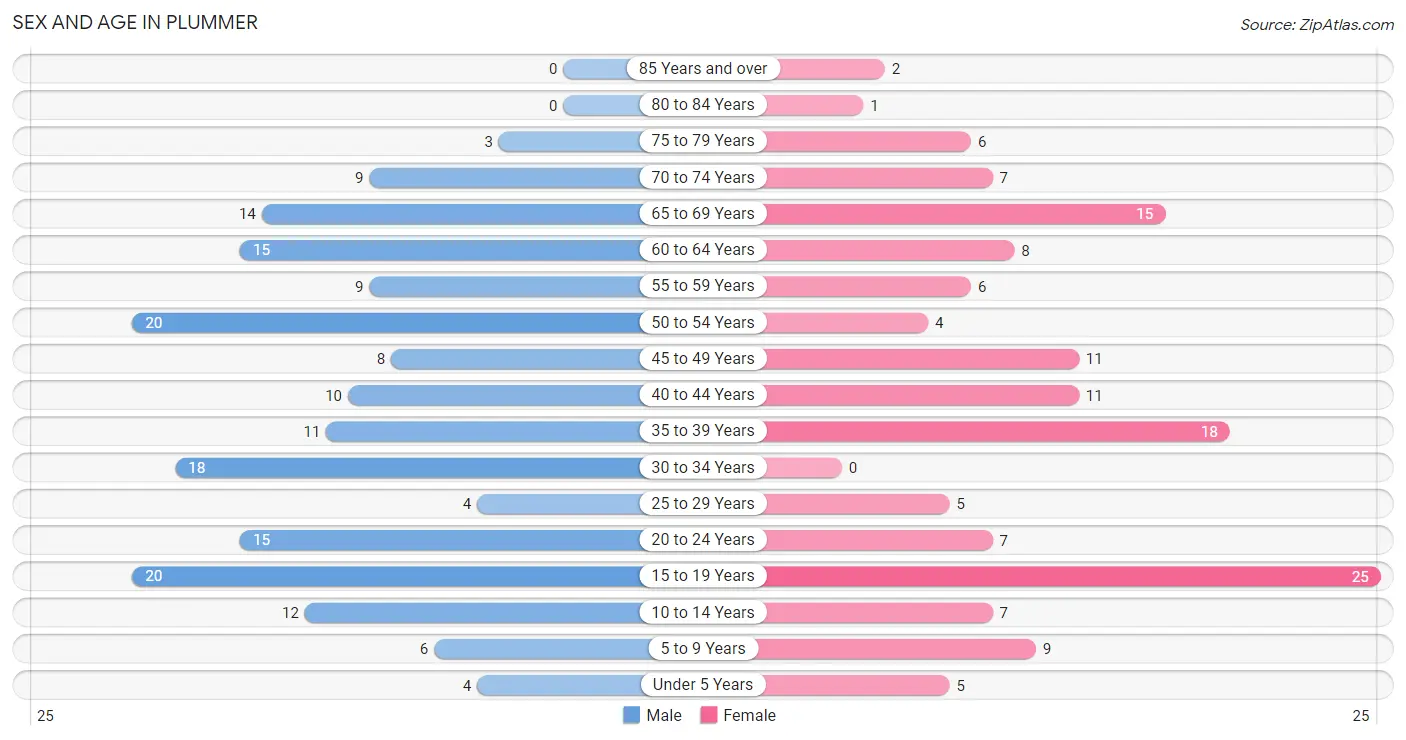
| Age Bracket | Male | Female |
| Under 5 Years | 4 (2.2%) | 5 (3.4%) |
| 5 to 9 Years | 6 (3.4%) | 9 (6.1%) |
| 10 to 14 Years | 12 (6.7%) | 7 (4.8%) |
| 15 to 19 Years | 20 (11.2%) | 25 (17.0%) |
| 20 to 24 Years | 15 (8.4%) | 7 (4.8%) |
| 25 to 29 Years | 4 (2.2%) | 5 (3.4%) |
| 30 to 34 Years | 18 (10.1%) | 0 (0.0%) |
| 35 to 39 Years | 11 (6.2%) | 18 (12.2%) |
| 40 to 44 Years | 10 (5.6%) | 11 (7.5%) |
| 45 to 49 Years | 8 (4.5%) | 11 (7.5%) |
| 50 to 54 Years | 20 (11.2%) | 4 (2.7%) |
| 55 to 59 Years | 9 (5.1%) | 6 (4.1%) |
| 60 to 64 Years | 15 (8.4%) | 8 (5.4%) |
| 65 to 69 Years | 14 (7.9%) | 15 (10.2%) |
| 70 to 74 Years | 9 (5.1%) | 7 (4.8%) |
| 75 to 79 Years | 3 (1.7%) | 6 (4.1%) |
| 80 to 84 Years | 0 (0.0%) | 1 (0.7%) |
| 85 Years and over | 0 (0.0%) | 2 (1.4%) |
| Total | 178 (100.0%) | 147 (100.0%) |
Families and Households in Plummer
Median Family Size in Plummer
The median family size in Plummer is 2.73 persons per family, with single female/mother families (20 | 20.2%) accounting for the largest median family size of 3.7 persons per family. On the other hand, single male/father families (21 | 21.2%) represent the smallest median family size with 2.33 persons per family.
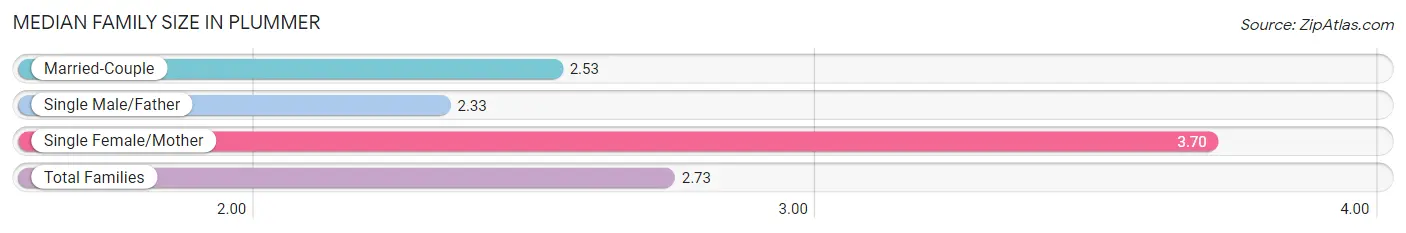
| Family Type | # Families | Family Size |
| Married-Couple | 58 (58.6%) | 2.53 |
| Single Male/Father | 21 (21.2%) | 2.33 |
| Single Female/Mother | 20 (20.2%) | 3.70 |
| Total Families | 99 (100.0%) | 2.73 |
Median Household Size in Plummer
The median household size in Plummer is 2.37 persons per household, with single female/mother households (20 | 14.6%) accounting for the largest median household size of 4.05 persons per household. non-family households (38 | 27.7%) represent the smallest median household size with 1.21 persons per household.
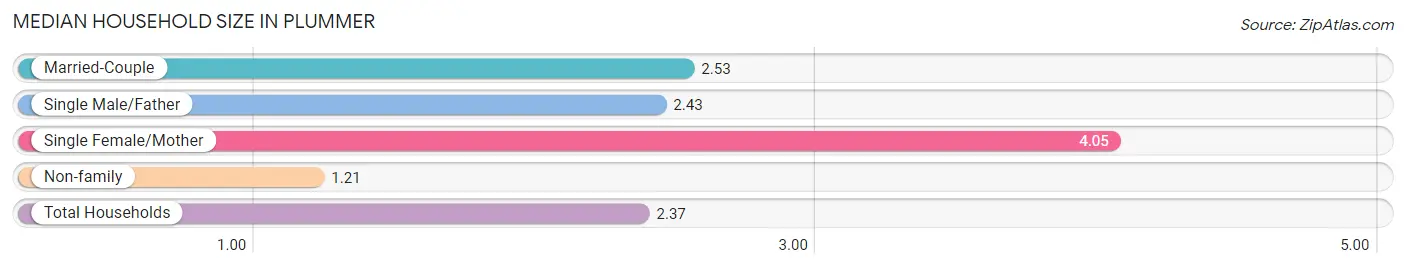
| Household Type | # Households | Household Size |
| Married-Couple | 58 (42.3%) | 2.53 |
| Single Male/Father | 21 (15.3%) | 2.43 |
| Single Female/Mother | 20 (14.6%) | 4.05 |
| Non-family | 38 (27.7%) | 1.21 |
| Total Households | 137 (100.0%) | 2.37 |
Household Size by Marriage Status in Plummer
Out of a total of 137 households in Plummer, 99 (72.3%) are family households, while 38 (27.7%) are nonfamily households. The most numerous type of family households are 2-person households, comprising 51, and the most common type of nonfamily households are 1-person households, comprising 29.
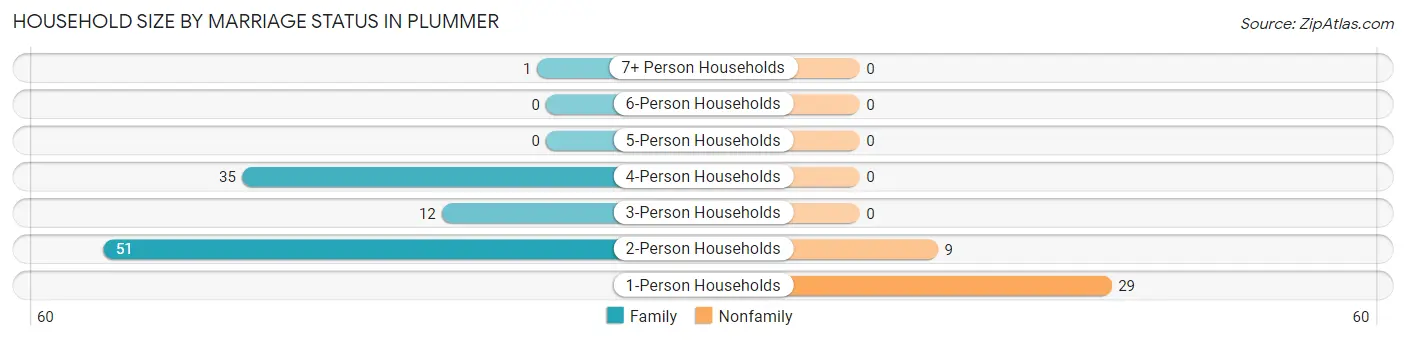
| Household Size | Family Households | Nonfamily Households |
| 1-Person Households | - | 29 (21.2%) |
| 2-Person Households | 51 (37.2%) | 9 (6.6%) |
| 3-Person Households | 12 (8.8%) | 0 (0.0%) |
| 4-Person Households | 35 (25.6%) | 0 (0.0%) |
| 5-Person Households | 0 (0.0%) | 0 (0.0%) |
| 6-Person Households | 0 (0.0%) | 0 (0.0%) |
| 7+ Person Households | 1 (0.7%) | 0 (0.0%) |
| Total | 99 (72.3%) | 38 (27.7%) |
Female Fertility in Plummer
Fertility by Age in Plummer
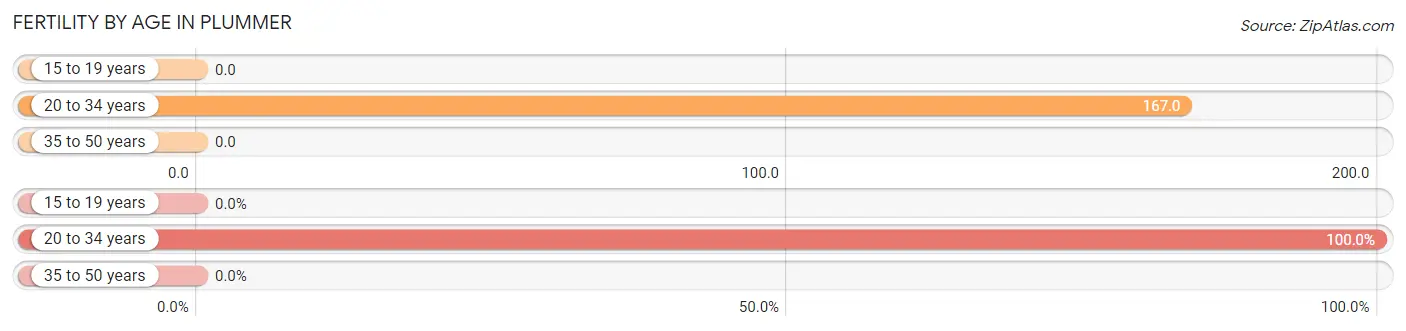
Average fertility rate in Plummer is 26.0 births per 1,000 women. Women in the age bracket of 20 to 34 years have the highest fertility rate with 167.0 births per 1,000 women. Women in the age bracket of 20 to 34 years acount for 100.0% of all women with births.
| Age Bracket | Women with Births | Births / 1,000 Women |
| 15 to 19 years | 0 (0.0%) | 0.0 |
| 20 to 34 years | 2 (100.0%) | 167.0 |
| 35 to 50 years | 0 (0.0%) | 0.0 |
| Total | 2 (100.0%) | 26.0 |
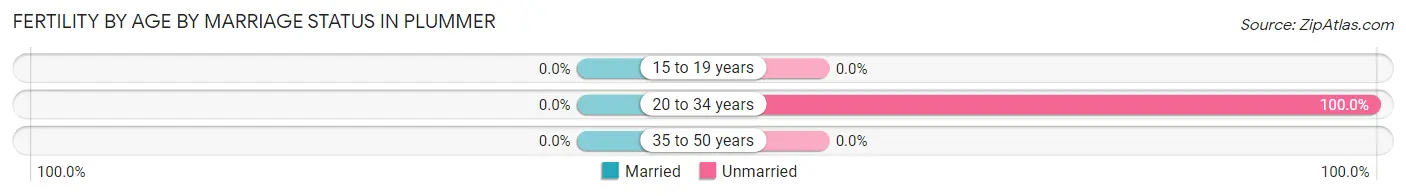
Fertility by Age by Marriage Status in Plummer
| Age Bracket | Married | Unmarried |
| 15 to 19 years | 0 (0.0%) | 0 (0.0%) |
| 20 to 34 years | 0 (0.0%) | 2 (100.0%) |
| 35 to 50 years | 0 (0.0%) | 0 (0.0%) |
| Total | 0 (0.0%) | 2 (100.0%) |
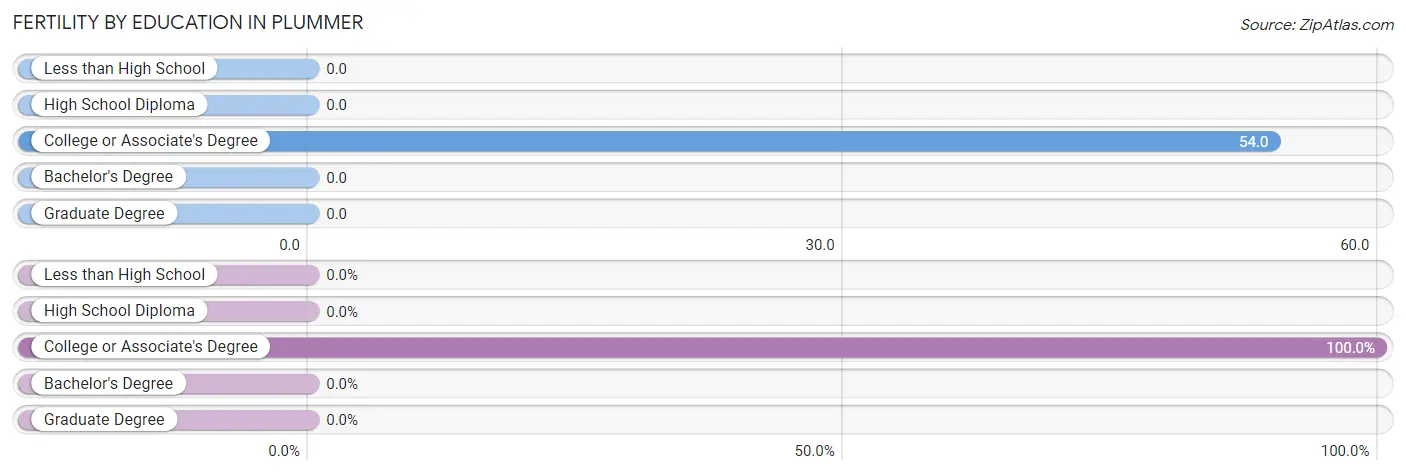
Fertility by Education in Plummer
| Educational Attainment | Women with Births | Births / 1,000 Women |
| Less than High School | 0 (0.0%) | 0.0 |
| High School Diploma | 0 (0.0%) | 0.0 |
| College or Associate's Degree | 2 (100.0%) | 54.0 |
| Bachelor's Degree | 0 (0.0%) | 0.0 |
| Graduate Degree | 0 (0.0%) | 0.0 |
| Total | 2 (100.0%) | 26.0 |
Fertility by Education by Marriage Status in Plummer
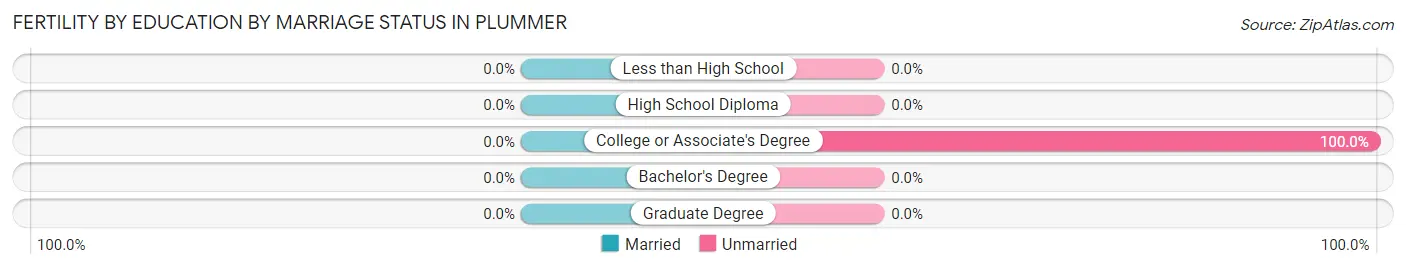
| Educational Attainment | Married | Unmarried |
| Less than High School | 0 (0.0%) | 0 (0.0%) |
| High School Diploma | 0 (0.0%) | 0 (0.0%) |
| College or Associate's Degree | 0 (0.0%) | 2 (100.0%) |
| Bachelor's Degree | 0 (0.0%) | 0 (0.0%) |
| Graduate Degree | 0 (0.0%) | 0 (0.0%) |
| Total | 0 (0.0%) | 2 (100.0%) |
Employment Characteristics in Plummer
Employment by Class of Employer in Plummer
Among the 198 employed individuals in Plummer, private company employees (156 | 78.8%), local government employees (10 | 5.1%), and self-employed (incorporated) (8 | 4.0%) make up the most common classes of employment.
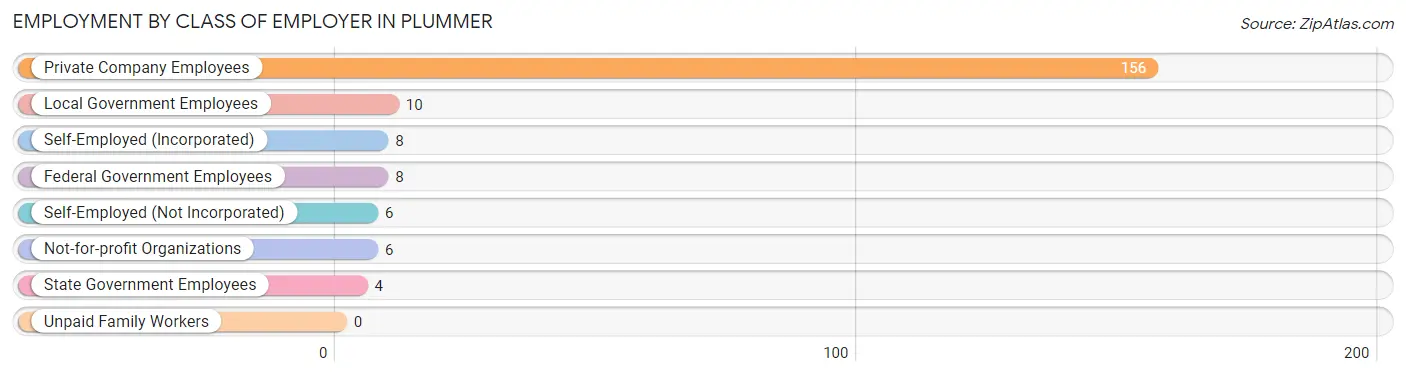
| Employer Class | # Employees | % Employees |
| Private Company Employees | 156 | 78.8% |
| Self-Employed (Incorporated) | 8 | 4.0% |
| Self-Employed (Not Incorporated) | 6 | 3.0% |
| Not-for-profit Organizations | 6 | 3.0% |
| Local Government Employees | 10 | 5.1% |
| State Government Employees | 4 | 2.0% |
| Federal Government Employees | 8 | 4.0% |
| Unpaid Family Workers | 0 | 0.0% |
| Total | 198 | 100.0% |
Employment Status by Age in Plummer
According to the labor force statistics for Plummer, out of the total population over 16 years of age (275), 72.7% or 200 individuals are in the labor force, with 1.0% or 2 of them unemployed. The age group with the highest labor force participation rate is 20 to 24 years, with 100.0% or 22 individuals in the labor force. Within the labor force, the 20 to 24 years age range has the highest percentage of unemployed individuals, with 4.5% or 1 of them being unemployed.
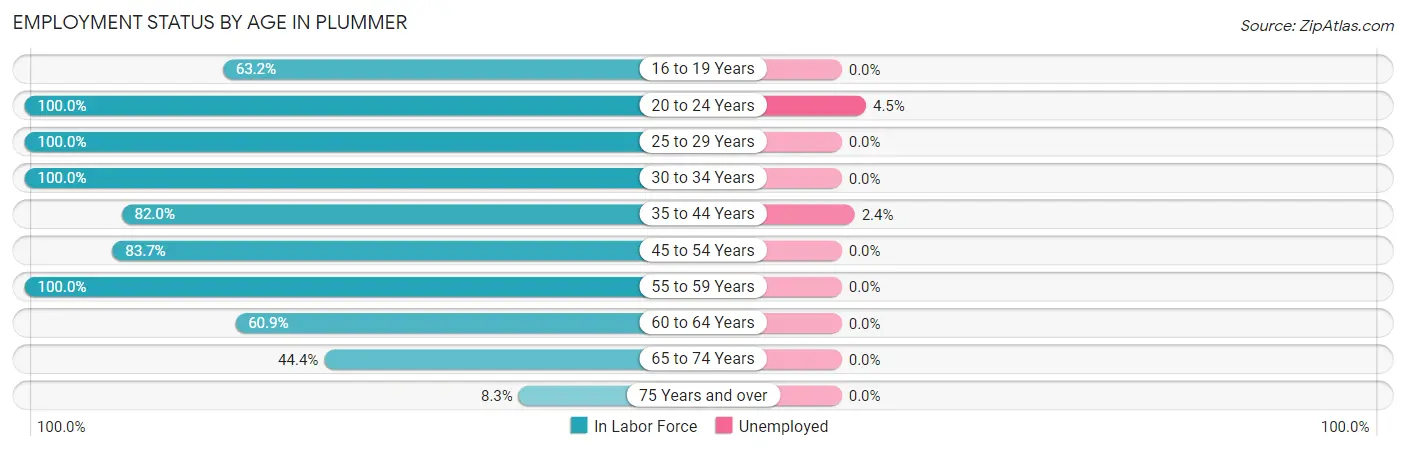
| Age Bracket | In Labor Force | Unemployed |
| 16 to 19 Years | 24 (63.2%) | 0 (0.0%) |
| 20 to 24 Years | 22 (100.0%) | 1 (4.5%) |
| 25 to 29 Years | 9 (100.0%) | 0 (0.0%) |
| 30 to 34 Years | 18 (100.0%) | 0 (0.0%) |
| 35 to 44 Years | 41 (82.0%) | 1 (2.4%) |
| 45 to 54 Years | 36 (83.7%) | 0 (0.0%) |
| 55 to 59 Years | 15 (100.0%) | 0 (0.0%) |
| 60 to 64 Years | 14 (60.9%) | 0 (0.0%) |
| 65 to 74 Years | 20 (44.4%) | 0 (0.0%) |
| 75 Years and over | 1 (8.3%) | 0 (0.0%) |
| Total | 200 (72.7%) | 2 (1.0%) |
Employment Status by Educational Attainment in Plummer
According to labor force statistics for Plummer, 84.2% of individuals (133) out of the total population between 25 and 64 years of age (158) are in the labor force, with 0.8% or 1 of them being unemployed. The group with the highest labor force participation rate are those with the educational attainment of less than high school, with 100.0% or 9 individuals in the labor force. Within the labor force, individuals with high school diploma education have the highest percentage of unemployment, with 3.2% or 1 of them being unemployed.
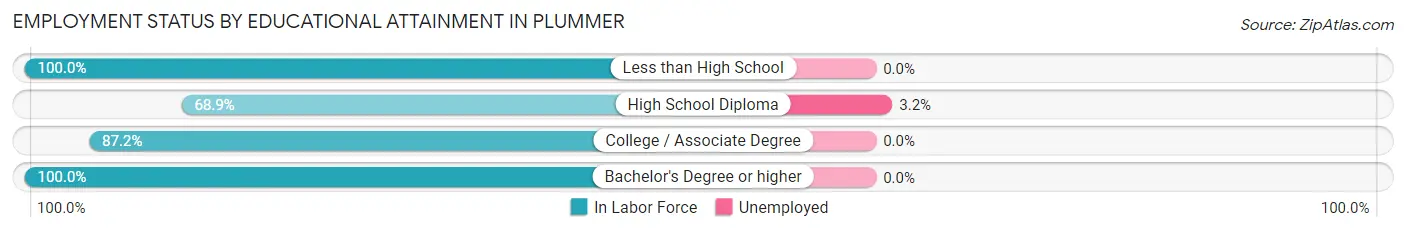
| Educational Attainment | In Labor Force | Unemployed |
| Less than High School | 9 (100.0%) | 0 (0.0%) |
| High School Diploma | 31 (68.9%) | 1 (3.2%) |
| College / Associate Degree | 75 (87.2%) | 0 (0.0%) |
| Bachelor's Degree or higher | 18 (100.0%) | 0 (0.0%) |
| Total | 133 (84.2%) | 1 (0.8%) |
Employment Occupations by Sex in Plummer
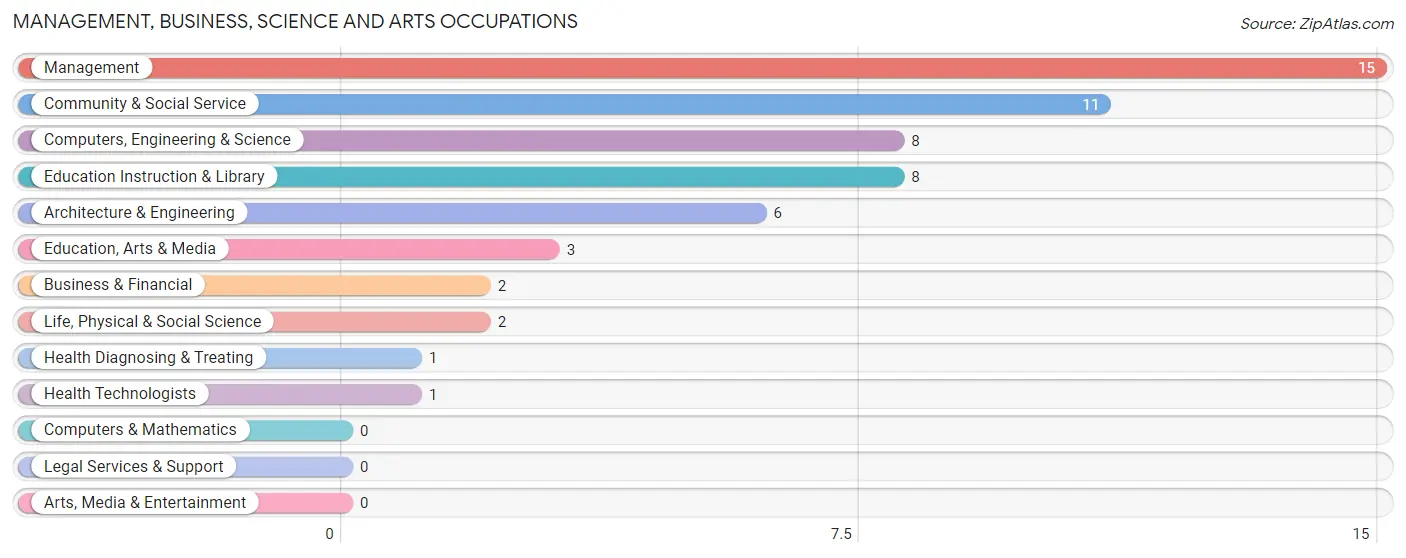
Management, Business, Science and Arts Occupations
The most common Management, Business, Science and Arts occupations in Plummer are Management (15 | 7.6%), Community & Social Service (11 | 5.6%), Computers, Engineering & Science (8 | 4.0%), Education Instruction & Library (8 | 4.0%), and Architecture & Engineering (6 | 3.0%).
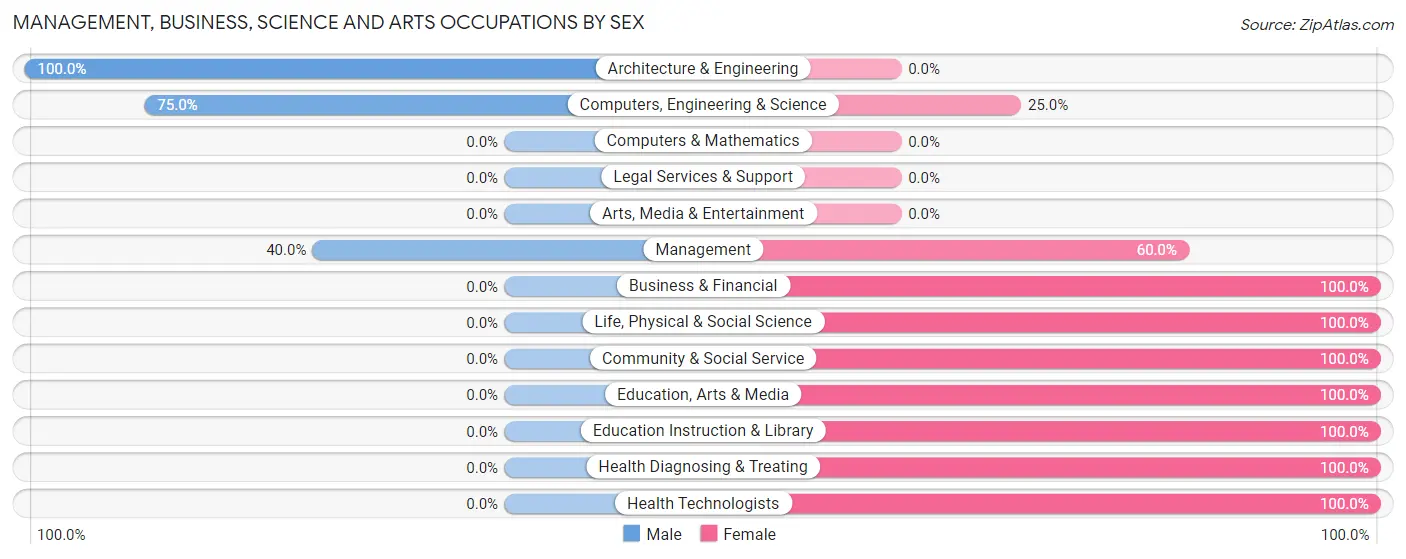
Management, Business, Science and Arts Occupations by Sex
Within the Management, Business, Science and Arts occupations in Plummer, the most male-oriented occupations are Architecture & Engineering (100.0%), Computers, Engineering & Science (75.0%), and Management (40.0%), while the most female-oriented occupations are Business & Financial (100.0%), Life, Physical & Social Science (100.0%), and Community & Social Service (100.0%).
| Occupation | Male | Female |
| Management | 6 (40.0%) | 9 (60.0%) |
| Business & Financial | 0 (0.0%) | 2 (100.0%) |
| Computers, Engineering & Science | 6 (75.0%) | 2 (25.0%) |
| Computers & Mathematics | 0 (0.0%) | 0 (0.0%) |
| Architecture & Engineering | 6 (100.0%) | 0 (0.0%) |
| Life, Physical & Social Science | 0 (0.0%) | 2 (100.0%) |
| Community & Social Service | 0 (0.0%) | 11 (100.0%) |
| Education, Arts & Media | 0 (0.0%) | 3 (100.0%) |
| Legal Services & Support | 0 (0.0%) | 0 (0.0%) |
| Education Instruction & Library | 0 (0.0%) | 8 (100.0%) |
| Arts, Media & Entertainment | 0 (0.0%) | 0 (0.0%) |
| Health Diagnosing & Treating | 0 (0.0%) | 1 (100.0%) |
| Health Technologists | 0 (0.0%) | 1 (100.0%) |
| Total (Category) | 12 (32.4%) | 25 (67.6%) |
| Total (Overall) | 104 (52.5%) | 94 (47.5%) |
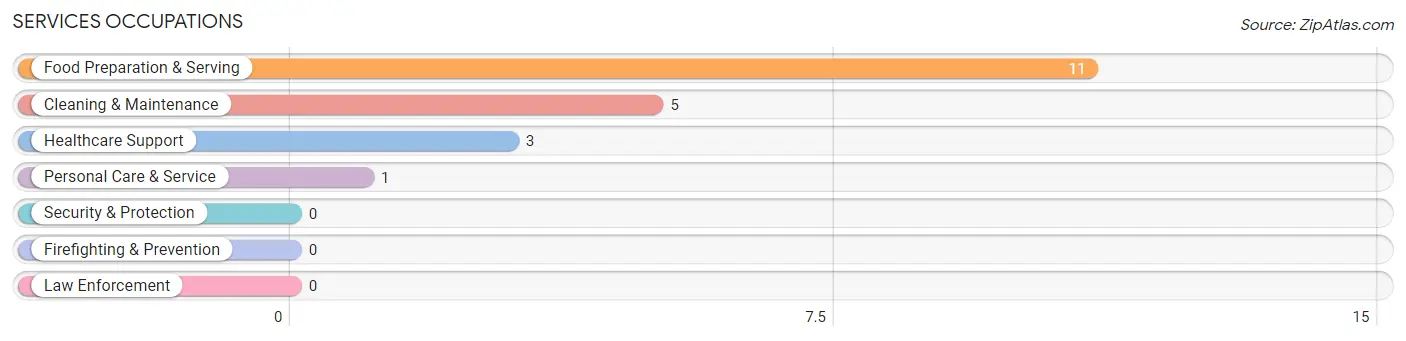
Services Occupations
The most common Services occupations in Plummer are Food Preparation & Serving (11 | 5.6%), Cleaning & Maintenance (5 | 2.5%), Healthcare Support (3 | 1.5%), and Personal Care & Service (1 | 0.5%).
Services Occupations by Sex
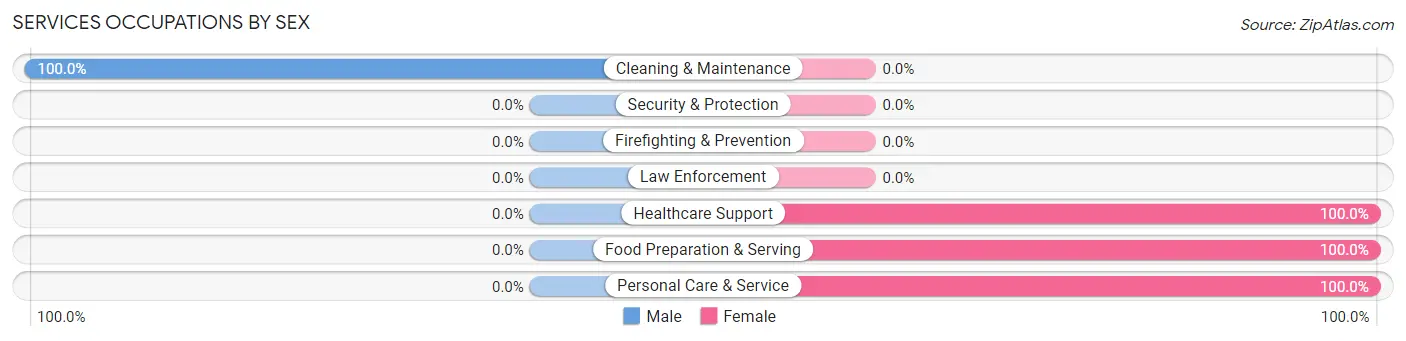
| Occupation | Male | Female |
| Healthcare Support | 0 (0.0%) | 3 (100.0%) |
| Security & Protection | 0 (0.0%) | 0 (0.0%) |
| Firefighting & Prevention | 0 (0.0%) | 0 (0.0%) |
| Law Enforcement | 0 (0.0%) | 0 (0.0%) |
| Food Preparation & Serving | 0 (0.0%) | 11 (100.0%) |
| Cleaning & Maintenance | 5 (100.0%) | 0 (0.0%) |
| Personal Care & Service | 0 (0.0%) | 1 (100.0%) |
| Total (Category) | 5 (25.0%) | 15 (75.0%) |
| Total (Overall) | 104 (52.5%) | 94 (47.5%) |
Sales and Office Occupations
The most common Sales and Office occupations in Plummer are Sales & Related (37 | 18.7%), and Office & Administration (9 | 4.5%).
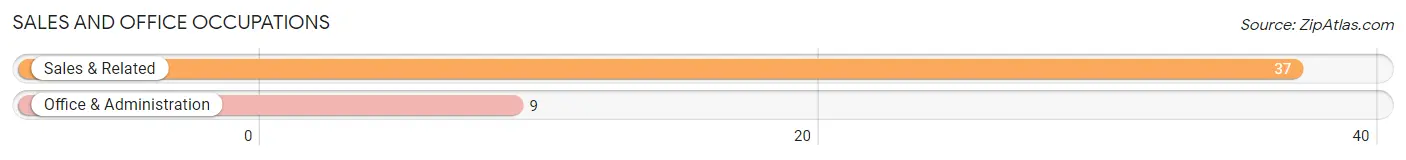
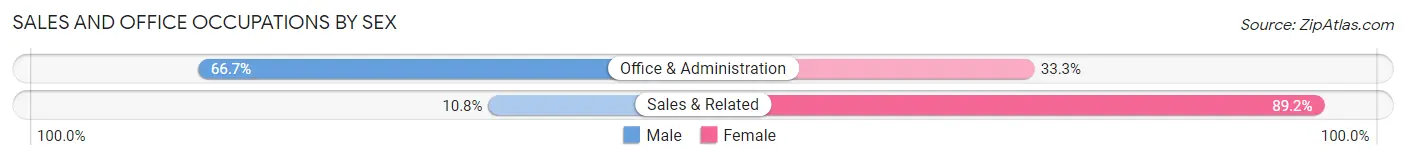
Sales and Office Occupations by Sex
| Occupation | Male | Female |
| Sales & Related | 4 (10.8%) | 33 (89.2%) |
| Office & Administration | 6 (66.7%) | 3 (33.3%) |
| Total (Category) | 10 (21.7%) | 36 (78.3%) |
| Total (Overall) | 104 (52.5%) | 94 (47.5%) |
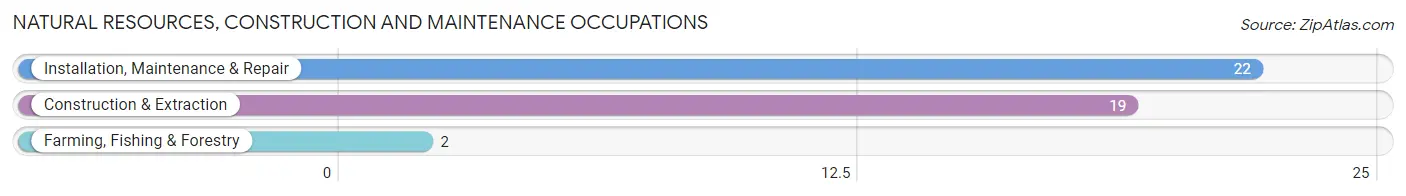
Natural Resources, Construction and Maintenance Occupations
The most common Natural Resources, Construction and Maintenance occupations in Plummer are Installation, Maintenance & Repair (22 | 11.1%), Construction & Extraction (19 | 9.6%), and Farming, Fishing & Forestry (2 | 1.0%).
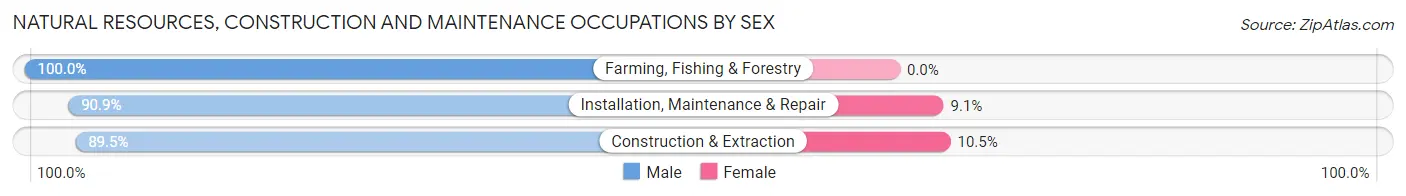
Natural Resources, Construction and Maintenance Occupations by Sex
| Occupation | Male | Female |
| Farming, Fishing & Forestry | 2 (100.0%) | 0 (0.0%) |
| Construction & Extraction | 17 (89.5%) | 2 (10.5%) |
| Installation, Maintenance & Repair | 20 (90.9%) | 2 (9.1%) |
| Total (Category) | 39 (90.7%) | 4 (9.3%) |
| Total (Overall) | 104 (52.5%) | 94 (47.5%) |
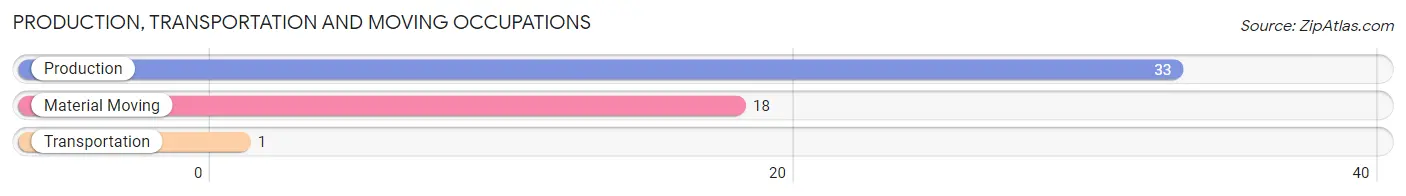
Production, Transportation and Moving Occupations
The most common Production, Transportation and Moving occupations in Plummer are Production (33 | 16.7%), Material Moving (18 | 9.1%), and Transportation (1 | 0.5%).
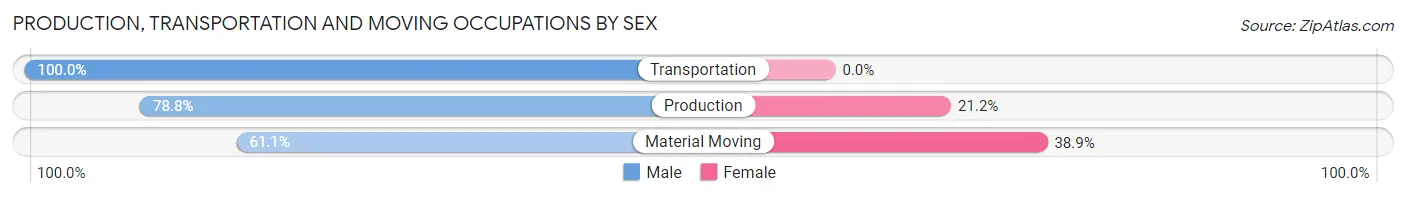
Production, Transportation and Moving Occupations by Sex
| Occupation | Male | Female |
| Production | 26 (78.8%) | 7 (21.2%) |
| Transportation | 1 (100.0%) | 0 (0.0%) |
| Material Moving | 11 (61.1%) | 7 (38.9%) |
| Total (Category) | 38 (73.1%) | 14 (26.9%) |
| Total (Overall) | 104 (52.5%) | 94 (47.5%) |
Employment Industries by Sex in Plummer
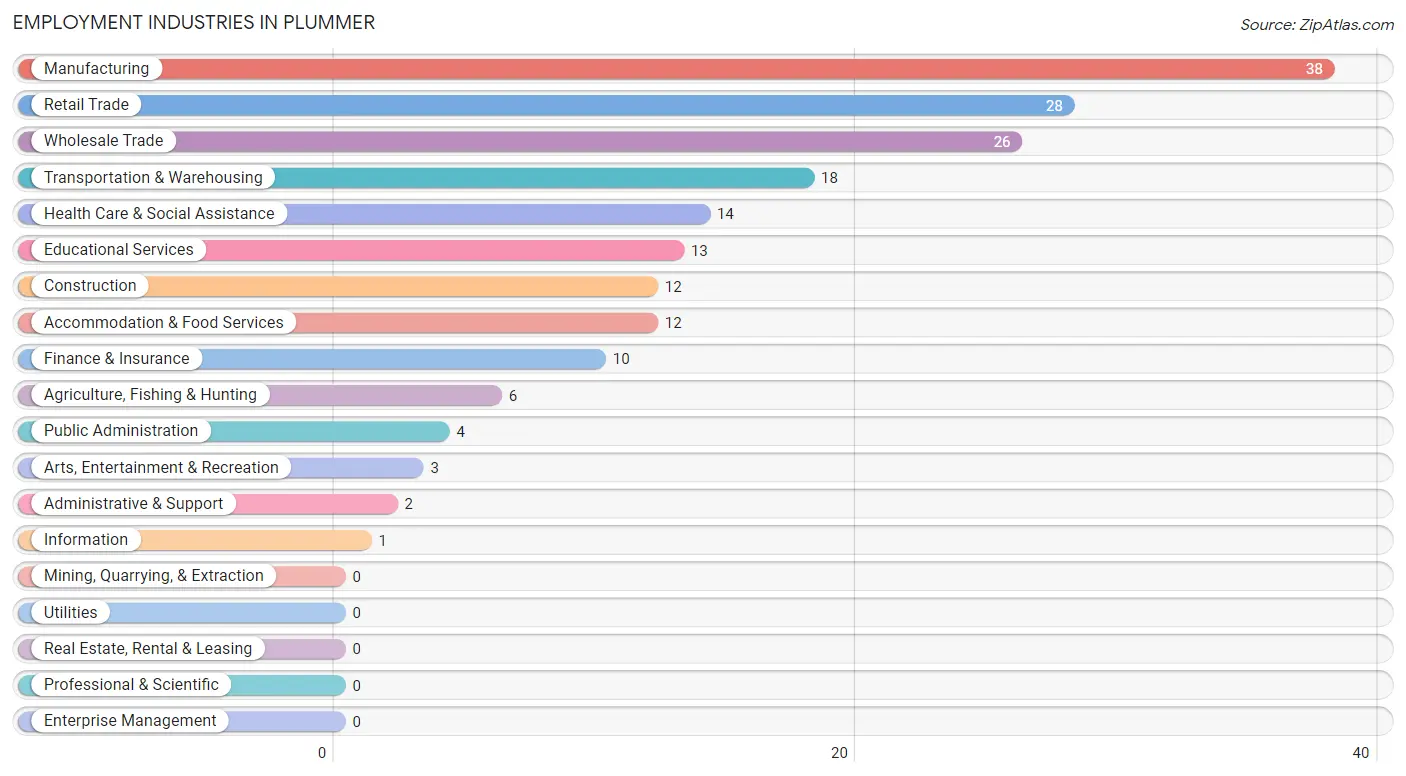
Employment Industries in Plummer
The major employment industries in Plummer include Manufacturing (38 | 19.2%), Retail Trade (28 | 14.1%), Wholesale Trade (26 | 13.1%), Transportation & Warehousing (18 | 9.1%), and Health Care & Social Assistance (14 | 7.1%).
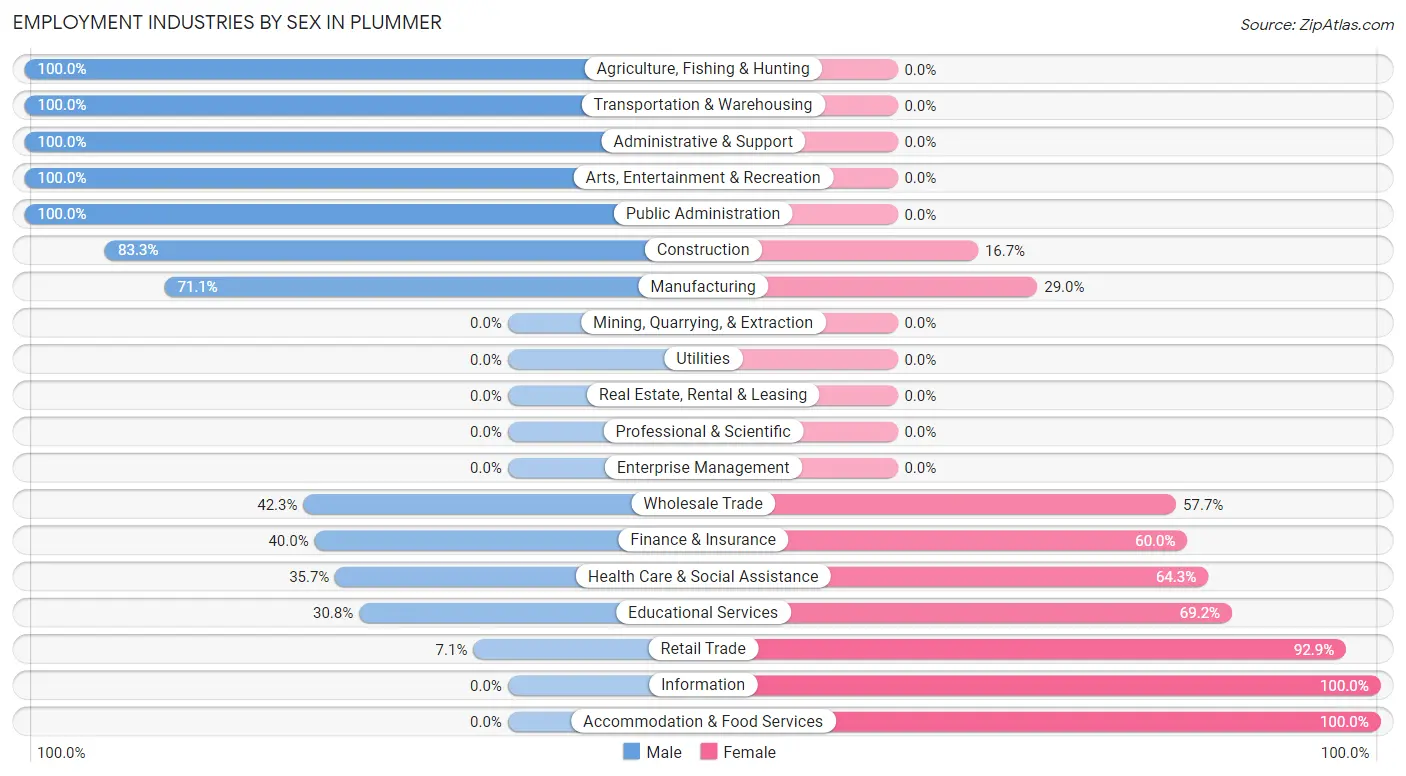
Employment Industries by Sex in Plummer
The Plummer industries that see more men than women are Agriculture, Fishing & Hunting (100.0%), Transportation & Warehousing (100.0%), and Administrative & Support (100.0%), whereas the industries that tend to have a higher number of women are Information (100.0%), Accommodation & Food Services (100.0%), and Retail Trade (92.9%).
| Industry | Male | Female |
| Agriculture, Fishing & Hunting | 6 (100.0%) | 0 (0.0%) |
| Mining, Quarrying, & Extraction | 0 (0.0%) | 0 (0.0%) |
| Construction | 10 (83.3%) | 2 (16.7%) |
| Manufacturing | 27 (71.1%) | 11 (28.9%) |
| Wholesale Trade | 11 (42.3%) | 15 (57.7%) |
| Retail Trade | 2 (7.1%) | 26 (92.9%) |
| Transportation & Warehousing | 18 (100.0%) | 0 (0.0%) |
| Utilities | 0 (0.0%) | 0 (0.0%) |
| Information | 0 (0.0%) | 1 (100.0%) |
| Finance & Insurance | 4 (40.0%) | 6 (60.0%) |
| Real Estate, Rental & Leasing | 0 (0.0%) | 0 (0.0%) |
| Professional & Scientific | 0 (0.0%) | 0 (0.0%) |
| Enterprise Management | 0 (0.0%) | 0 (0.0%) |
| Administrative & Support | 2 (100.0%) | 0 (0.0%) |
| Educational Services | 4 (30.8%) | 9 (69.2%) |
| Health Care & Social Assistance | 5 (35.7%) | 9 (64.3%) |
| Arts, Entertainment & Recreation | 3 (100.0%) | 0 (0.0%) |
| Accommodation & Food Services | 0 (0.0%) | 12 (100.0%) |
| Public Administration | 4 (100.0%) | 0 (0.0%) |
| Total | 104 (52.5%) | 94 (47.5%) |
Education in Plummer
School Enrollment in Plummer
The most common levels of schooling among the 79 students in Plummer are high school (37 | 46.8%), middle school (16 | 20.3%), and elementary school (10 | 12.7%).
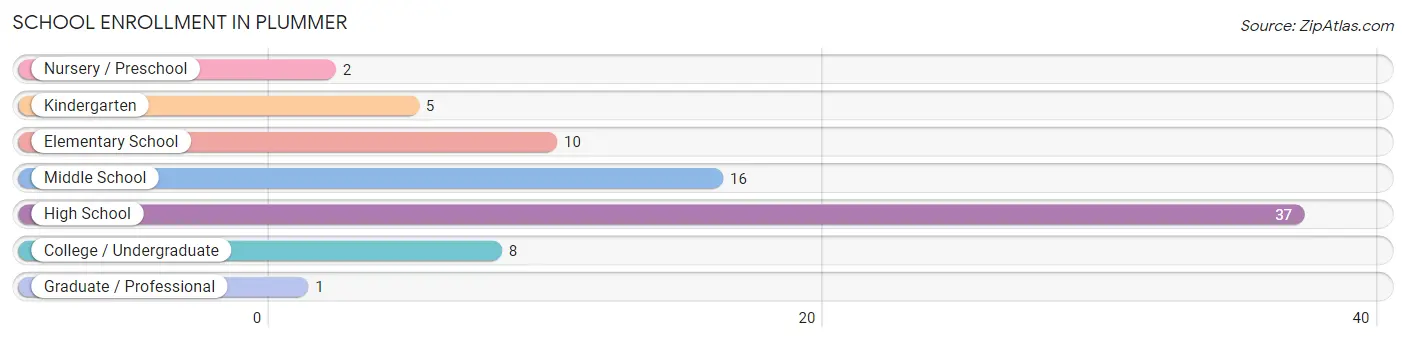
| School Level | # Students | % Students |
| Nursery / Preschool | 2 | 2.5% |
| Kindergarten | 5 | 6.3% |
| Elementary School | 10 | 12.7% |
| Middle School | 16 | 20.3% |
| High School | 37 | 46.8% |
| College / Undergraduate | 8 | 10.1% |
| Graduate / Professional | 1 | 1.3% |
| Total | 79 | 100.0% |
School Enrollment by Age by Funding Source in Plummer
Out of a total of 79 students who are enrolled in schools in Plummer, 5 (6.3%) attend a private institution, while the remaining 74 (93.7%) are enrolled in public schools. The age group of 15 to 17 year olds has the highest likelihood of being enrolled in private schools, with 4 (13.8% in the age bracket) enrolled. Conversely, the age group of 3 to 4 year olds has the lowest likelihood of being enrolled in a private school, with 2 (100.0% in the age bracket) attending a public institution.
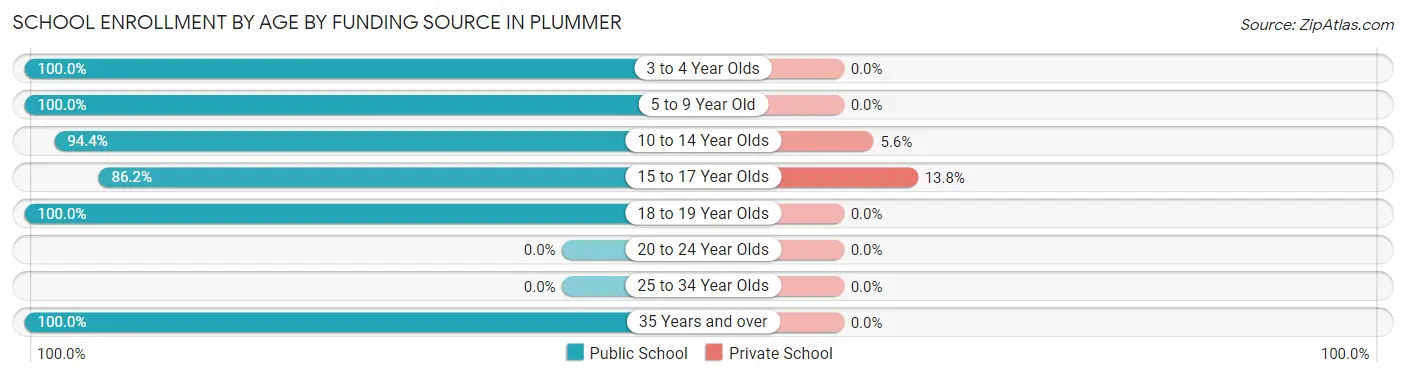
| Age Bracket | Public School | Private School |
| 3 to 4 Year Olds | 2 (100.0%) | 0 (0.0%) |
| 5 to 9 Year Old | 14 (100.0%) | 0 (0.0%) |
| 10 to 14 Year Olds | 17 (94.4%) | 1 (5.6%) |
| 15 to 17 Year Olds | 25 (86.2%) | 4 (13.8%) |
| 18 to 19 Year Olds | 15 (100.0%) | 0 (0.0%) |
| 20 to 24 Year Olds | 0 (0.0%) | 0 (0.0%) |
| 25 to 34 Year Olds | 0 (0.0%) | 0 (0.0%) |
| 35 Years and over | 1 (100.0%) | 0 (0.0%) |
| Total | 74 (93.7%) | 5 (6.3%) |
Educational Attainment by Field of Study in Plummer
Education (17 | 68.0%), bio, nature & agricultural (3 | 12.0%), business (3 | 12.0%), computers & mathematics (1 | 4.0%), and science & technology (1 | 4.0%) are the most common fields of study among 25 individuals in Plummer who have obtained a bachelor's degree or higher.
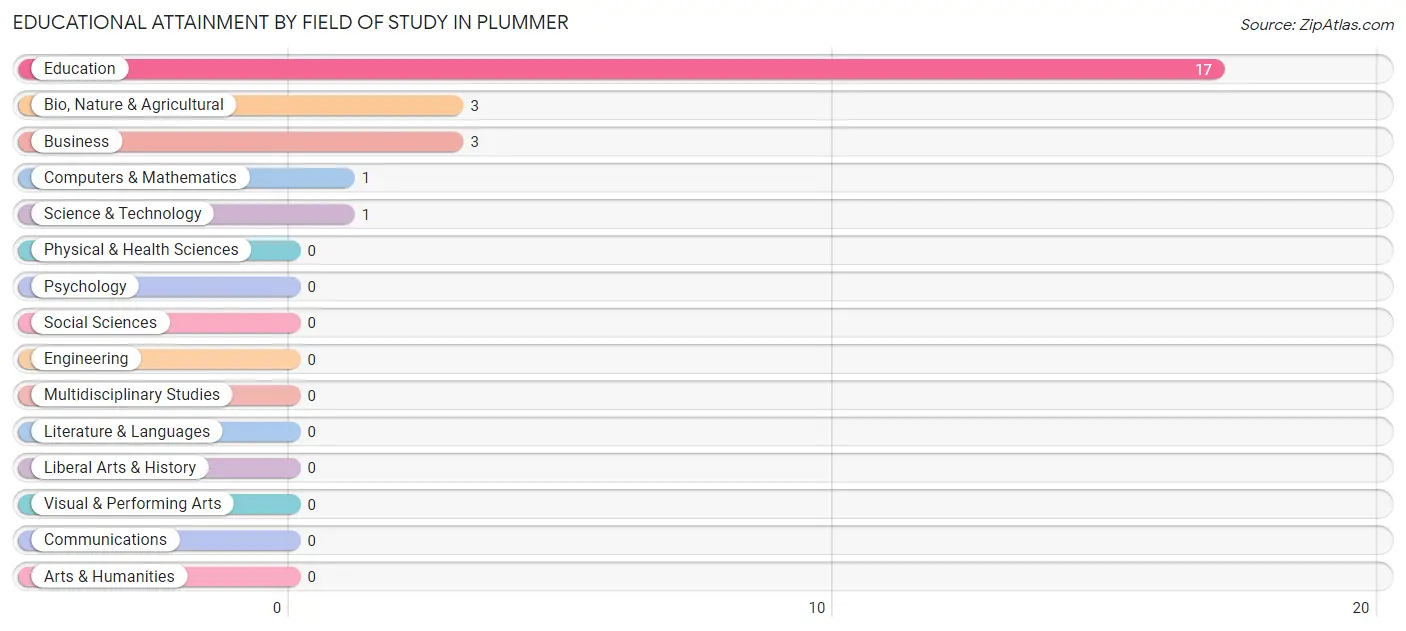
| Field of Study | # Graduates | % Graduates |
| Computers & Mathematics | 1 | 4.0% |
| Bio, Nature & Agricultural | 3 | 12.0% |
| Physical & Health Sciences | 0 | 0.0% |
| Psychology | 0 | 0.0% |
| Social Sciences | 0 | 0.0% |
| Engineering | 0 | 0.0% |
| Multidisciplinary Studies | 0 | 0.0% |
| Science & Technology | 1 | 4.0% |
| Business | 3 | 12.0% |
| Education | 17 | 68.0% |
| Literature & Languages | 0 | 0.0% |
| Liberal Arts & History | 0 | 0.0% |
| Visual & Performing Arts | 0 | 0.0% |
| Communications | 0 | 0.0% |
| Arts & Humanities | 0 | 0.0% |
| Total | 25 | 100.0% |
Transportation & Commute in Plummer
Vehicle Availability by Sex in Plummer
The most prevalent vehicle ownership categories in Plummer are males with 2 vehicles (66, accounting for 63.5%) and females with 2 vehicles (41, making up 70.2%).
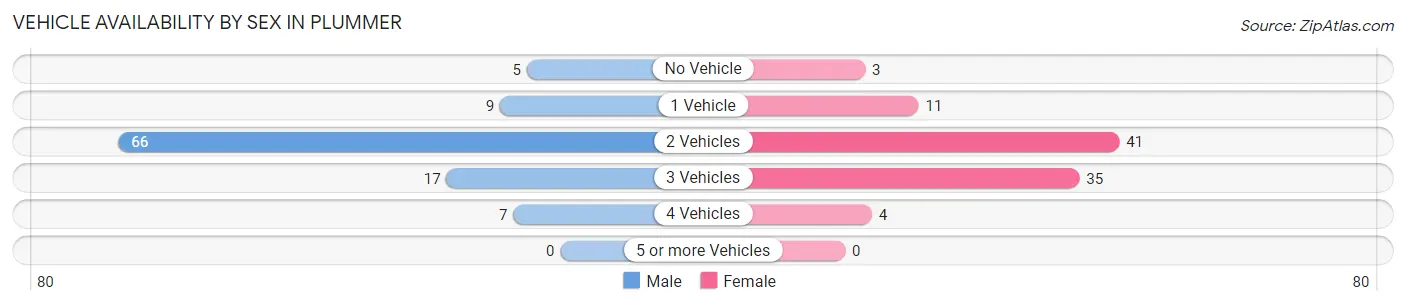
| Vehicles Available | Male | Female |
| No Vehicle | 5 (4.8%) | 3 (3.2%) |
| 1 Vehicle | 9 (8.6%) | 11 (11.7%) |
| 2 Vehicles | 66 (63.5%) | 41 (43.6%) |
| 3 Vehicles | 17 (16.4%) | 35 (37.2%) |
| 4 Vehicles | 7 (6.7%) | 4 (4.3%) |
| 5 or more Vehicles | 0 (0.0%) | 0 (0.0%) |
| Total | 104 (100.0%) | 94 (100.0%) |
Commute Time in Plummer
The most frequently occuring commute durations in Plummer are 20 to 24 minutes (53 commuters, 29.0%), 25 to 29 minutes (32 commuters, 17.5%), and less than 5 minutes (25 commuters, 13.7%).
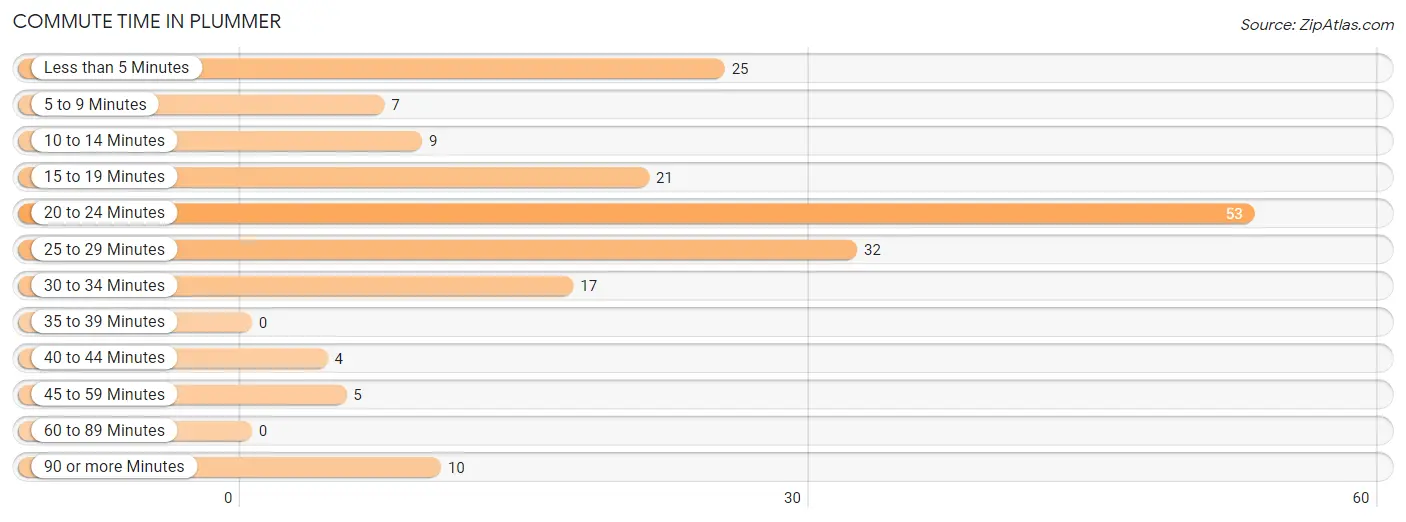
| Commute Time | # Commuters | % Commuters |
| Less than 5 Minutes | 25 | 13.7% |
| 5 to 9 Minutes | 7 | 3.8% |
| 10 to 14 Minutes | 9 | 4.9% |
| 15 to 19 Minutes | 21 | 11.5% |
| 20 to 24 Minutes | 53 | 29.0% |
| 25 to 29 Minutes | 32 | 17.5% |
| 30 to 34 Minutes | 17 | 9.3% |
| 35 to 39 Minutes | 0 | 0.0% |
| 40 to 44 Minutes | 4 | 2.2% |
| 45 to 59 Minutes | 5 | 2.7% |
| 60 to 89 Minutes | 0 | 0.0% |
| 90 or more Minutes | 10 | 5.5% |
Commute Time by Sex in Plummer
The most common commute times in Plummer are 20 to 24 minutes (41 commuters, 41.8%) for males and 25 to 29 minutes (26 commuters, 30.6%) for females.
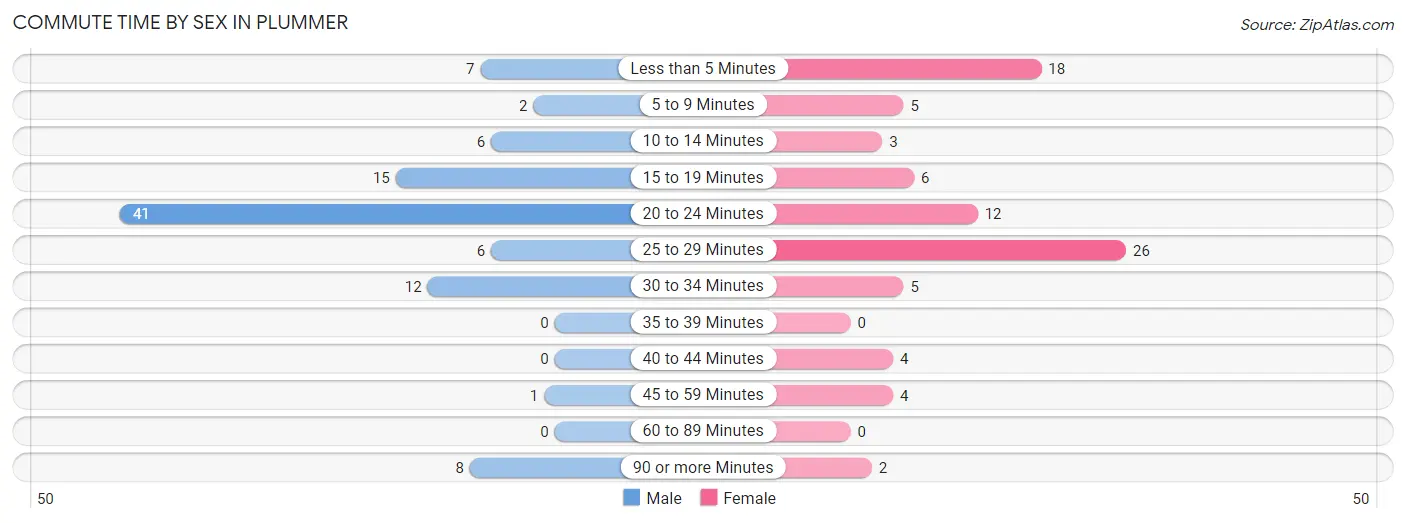
| Commute Time | Male | Female |
| Less than 5 Minutes | 7 (7.1%) | 18 (21.2%) |
| 5 to 9 Minutes | 2 (2.0%) | 5 (5.9%) |
| 10 to 14 Minutes | 6 (6.1%) | 3 (3.5%) |
| 15 to 19 Minutes | 15 (15.3%) | 6 (7.1%) |
| 20 to 24 Minutes | 41 (41.8%) | 12 (14.1%) |
| 25 to 29 Minutes | 6 (6.1%) | 26 (30.6%) |
| 30 to 34 Minutes | 12 (12.2%) | 5 (5.9%) |
| 35 to 39 Minutes | 0 (0.0%) | 0 (0.0%) |
| 40 to 44 Minutes | 0 (0.0%) | 4 (4.7%) |
| 45 to 59 Minutes | 1 (1.0%) | 4 (4.7%) |
| 60 to 89 Minutes | 0 (0.0%) | 0 (0.0%) |
| 90 or more Minutes | 8 (8.2%) | 2 (2.4%) |
Time of Departure to Work by Sex in Plummer
The most frequent times of departure to work in Plummer are 12:00 AM to 4:59 AM (16, 16.3%) for males and 6:30 AM to 6:59 AM (27, 31.8%) for females.
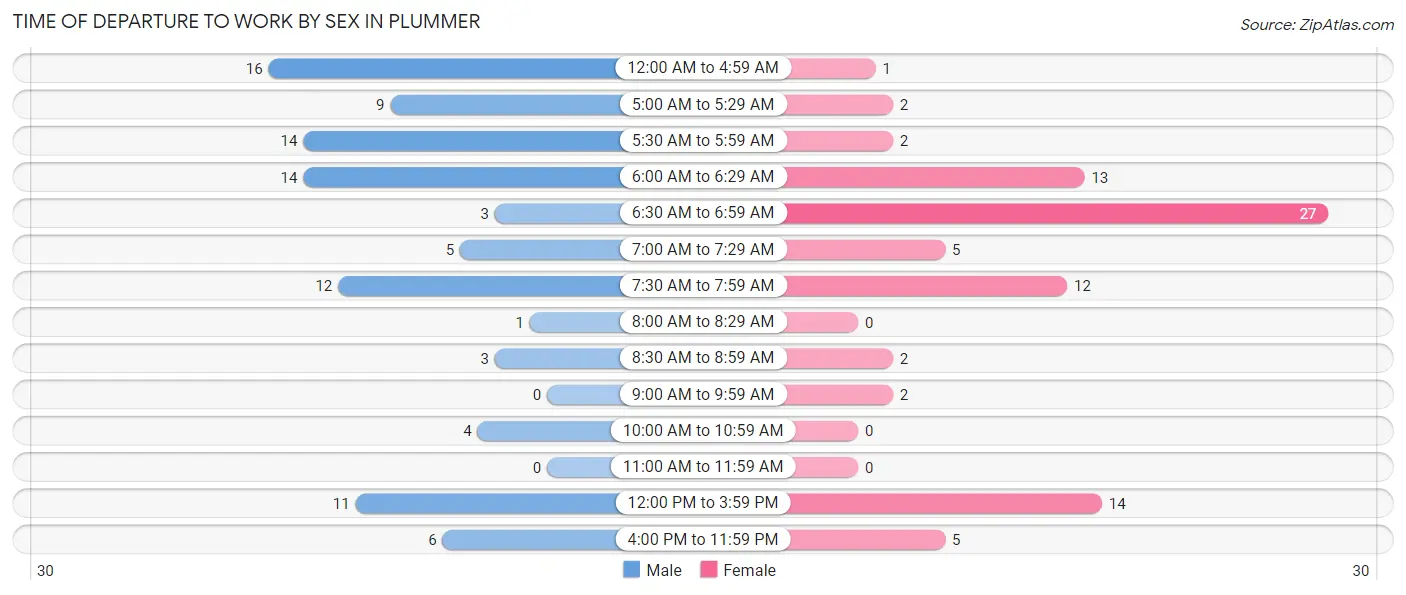
| Time of Departure | Male | Female |
| 12:00 AM to 4:59 AM | 16 (16.3%) | 1 (1.2%) |
| 5:00 AM to 5:29 AM | 9 (9.2%) | 2 (2.4%) |
| 5:30 AM to 5:59 AM | 14 (14.3%) | 2 (2.4%) |
| 6:00 AM to 6:29 AM | 14 (14.3%) | 13 (15.3%) |
| 6:30 AM to 6:59 AM | 3 (3.1%) | 27 (31.8%) |
| 7:00 AM to 7:29 AM | 5 (5.1%) | 5 (5.9%) |
| 7:30 AM to 7:59 AM | 12 (12.2%) | 12 (14.1%) |
| 8:00 AM to 8:29 AM | 1 (1.0%) | 0 (0.0%) |
| 8:30 AM to 8:59 AM | 3 (3.1%) | 2 (2.4%) |
| 9:00 AM to 9:59 AM | 0 (0.0%) | 2 (2.4%) |
| 10:00 AM to 10:59 AM | 4 (4.1%) | 0 (0.0%) |
| 11:00 AM to 11:59 AM | 0 (0.0%) | 0 (0.0%) |
| 12:00 PM to 3:59 PM | 11 (11.2%) | 14 (16.5%) |
| 4:00 PM to 11:59 PM | 6 (6.1%) | 5 (5.9%) |
| Total | 98 (100.0%) | 85 (100.0%) |
Housing Occupancy in Plummer
Occupancy by Ownership in Plummer
Of the total 137 dwellings in Plummer, owner-occupied units account for 104 (75.9%), while renter-occupied units make up 33 (24.1%).
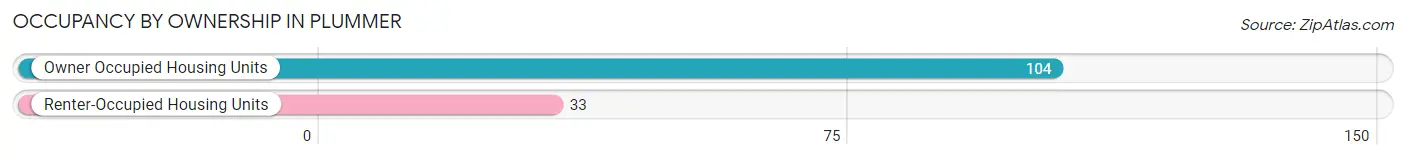
| Occupancy | # Housing Units | % Housing Units |
| Owner Occupied Housing Units | 104 | 75.9% |
| Renter-Occupied Housing Units | 33 | 24.1% |
| Total Occupied Housing Units | 137 | 100.0% |
Occupancy by Household Size in Plummer
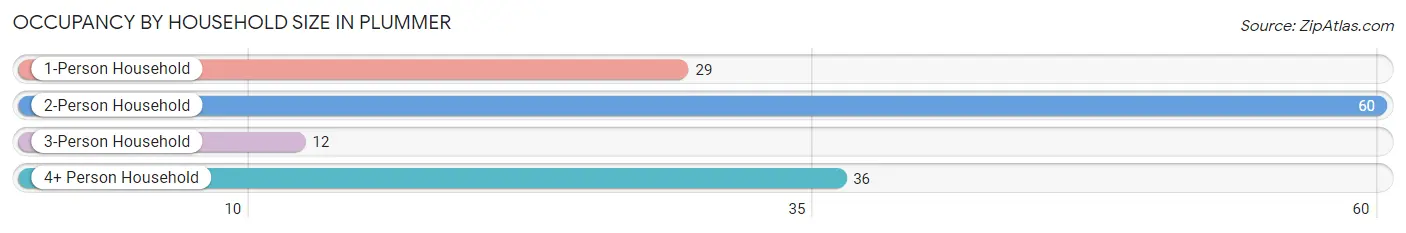
| Household Size | # Housing Units | % Housing Units |
| 1-Person Household | 29 | 21.2% |
| 2-Person Household | 60 | 43.8% |
| 3-Person Household | 12 | 8.8% |
| 4+ Person Household | 36 | 26.3% |
| Total Housing Units | 137 | 100.0% |
Occupancy by Ownership by Household Size in Plummer
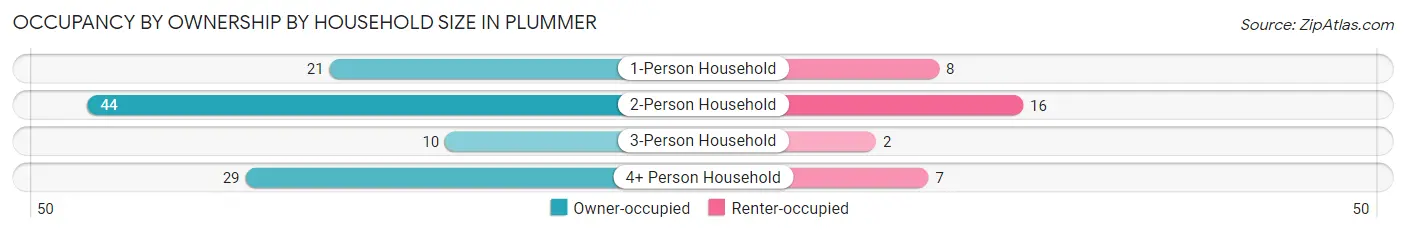
| Household Size | Owner-occupied | Renter-occupied |
| 1-Person Household | 21 (72.4%) | 8 (27.6%) |
| 2-Person Household | 44 (73.3%) | 16 (26.7%) |
| 3-Person Household | 10 (83.3%) | 2 (16.7%) |
| 4+ Person Household | 29 (80.6%) | 7 (19.4%) |
| Total Housing Units | 104 (75.9%) | 33 (24.1%) |
Occupancy by Educational Attainment in Plummer
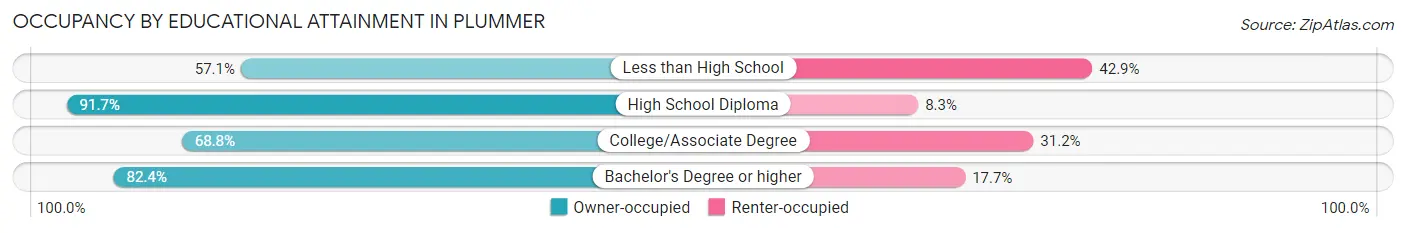
| Household Size | Owner-occupied | Renter-occupied |
| Less than High School | 4 (57.1%) | 3 (42.9%) |
| High School Diploma | 33 (91.7%) | 3 (8.3%) |
| College/Associate Degree | 53 (68.8%) | 24 (31.2%) |
| Bachelor's Degree or higher | 14 (82.4%) | 3 (17.6%) |
Occupancy by Age of Householder in Plummer
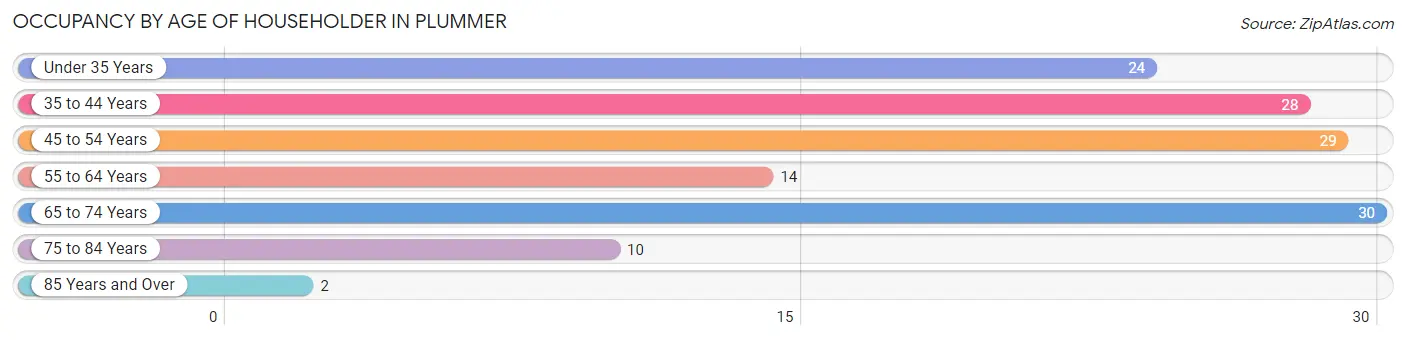
| Age Bracket | # Households | % Households |
| Under 35 Years | 24 | 17.5% |
| 35 to 44 Years | 28 | 20.4% |
| 45 to 54 Years | 29 | 21.2% |
| 55 to 64 Years | 14 | 10.2% |
| 65 to 74 Years | 30 | 21.9% |
| 75 to 84 Years | 10 | 7.3% |
| 85 Years and Over | 2 | 1.5% |
| Total | 137 | 100.0% |
Housing Finances in Plummer
Median Income by Occupancy in Plummer
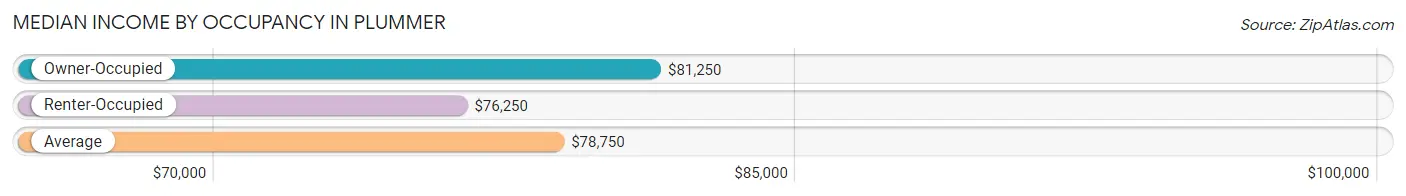
| Occupancy Type | # Households | Median Income |
| Owner-Occupied | 104 (75.9%) | $81,250 |
| Renter-Occupied | 33 (24.1%) | $76,250 |
| Average | 137 (100.0%) | $78,750 |
Occupancy by Householder Income Bracket in Plummer
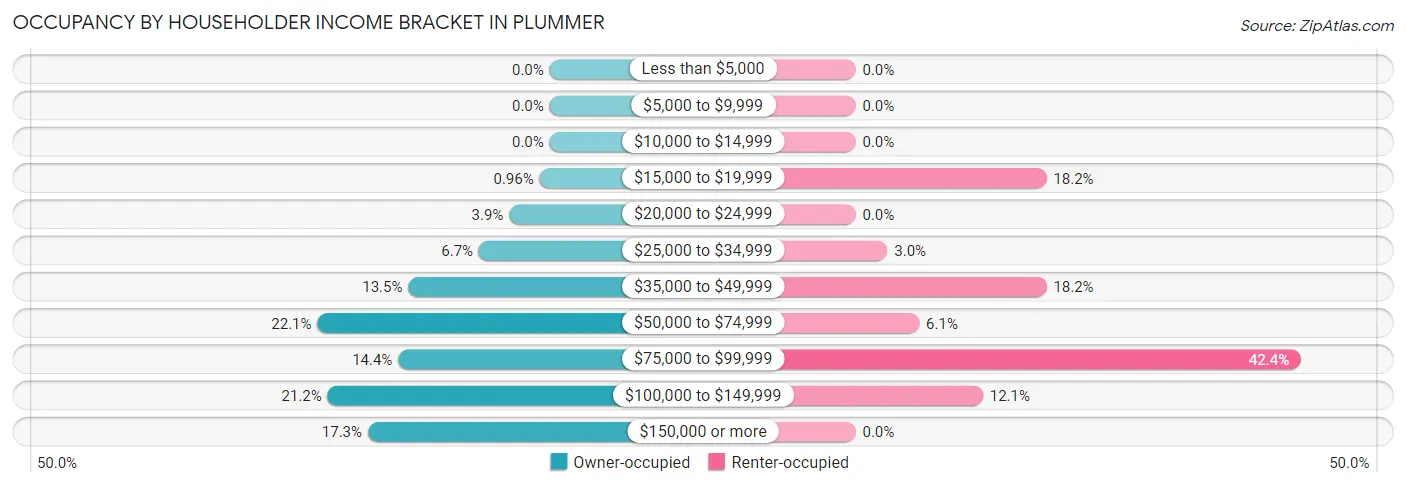
| Income Bracket | Owner-occupied | Renter-occupied |
| Less than $5,000 | 0 (0.0%) | 0 (0.0%) |
| $5,000 to $9,999 | 0 (0.0%) | 0 (0.0%) |
| $10,000 to $14,999 | 0 (0.0%) | 0 (0.0%) |
| $15,000 to $19,999 | 1 (1.0%) | 6 (18.2%) |
| $20,000 to $24,999 | 4 (3.8%) | 0 (0.0%) |
| $25,000 to $34,999 | 7 (6.7%) | 1 (3.0%) |
| $35,000 to $49,999 | 14 (13.5%) | 6 (18.2%) |
| $50,000 to $74,999 | 23 (22.1%) | 2 (6.1%) |
| $75,000 to $99,999 | 15 (14.4%) | 14 (42.4%) |
| $100,000 to $149,999 | 22 (21.1%) | 4 (12.1%) |
| $150,000 or more | 18 (17.3%) | 0 (0.0%) |
| Total | 104 (100.0%) | 33 (100.0%) |
Monthly Housing Cost Tiers in Plummer
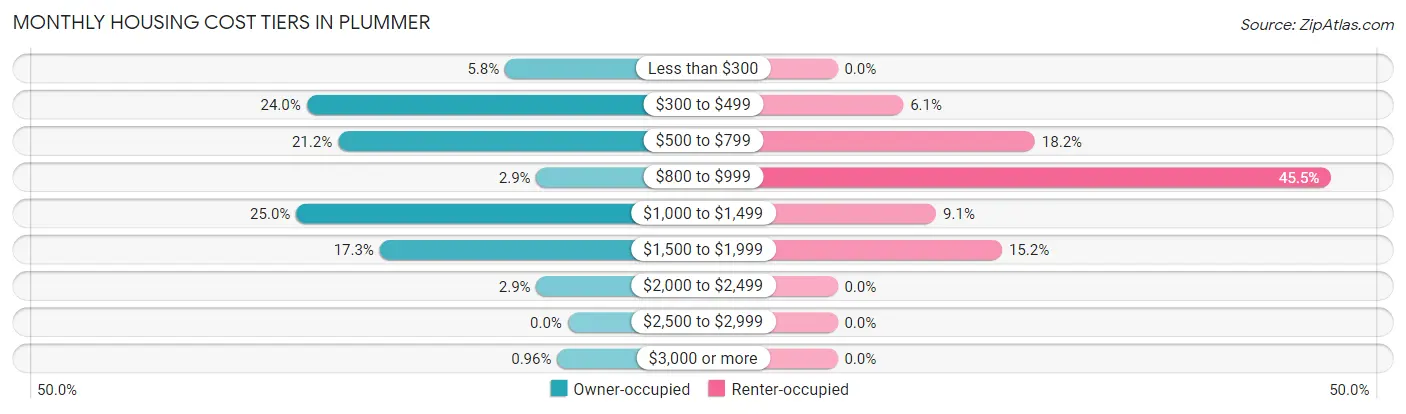
| Monthly Cost | Owner-occupied | Renter-occupied |
| Less than $300 | 6 (5.8%) | 0 (0.0%) |
| $300 to $499 | 25 (24.0%) | 2 (6.1%) |
| $500 to $799 | 22 (21.1%) | 6 (18.2%) |
| $800 to $999 | 3 (2.9%) | 15 (45.5%) |
| $1,000 to $1,499 | 26 (25.0%) | 3 (9.1%) |
| $1,500 to $1,999 | 18 (17.3%) | 5 (15.1%) |
| $2,000 to $2,499 | 3 (2.9%) | 0 (0.0%) |
| $2,500 to $2,999 | 0 (0.0%) | 0 (0.0%) |
| $3,000 or more | 1 (1.0%) | 0 (0.0%) |
| Total | 104 (100.0%) | 33 (100.0%) |
Physical Housing Characteristics in Plummer
Housing Structures in Plummer
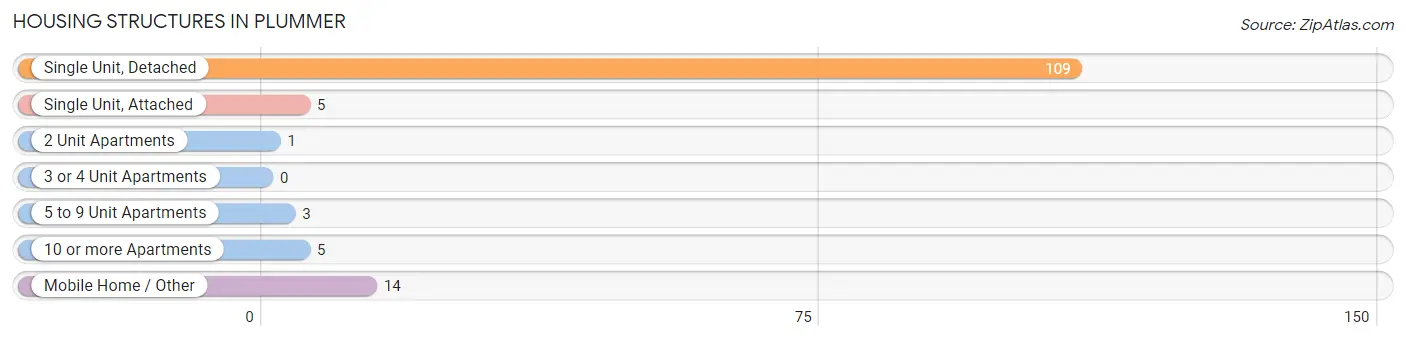
| Structure Type | # Housing Units | % Housing Units |
| Single Unit, Detached | 109 | 79.6% |
| Single Unit, Attached | 5 | 3.6% |
| 2 Unit Apartments | 1 | 0.7% |
| 3 or 4 Unit Apartments | 0 | 0.0% |
| 5 to 9 Unit Apartments | 3 | 2.2% |
| 10 or more Apartments | 5 | 3.6% |
| Mobile Home / Other | 14 | 10.2% |
| Total | 137 | 100.0% |
Housing Structures by Occupancy in Plummer
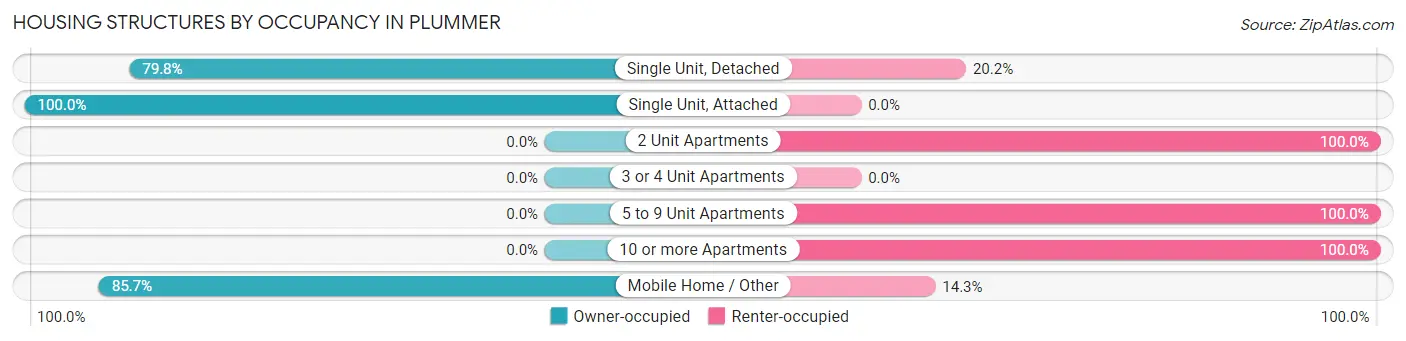
| Structure Type | Owner-occupied | Renter-occupied |
| Single Unit, Detached | 87 (79.8%) | 22 (20.2%) |
| Single Unit, Attached | 5 (100.0%) | 0 (0.0%) |
| 2 Unit Apartments | 0 (0.0%) | 1 (100.0%) |
| 3 or 4 Unit Apartments | 0 (0.0%) | 0 (0.0%) |
| 5 to 9 Unit Apartments | 0 (0.0%) | 3 (100.0%) |
| 10 or more Apartments | 0 (0.0%) | 5 (100.0%) |
| Mobile Home / Other | 12 (85.7%) | 2 (14.3%) |
| Total | 104 (75.9%) | 33 (24.1%) |
Housing Structures by Number of Rooms in Plummer
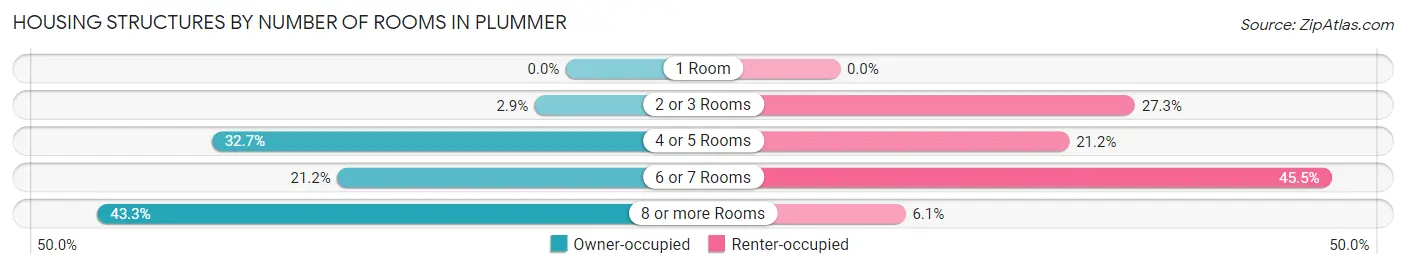
| Number of Rooms | Owner-occupied | Renter-occupied |
| 1 Room | 0 (0.0%) | 0 (0.0%) |
| 2 or 3 Rooms | 3 (2.9%) | 9 (27.3%) |
| 4 or 5 Rooms | 34 (32.7%) | 7 (21.2%) |
| 6 or 7 Rooms | 22 (21.1%) | 15 (45.5%) |
| 8 or more Rooms | 45 (43.3%) | 2 (6.1%) |
| Total | 104 (100.0%) | 33 (100.0%) |
Housing Structure by Heating Type in Plummer
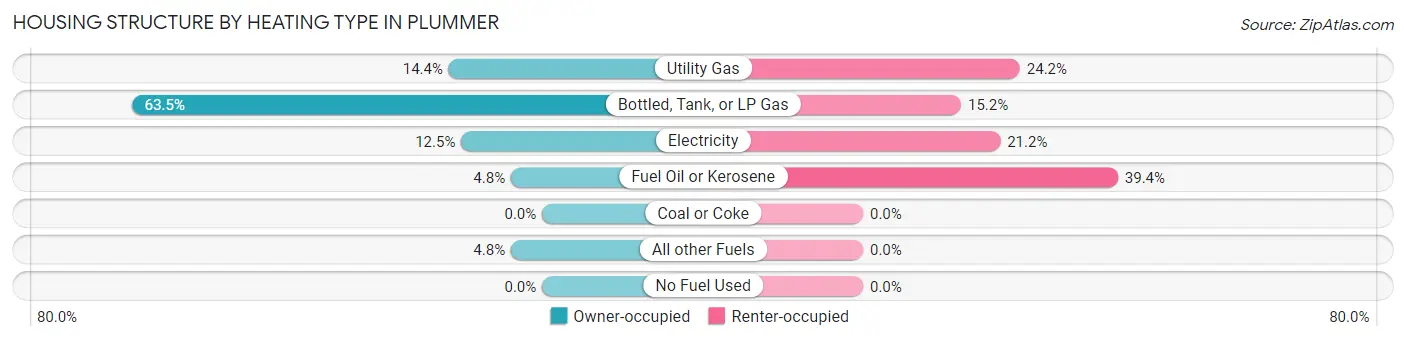
| Heating Type | Owner-occupied | Renter-occupied |
| Utility Gas | 15 (14.4%) | 8 (24.2%) |
| Bottled, Tank, or LP Gas | 66 (63.5%) | 5 (15.1%) |
| Electricity | 13 (12.5%) | 7 (21.2%) |
| Fuel Oil or Kerosene | 5 (4.8%) | 13 (39.4%) |
| Coal or Coke | 0 (0.0%) | 0 (0.0%) |
| All other Fuels | 5 (4.8%) | 0 (0.0%) |
| No Fuel Used | 0 (0.0%) | 0 (0.0%) |
| Total | 104 (100.0%) | 33 (100.0%) |
Household Vehicle Usage in Plummer
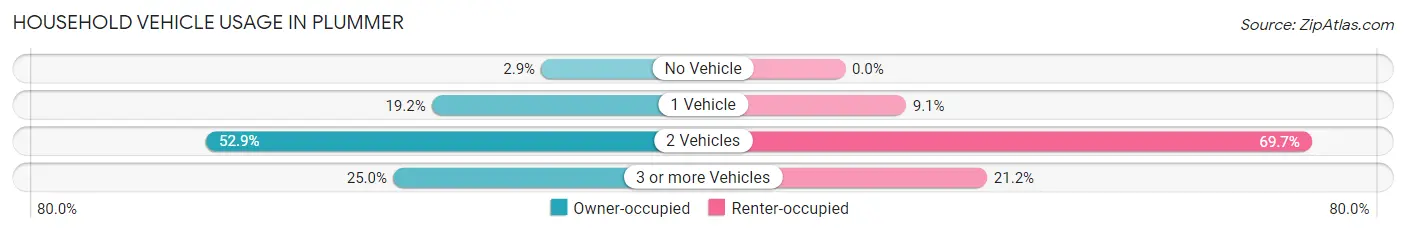
| Vehicles per Household | Owner-occupied | Renter-occupied |
| No Vehicle | 3 (2.9%) | 0 (0.0%) |
| 1 Vehicle | 20 (19.2%) | 3 (9.1%) |
| 2 Vehicles | 55 (52.9%) | 23 (69.7%) |
| 3 or more Vehicles | 26 (25.0%) | 7 (21.2%) |
| Total | 104 (100.0%) | 33 (100.0%) |
Real Estate & Mortgages in Plummer
Real Estate and Mortgage Overview in Plummer
| Characteristic | Without Mortgage | With Mortgage |
| Housing Units | 49 | 55 |
| Median Property Value | $86,300 | $179,200 |
| Median Household Income | $77,917 | $8 |
| Monthly Housing Costs | $512 | $0 |
| Real Estate Taxes | $810 | $0 |
Property Value by Mortgage Status in Plummer
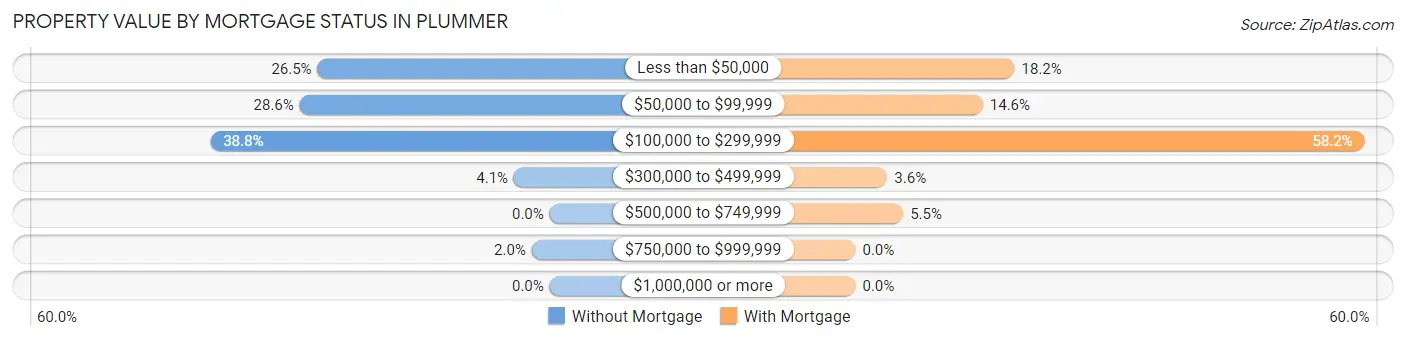
| Property Value | Without Mortgage | With Mortgage |
| Less than $50,000 | 13 (26.5%) | 10 (18.2%) |
| $50,000 to $99,999 | 14 (28.6%) | 8 (14.5%) |
| $100,000 to $299,999 | 19 (38.8%) | 32 (58.2%) |
| $300,000 to $499,999 | 2 (4.1%) | 2 (3.6%) |
| $500,000 to $749,999 | 0 (0.0%) | 3 (5.4%) |
| $750,000 to $999,999 | 1 (2.0%) | 0 (0.0%) |
| $1,000,000 or more | 0 (0.0%) | 0 (0.0%) |
| Total | 49 (100.0%) | 55 (100.0%) |
Household Income by Mortgage Status in Plummer
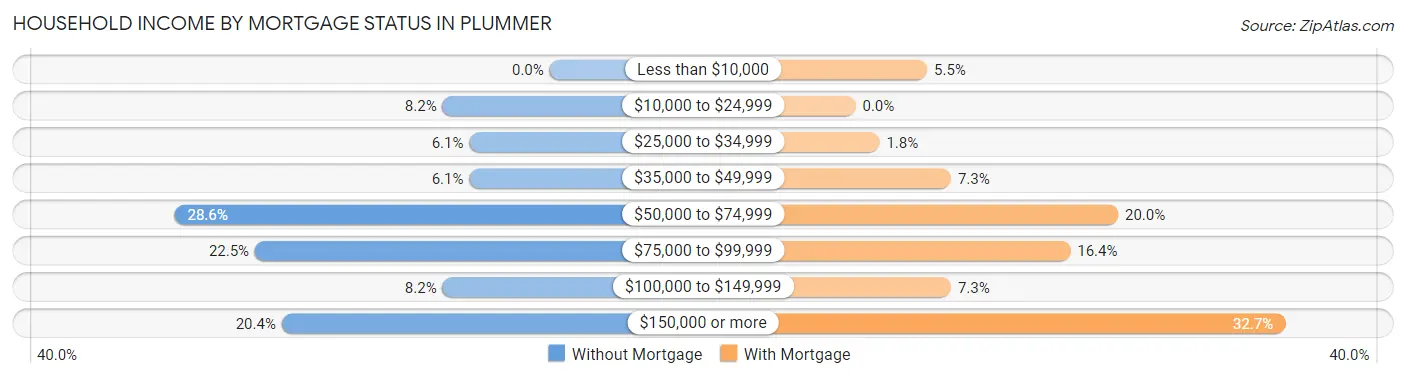
| Household Income | Without Mortgage | With Mortgage |
| Less than $10,000 | 0 (0.0%) | 3 (5.4%) |
| $10,000 to $24,999 | 4 (8.2%) | 0 (0.0%) |
| $25,000 to $34,999 | 3 (6.1%) | 1 (1.8%) |
| $35,000 to $49,999 | 3 (6.1%) | 4 (7.3%) |
| $50,000 to $74,999 | 14 (28.6%) | 11 (20.0%) |
| $75,000 to $99,999 | 11 (22.5%) | 9 (16.4%) |
| $100,000 to $149,999 | 4 (8.2%) | 4 (7.3%) |
| $150,000 or more | 10 (20.4%) | 18 (32.7%) |
| Total | 49 (100.0%) | 55 (100.0%) |
Property Value to Household Income Ratio in Plummer
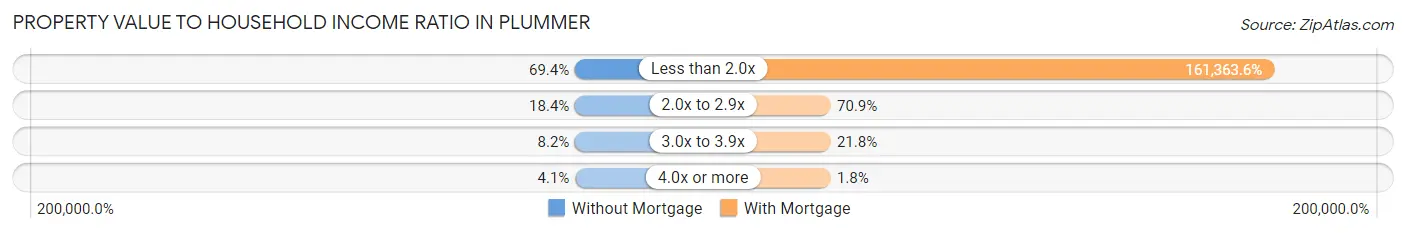
| Value-to-Income Ratio | Without Mortgage | With Mortgage |
| Less than 2.0x | 34 (69.4%) | 88,750 (161,363.6%) |
| 2.0x to 2.9x | 9 (18.4%) | 39 (70.9%) |
| 3.0x to 3.9x | 4 (8.2%) | 12 (21.8%) |
| 4.0x or more | 2 (4.1%) | 1 (1.8%) |
| Total | 49 (100.0%) | 55 (100.0%) |
Real Estate Taxes by Mortgage Status in Plummer
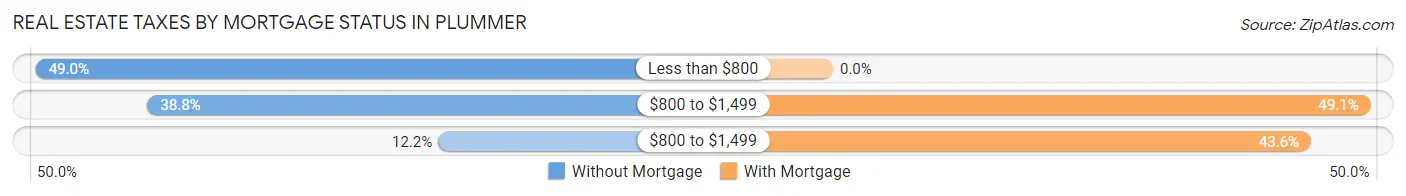
| Property Taxes | Without Mortgage | With Mortgage |
| Less than $800 | 24 (49.0%) | 0 (0.0%) |
| $800 to $1,499 | 19 (38.8%) | 27 (49.1%) |
| $800 to $1,499 | 6 (12.2%) | 24 (43.6%) |
| Total | 49 (100.0%) | 55 (100.0%) |
Health & Disability in Plummer
Health Insurance Coverage by Age in Plummer
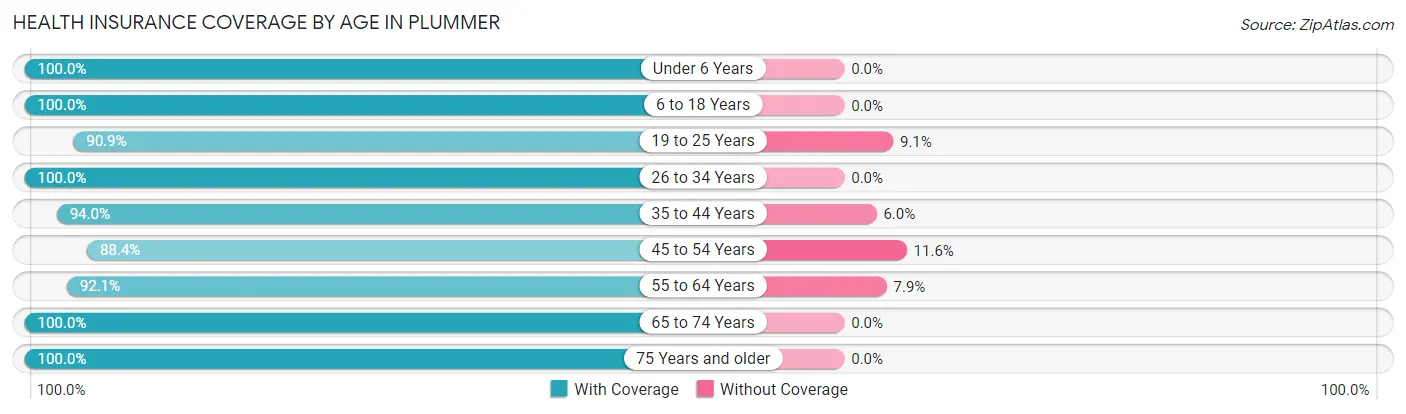
| Age Bracket | With Coverage | Without Coverage |
| Under 6 Years | 9 (100.0%) | 0 (0.0%) |
| 6 to 18 Years | 79 (100.0%) | 0 (0.0%) |
| 19 to 25 Years | 20 (90.9%) | 2 (9.1%) |
| 26 to 34 Years | 27 (100.0%) | 0 (0.0%) |
| 35 to 44 Years | 47 (94.0%) | 3 (6.0%) |
| 45 to 54 Years | 38 (88.4%) | 5 (11.6%) |
| 55 to 64 Years | 35 (92.1%) | 3 (7.9%) |
| 65 to 74 Years | 45 (100.0%) | 0 (0.0%) |
| 75 Years and older | 12 (100.0%) | 0 (0.0%) |
| Total | 312 (96.0%) | 13 (4.0%) |
Health Insurance Coverage by Citizenship Status in Plummer
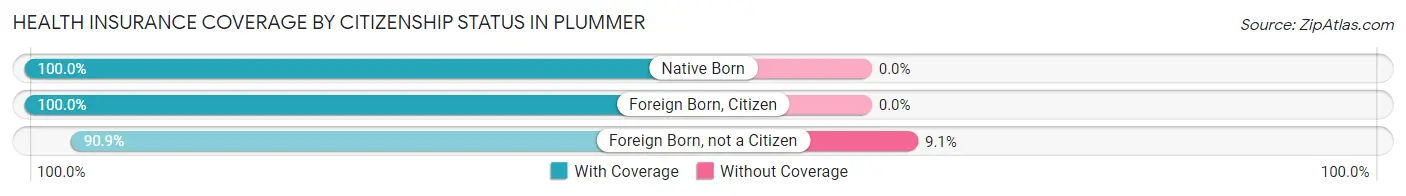
| Citizenship Status | With Coverage | Without Coverage |
| Native Born | 9 (100.0%) | 0 (0.0%) |
| Foreign Born, Citizen | 79 (100.0%) | 0 (0.0%) |
| Foreign Born, not a Citizen | 20 (90.9%) | 2 (9.1%) |
Health Insurance Coverage by Household Income in Plummer
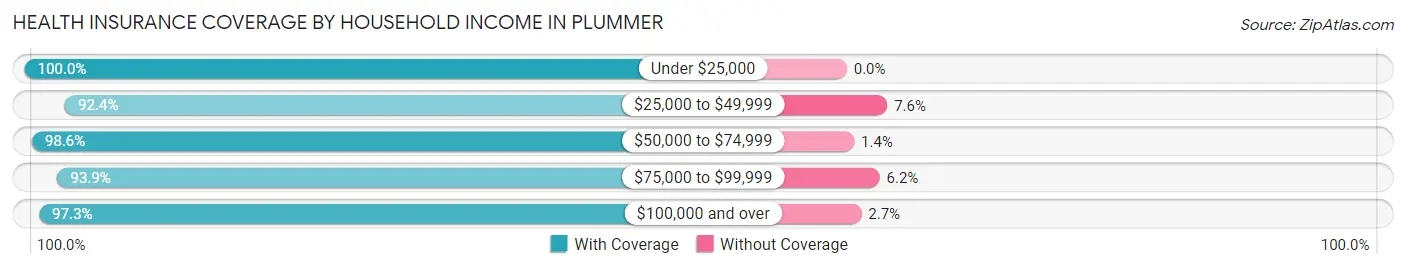
| Household Income | With Coverage | Without Coverage |
| Under $25,000 | 11 (100.0%) | 0 (0.0%) |
| $25,000 to $49,999 | 61 (92.4%) | 5 (7.6%) |
| $50,000 to $74,999 | 72 (98.6%) | 1 (1.4%) |
| $75,000 to $99,999 | 61 (93.9%) | 4 (6.1%) |
| $100,000 and over | 107 (97.3%) | 3 (2.7%) |
Public vs Private Health Insurance Coverage by Age in Plummer
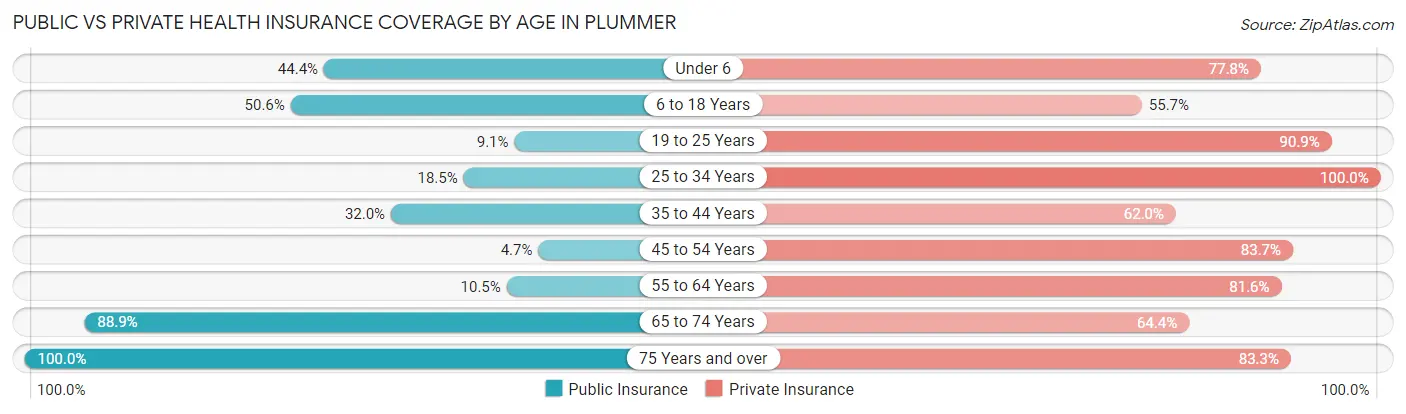
| Age Bracket | Public Insurance | Private Insurance |
| Under 6 | 4 (44.4%) | 7 (77.8%) |
| 6 to 18 Years | 40 (50.6%) | 44 (55.7%) |
| 19 to 25 Years | 2 (9.1%) | 20 (90.9%) |
| 25 to 34 Years | 5 (18.5%) | 27 (100.0%) |
| 35 to 44 Years | 16 (32.0%) | 31 (62.0%) |
| 45 to 54 Years | 2 (4.6%) | 36 (83.7%) |
| 55 to 64 Years | 4 (10.5%) | 31 (81.6%) |
| 65 to 74 Years | 40 (88.9%) | 29 (64.4%) |
| 75 Years and over | 12 (100.0%) | 10 (83.3%) |
| Total | 125 (38.5%) | 235 (72.3%) |
Disability Status by Sex by Age in Plummer
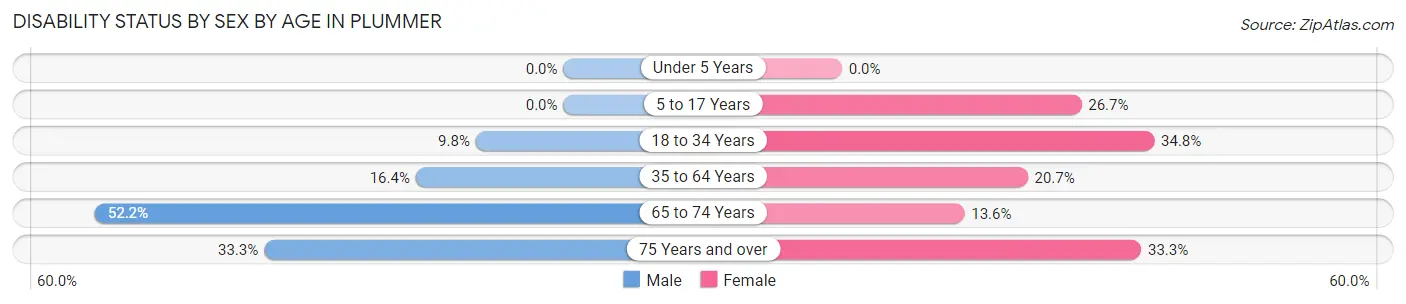
| Age Bracket | Male | Female |
| Under 5 Years | 0 (0.0%) | 0 (0.0%) |
| 5 to 17 Years | 0 (0.0%) | 8 (26.7%) |
| 18 to 34 Years | 4 (9.8%) | 8 (34.8%) |
| 35 to 64 Years | 12 (16.4%) | 12 (20.7%) |
| 65 to 74 Years | 12 (52.2%) | 3 (13.6%) |
| 75 Years and over | 1 (33.3%) | 3 (33.3%) |
Disability Class by Sex by Age in Plummer
Disability Class: Hearing Difficulty
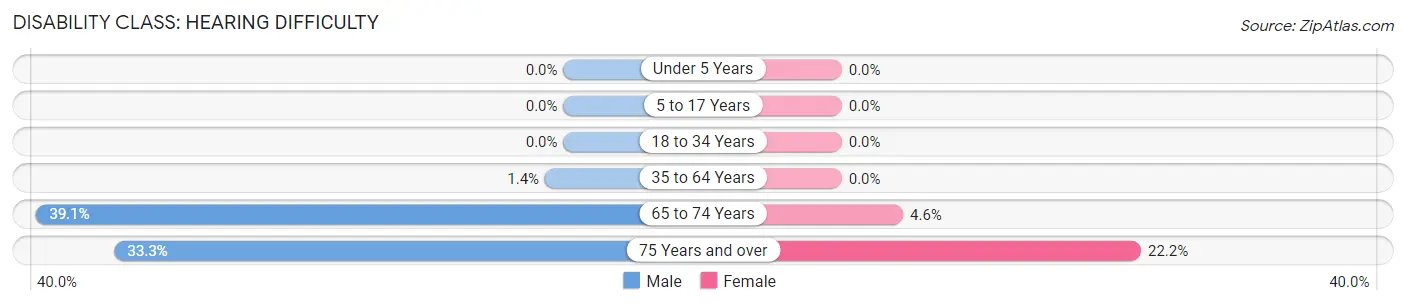
| Age Bracket | Male | Female |
| Under 5 Years | 0 (0.0%) | 0 (0.0%) |
| 5 to 17 Years | 0 (0.0%) | 0 (0.0%) |
| 18 to 34 Years | 0 (0.0%) | 0 (0.0%) |
| 35 to 64 Years | 1 (1.4%) | 0 (0.0%) |
| 65 to 74 Years | 9 (39.1%) | 1 (4.5%) |
| 75 Years and over | 1 (33.3%) | 2 (22.2%) |
Disability Class: Vision Difficulty
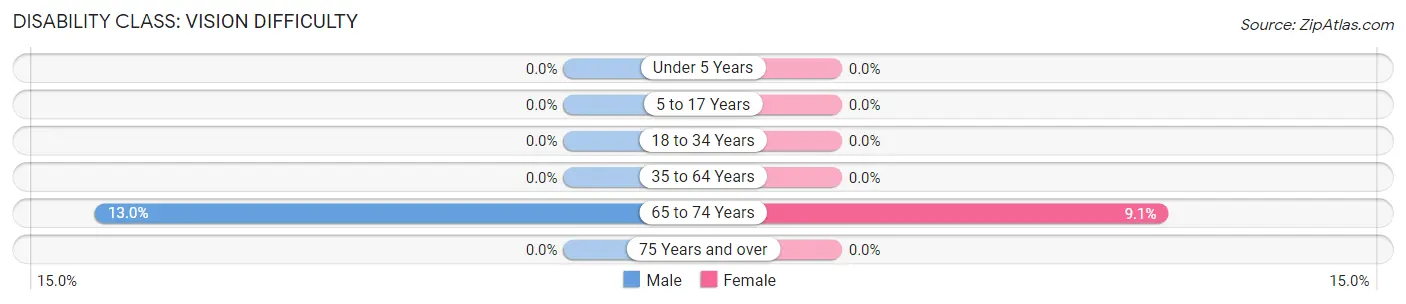
| Age Bracket | Male | Female |
| Under 5 Years | 0 (0.0%) | 0 (0.0%) |
| 5 to 17 Years | 0 (0.0%) | 0 (0.0%) |
| 18 to 34 Years | 0 (0.0%) | 0 (0.0%) |
| 35 to 64 Years | 0 (0.0%) | 0 (0.0%) |
| 65 to 74 Years | 3 (13.0%) | 2 (9.1%) |
| 75 Years and over | 0 (0.0%) | 0 (0.0%) |
Disability Class: Cognitive Difficulty
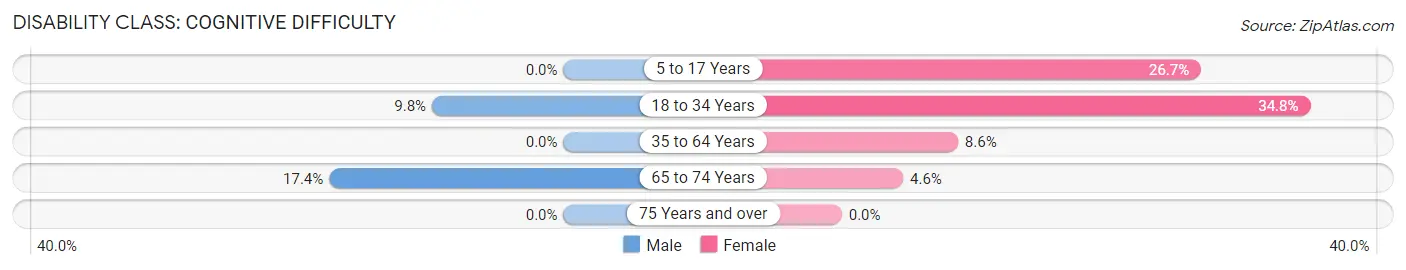
| Age Bracket | Male | Female |
| 5 to 17 Years | 0 (0.0%) | 8 (26.7%) |
| 18 to 34 Years | 4 (9.8%) | 8 (34.8%) |
| 35 to 64 Years | 0 (0.0%) | 5 (8.6%) |
| 65 to 74 Years | 4 (17.4%) | 1 (4.5%) |
| 75 Years and over | 0 (0.0%) | 0 (0.0%) |
Disability Class: Ambulatory Difficulty
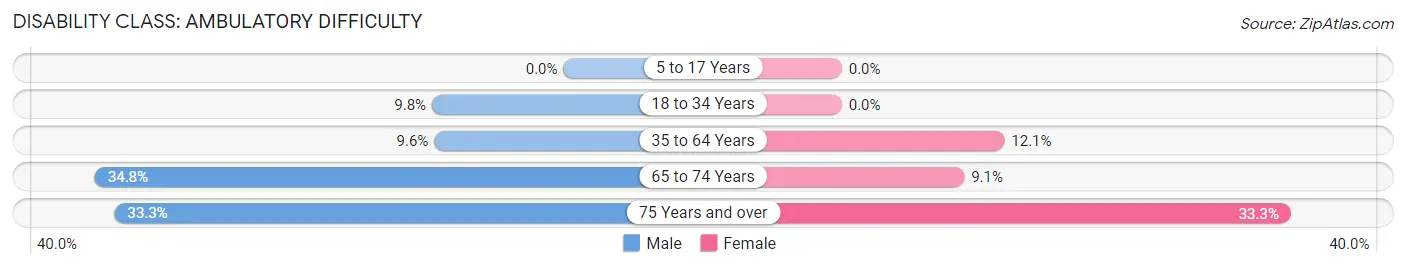
| Age Bracket | Male | Female |
| 5 to 17 Years | 0 (0.0%) | 0 (0.0%) |
| 18 to 34 Years | 4 (9.8%) | 0 (0.0%) |
| 35 to 64 Years | 7 (9.6%) | 7 (12.1%) |
| 65 to 74 Years | 8 (34.8%) | 2 (9.1%) |
| 75 Years and over | 1 (33.3%) | 3 (33.3%) |
Disability Class: Self-Care Difficulty
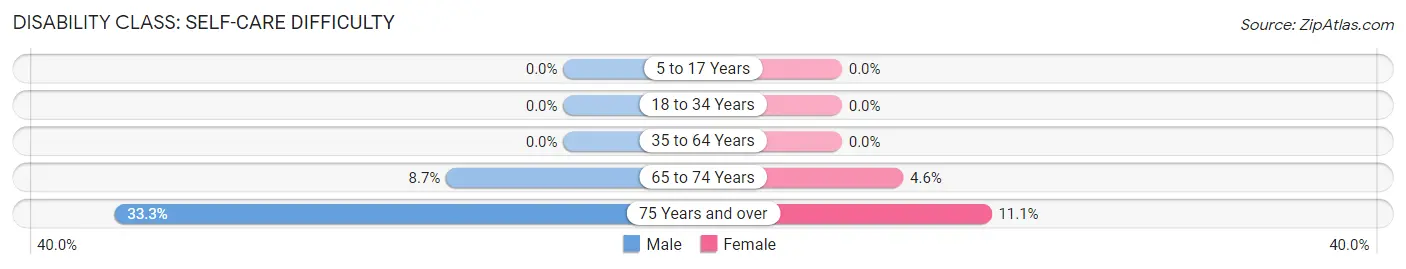
| Age Bracket | Male | Female |
| 5 to 17 Years | 0 (0.0%) | 0 (0.0%) |
| 18 to 34 Years | 0 (0.0%) | 0 (0.0%) |
| 35 to 64 Years | 0 (0.0%) | 0 (0.0%) |
| 65 to 74 Years | 2 (8.7%) | 1 (4.5%) |
| 75 Years and over | 1 (33.3%) | 1 (11.1%) |
Technology Access in Plummer
Computing Device Access in Plummer
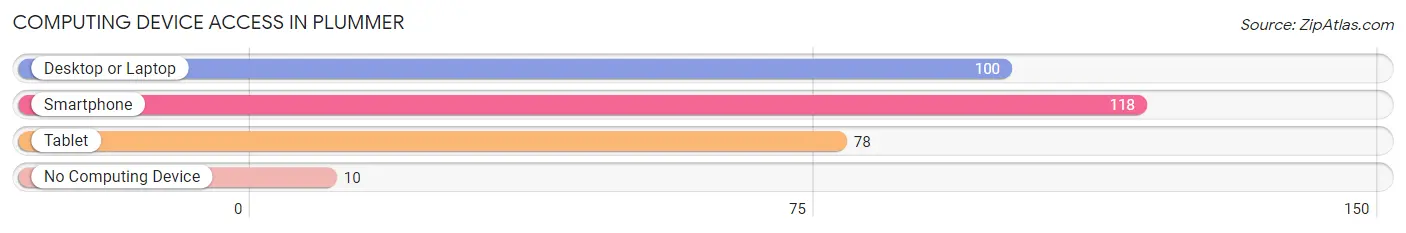
| Device Type | # Households | % Households |
| Desktop or Laptop | 100 | 73.0% |
| Smartphone | 118 | 86.1% |
| Tablet | 78 | 56.9% |
| No Computing Device | 10 | 7.3% |
| Total | 137 | 100.0% |
Internet Access in Plummer
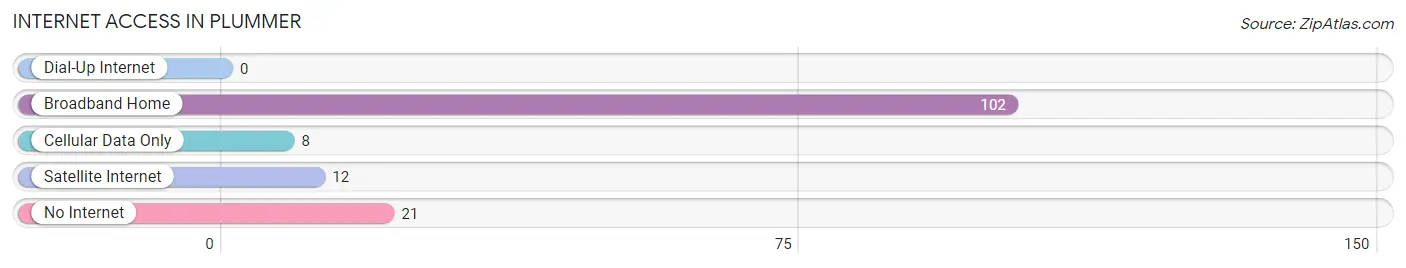
| Internet Type | # Households | % Households |
| Dial-Up Internet | 0 | 0.0% |
| Broadband Home | 102 | 74.5% |
| Cellular Data Only | 8 | 5.8% |
| Satellite Internet | 12 | 8.8% |
| No Internet | 21 | 15.3% |
| Total | 137 | 100.0% |
Plummer Summary
Plummer, Minnesota is a small city located in the northwestern corner of the state, near the border of North Dakota. It is part of the Red Lake Indian Reservation and is the county seat of Pennington County. The city has a population of just over 1,000 people and is the smallest incorporated city in Minnesota.
History
The area that is now Plummer was first settled in the late 1800s by a group of Scandinavian immigrants. The town was originally called “Plummerville” and was named after the first settler, John Plummer. The town was officially incorporated in 1902 and the name was changed to Plummer.
In the early 1900s, Plummer was a thriving agricultural community. The town was home to several grain elevators, a creamery, a flour mill, and a lumber mill. The town also had a hotel, a bank, a post office, and several stores.
In the 1950s, the town began to decline as the agricultural industry shifted away from the area. The lumber mill closed in the 1960s and the creamery closed in the 1970s. The population of Plummer began to decline as well, and by the 1990s the population had dropped to just over 1,000 people.
Geography
Plummer is located in the northwestern corner of Minnesota, near the border of North Dakota. The city is situated on the Red Lake Indian Reservation and is the county seat of Pennington County. The city is located on the Red Lake River and is surrounded by rolling hills and farmland.
The climate in Plummer is typical of the northern Midwest, with cold winters and warm summers. The average temperature in the winter is around 10 degrees Fahrenheit and the average temperature in the summer is around 70 degrees Fahrenheit.
Economy
The economy of Plummer is largely based on agriculture. The town is home to several grain elevators, a flour mill, and a lumber mill. The town also has several stores and restaurants.
The town is also home to a casino, which is owned and operated by the Red Lake Band of Chippewa Indians. The casino is a major source of employment and revenue for the town.
Demographics
As of the 2010 census, the population of Plummer was 1,072. The racial makeup of the town was 95.3% White, 0.9% African American, 0.7% Native American, 0.2% Asian, 0.1% Pacific Islander, and 2.8% from other races. The median household income was $35,938 and the median family income was $41,250.
The town is home to a large Native American population, with the Red Lake Band of Chippewa Indians making up the majority of the population. The town also has a large Scandinavian population, with many of the town’s residents being of Norwegian, Swedish, or Danish descent.
Conclusion
Plummer, Minnesota is a small city located in the northwestern corner of the state, near the border of North Dakota. It is part of the Red Lake Indian Reservation and is the county seat of Pennington County. The city has a population of just over 1,000 people and is the smallest incorporated city in Minnesota. The economy of Plummer is largely based on agriculture, with the town also being home to a casino owned and operated by the Red Lake Band of Chippewa Indians. The town is home to a large Native American population, with the Red Lake Band of Chippewa Indians making up the majority of the population. The town also has a large Scandinavian population, with many of the town’s residents being of Norwegian, Swedish, or Danish descent.
Common Questions
What is Per Capita Income in Plummer?
Per Capita income in Plummer is $36,182.
What is the Median Family Income in Plummer?
Median Family Income in Plummer is $91,023.
What is the Median Household income in Plummer?
Median Household Income in Plummer is $78,750.
What is Income or Wage Gap in Plummer?
Income or Wage Gap in Plummer is 20.3%.
Women in Plummer earn 79.7 cents for every dollar earned by a man.
What is Inequality or Gini Index in Plummer?
Inequality or Gini Index in Plummer is 0.33.
What is the Total Population of Plummer?
Total Population of Plummer is 325.
What is the Total Male Population of Plummer?
Total Male Population of Plummer is 178.
What is the Total Female Population of Plummer?
Total Female Population of Plummer is 147.
What is the Ratio of Males per 100 Females in Plummer?
There are 121.09 Males per 100 Females in Plummer.
What is the Ratio of Females per 100 Males in Plummer?
There are 82.58 Females per 100 Males in Plummer.
What is the Median Population Age in Plummer?
Median Population Age in Plummer is 39.5 Years.
What is the Average Family Size in Plummer
Average Family Size in Plummer is 2.7 People.
What is the Average Household Size in Plummer
Average Household Size in Plummer is 2.4 People.
How Large is the Labor Force in Plummer?
There are 200 People in the Labor Forcein in Plummer.
What is the Percentage of People in the Labor Force in Plummer?
72.7% of People are in the Labor Force in Plummer.
What is the Unemployment Rate in Plummer?
Unemployment Rate in Plummer is 1.0%.