Zip Codes with the Highest Percentage of Population Employed in Installation, Maintenance & Repair in Topeka, KS
RELATED REPORTS & OPTIONS
Installation, Maintenance & Repair
Topeka
Compare Zip Codes
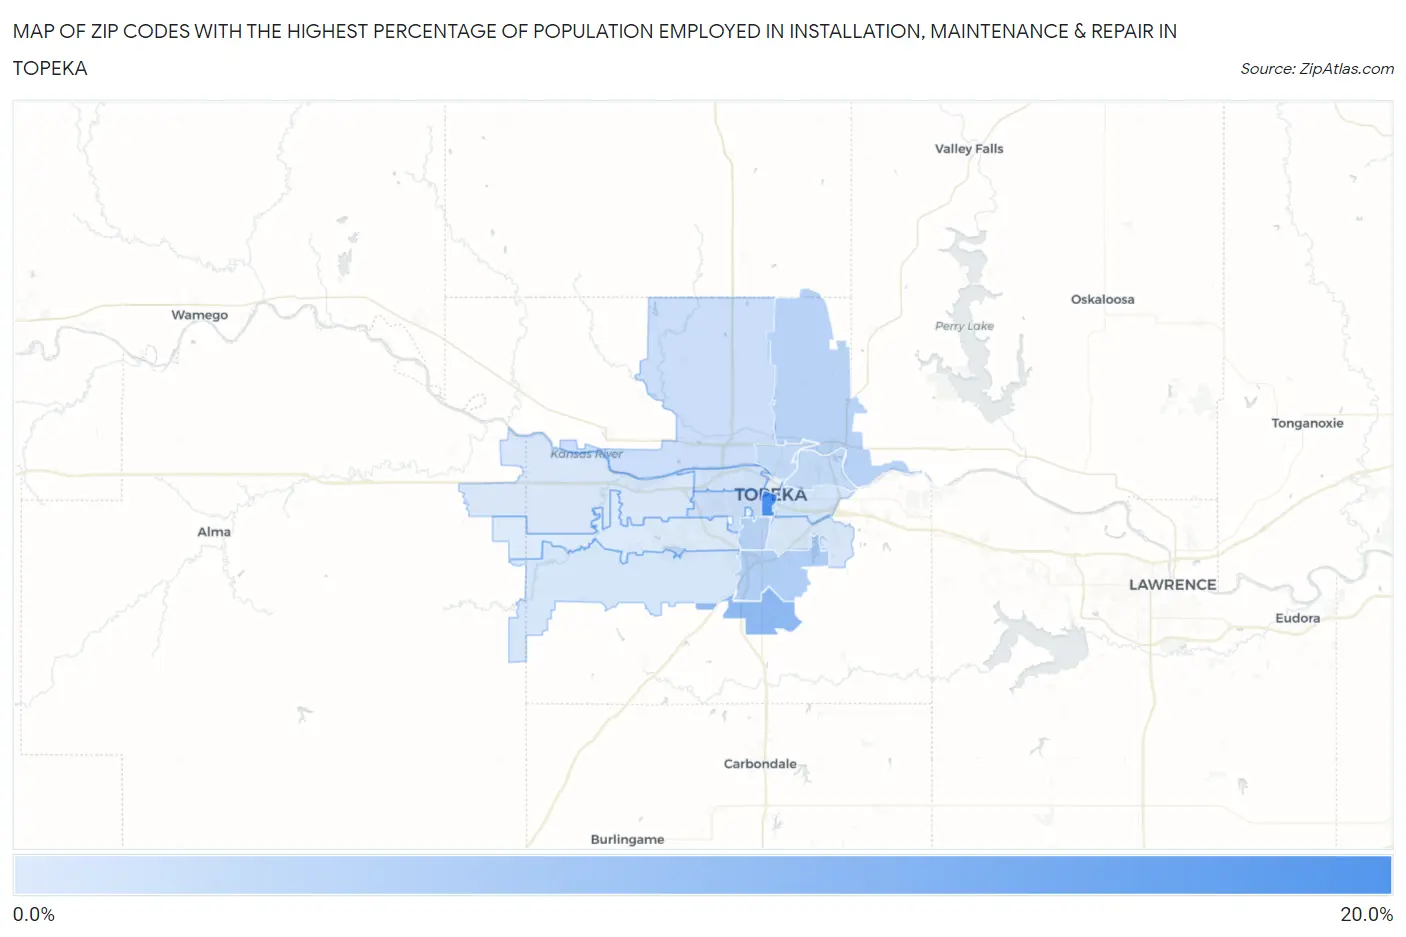
Map of Zip Codes with the Highest Percentage of Population Employed in Installation, Maintenance & Repair in Topeka
2.2%
15.8%
Zip Codes with the Highest Percentage of Population Employed in Installation, Maintenance & Repair in Topeka, KS
| Zip Code | % Employed | vs State | vs National | |
| 1. | 66612 | 15.8% | 3.6%(+12.1)#13 | 3.1%(+12.7)#710 |
| 2. | 66619 | 9.0% | 3.6%(+5.42)#75 | 3.1%(+5.97)#2,534 |
| 3. | 66609 | 5.9% | 3.6%(+2.25)#180 | 3.1%(+2.80)#6,414 |
| 4. | 66617 | 5.4% | 3.6%(+1.78)#201 | 3.1%(+2.33)#7,529 |
| 5. | 66611 | 5.3% | 3.6%(+1.69)#213 | 3.1%(+2.24)#7,780 |
| 6. | 66616 | 4.4% | 3.6%(+0.744)#287 | 3.1%(+1.30)#10,912 |
| 7. | 66608 | 4.4% | 3.6%(+0.734)#288 | 3.1%(+1.29)#10,942 |
| 8. | 66618 | 3.8% | 3.6%(+0.213)#324 | 3.1%(+0.766)#13,099 |
| 9. | 66604 | 3.8% | 3.6%(+0.162)#330 | 3.1%(+0.714)#13,317 |
| 10. | 66606 | 3.2% | 3.6%(-0.388)#379 | 3.1%(+0.164)#15,873 |
| 11. | 66607 | 3.0% | 3.6%(-0.591)#398 | 3.1%(-0.038)#16,847 |
| 12. | 66610 | 2.8% | 3.6%(-0.796)#425 | 3.1%(-0.243)#17,876 |
| 13. | 66605 | 2.5% | 3.6%(-1.09)#443 | 3.1%(-0.537)#19,400 |
| 14. | 66615 | 2.5% | 3.6%(-1.12)#451 | 3.1%(-0.572)#19,576 |
| 15. | 66614 | 2.2% | 3.6%(-1.46)#473 | 3.1%(-0.903)#21,245 |
1
Common Questions
What are the Top 10 Zip Codes with the Highest Percentage of Population Employed in Installation, Maintenance & Repair in Topeka, KS?
Top 10 Zip Codes with the Highest Percentage of Population Employed in Installation, Maintenance & Repair in Topeka, KS are:
What zip code has the Highest Percentage of Population Employed in Installation, Maintenance & Repair in Topeka, KS?
66612 has the Highest Percentage of Population Employed in Installation, Maintenance & Repair in Topeka, KS with 15.8%.
What is the Percentage of Population Employed in Installation, Maintenance & Repair in Topeka, KS?
Percentage of Population Employed in Installation, Maintenance & Repair in Topeka is 3.6%.
What is the Percentage of Population Employed in Installation, Maintenance & Repair in Kansas?
Percentage of Population Employed in Installation, Maintenance & Repair in Kansas is 3.6%.
What is the Percentage of Population Employed in Installation, Maintenance & Repair in the United States?
Percentage of Population Employed in Installation, Maintenance & Repair in the United States is 3.1%.