Zip Codes with the Highest Percentage of Population Employed in Office & Administration in Topeka, KS
RELATED REPORTS & OPTIONS
Office & Administration
Topeka
Compare Zip Codes
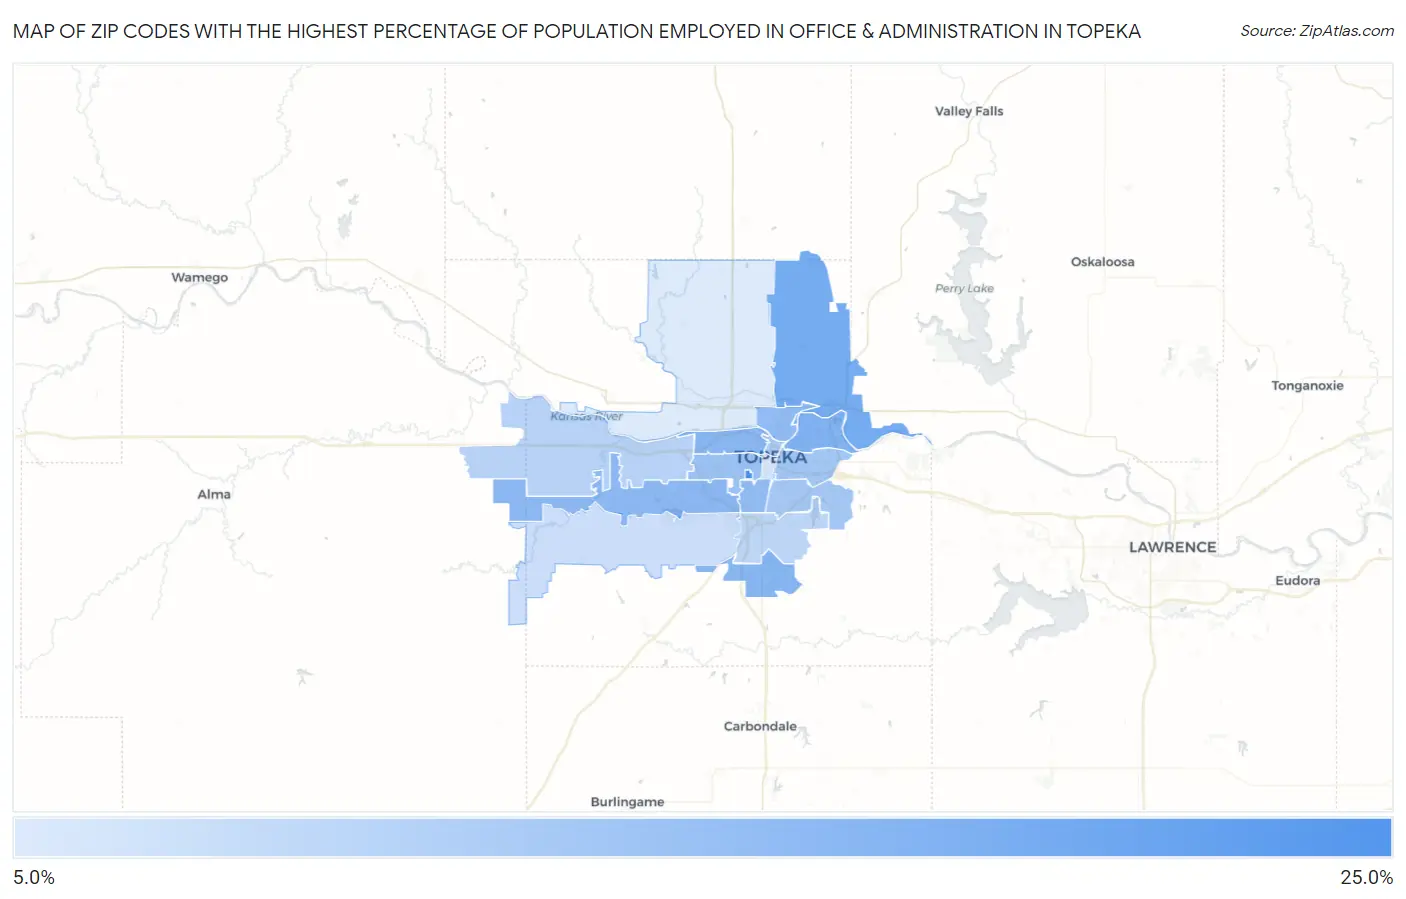
Map of Zip Codes with the Highest Percentage of Population Employed in Office & Administration in Topeka
6.5%
20.6%
Zip Codes with the Highest Percentage of Population Employed in Office & Administration in Topeka, KS
| Zip Code | % Employed | vs State | vs National | |
| 1. | 66621 | 20.6% | 10.6%(+9.98)#40 | 10.9%(+9.76)#1,556 |
| 2. | 66617 | 16.2% | 10.6%(+5.55)#79 | 10.9%(+5.32)#3,411 |
| 3. | 66616 | 14.9% | 10.6%(+4.25)#106 | 10.9%(+4.03)#4,714 |
| 4. | 66619 | 14.3% | 10.6%(+3.71)#116 | 10.9%(+3.49)#5,460 |
| 5. | 66606 | 14.0% | 10.6%(+3.36)#129 | 10.9%(+3.13)#6,035 |
| 6. | 66614 | 13.8% | 10.6%(+3.21)#141 | 10.9%(+2.99)#6,295 |
| 7. | 66608 | 13.5% | 10.6%(+2.88)#150 | 10.9%(+2.66)#6,892 |
| 8. | 66611 | 13.3% | 10.6%(+2.65)#156 | 10.9%(+2.43)#7,413 |
| 9. | 66604 | 12.4% | 10.6%(+1.73)#200 | 10.9%(+1.50)#9,681 |
| 10. | 66607 | 11.8% | 10.6%(+1.16)#235 | 10.9%(+0.942)#11,339 |
| 11. | 66605 | 11.5% | 10.6%(+0.859)#254 | 10.9%(+0.636)#12,263 |
| 12. | 66603 | 11.0% | 10.6%(+0.407)#280 | 10.9%(+0.185)#13,712 |
| 13. | 66615 | 9.7% | 10.6%(-0.909)#362 | 10.9%(-1.13)#17,984 |
| 14. | 66609 | 9.4% | 10.6%(-1.23)#387 | 10.9%(-1.45)#19,065 |
| 15. | 66610 | 8.2% | 10.6%(-2.43)#459 | 10.9%(-2.65)#22,517 |
| 16. | 66612 | 7.1% | 10.6%(-3.52)#519 | 10.9%(-3.74)#24,998 |
| 17. | 66618 | 6.5% | 10.6%(-4.15)#546 | 10.9%(-4.38)#26,129 |
1
Common Questions
What are the Top 10 Zip Codes with the Highest Percentage of Population Employed in Office & Administration in Topeka, KS?
Top 10 Zip Codes with the Highest Percentage of Population Employed in Office & Administration in Topeka, KS are:
What zip code has the Highest Percentage of Population Employed in Office & Administration in Topeka, KS?
66621 has the Highest Percentage of Population Employed in Office & Administration in Topeka, KS with 20.6%.
What is the Percentage of Population Employed in Office & Administration in Topeka, KS?
Percentage of Population Employed in Office & Administration in Topeka is 12.3%.
What is the Percentage of Population Employed in Office & Administration in Kansas?
Percentage of Population Employed in Office & Administration in Kansas is 10.6%.
What is the Percentage of Population Employed in Office & Administration in the United States?
Percentage of Population Employed in Office & Administration in the United States is 10.9%.