Zip Codes with the Highest Percentage of Households Without a Vehicle in Topeka, KS
RELATED REPORTS & OPTIONS
Households without a Cars
Topeka
Compare Zip Codes
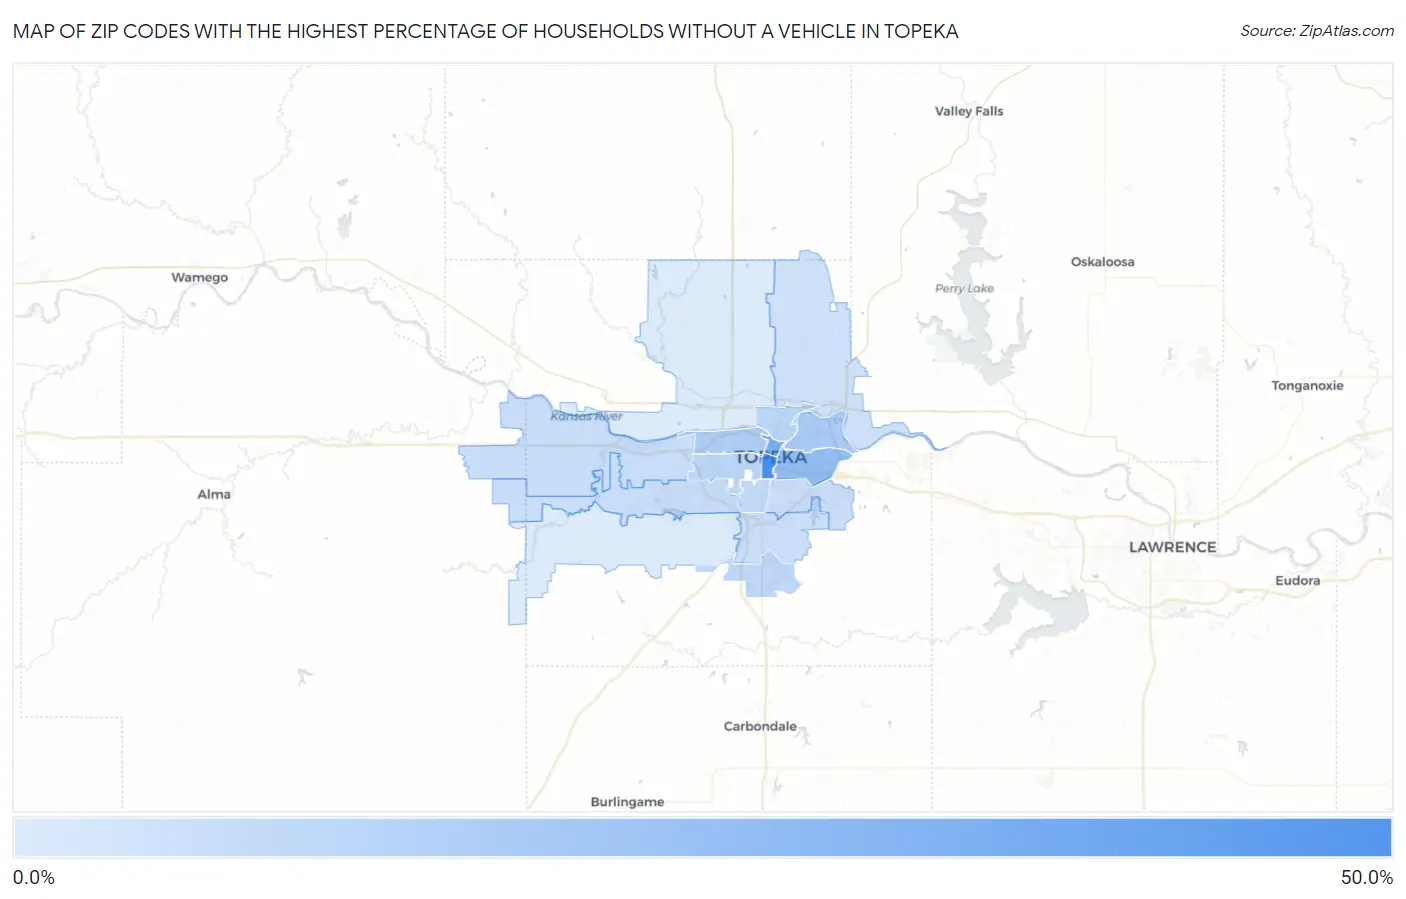
Map of Zip Codes with the Highest Percentage of Households Without a Vehicle in Topeka
0.70%
40.1%
Zip Codes with the Highest Percentage of Households Without a Vehicle in Topeka, KS
| Zip Code | Housholds Without a Car | vs State | vs National | |
| 1. | 66612 | 40.1% | 5.1%(+35.0)#3 | 8.3%(+31.8)#512 |
| 2. | 66603 | 24.2% | 5.1%(+19.1)#6 | 8.3%(+15.9)#1,119 |
| 3. | 66607 | 18.6% | 5.1%(+13.5)#11 | 8.3%(+10.3)#1,698 |
| 4. | 66616 | 12.4% | 5.1%(+7.30)#21 | 8.3%(+4.10)#3,382 |
| 5. | 66606 | 11.7% | 5.1%(+6.60)#24 | 8.3%(+3.40)#3,723 |
| 6. | 66608 | 8.9% | 5.1%(+3.80)#55 | 8.3%(+0.600)#5,882 |
| 7. | 66604 | 8.3% | 5.1%(+3.20)#65 | 8.3%(=0.000)#6,552 |
| 8. | 66619 | 7.4% | 5.1%(+2.30)#90 | 8.3%(-0.900)#7,942 |
| 9. | 66611 | 6.5% | 5.1%(+1.40)#119 | 8.3%(-1.80)#9,432 |
| 10. | 66614 | 5.5% | 5.1%(+0.400)#160 | 8.3%(-2.80)#11,616 |
| 11. | 66615 | 5.3% | 5.1%(+0.200)#174 | 8.3%(-3.00)#12,223 |
| 12. | 66605 | 4.9% | 5.1%(-0.200)#191 | 8.3%(-3.40)#13,131 |
| 13. | 66609 | 4.7% | 5.1%(-0.400)#201 | 8.3%(-3.60)#13,746 |
| 14. | 66617 | 3.7% | 5.1%(-1.40)#260 | 8.3%(-4.60)#16,754 |
| 15. | 66618 | 0.80% | 5.1%(-4.30)#494 | 8.3%(-7.50)#26,126 |
| 16. | 66610 | 0.70% | 5.1%(-4.40)#507 | 8.3%(-7.60)#26,375 |
1
Common Questions
What are the Top 10 Zip Codes with the Highest Percentage of Households Without a Vehicle in Topeka, KS?
Top 10 Zip Codes with the Highest Percentage of Households Without a Vehicle in Topeka, KS are:
What zip code has the Highest Percentage of Households Without a Vehicle in Topeka, KS?
66612 has the Highest Percentage of Households Without a Vehicle in Topeka, KS with 40.1%.
What is the Percentage of Households Without a Vehicle in Topeka, KS?
Percentage of Households Without a Vehicle in Topeka is 8.6%.
What is the Percentage of Households Without a Vehicle in Kansas?
Percentage of Households Without a Vehicle in Kansas is 5.1%.
What is the Percentage of Households Without a Vehicle in the United States?
Percentage of Households Without a Vehicle in the United States is 8.3%.