Zip Codes with the Highest Percentage of Population Employed in Administrative & Support Services in Topeka, KS
RELATED REPORTS & OPTIONS
Administrative & Support Services
Topeka
Compare Zip Codes
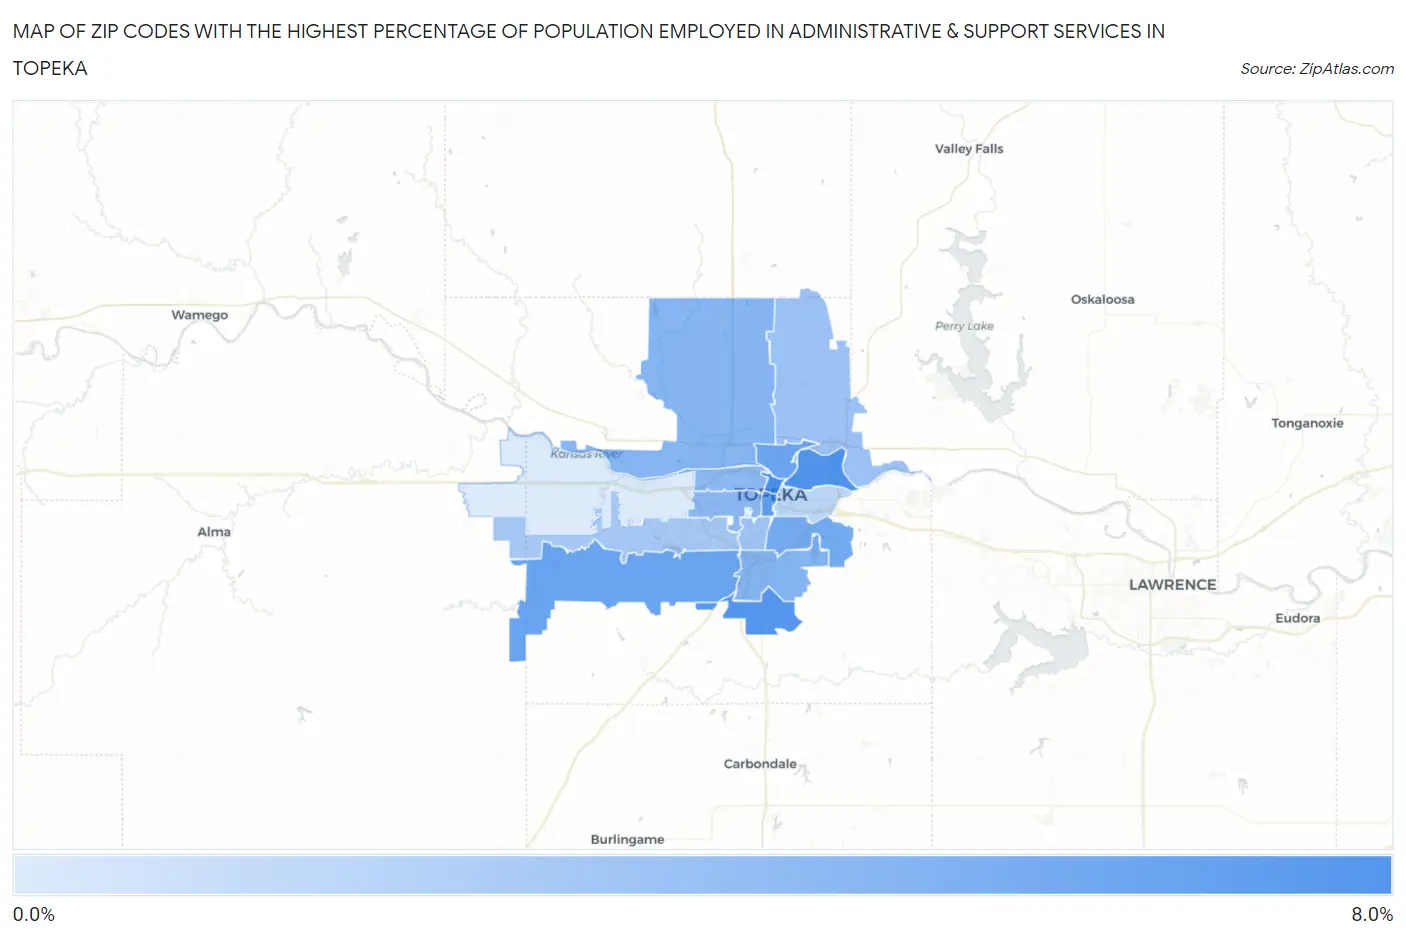
Map of Zip Codes with the Highest Percentage of Population Employed in Administrative & Support Services in Topeka
0.19%
6.8%
Zip Codes with the Highest Percentage of Population Employed in Administrative & Support Services in Topeka, KS
| Zip Code | % Employed | vs State | vs National | |
| 1. | 66603 | 6.8% | 3.2%(+3.60)#37 | 4.1%(+2.63)#3,501 |
| 2. | 66616 | 6.4% | 3.2%(+3.19)#42 | 4.1%(+2.23)#4,109 |
| 3. | 66619 | 6.2% | 3.2%(+2.98)#45 | 4.1%(+2.02)#4,477 |
| 4. | 66612 | 5.8% | 3.2%(+2.66)#54 | 4.1%(+1.70)#5,064 |
| 5. | 66610 | 5.2% | 3.2%(+2.01)#72 | 4.1%(+1.04)#6,602 |
| 6. | 66608 | 5.1% | 3.2%(+1.94)#76 | 4.1%(+0.975)#6,780 |
| 7. | 66605 | 4.7% | 3.2%(+1.53)#88 | 4.1%(+0.570)#7,966 |
| 8. | 66609 | 4.1% | 3.2%(+0.946)#112 | 4.1%(-0.017)#10,109 |
| 9. | 66618 | 4.0% | 3.2%(+0.802)#122 | 4.1%(-0.161)#10,747 |
| 10. | 66604 | 3.7% | 3.2%(+0.541)#141 | 4.1%(-0.422)#11,874 |
| 11. | 66606 | 3.7% | 3.2%(+0.537)#142 | 4.1%(-0.426)#11,892 |
| 12. | 66617 | 3.1% | 3.2%(-0.058)#193 | 4.1%(-1.02)#14,838 |
| 13. | 66611 | 2.7% | 3.2%(-0.457)#232 | 4.1%(-1.42)#16,931 |
| 14. | 66614 | 2.5% | 3.2%(-0.646)#256 | 4.1%(-1.61)#17,923 |
| 15. | 66607 | 1.6% | 3.2%(-1.62)#361 | 4.1%(-2.59)#22,491 |
| 16. | 66615 | 0.19% | 3.2%(-3.00)#503 | 4.1%(-3.96)#26,390 |
1
Common Questions
What are the Top 10 Zip Codes with the Highest Percentage of Population Employed in Administrative & Support Services in Topeka, KS?
Top 10 Zip Codes with the Highest Percentage of Population Employed in Administrative & Support Services in Topeka, KS are:
What zip code has the Highest Percentage of Population Employed in Administrative & Support Services in Topeka, KS?
66603 has the Highest Percentage of Population Employed in Administrative & Support Services in Topeka, KS with 6.8%.
What is the Percentage of Population Employed in Administrative & Support Services in Topeka, KS?
Percentage of Population Employed in Administrative & Support Services in Topeka is 4.0%.
What is the Percentage of Population Employed in Administrative & Support Services in Kansas?
Percentage of Population Employed in Administrative & Support Services in Kansas is 3.2%.
What is the Percentage of Population Employed in Administrative & Support Services in the United States?
Percentage of Population Employed in Administrative & Support Services in the United States is 4.1%.