Zip Codes with the Highest Percentage of Households Heated by Utility Gas in Topeka, KS
RELATED REPORTS & OPTIONS
Utility Gas Heating
Topeka
Compare Zip Codes
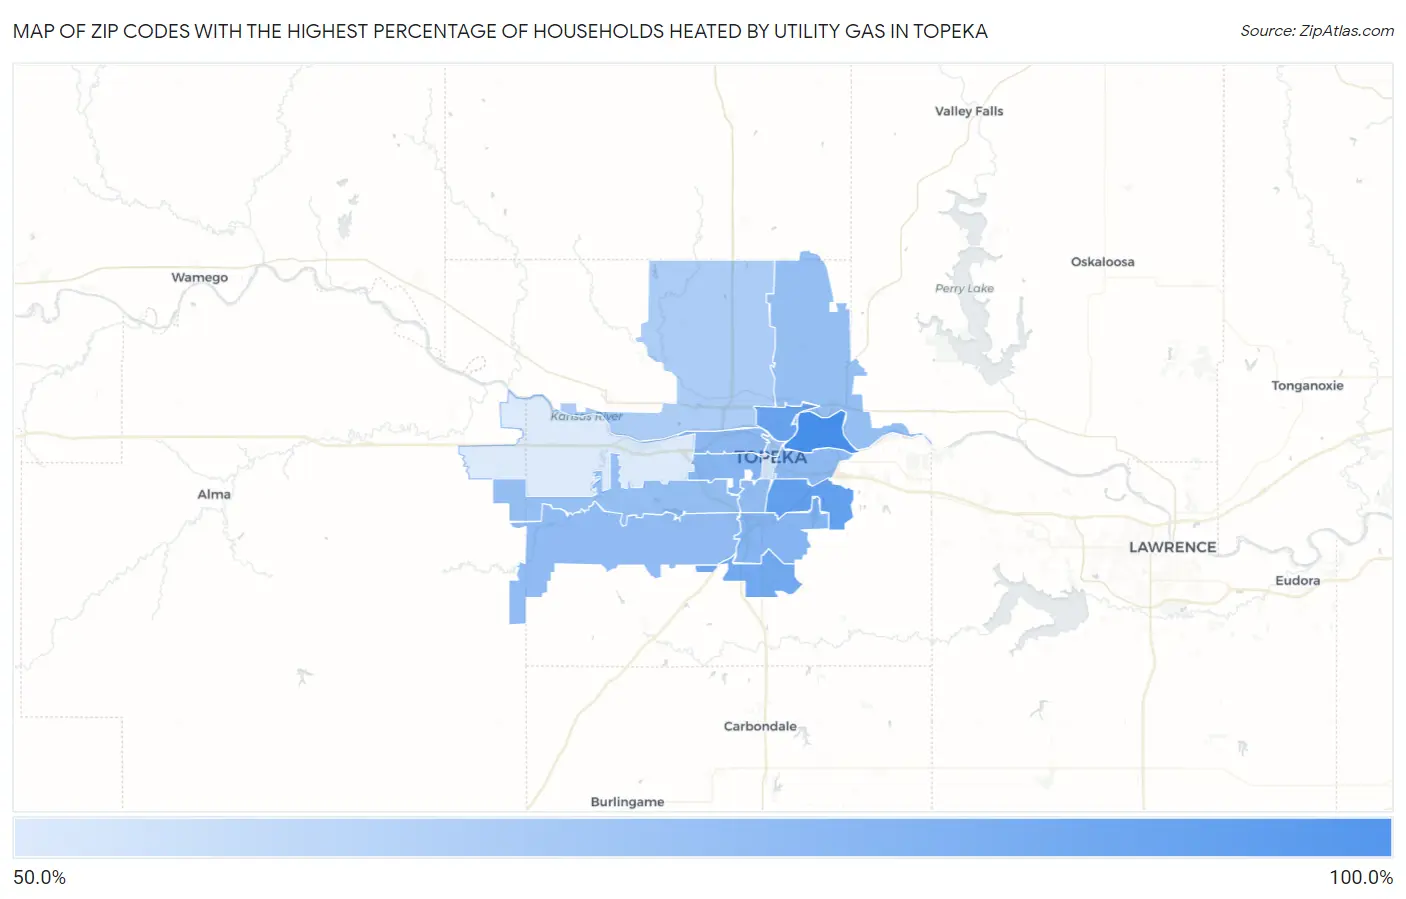
Map of Zip Codes with the Highest Percentage of Households Heated by Utility Gas in Topeka
53.0%
88.3%
Zip Codes with the Highest Percentage of Households Heated by Utility Gas in Topeka, KS
| Zip Code | Utility Gas Heating | vs State | vs National | |
| 1. | 66616 | 88.3% | 64.0%(+24.3)#5 | 47.1%(+41.2)#828 |
| 2. | 66605 | 81.4% | 64.0%(+17.4)#24 | 47.1%(+34.3)#2,002 |
| 3. | 66608 | 80.1% | 64.0%(+16.1)#32 | 47.1%(+33.0)#2,264 |
| 4. | 66619 | 77.4% | 64.0%(+13.4)#45 | 47.1%(+30.3)#2,842 |
| 5. | 66609 | 72.5% | 64.0%(+8.50)#89 | 47.1%(+25.4)#4,004 |
| 6. | 66604 | 72.2% | 64.0%(+8.20)#95 | 47.1%(+25.1)#4,074 |
| 7. | 66606 | 70.9% | 64.0%(+6.90)#117 | 47.1%(+23.8)#4,401 |
| 8. | 66607 | 70.6% | 64.0%(+6.60)#123 | 47.1%(+23.5)#4,472 |
| 9. | 66610 | 70.2% | 64.0%(+6.20)#130 | 47.1%(+23.1)#4,582 |
| 10. | 66611 | 69.4% | 64.0%(+5.40)#141 | 47.1%(+22.3)#4,789 |
| 11. | 66617 | 69.0% | 64.0%(+5.00)#146 | 47.1%(+21.9)#4,905 |
| 12. | 66614 | 68.9% | 64.0%(+4.90)#150 | 47.1%(+21.8)#4,927 |
| 13. | 66603 | 66.7% | 64.0%(+2.70)#182 | 47.1%(+19.6)#5,535 |
| 14. | 66618 | 63.5% | 64.0%(-0.500)#228 | 47.1%(+16.4)#6,400 |
| 15. | 66612 | 55.7% | 64.0%(-8.30)#339 | 47.1%(+8.60)#8,641 |
| 16. | 66615 | 53.0% | 64.0%(-11.0)#376 | 47.1%(+5.90)#9,369 |
1
Common Questions
What are the Top 10 Zip Codes with the Highest Percentage of Households Heated by Utility Gas in Topeka, KS?
Top 10 Zip Codes with the Highest Percentage of Households Heated by Utility Gas in Topeka, KS are:
What zip code has the Highest Percentage of Households Heated by Utility Gas in Topeka, KS?
66616 has the Highest Percentage of Households Heated by Utility Gas in Topeka, KS with 88.3%.
What is the Percentage of Households Heated by Utility Gas in Topeka, KS?
Percentage of Households Heated by Utility Gas in Topeka is 73.2%.
What is the Percentage of Households Heated by Utility Gas in Kansas?
Percentage of Households Heated by Utility Gas in Kansas is 64.0%.
What is the Percentage of Households Heated by Utility Gas in the United States?
Percentage of Households Heated by Utility Gas in the United States is 47.1%.