Zip Codes with the Highest Percentage of Population Employed in Computer, Engineering & Science in Topeka, KS
RELATED REPORTS & OPTIONS
Computer, Engineering & Science
Topeka
Compare Zip Codes
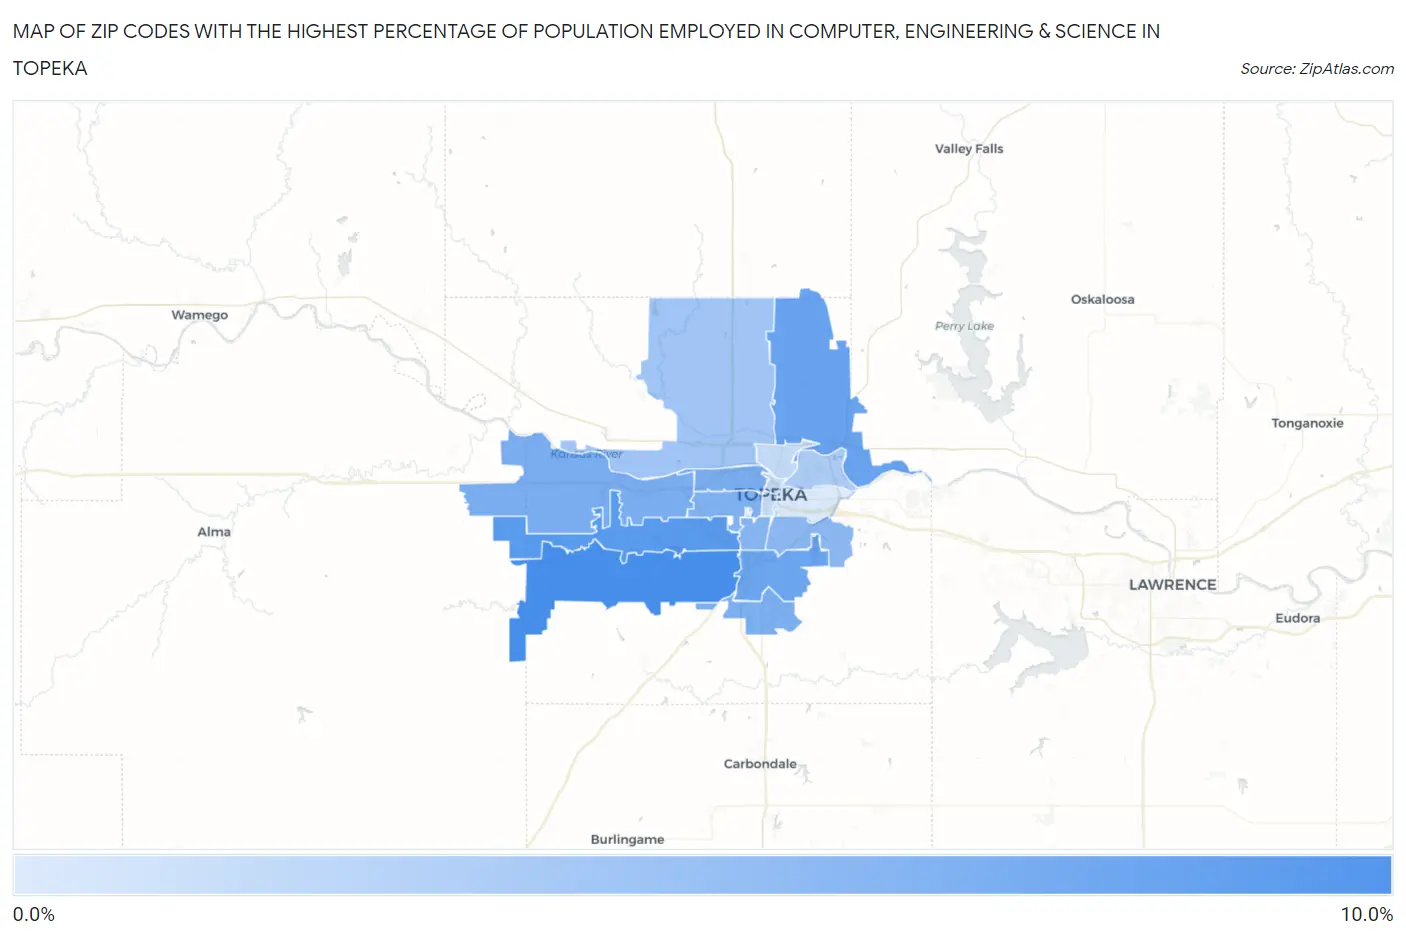
Map of Zip Codes with the Highest Percentage of Population Employed in Computer, Engineering & Science in Topeka
1.0%
8.8%
Zip Codes with the Highest Percentage of Population Employed in Computer, Engineering & Science in Topeka, KS
| Zip Code | % Employed | vs State | vs National | |
| 1. | 66610 | 8.8% | 6.0%(+2.88)#58 | 6.8%(+2.08)#4,219 |
| 2. | 66614 | 7.9% | 6.0%(+1.98)#85 | 6.8%(+1.18)#5,349 |
| 3. | 66617 | 7.1% | 6.0%(+1.13)#96 | 6.8%(+0.328)#6,642 |
| 4. | 66609 | 6.9% | 6.0%(+0.956)#103 | 6.8%(+0.154)#6,937 |
| 5. | 66606 | 6.2% | 6.0%(+0.225)#124 | 6.8%(-0.578)#8,373 |
| 6. | 66615 | 6.1% | 6.0%(+0.180)#128 | 6.8%(-0.623)#8,484 |
| 7. | 66619 | 6.0% | 6.0%(-0.008)#140 | 6.8%(-0.811)#8,942 |
| 8. | 66604 | 5.8% | 6.0%(-0.204)#149 | 6.8%(-1.01)#9,400 |
| 9. | 66611 | 5.4% | 6.0%(-0.588)#169 | 6.8%(-1.39)#10,401 |
| 10. | 66605 | 5.2% | 6.0%(-0.745)#174 | 6.8%(-1.55)#10,778 |
| 11. | 66618 | 4.0% | 6.0%(-1.91)#224 | 6.8%(-2.72)#14,339 |
| 12. | 66616 | 3.5% | 6.0%(-2.44)#256 | 6.8%(-3.24)#16,187 |
| 13. | 66603 | 2.4% | 6.0%(-3.60)#340 | 6.8%(-4.40)#20,514 |
| 14. | 66608 | 2.4% | 6.0%(-3.60)#342 | 6.8%(-4.41)#20,547 |
| 15. | 66612 | 2.3% | 6.0%(-3.67)#349 | 6.8%(-4.48)#20,794 |
| 16. | 66607 | 1.0% | 6.0%(-4.94)#467 | 6.8%(-5.74)#24,995 |
1
Common Questions
What are the Top 10 Zip Codes with the Highest Percentage of Population Employed in Computer, Engineering & Science in Topeka, KS?
Top 10 Zip Codes with the Highest Percentage of Population Employed in Computer, Engineering & Science in Topeka, KS are:
What zip code has the Highest Percentage of Population Employed in Computer, Engineering & Science in Topeka, KS?
66610 has the Highest Percentage of Population Employed in Computer, Engineering & Science in Topeka, KS with 8.8%.
What is the Percentage of Population Employed in Computer, Engineering & Science in Topeka, KS?
Percentage of Population Employed in Computer, Engineering & Science in Topeka is 5.7%.
What is the Percentage of Population Employed in Computer, Engineering & Science in Kansas?
Percentage of Population Employed in Computer, Engineering & Science in Kansas is 6.0%.
What is the Percentage of Population Employed in Computer, Engineering & Science in the United States?
Percentage of Population Employed in Computer, Engineering & Science in the United States is 6.8%.