Zip Codes with the Highest Percentage of Population Employed in Accommodation & Food Services in Topeka, KS
RELATED REPORTS & OPTIONS
Accommodation & Food Services
Topeka
Compare Zip Codes
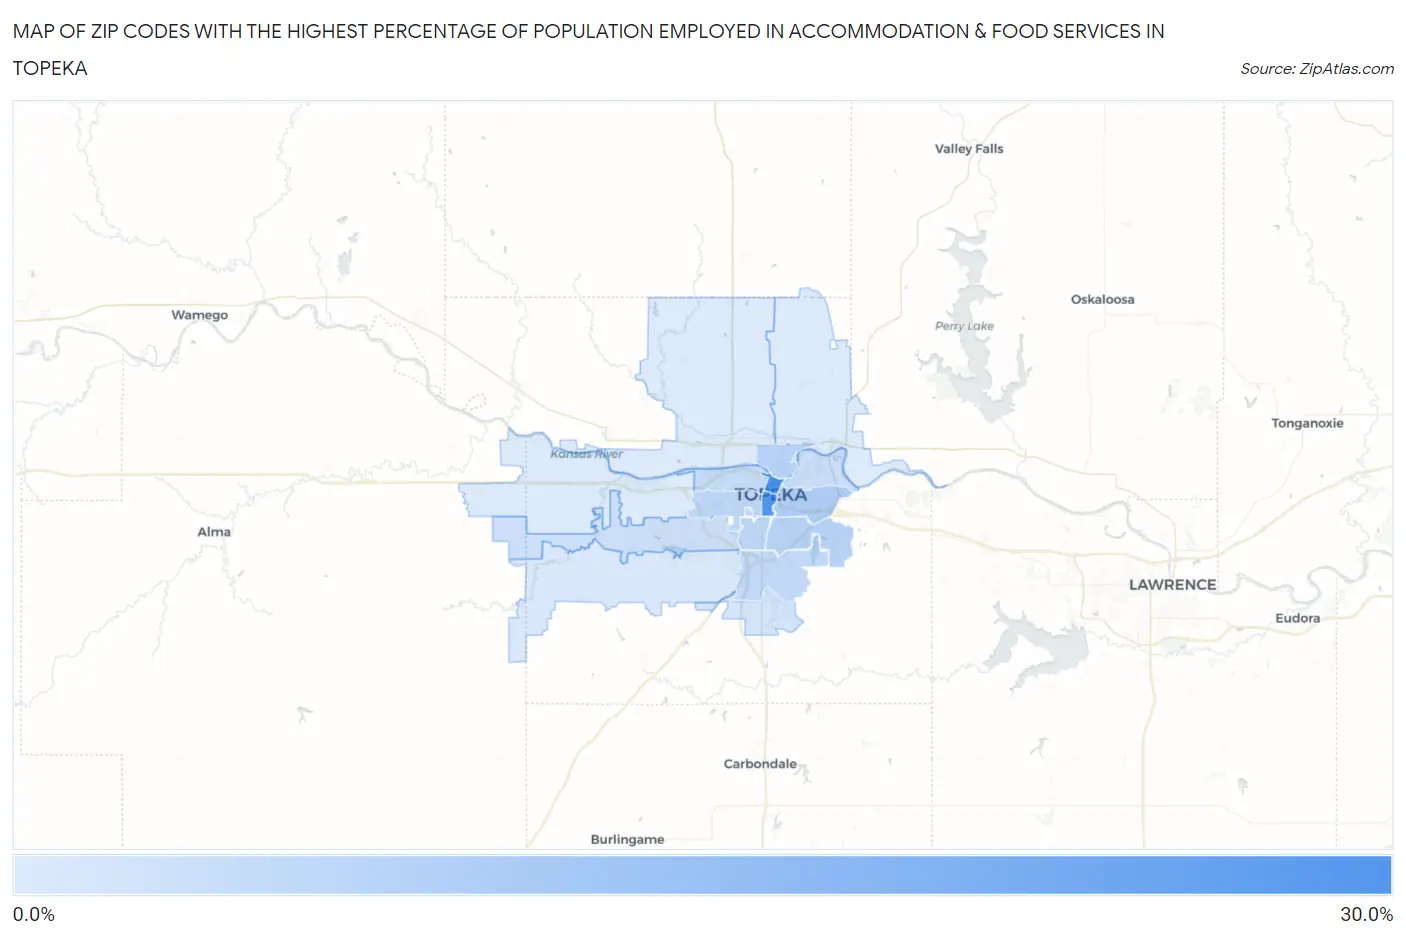
Map of Zip Codes with the Highest Percentage of Population Employed in Accommodation & Food Services in Topeka
2.6%
27.6%
Zip Codes with the Highest Percentage of Population Employed in Accommodation & Food Services in Topeka, KS
| Zip Code | % Employed | vs State | vs National | |
| 1. | 66603 | 27.6% | 6.2%(+21.4)#5 | 6.9%(+20.7)#400 |
| 2. | 66612 | 25.7% | 6.2%(+19.4)#10 | 6.9%(+18.8)#475 |
| 3. | 66607 | 9.9% | 6.2%(+3.63)#60 | 6.9%(+2.97)#4,720 |
| 4. | 66605 | 8.2% | 6.2%(+1.99)#88 | 6.9%(+1.33)#7,389 |
| 5. | 66608 | 8.1% | 6.2%(+1.89)#91 | 6.9%(+1.24)#7,598 |
| 6. | 66621 | 7.9% | 6.2%(+1.67)#96 | 6.9%(+1.01)#8,035 |
| 7. | 66611 | 7.3% | 6.2%(+1.08)#113 | 6.9%(+0.421)#9,507 |
| 8. | 66604 | 7.3% | 6.2%(+1.04)#114 | 6.9%(+0.386)#9,620 |
| 9. | 66609 | 7.0% | 6.2%(+0.754)#129 | 6.9%(+0.097)#10,384 |
| 10. | 66606 | 6.0% | 6.2%(-0.253)#181 | 6.9%(-0.911)#13,531 |
| 11. | 66616 | 5.4% | 6.2%(-0.870)#213 | 6.9%(-1.53)#15,576 |
| 12. | 66614 | 5.1% | 6.2%(-1.14)#226 | 6.9%(-1.80)#16,527 |
| 13. | 66619 | 3.8% | 6.2%(-2.42)#306 | 6.9%(-3.08)#20,794 |
| 14. | 66610 | 2.9% | 6.2%(-3.34)#374 | 6.9%(-3.99)#23,537 |
| 15. | 66617 | 2.7% | 6.2%(-3.51)#391 | 6.9%(-4.17)#23,976 |
| 16. | 66615 | 2.7% | 6.2%(-3.54)#392 | 6.9%(-4.19)#24,032 |
| 17. | 66618 | 2.6% | 6.2%(-3.64)#399 | 6.9%(-4.29)#24,273 |
1
Common Questions
What are the Top 10 Zip Codes with the Highest Percentage of Population Employed in Accommodation & Food Services in Topeka, KS?
Top 10 Zip Codes with the Highest Percentage of Population Employed in Accommodation & Food Services in Topeka, KS are:
What zip code has the Highest Percentage of Population Employed in Accommodation & Food Services in Topeka, KS?
66603 has the Highest Percentage of Population Employed in Accommodation & Food Services in Topeka, KS with 27.6%.
What is the Percentage of Population Employed in Accommodation & Food Services in Topeka, KS?
Percentage of Population Employed in Accommodation & Food Services in Topeka is 7.3%.
What is the Percentage of Population Employed in Accommodation & Food Services in Kansas?
Percentage of Population Employed in Accommodation & Food Services in Kansas is 6.2%.
What is the Percentage of Population Employed in Accommodation & Food Services in the United States?
Percentage of Population Employed in Accommodation & Food Services in the United States is 6.9%.