Zip Codes with the Highest Percentage of Households Heated by Electricity in Topeka, KS
RELATED REPORTS & OPTIONS
Electrical Heating
Topeka
Compare Zip Codes
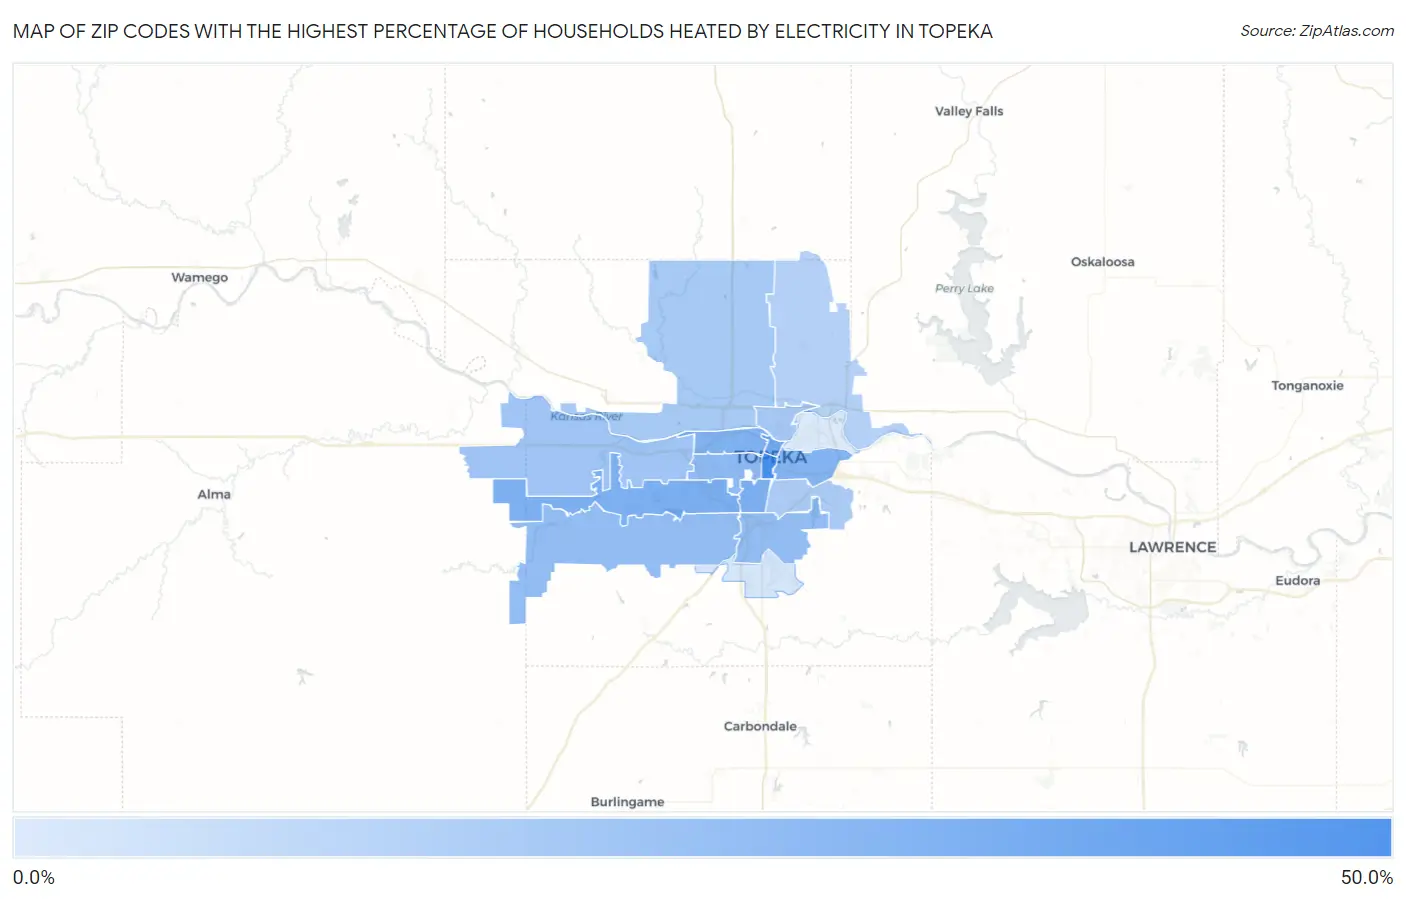
Map of Zip Codes with the Highest Percentage of Households Heated by Electricity in Topeka
7.8%
40.9%
Zip Codes with the Highest Percentage of Households Heated by Electricity in Topeka, KS
| Zip Code | Electrical Heating | vs State | vs National | |
| 1. | 66612 | 40.9% | 26.0%(+14.9)#35 | 40.2%(+0.700)#12,431 |
| 2. | 66603 | 31.0% | 26.0%(+5.00)#106 | 40.2%(-9.20)#15,593 |
| 3. | 66614 | 28.2% | 26.0%(+2.20)#138 | 40.2%(-12.0)#16,685 |
| 4. | 66611 | 27.6% | 26.0%(+1.60)#148 | 40.2%(-12.6)#16,956 |
| 5. | 66606 | 27.1% | 26.0%(+1.10)#151 | 40.2%(-13.1)#17,158 |
| 6. | 66607 | 26.1% | 26.0%(+0.100)#163 | 40.2%(-14.1)#17,571 |
| 7. | 66604 | 23.9% | 26.0%(-2.10)#197 | 40.2%(-16.3)#18,547 |
| 8. | 66610 | 23.1% | 26.0%(-2.90)#216 | 40.2%(-17.1)#18,923 |
| 9. | 66609 | 22.8% | 26.0%(-3.20)#221 | 40.2%(-17.4)#19,077 |
| 10. | 66615 | 19.8% | 26.0%(-6.20)#292 | 40.2%(-20.4)#20,607 |
| 11. | 66608 | 18.8% | 26.0%(-7.20)#319 | 40.2%(-21.4)#21,118 |
| 12. | 66618 | 18.4% | 26.0%(-7.60)#330 | 40.2%(-21.8)#21,311 |
| 13. | 66605 | 17.3% | 26.0%(-8.70)#359 | 40.2%(-22.9)#21,896 |
| 14. | 66617 | 15.9% | 26.0%(-10.1)#415 | 40.2%(-24.3)#22,719 |
| 15. | 66619 | 9.1% | 26.0%(-16.9)#556 | 40.2%(-31.1)#27,024 |
| 16. | 66616 | 7.8% | 26.0%(-18.2)#585 | 40.2%(-32.4)#27,906 |
1
Common Questions
What are the Top 10 Zip Codes with the Highest Percentage of Households Heated by Electricity in Topeka, KS?
Top 10 Zip Codes with the Highest Percentage of Households Heated by Electricity in Topeka, KS are:
What zip code has the Highest Percentage of Households Heated by Electricity in Topeka, KS?
66612 has the Highest Percentage of Households Heated by Electricity in Topeka, KS with 40.9%.
What is the Percentage of Households Heated by Electricity in Topeka, KS?
Percentage of Households Heated by Electricity in Topeka is 24.3%.
What is the Percentage of Households Heated by Electricity in Kansas?
Percentage of Households Heated by Electricity in Kansas is 26.0%.
What is the Percentage of Households Heated by Electricity in the United States?
Percentage of Households Heated by Electricity in the United States is 40.2%.