Zip Codes with the Highest Percentage of Population Employed in Security & Protection in Topeka, KS
RELATED REPORTS & OPTIONS
Security & Protection
Topeka
Compare Zip Codes
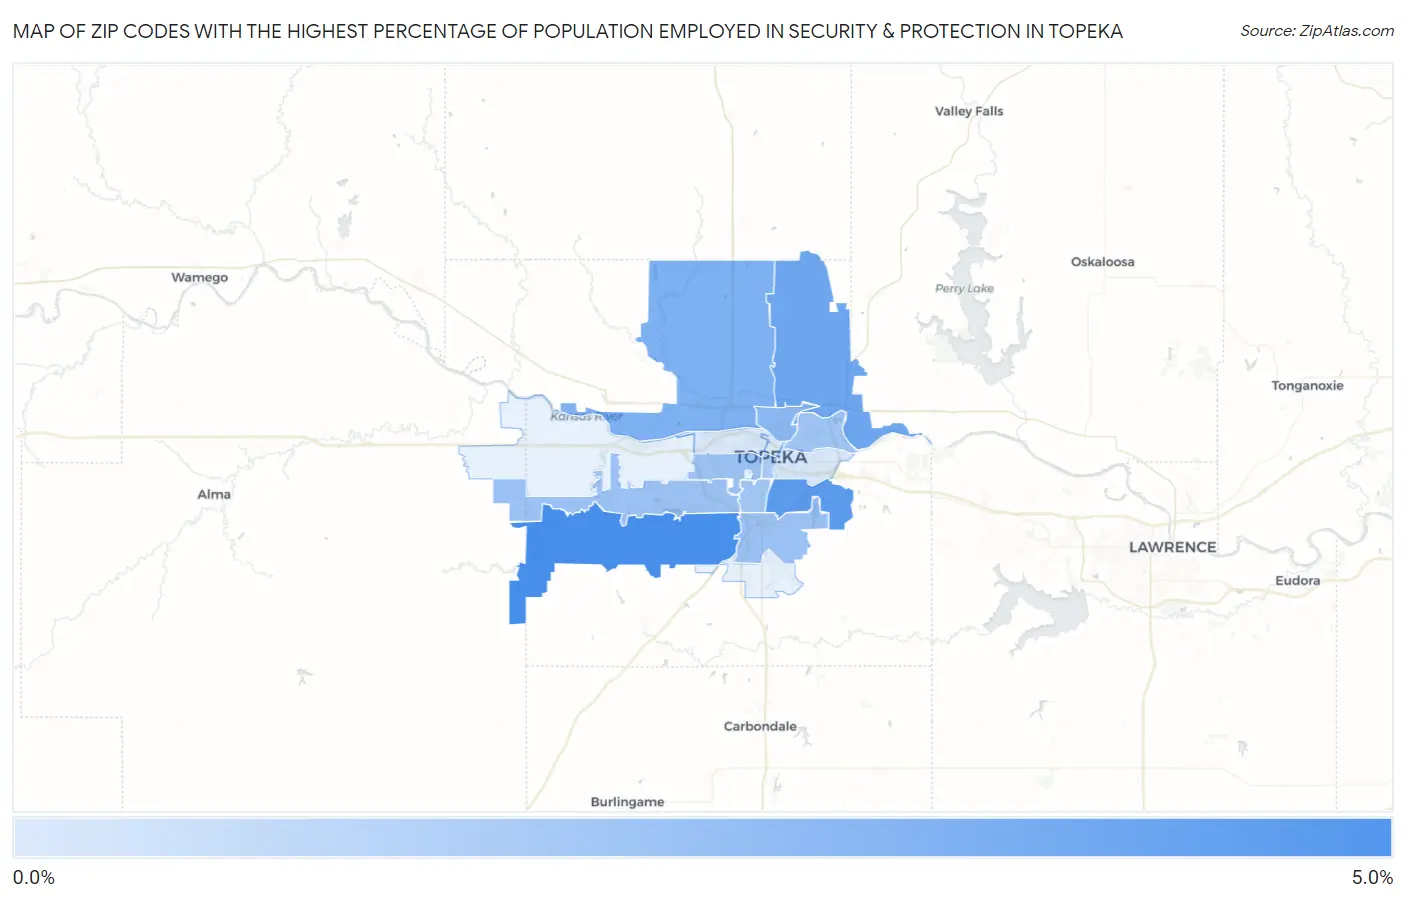
Map of Zip Codes with the Highest Percentage of Population Employed in Security & Protection in Topeka
0.32%
4.7%
Zip Codes with the Highest Percentage of Population Employed in Security & Protection in Topeka, KS
| Zip Code | % Employed | vs State | vs National | |
| 1. | 66610 | 4.7% | 1.8%(+2.97)#46 | 2.1%(+2.59)#3,248 |
| 2. | 66605 | 4.1% | 1.8%(+2.32)#63 | 2.1%(+1.95)#4,304 |
| 3. | 66617 | 3.5% | 1.8%(+1.77)#90 | 2.1%(+1.40)#5,548 |
| 4. | 66618 | 3.1% | 1.8%(+1.30)#115 | 2.1%(+0.926)#6,975 |
| 5. | 66608 | 2.8% | 1.8%(+0.991)#133 | 2.1%(+0.618)#8,253 |
| 6. | 66609 | 2.2% | 1.8%(+0.471)#175 | 2.1%(+0.098)#10,967 |
| 7. | 66614 | 2.2% | 1.8%(+0.467)#176 | 2.1%(+0.094)#10,992 |
| 8. | 66604 | 2.2% | 1.8%(+0.461)#178 | 2.1%(+0.088)#11,035 |
| 9. | 66616 | 2.1% | 1.8%(+0.315)#194 | 2.1%(-0.058)#11,981 |
| 10. | 66611 | 2.0% | 1.8%(+0.218)#205 | 2.1%(-0.155)#12,597 |
| 11. | 66612 | 1.8% | 1.8%(+0.004)#232 | 2.1%(-0.370)#14,104 |
| 12. | 66606 | 0.47% | 1.8%(-1.30)#428 | 2.1%(-1.68)#23,377 |
| 13. | 66607 | 0.45% | 1.8%(-1.33)#430 | 2.1%(-1.70)#23,515 |
| 14. | 66603 | 0.32% | 1.8%(-1.46)#447 | 2.1%(-1.83)#24,108 |
1
Common Questions
What are the Top 10 Zip Codes with the Highest Percentage of Population Employed in Security & Protection in Topeka, KS?
Top 10 Zip Codes with the Highest Percentage of Population Employed in Security & Protection in Topeka, KS are:
What zip code has the Highest Percentage of Population Employed in Security & Protection in Topeka, KS?
66610 has the Highest Percentage of Population Employed in Security & Protection in Topeka, KS with 4.7%.
What is the Percentage of Population Employed in Security & Protection in Topeka, KS?
Percentage of Population Employed in Security & Protection in Topeka is 2.2%.
What is the Percentage of Population Employed in Security & Protection in Kansas?
Percentage of Population Employed in Security & Protection in Kansas is 1.8%.
What is the Percentage of Population Employed in Security & Protection in the United States?
Percentage of Population Employed in Security & Protection in the United States is 2.1%.