Zip Codes with the Highest Percentage of Households with Income Below $10,000 in Mishawaka, IN
RELATED REPORTS & OPTIONS
Household Income | $0-10k
Mishawaka
Compare Zip Codes
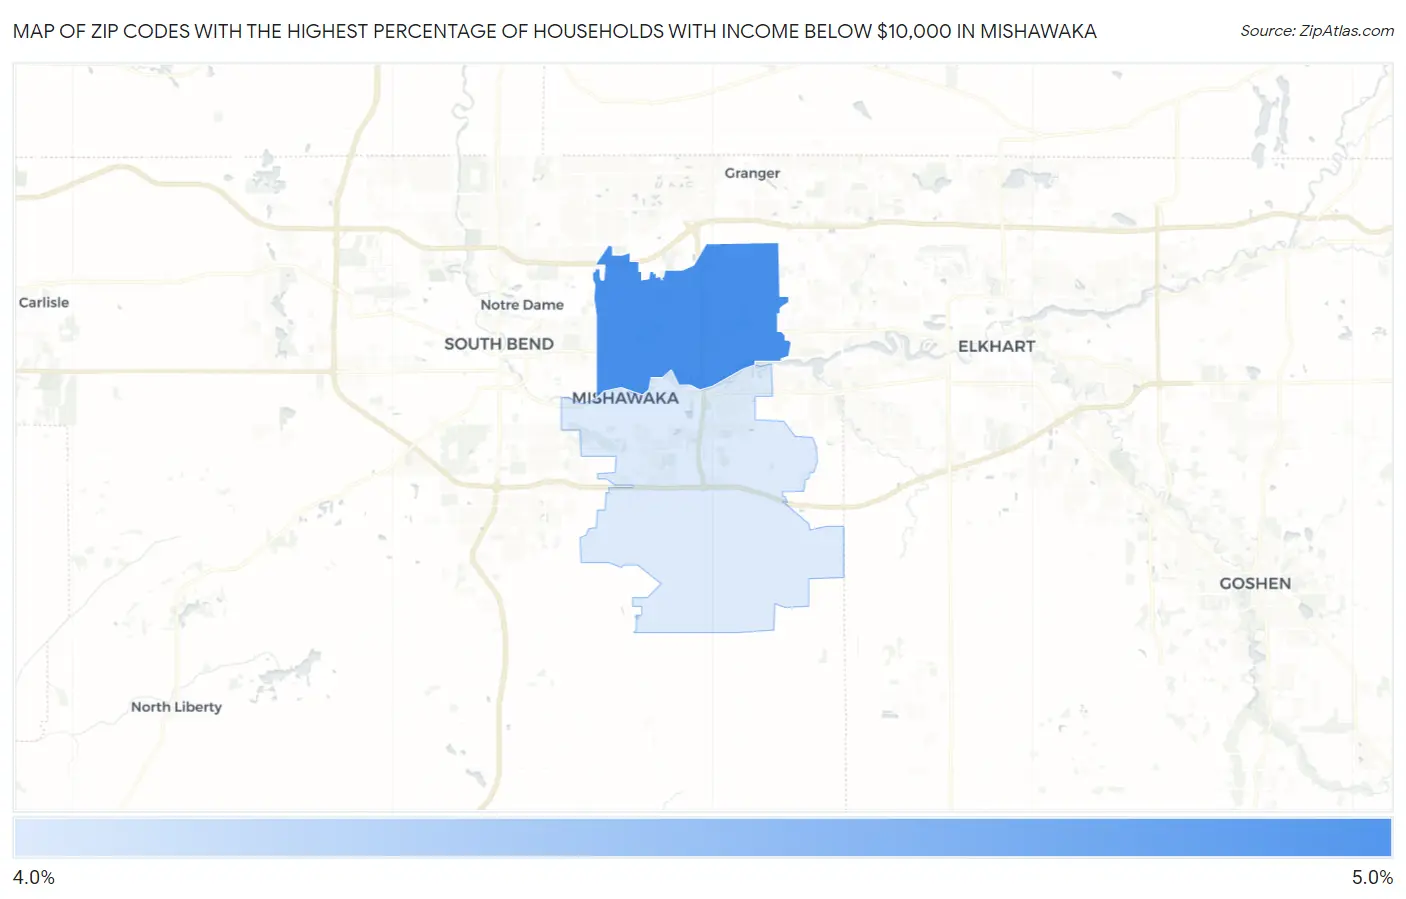
Map of Zip Codes with the Highest Percentage of Households with Income Below $10,000 in Mishawaka
4.3%
4.6%
Zip Codes with the Highest Percentage of Households with Income Below $10,000 in Mishawaka, IN
| Zip Code | Households with Income < $10k | vs State | vs National | |
| 1. | 46545 | 4.6% | 5.0%(-0.400)#275 | 4.9%(-0.300)#13,036 |
| 2. | 46544 | 4.3% | 5.0%(-0.700)#305 | 4.9%(-0.600)#14,077 |
1
Common Questions
What are the Top Zip Codes with the Highest Percentage of Households with Income Below $10,000 in Mishawaka, IN?
Top Zip Codes with the Highest Percentage of Households with Income Below $10,000 in Mishawaka, IN are:
What zip code has the Highest Percentage of Households with Income Below $10,000 in Mishawaka, IN?
46545 has the Highest Percentage of Households with Income Below $10,000 in Mishawaka, IN with 4.6%.
What is the Percentage of Households with Income Below $10,000 in Mishawaka, IN?
Percentage of Households with Income Below $10,000 in Mishawaka is 4.5%.
What is the Percentage of Households with Income Below $10,000 in Indiana?
Percentage of Households with Income Below $10,000 in Indiana is 5.0%.
What is the Percentage of Households with Income Below $10,000 in the United States?
Percentage of Households with Income Below $10,000 in the United States is 4.9%.