Zip Codes with the Highest Percentage of Households with Income Above $200,000 in Mishawaka, IN
RELATED REPORTS & OPTIONS
Household Income | $200k+
Mishawaka
Compare Zip Codes
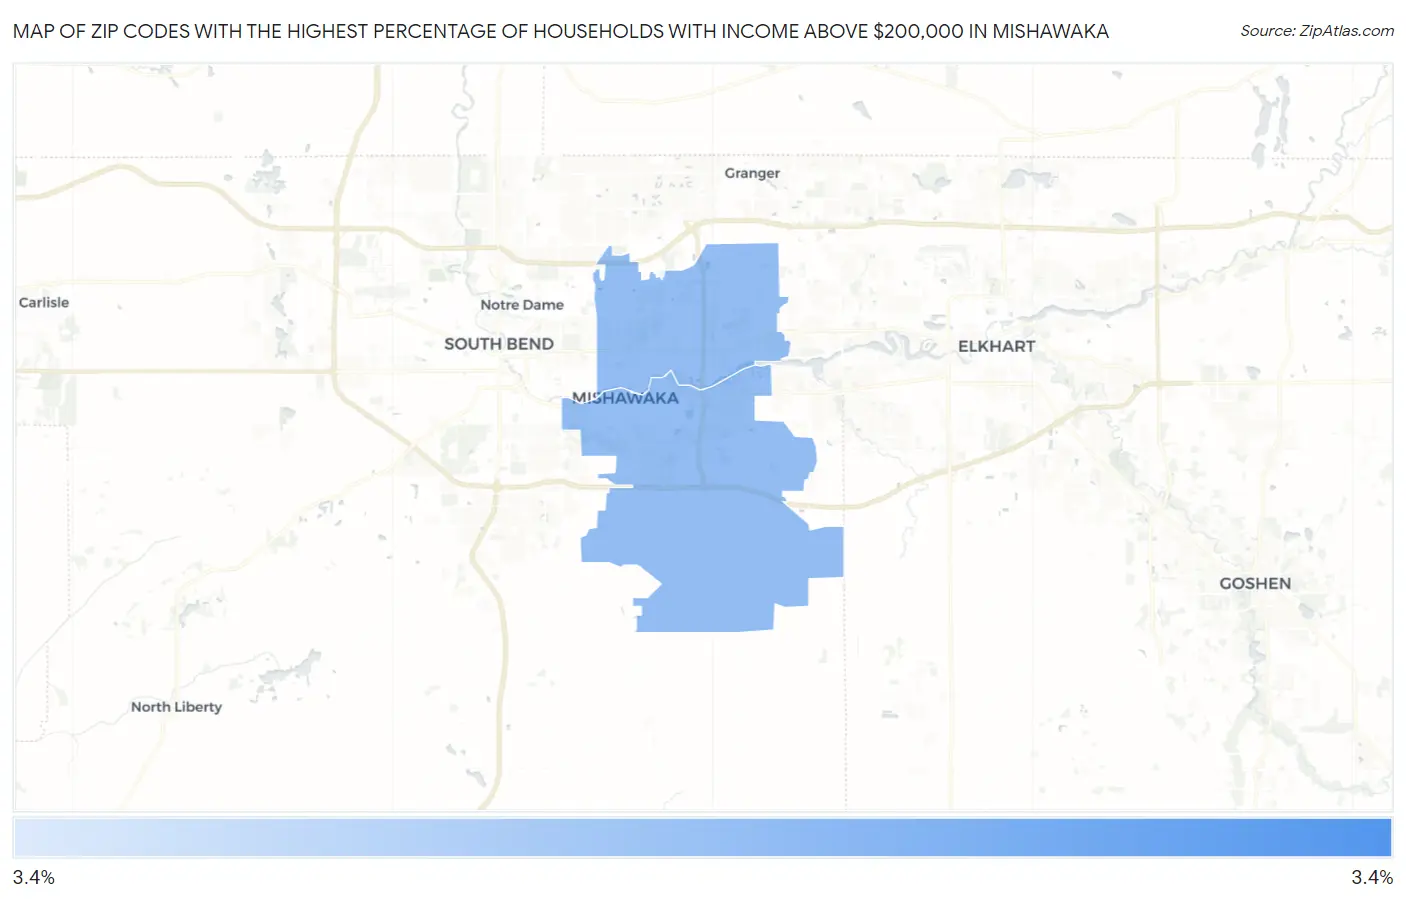
Map of Zip Codes with the Highest Percentage of Households with Income Above $200,000 in Mishawaka
3.4%
3.4%
Zip Codes with the Highest Percentage of Households with Income Above $200,000 in Mishawaka, IN
| Zip Code | Households with Income > $200k | vs State | vs National | |
| 1. | 46544 | 3.4% | 6.7%(-3.30)#389 | 11.4%(-8.00)#19,696 |
| 2. | 46545 | 3.4% | 6.7%(-3.30)#390 | 11.4%(-8.00)#19,704 |
1
Common Questions
What are the Top Zip Codes with the Highest Percentage of Households with Income Above $200,000 in Mishawaka, IN?
Top Zip Codes with the Highest Percentage of Households with Income Above $200,000 in Mishawaka, IN are:
What zip code has the Highest Percentage of Households with Income Above $200,000 in Mishawaka, IN?
46544 has the Highest Percentage of Households with Income Above $200,000 in Mishawaka, IN with 3.4%.
What is the Percentage of Households with Income Above $200,000 in Mishawaka, IN?
Percentage of Households with Income Above $200,000 in Mishawaka is 3.3%.
What is the Percentage of Households with Income Above $200,000 in Indiana?
Percentage of Households with Income Above $200,000 in Indiana is 6.7%.
What is the Percentage of Households with Income Above $200,000 in the United States?
Percentage of Households with Income Above $200,000 in the United States is 11.4%.