Zip Codes with the Highest Percentage of Population with a Degree in Education in Mishawaka, IN
RELATED REPORTS & OPTIONS
Education
Mishawaka
Compare Zip Codes
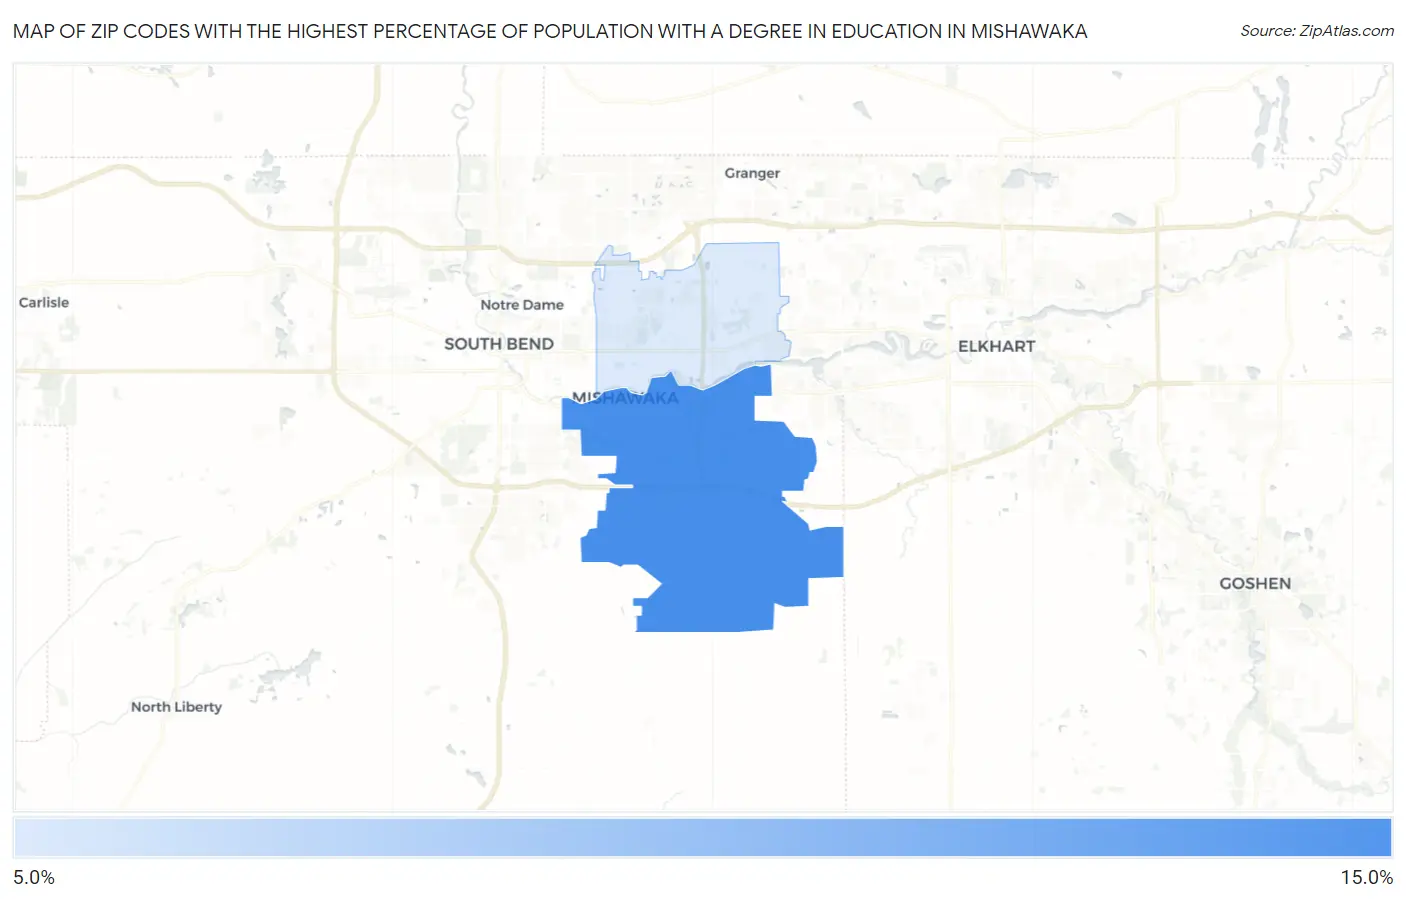
Map of Zip Codes with the Highest Percentage of Population with a Degree in Education in Mishawaka
12.3%
12.5%
Zip Codes with the Highest Percentage of Population with a Degree in Education in Mishawaka, IN
| Zip Code | % Graduates | vs State | vs National | |
| 1. | 46544 | 12.5% | 14.8%(-2.27)#515 | 11.1%(+1.42)#18,961 |
| 2. | 46545 | 12.3% | 14.8%(-2.50)#520 | 11.1%(+1.20)#19,258 |
1
Common Questions
What are the Top Zip Codes with the Highest Percentage of Population with a Degree in Education in Mishawaka, IN?
Top Zip Codes with the Highest Percentage of Population with a Degree in Education in Mishawaka, IN are:
What zip code has the Highest Percentage of Population with a Degree in Education in Mishawaka, IN?
46544 has the Highest Percentage of Population with a Degree in Education in Mishawaka, IN with 12.5%.
What is the Percentage of Population with a Degree in Education in Mishawaka, IN?
Percentage of Population with a Degree in Education in Mishawaka is 11.8%.
What is the Percentage of Population with a Degree in Education in Indiana?
Percentage of Population with a Degree in Education in Indiana is 14.8%.
What is the Percentage of Population with a Degree in Education in the United States?
Percentage of Population with a Degree in Education in the United States is 11.1%.