Zip Codes with the Highest Percentage of Households with Income Below $10,000 in Indianapolis, IN

RELATED REPORTS & OPTIONS

Household Income | $0-10k
Population
Families and Households
Female Fertility
Female Fertility (Unmarried)
Race (Community Size)
Race (Percentage)
Ancestry (Community Size)
AfghanAfricanAlaskan AthabascanAlbanianAlsatianAmericanApacheArabArgentineanArmenianAustralianAustrianBahamianBangladeshiBarbadianBasqueBelgianBelizeanBhutaneseBlackfeetBolivianBrazilianBritishBritish West IndianBulgarianBurmeseCajunCanadianCelticCentral AmericanCentral American IndianCherokeeChickasawChileanChippewaChoctawColombianCosta RicanCroatianCrowCubanCzechCzechoslovakianDanishDominicanDutchEastern EuropeanEcuadorianEgyptianEnglishEstonianEthiopianEuropeanFilipinoFinnishFrenchFrench CanadianGermanGerman RussianGhanaianGreekGuamanian / ChamorroGuatemalanGuyaneseHaitianHonduranHopiHungarianIcelanderIndian (Asian)IndonesianInupiatIranianIraqiIrishIroquoisIsraeliItalianJamaicanJapaneseJordanianKenyanKoreanLaotianLatvianLebaneseLiberianLithuanianLuxembourgerMacedonianMalaysianMenomineeMexicanMexican American IndianMongolianMoroccanNative HawaiianNavajoNew ZealanderNicaraguanNigerianNorthern EuropeanNorwegianPakistaniPalestinianPanamanianPennsylvania GermanPeruvianPolishPortuguesePotawatomiPuerto RicanRomanianRussianSalvadoranSamoanScandinavianScotch-IrishScottishSeminoleSenegaleseSerbianSierra LeoneanSiouxSlavicSlovakSloveneSouth AfricanSouth AmericanSouth American IndianSpaniardSpanishSri LankanSubsaharan AfricanSudaneseSwedishSwissSyrianThaiTonganTrinidadian and TobagonianTurkishUgandanUkrainianUruguayanVenezuelanVietnameseWelshWest IndianYugoslavianZimbabwean
Ancestry (Percentage)
AfghanAfricanAlaskan AthabascanAlbanianAlsatianAmericanApacheArabArgentineanArmenianAustralianAustrianBahamianBangladeshiBarbadianBasqueBelgianBelizeanBhutaneseBlackfeetBolivianBrazilianBritishBritish West IndianBulgarianBurmeseCajunCanadianCelticCentral AmericanCentral American IndianCherokeeChickasawChileanChippewaChoctawColombianCosta RicanCroatianCrowCubanCzechCzechoslovakianDanishDominicanDutchEastern EuropeanEcuadorianEgyptianEnglishEstonianEthiopianEuropeanFilipinoFinnishFrenchFrench CanadianGermanGerman RussianGhanaianGreekGuamanian / ChamorroGuatemalanGuyaneseHaitianHonduranHopiHungarianIcelanderIndian (Asian)IndonesianInupiatIranianIraqiIrishIroquoisIsraeliItalianJamaicanJapaneseJordanianKenyanKoreanLaotianLatvianLebaneseLiberianLithuanianLuxembourgerMacedonianMalaysianMenomineeMexicanMexican American IndianMongolianMoroccanNative HawaiianNavajoNew ZealanderNicaraguanNigerianNorthern EuropeanNorwegianPakistaniPalestinianPanamanianPennsylvania GermanPeruvianPolishPortuguesePotawatomiPuerto RicanRomanianRussianSalvadoranSamoanScandinavianScotch-IrishScottishSeminoleSenegaleseSerbianSierra LeoneanSiouxSlavicSlovakSloveneSouth AfricanSouth AmericanSouth American IndianSpaniardSpanishSri LankanSubsaharan AfricanSudaneseSwedishSwissSyrianThaiTonganTrinidadian and TobagonianTurkishUgandanUkrainianUruguayanVenezuelanVietnameseWelshWest IndianYugoslavianZimbabwean
Immigrant Origin (Total)
AfghanistanAfricaArgentinaAsiaAustraliaAustriaBahamasBangladeshBarbadosBelarusBoliviaBosnia and HerzegovinaBrazilBulgariaBurma / MyanmarCambodiaCameroonCanadaCaribbeanCentral AmericaChileChinaColombiaCongoCosta RicaCubaDenmarkDominican RepublicEastern AfricaEastern AsiaEastern EuropeEcuadorEgyptEl SalvadorEnglandEritreaEthiopiaEuropeFranceGermanyGhanaGreeceGuatemalaGuyanaHaitiHondurasHong KongHungaryIndiaIndonesiaIranIraqIrelandIsraelItalyJamaicaJapanJordanKenyaKoreaLaosLatin AmericaLatviaLebanonLiberiaMalaysiaMexicoMiddle AfricaMoldovaMoroccoNepalNetherlandsNicaraguaNigeriaNorth MacedoniaNorthern AfricaNorthern EuropeNorwayOceaniaPakistanPanamaPeruPhilippinesPolandPortugalRomaniaRussiaSaudi ArabiaScotlandSenegalSerbiaSierra LeoneSingaporeSouth AfricaSouth AmericaSouth Central AsiaSouth Eastern AsiaSouthern EuropeSpainSt. Vincent and the GrenadinesSudanSyriaTaiwanThailandTrinidad and TobagoTurkeyUgandaUkraineUzbekistanVenezuelaVietnamWest IndiesWestern AfricaWestern AsiaWestern EuropeYemenZaireZimbabwe
Immigrant Origin (Percentage)
AfghanistanAfricaArgentinaAsiaAustraliaAustriaBahamasBangladeshBarbadosBelarusBoliviaBosnia and HerzegovinaBrazilBulgariaBurma / MyanmarCambodiaCameroonCanadaCaribbeanCentral AmericaChileChinaColombiaCongoCosta RicaCubaDenmarkDominican RepublicEastern AfricaEastern AsiaEastern EuropeEcuadorEgyptEl SalvadorEnglandEritreaEthiopiaEuropeFranceGermanyGhanaGreeceGuatemalaGuyanaHaitiHondurasHong KongHungaryIndiaIndonesiaIranIraqIrelandIsraelItalyJamaicaJapanJordanKenyaKoreaLaosLatin AmericaLatviaLebanonLiberiaMalaysiaMexicoMiddle AfricaMoldovaMoroccoNepalNetherlandsNicaraguaNigeriaNorth MacedoniaNorthern AfricaNorthern EuropeNorwayOceaniaPakistanPanamaPeruPhilippinesPolandPortugalRomaniaRussiaSaudi ArabiaScotlandSenegalSerbiaSierra LeoneSingaporeSouth AfricaSouth AmericaSouth Central AsiaSouth Eastern AsiaSouthern EuropeSpainSt. Vincent and the GrenadinesSudanSyriaTaiwanThailandTrinidad and TobagoTurkeyUgandaUkraineUzbekistanVenezuelaVietnamWest IndiesWestern AfricaWestern AsiaWestern EuropeYemenZaireZimbabwe
Income
Income (Families)
Income (Households)
Poverty
Poverty (Families)
Unemployment
Employment Occupations
Employment Industries
Employer Class
Commute Time
Commute Means
School Enrollment
Education by Degree Field
Occupancy
Finances
Physical Characteristics
Indianapolis
Compare Zip Codes
Comparison Subject

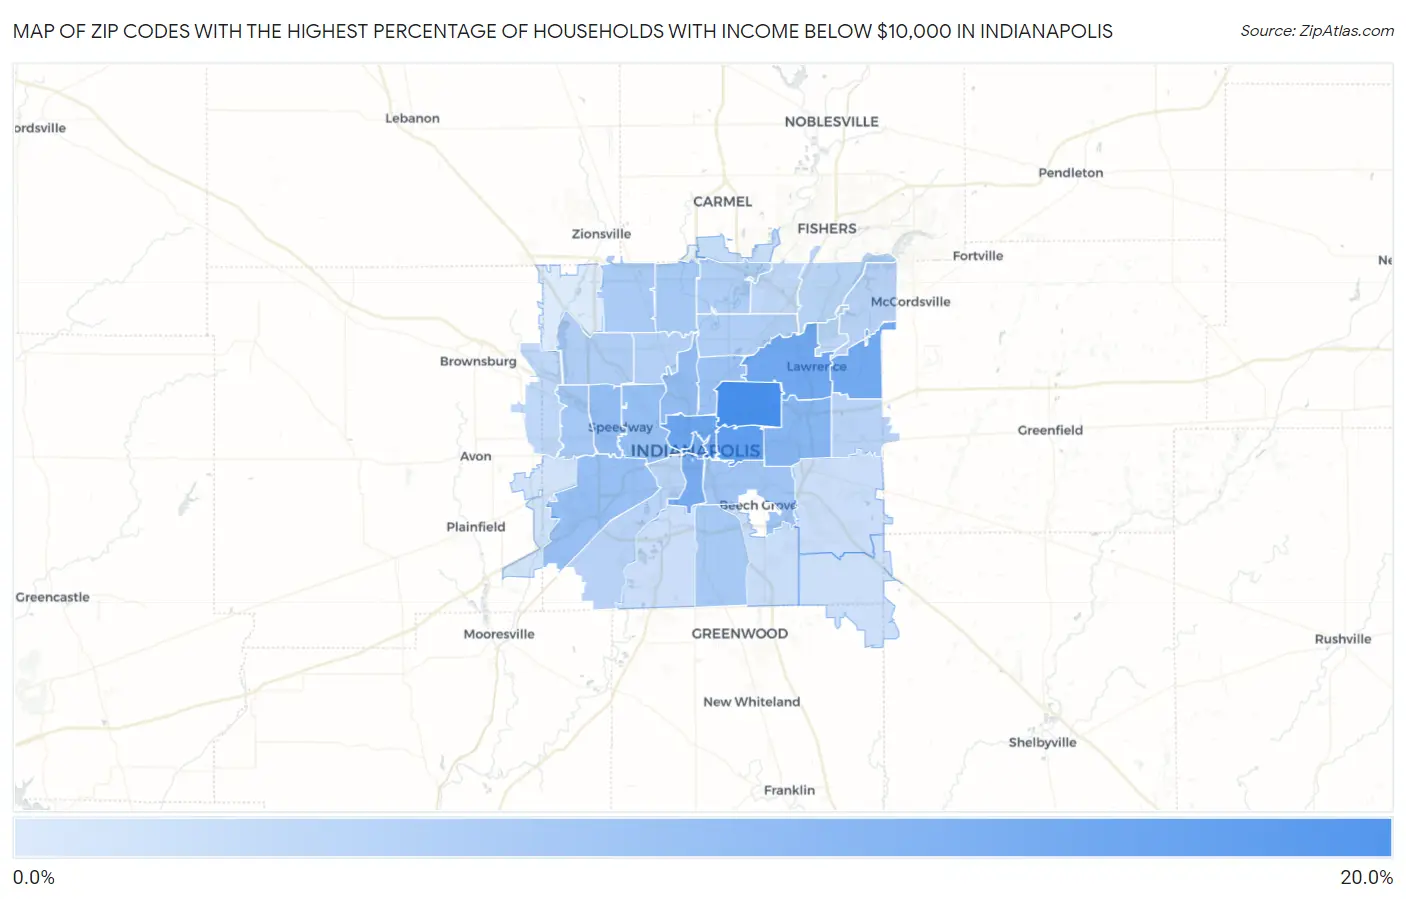
Map of Zip Codes with the Highest Percentage of Households with Income Below $10,000 in Indianapolis

0.0%
20.0%
Zip Codes with the Highest Percentage of Households with Income Below $10,000 in Indianapolis Map

Zip Codes with the Highest Percentage of Households with Income Below $10,000 in Indianapolis, IN

Zip Code Households with Income < $10k vs State vs National
1.4621816.4%5.0%(+11.4)#174.9%(+11.5)#1,255
2.4620113.5%5.0%(+8.50)#334.9%(+8.60)#1,905
3.4620212.2%5.0%(+7.20)#404.9%(+7.30)#2,372
4.4622611.8%5.0%(+6.80)#414.9%(+6.90)#2,538
5.4623511.6%5.0%(+6.60)#464.9%(+6.70)#2,622
6.4620411.1%5.0%(+6.10)#504.9%(+6.20)#2,894
7.4622510.7%5.0%(+5.70)#544.9%(+5.80)#3,134
8.462199.2%5.0%(+4.20)#724.9%(+4.30)#4,199
9.462248.0%5.0%(+3.00)#894.9%(+3.10)#5,547
10.462088.0%5.0%(+3.00)#904.9%(+3.10)#5,561
11.462227.9%5.0%(+2.90)#944.9%(+3.00)#5,672
12.462417.5%5.0%(+2.50)#1044.9%(+2.60)#6,199
13.462057.0%5.0%(+2.00)#1214.9%(+2.10)#6,958
14.462036.7%5.0%(+1.70)#1324.9%(+1.80)#7,529
15.462146.1%5.0%(+1.10)#1664.9%(+1.20)#8,769
16.462605.9%5.0%(+0.900)#1744.9%(+1.00)#9,215
17.462275.8%5.0%(+0.800)#1794.9%(+0.900)#9,437
18.462685.6%5.0%(+0.600)#1914.9%(+0.700)#9,986
19.462545.2%5.0%(+0.200)#2204.9%(+0.300)#11,047
20.462405.0%5.0%(=0.000)#2374.9%(+0.100)#11,722
21.462204.8%5.0%(-0.200)#2514.9%(-0.100)#12,296
22.462284.6%5.0%(-0.400)#2774.9%(-0.300)#13,070
23.462294.3%5.0%(-0.700)#3064.9%(-0.600)#14,085
24.462214.3%5.0%(-0.700)#3074.9%(-0.600)#14,094
25.462364.2%5.0%(-0.800)#3164.9%(-0.700)#14,504
26.462563.9%5.0%(-1.10)#3454.9%(-1.00)#15,669
27.462163.8%5.0%(-1.20)#3554.9%(-1.10)#16,233
28.462343.5%5.0%(-1.50)#3734.9%(-1.40)#17,258
29.462503.5%5.0%(-1.50)#3744.9%(-1.40)#17,309
30.462802.9%5.0%(-2.10)#4274.9%(-2.00)#19,985
31.462372.6%5.0%(-2.40)#4634.9%(-2.30)#21,074
32.462172.4%5.0%(-2.60)#4884.9%(-2.50)#22,003
33.462392.4%5.0%(-2.60)#4894.9%(-2.50)#22,017
34.462592.0%5.0%(-3.00)#5264.9%(-2.90)#23,675
35.462311.6%5.0%(-3.40)#5714.9%(-3.30)#25,143
36.462780.50%5.0%(-4.50)#6534.9%(-4.40)#27,860

Common Questions

What are the Top 10 Zip Codes with the Highest Percentage of Households with Income Below $10,000 in Indianapolis, IN?
Top 10 Zip Codes with the Highest Percentage of Households with Income Below $10,000 in Indianapolis, IN are:
#1
16.4%
#2
13.5%
#3
12.2%
#4
11.8%
#5
11.6%
#6
11.1%
#7
10.7%
#8
9.2%
#9
8.0%
#10
8.0%
What zip code has the Highest Percentage of Households with Income Below $10,000 in Indianapolis, IN?
46218 has the Highest Percentage of Households with Income Below $10,000 in Indianapolis, IN with 16.4%.
What is the Percentage of Households with Income Below $10,000 in Indianapolis, IN?
Percentage of Households with Income Below $10,000 in Indianapolis is 6.9%.
What is the Percentage of Households with Income Below $10,000 in Indiana?
Percentage of Households with Income Below $10,000 in Indiana is 5.0%.
What is the Percentage of Households with Income Below $10,000 in the United States?
Percentage of Households with Income Below $10,000 in the United States is 4.9%.