Zip Codes with the Highest Percentage of Population Employed in Architecture & Engineering in Mishawaka, IN
RELATED REPORTS & OPTIONS
Architecture & Engineering
Mishawaka
Compare Zip Codes
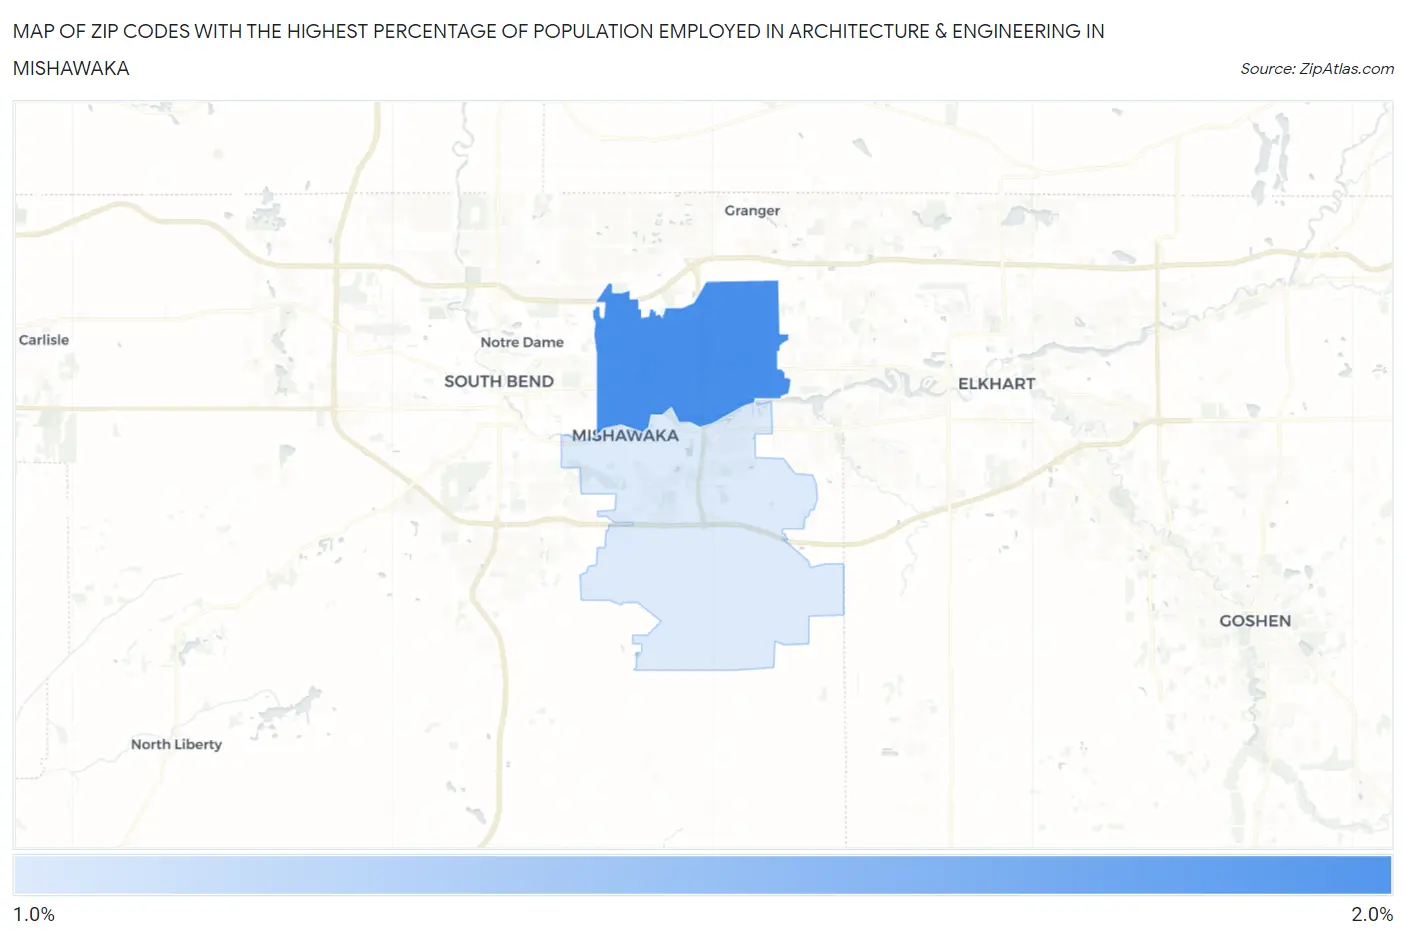
Map of Zip Codes with the Highest Percentage of Population Employed in Architecture & Engineering in Mishawaka
1.2%
1.7%
Zip Codes with the Highest Percentage of Population Employed in Architecture & Engineering in Mishawaka, IN
| Zip Code | % Employed | vs State | vs National | |
| 1. | 46545 | 1.7% | 2.2%(-0.523)#340 | 2.1%(-0.450)#11,496 |
| 2. | 46544 | 1.2% | 2.2%(-1.00)#426 | 2.1%(-0.929)#14,926 |
1
Common Questions
What are the Top Zip Codes with the Highest Percentage of Population Employed in Architecture & Engineering in Mishawaka, IN?
Top Zip Codes with the Highest Percentage of Population Employed in Architecture & Engineering in Mishawaka, IN are:
What zip code has the Highest Percentage of Population Employed in Architecture & Engineering in Mishawaka, IN?
46545 has the Highest Percentage of Population Employed in Architecture & Engineering in Mishawaka, IN with 1.7%.
What is the Percentage of Population Employed in Architecture & Engineering in Mishawaka, IN?
Percentage of Population Employed in Architecture & Engineering in Mishawaka is 1.9%.
What is the Percentage of Population Employed in Architecture & Engineering in Indiana?
Percentage of Population Employed in Architecture & Engineering in Indiana is 2.2%.
What is the Percentage of Population Employed in Architecture & Engineering in the United States?
Percentage of Population Employed in Architecture & Engineering in the United States is 2.1%.