Zip Codes with the Highest Percentage of Population Employed in Health Diagnosing & Treating in Mishawaka, IN
RELATED REPORTS & OPTIONS
Health Diagnosing & Treating
Mishawaka
Compare Zip Codes
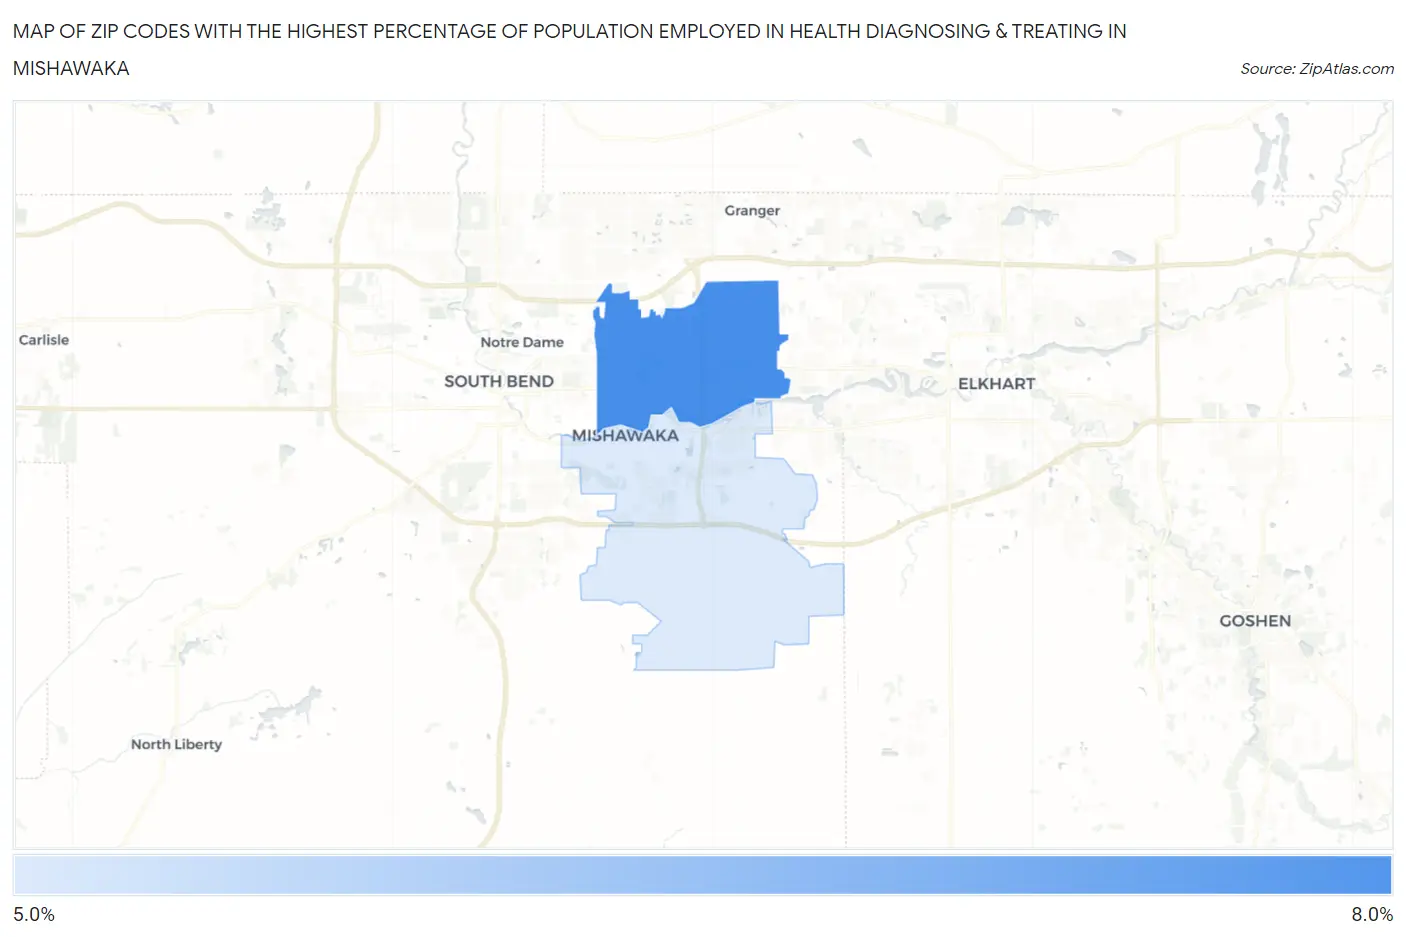
Map of Zip Codes with the Highest Percentage of Population Employed in Health Diagnosing & Treating in Mishawaka
5.8%
6.5%
Zip Codes with the Highest Percentage of Population Employed in Health Diagnosing & Treating in Mishawaka, IN
| Zip Code | % Employed | vs State | vs National | |
| 1. | 46545 | 6.5% | 6.6%(-0.045)#288 | 6.2%(+0.261)#12,004 |
| 2. | 46544 | 5.8% | 6.6%(-0.728)#343 | 6.2%(-0.422)#14,511 |
1
Common Questions
What are the Top Zip Codes with the Highest Percentage of Population Employed in Health Diagnosing & Treating in Mishawaka, IN?
Top Zip Codes with the Highest Percentage of Population Employed in Health Diagnosing & Treating in Mishawaka, IN are:
What zip code has the Highest Percentage of Population Employed in Health Diagnosing & Treating in Mishawaka, IN?
46545 has the Highest Percentage of Population Employed in Health Diagnosing & Treating in Mishawaka, IN with 6.5%.
What is the Percentage of Population Employed in Health Diagnosing & Treating in Mishawaka, IN?
Percentage of Population Employed in Health Diagnosing & Treating in Mishawaka is 6.7%.
What is the Percentage of Population Employed in Health Diagnosing & Treating in Indiana?
Percentage of Population Employed in Health Diagnosing & Treating in Indiana is 6.6%.
What is the Percentage of Population Employed in Health Diagnosing & Treating in the United States?
Percentage of Population Employed in Health Diagnosing & Treating in the United States is 6.2%.