Zip Codes with the Highest Percentage of Population Employed in Legal Services & Support in Mishawaka, IN
RELATED REPORTS & OPTIONS
Legal Services & Support
Mishawaka
Compare Zip Codes
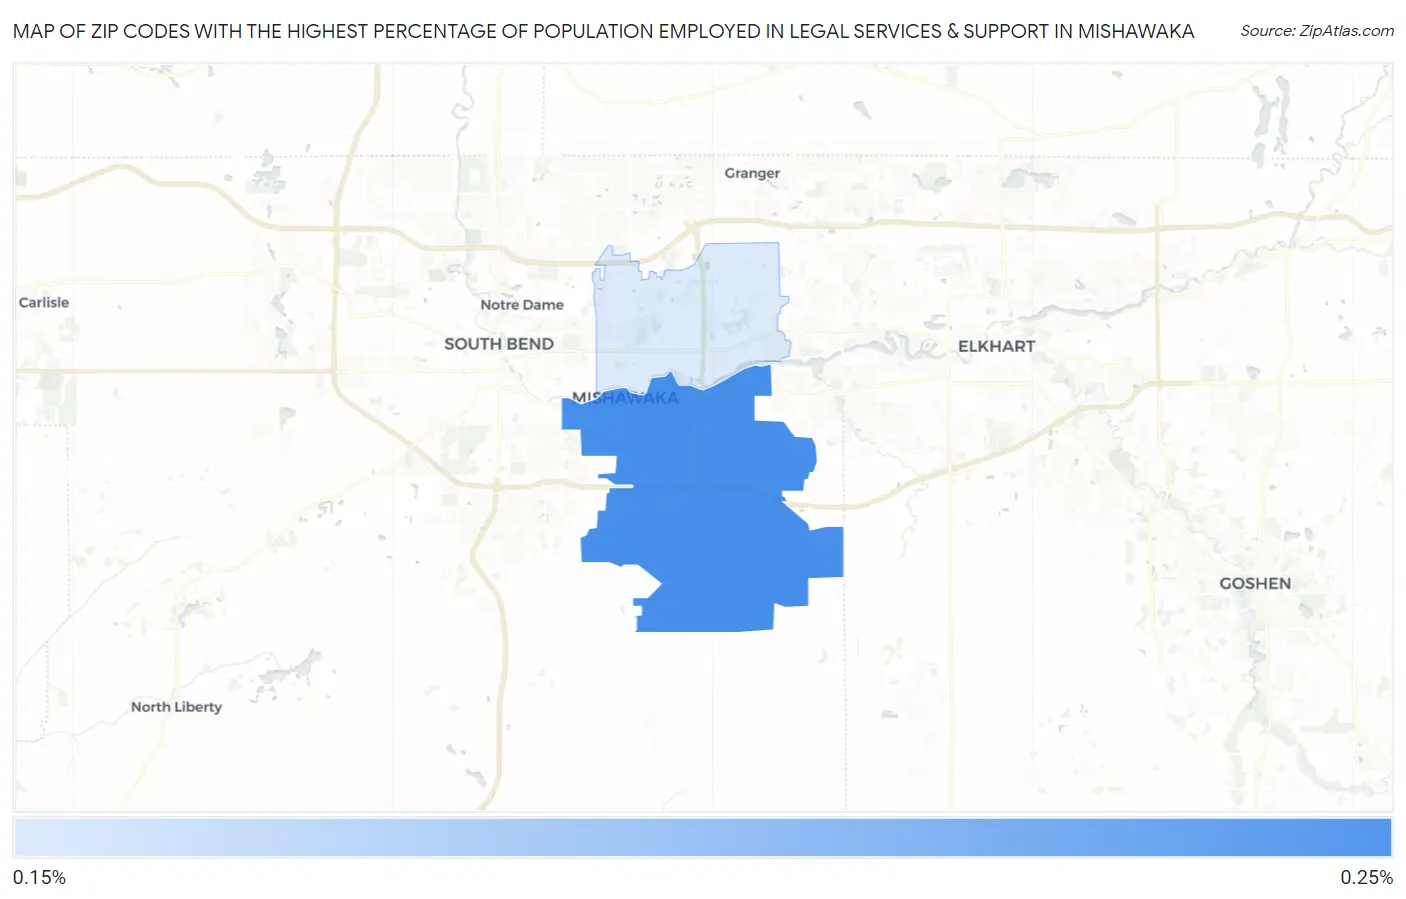
Map of Zip Codes with the Highest Percentage of Population Employed in Legal Services & Support in Mishawaka
0.21%
0.24%
Zip Codes with the Highest Percentage of Population Employed in Legal Services & Support in Mishawaka, IN
| Zip Code | % Employed | vs State | vs National | |
| 1. | 46544 | 0.24% | 0.76%(-0.520)#305 | 1.2%(-0.941)#15,719 |
| 2. | 46545 | 0.21% | 0.76%(-0.552)#323 | 1.2%(-0.973)#16,086 |
1
Common Questions
What are the Top Zip Codes with the Highest Percentage of Population Employed in Legal Services & Support in Mishawaka, IN?
Top Zip Codes with the Highest Percentage of Population Employed in Legal Services & Support in Mishawaka, IN are:
What zip code has the Highest Percentage of Population Employed in Legal Services & Support in Mishawaka, IN?
46544 has the Highest Percentage of Population Employed in Legal Services & Support in Mishawaka, IN with 0.24%.
What is the Percentage of Population Employed in Legal Services & Support in Mishawaka, IN?
Percentage of Population Employed in Legal Services & Support in Mishawaka is 0.18%.
What is the Percentage of Population Employed in Legal Services & Support in Indiana?
Percentage of Population Employed in Legal Services & Support in Indiana is 0.76%.
What is the Percentage of Population Employed in Legal Services & Support in the United States?
Percentage of Population Employed in Legal Services & Support in the United States is 1.2%.