Zip Codes with the Highest Percentage of Households with Income Below $10,000 in Hammond, IN
RELATED REPORTS & OPTIONS
Household Income | $0-10k
Hammond
Compare Zip Codes
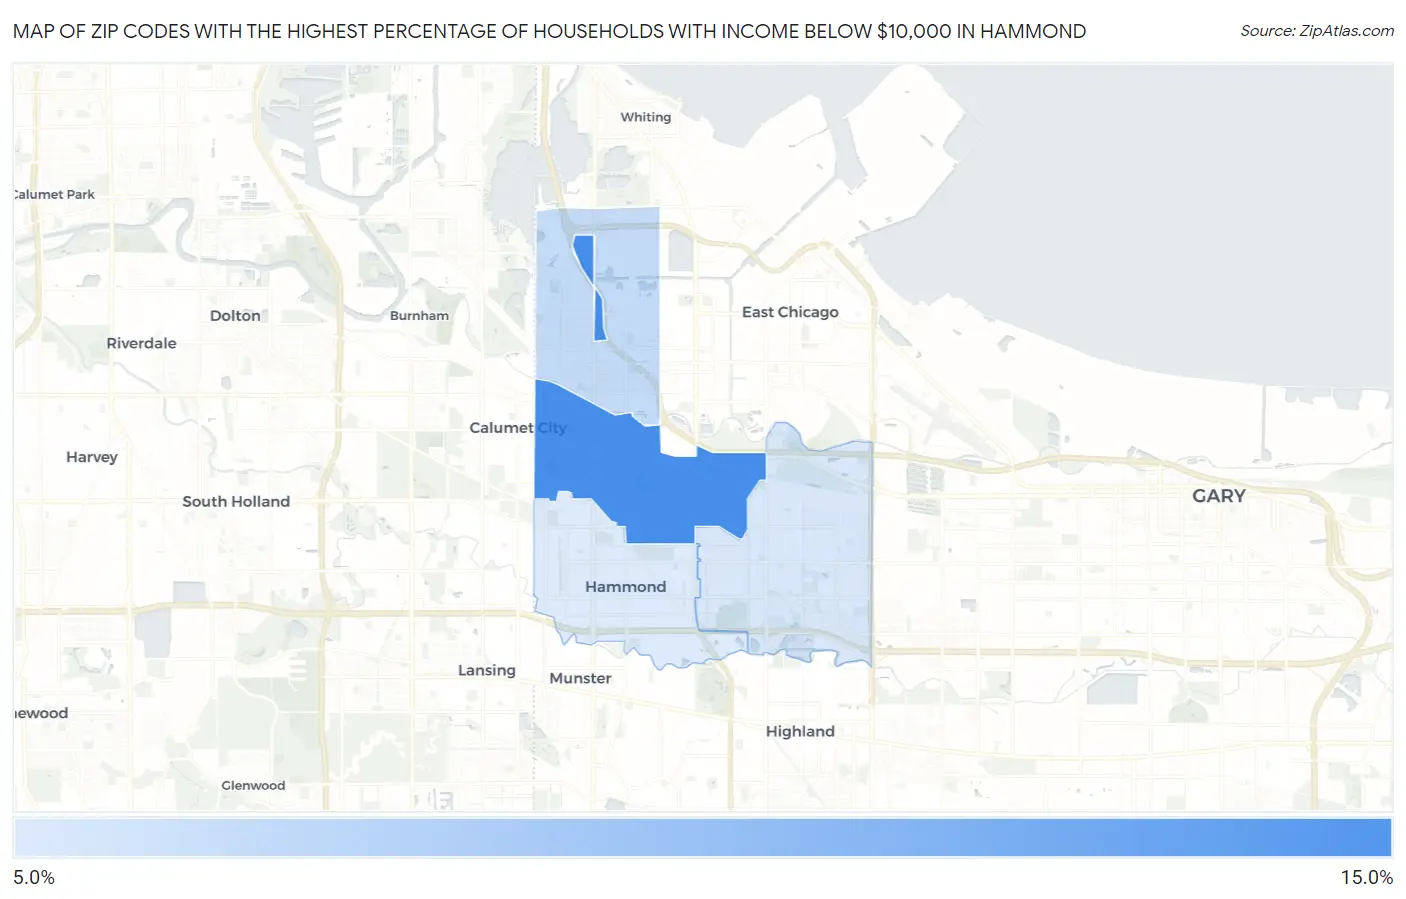
Map of Zip Codes with the Highest Percentage of Households with Income Below $10,000 in Hammond
6.8%
13.3%
Zip Codes with the Highest Percentage of Households with Income Below $10,000 in Hammond, IN
| Zip Code | Households with Income < $10k | vs State | vs National | |
| 1. | 46320 | 13.3% | 5.0%(+8.30)#35 | 4.9%(+8.40)#1,980 |
| 2. | 46327 | 7.9% | 5.0%(+2.90)#96 | 4.9%(+3.00)#5,705 |
| 3. | 46323 | 7.0% | 5.0%(+2.00)#122 | 4.9%(+2.10)#6,965 |
| 4. | 46324 | 6.8% | 5.0%(+1.80)#131 | 4.9%(+1.90)#7,344 |
1
Common Questions
What are the Top 3 Zip Codes with the Highest Percentage of Households with Income Below $10,000 in Hammond, IN?
Top 3 Zip Codes with the Highest Percentage of Households with Income Below $10,000 in Hammond, IN are:
What zip code has the Highest Percentage of Households with Income Below $10,000 in Hammond, IN?
46320 has the Highest Percentage of Households with Income Below $10,000 in Hammond, IN with 13.3%.
What is the Percentage of Households with Income Below $10,000 in Hammond, IN?
Percentage of Households with Income Below $10,000 in Hammond is 8.4%.
What is the Percentage of Households with Income Below $10,000 in Indiana?
Percentage of Households with Income Below $10,000 in Indiana is 5.0%.
What is the Percentage of Households with Income Below $10,000 in the United States?
Percentage of Households with Income Below $10,000 in the United States is 4.9%.