Zip Codes with the Highest Percentage of Population Employed in Food Preparation & Serving in Mishawaka, IN
RELATED REPORTS & OPTIONS
Food Preparation & Serving
Mishawaka
Compare Zip Codes
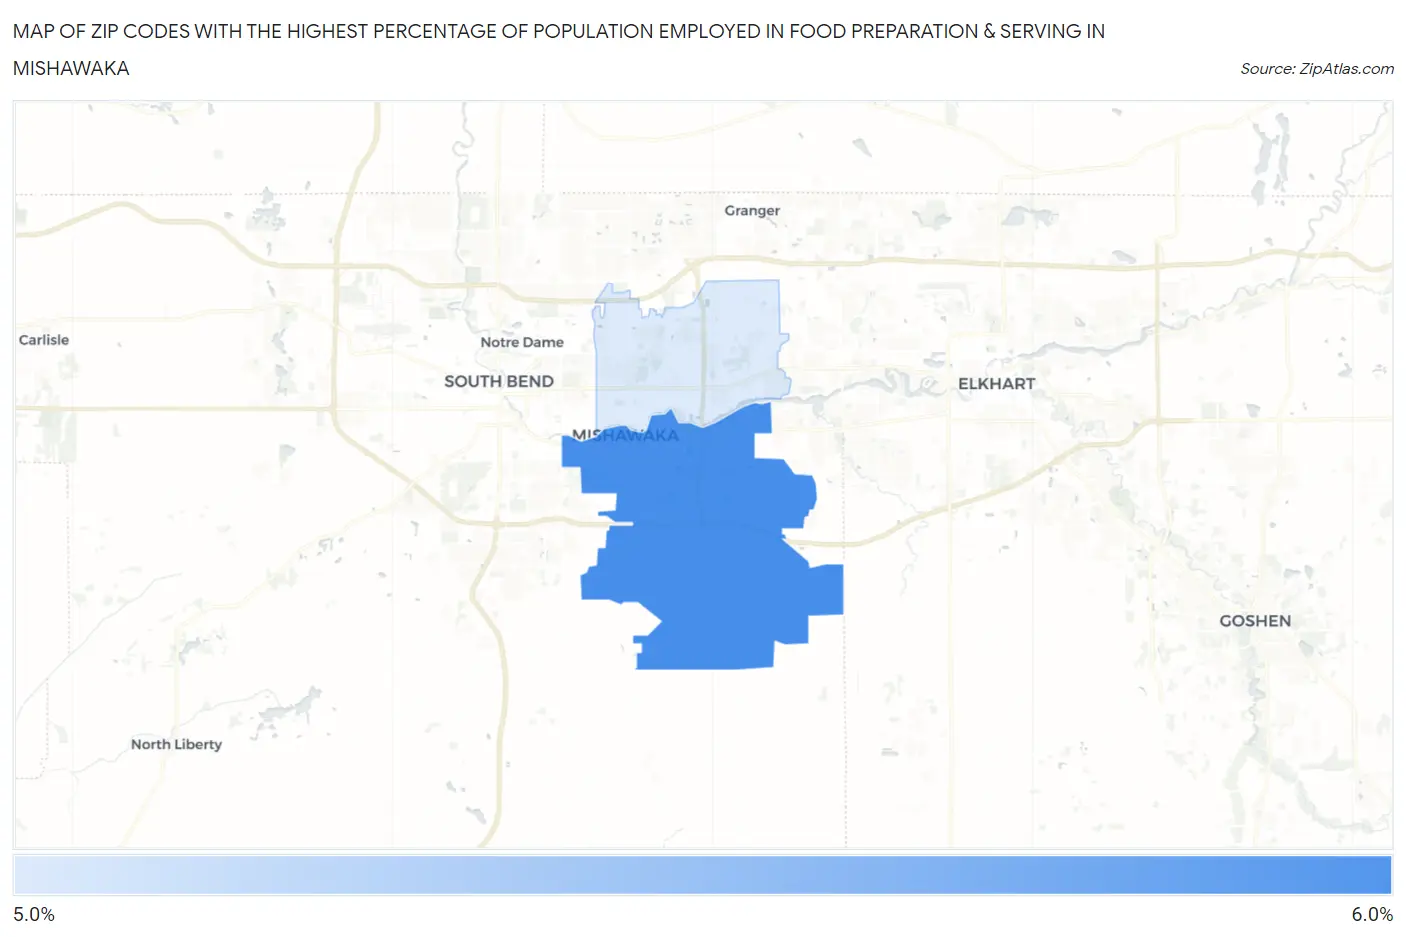
Map of Zip Codes with the Highest Percentage of Population Employed in Food Preparation & Serving in Mishawaka
5.5%
5.6%
Zip Codes with the Highest Percentage of Population Employed in Food Preparation & Serving in Mishawaka, IN
| Zip Code | % Employed | vs State | vs National | |
| 1. | 46544 | 5.6% | 5.3%(+0.266)#272 | 5.3%(+0.294)#10,770 |
| 2. | 46545 | 5.5% | 5.3%(+0.139)#282 | 5.3%(+0.167)#11,212 |
1
Common Questions
What are the Top Zip Codes with the Highest Percentage of Population Employed in Food Preparation & Serving in Mishawaka, IN?
Top Zip Codes with the Highest Percentage of Population Employed in Food Preparation & Serving in Mishawaka, IN are:
What zip code has the Highest Percentage of Population Employed in Food Preparation & Serving in Mishawaka, IN?
46544 has the Highest Percentage of Population Employed in Food Preparation & Serving in Mishawaka, IN with 5.6%.
What is the Percentage of Population Employed in Food Preparation & Serving in Mishawaka, IN?
Percentage of Population Employed in Food Preparation & Serving in Mishawaka is 5.8%.
What is the Percentage of Population Employed in Food Preparation & Serving in Indiana?
Percentage of Population Employed in Food Preparation & Serving in Indiana is 5.3%.
What is the Percentage of Population Employed in Food Preparation & Serving in the United States?
Percentage of Population Employed in Food Preparation & Serving in the United States is 5.3%.