Zip Codes with the Highest Percentage of Population Employed in Community & Social Service in Mishawaka, IN
RELATED REPORTS & OPTIONS
Community & Social Service
Mishawaka
Compare Zip Codes
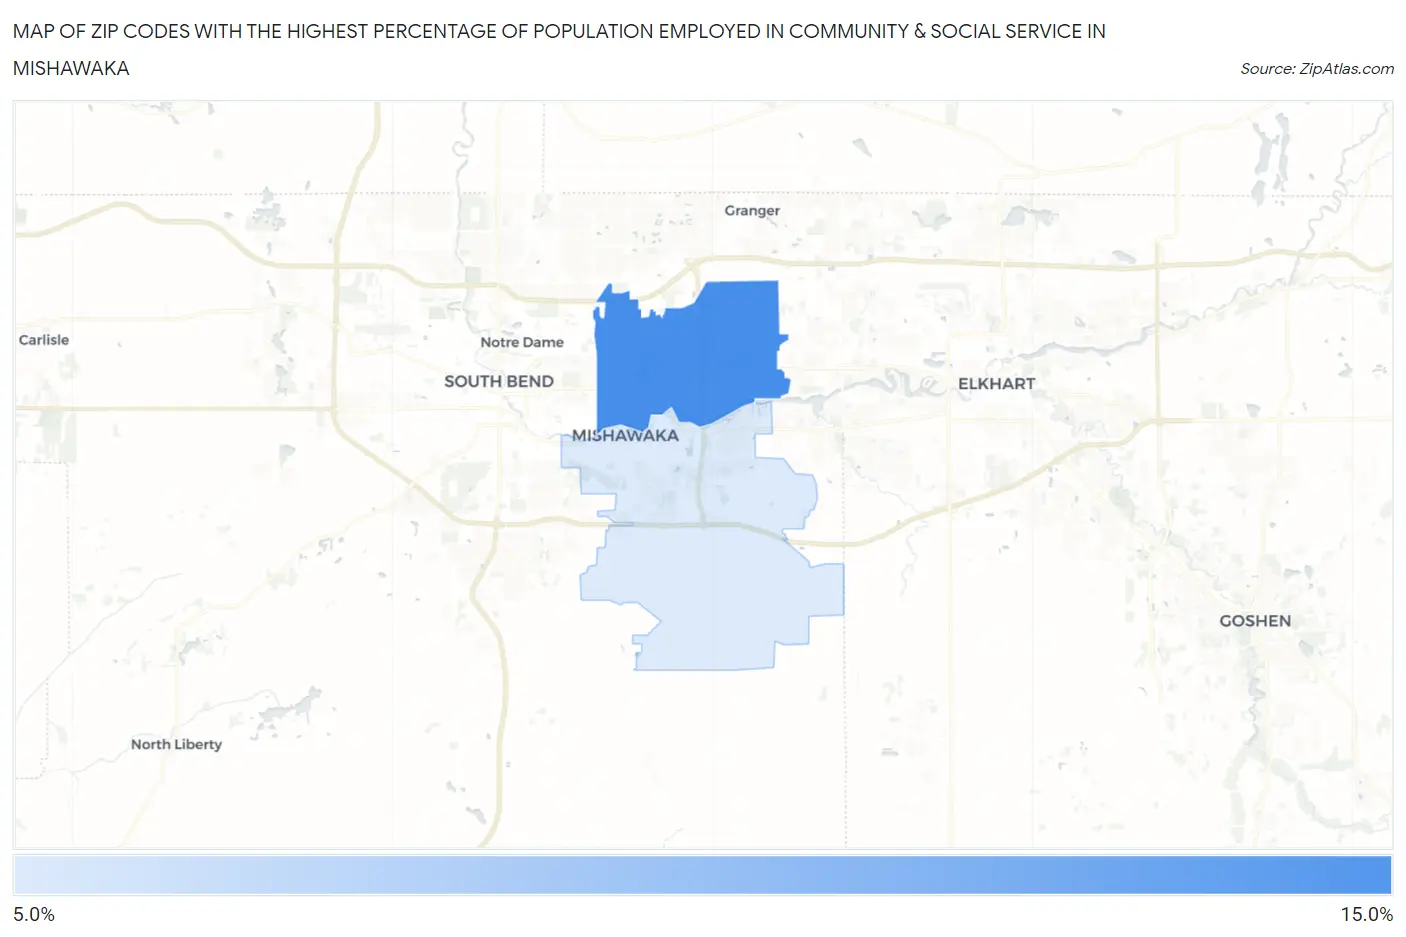
Map of Zip Codes with the Highest Percentage of Population Employed in Community & Social Service in Mishawaka
8.9%
12.4%
Zip Codes with the Highest Percentage of Population Employed in Community & Social Service in Mishawaka, IN
| Zip Code | % Employed | vs State | vs National | |
| 1. | 46545 | 12.4% | 9.7%(+2.69)#106 | 11.2%(+1.20)#8,567 |
| 2. | 46544 | 8.9% | 9.7%(-0.870)#283 | 11.2%(-2.36)#17,211 |
1
Common Questions
What are the Top Zip Codes with the Highest Percentage of Population Employed in Community & Social Service in Mishawaka, IN?
Top Zip Codes with the Highest Percentage of Population Employed in Community & Social Service in Mishawaka, IN are:
What zip code has the Highest Percentage of Population Employed in Community & Social Service in Mishawaka, IN?
46545 has the Highest Percentage of Population Employed in Community & Social Service in Mishawaka, IN with 12.4%.
What is the Percentage of Population Employed in Community & Social Service in Mishawaka, IN?
Percentage of Population Employed in Community & Social Service in Mishawaka is 10.2%.
What is the Percentage of Population Employed in Community & Social Service in Indiana?
Percentage of Population Employed in Community & Social Service in Indiana is 9.7%.
What is the Percentage of Population Employed in Community & Social Service in the United States?
Percentage of Population Employed in Community & Social Service in the United States is 11.2%.