Zip Codes with the Highest Percentage of Population Employed in Administrative & Support Services in Mishawaka, IN
RELATED REPORTS & OPTIONS
Administrative & Support Services
Mishawaka
Compare Zip Codes
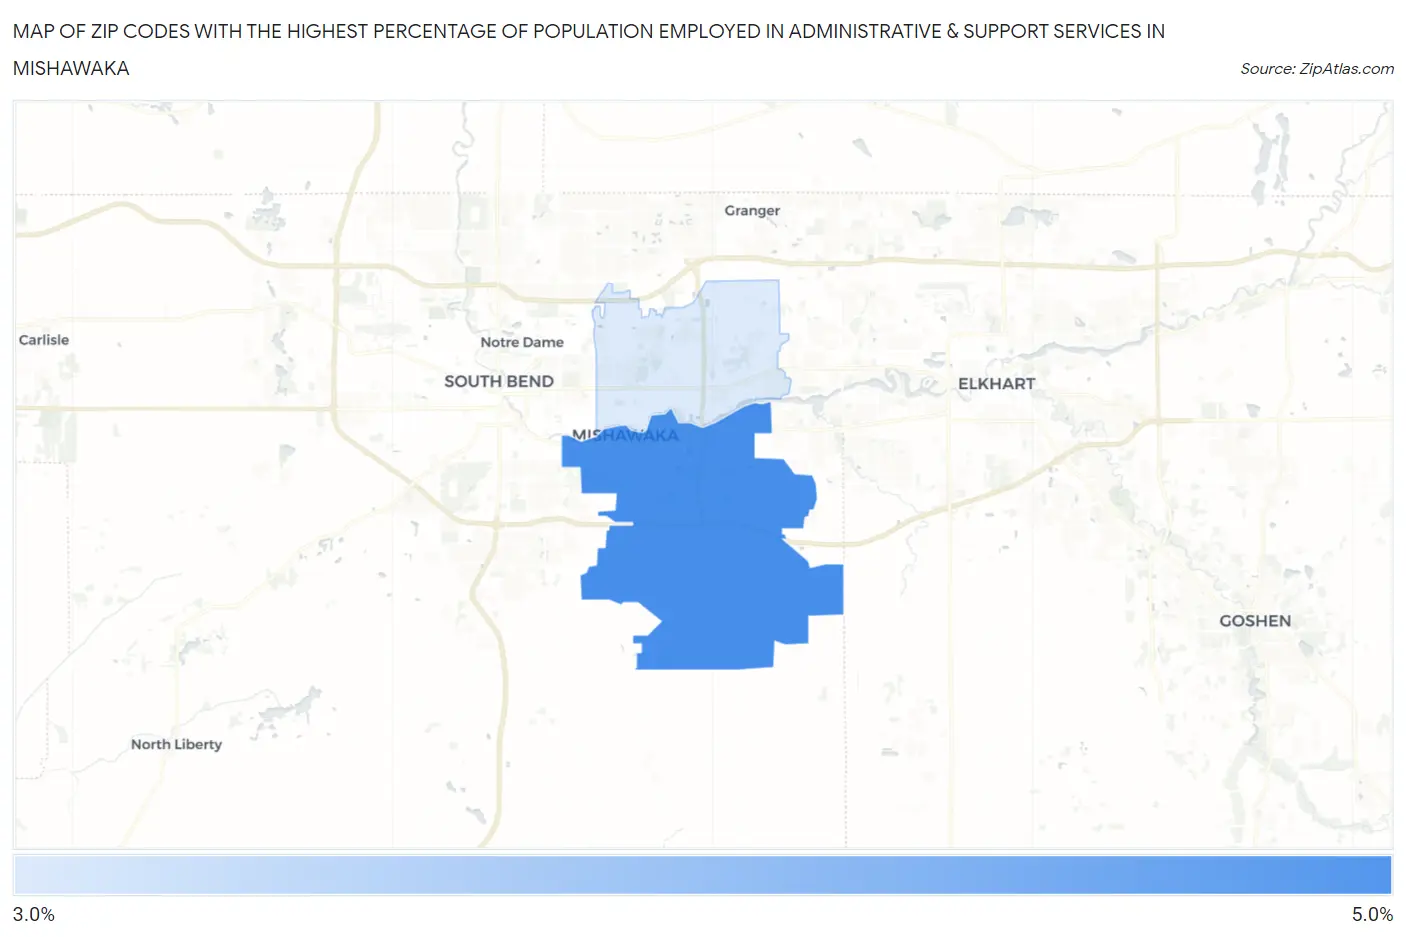
Map of Zip Codes with the Highest Percentage of Population Employed in Administrative & Support Services in Mishawaka
3.3%
4.4%
Zip Codes with the Highest Percentage of Population Employed in Administrative & Support Services in Mishawaka, IN
| Zip Code | % Employed | vs State | vs National | |
| 1. | 46544 | 4.4% | 3.5%(+0.885)#199 | 4.1%(+0.264)#9,018 |
| 2. | 46545 | 3.3% | 3.5%(-0.247)#317 | 4.1%(-0.868)#14,040 |
1
Common Questions
What are the Top Zip Codes with the Highest Percentage of Population Employed in Administrative & Support Services in Mishawaka, IN?
Top Zip Codes with the Highest Percentage of Population Employed in Administrative & Support Services in Mishawaka, IN are:
What zip code has the Highest Percentage of Population Employed in Administrative & Support Services in Mishawaka, IN?
46544 has the Highest Percentage of Population Employed in Administrative & Support Services in Mishawaka, IN with 4.4%.
What is the Percentage of Population Employed in Administrative & Support Services in Mishawaka, IN?
Percentage of Population Employed in Administrative & Support Services in Mishawaka is 4.0%.
What is the Percentage of Population Employed in Administrative & Support Services in Indiana?
Percentage of Population Employed in Administrative & Support Services in Indiana is 3.5%.
What is the Percentage of Population Employed in Administrative & Support Services in the United States?
Percentage of Population Employed in Administrative & Support Services in the United States is 4.1%.