Zip Codes with the Highest Percentage of Population Employed in Education, Arts & Media in Mishawaka, IN
RELATED REPORTS & OPTIONS
Education, Arts & Media
Mishawaka
Compare Zip Codes
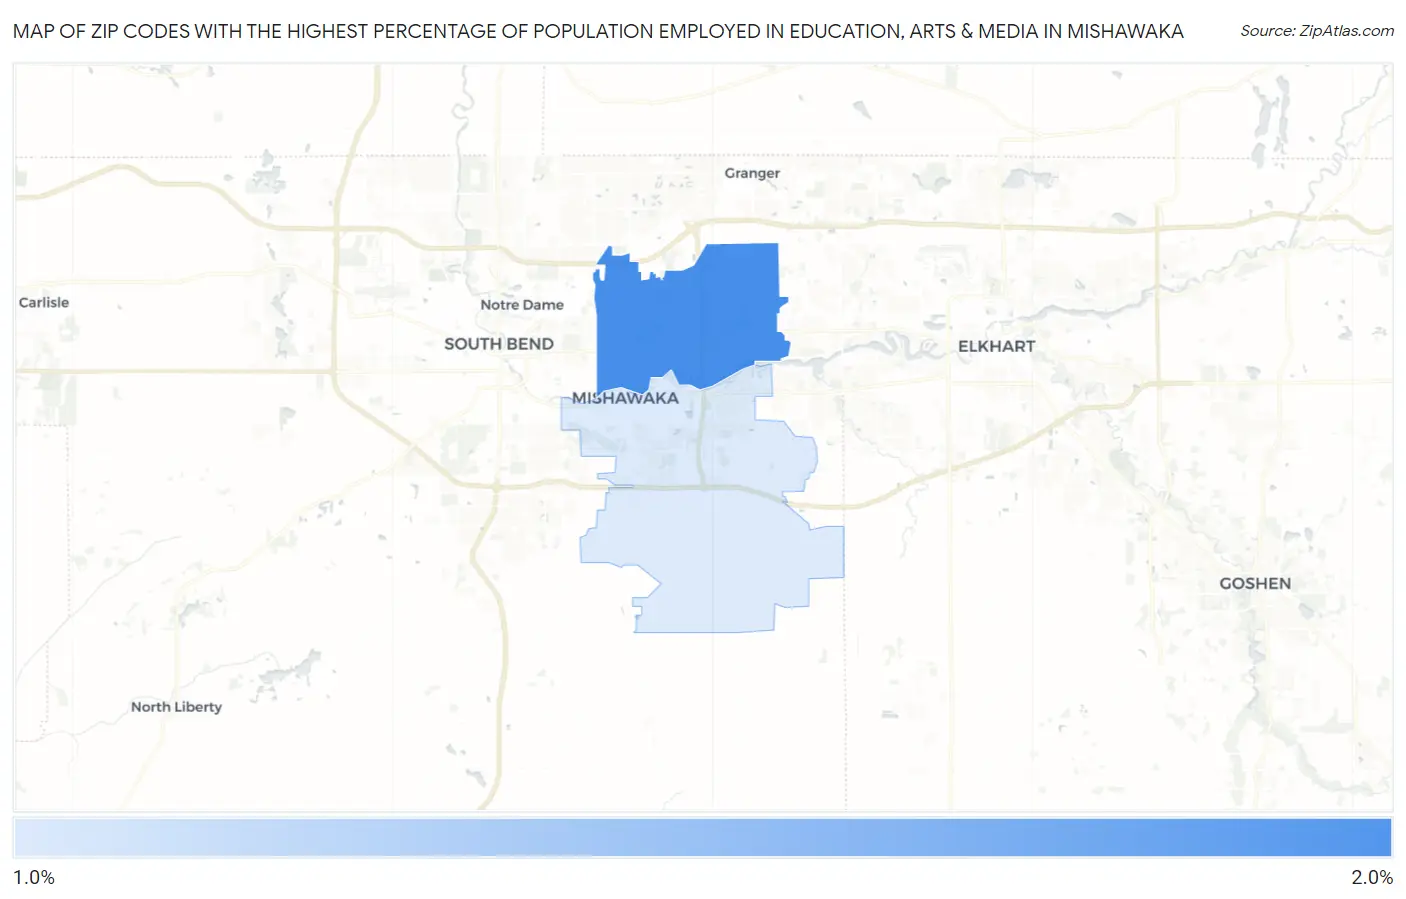
Map of Zip Codes with the Highest Percentage of Population Employed in Education, Arts & Media in Mishawaka
1.9%
1.9%
Zip Codes with the Highest Percentage of Population Employed in Education, Arts & Media in Mishawaka, IN
| Zip Code | % Employed | vs State | vs National | |
| 1. | 46545 | 1.9% | 1.8%(+0.124)#229 | 1.8%(+0.131)#10,205 |
| 2. | 46544 | 1.9% | 1.8%(+0.114)#231 | 1.8%(+0.121)#10,288 |
1
Common Questions
What are the Top Zip Codes with the Highest Percentage of Population Employed in Education, Arts & Media in Mishawaka, IN?
Top Zip Codes with the Highest Percentage of Population Employed in Education, Arts & Media in Mishawaka, IN are:
What zip code has the Highest Percentage of Population Employed in Education, Arts & Media in Mishawaka, IN?
46545 has the Highest Percentage of Population Employed in Education, Arts & Media in Mishawaka, IN with 1.9%.
What is the Percentage of Population Employed in Education, Arts & Media in Mishawaka, IN?
Percentage of Population Employed in Education, Arts & Media in Mishawaka is 2.0%.
What is the Percentage of Population Employed in Education, Arts & Media in Indiana?
Percentage of Population Employed in Education, Arts & Media in Indiana is 1.8%.
What is the Percentage of Population Employed in Education, Arts & Media in the United States?
Percentage of Population Employed in Education, Arts & Media in the United States is 1.8%.