Zip Codes with the Highest Percentage of Population Employed in Office & Administration in Mishawaka, IN
RELATED REPORTS & OPTIONS
Office & Administration
Mishawaka
Compare Zip Codes
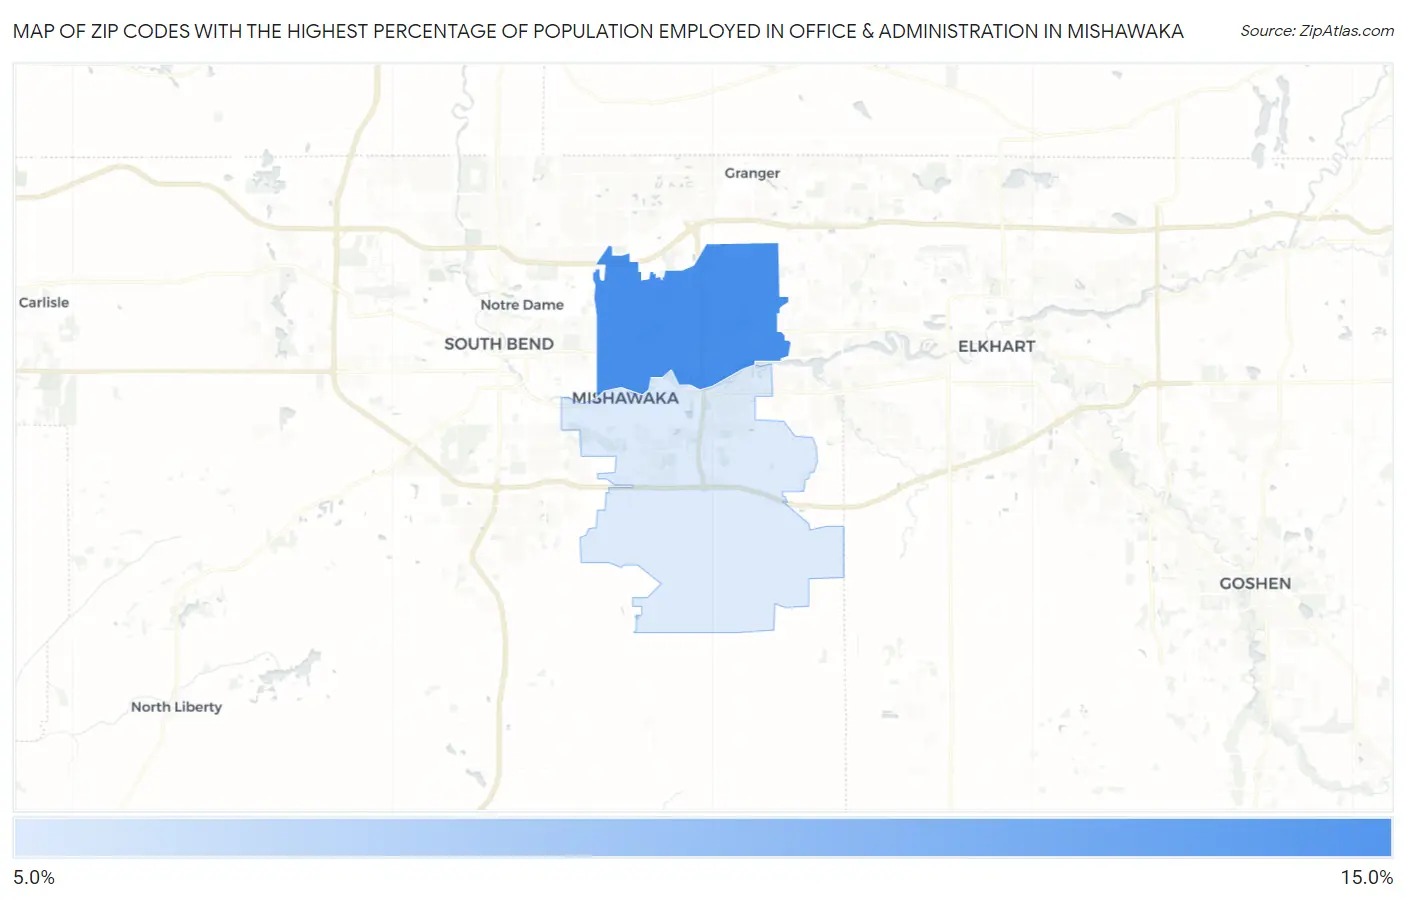
Map of Zip Codes with the Highest Percentage of Population Employed in Office & Administration in Mishawaka
12.2%
13.3%
Zip Codes with the Highest Percentage of Population Employed in Office & Administration in Mishawaka, IN
| Zip Code | % Employed | vs State | vs National | |
| 1. | 46545 | 13.3% | 11.0%(+2.33)#144 | 10.9%(+2.46)#7,341 |
| 2. | 46544 | 12.2% | 11.0%(+1.20)#207 | 10.9%(+1.33)#10,175 |
1
Common Questions
What are the Top Zip Codes with the Highest Percentage of Population Employed in Office & Administration in Mishawaka, IN?
Top Zip Codes with the Highest Percentage of Population Employed in Office & Administration in Mishawaka, IN are:
What zip code has the Highest Percentage of Population Employed in Office & Administration in Mishawaka, IN?
46545 has the Highest Percentage of Population Employed in Office & Administration in Mishawaka, IN with 13.3%.
What is the Percentage of Population Employed in Office & Administration in Mishawaka, IN?
Percentage of Population Employed in Office & Administration in Mishawaka is 12.5%.
What is the Percentage of Population Employed in Office & Administration in Indiana?
Percentage of Population Employed in Office & Administration in Indiana is 11.0%.
What is the Percentage of Population Employed in Office & Administration in the United States?
Percentage of Population Employed in Office & Administration in the United States is 10.9%.