Zip Codes with the Highest Percentage of Population Employed in Education Instruction & Library in Mishawaka, IN
RELATED REPORTS & OPTIONS
Education Instruction & Library
Mishawaka
Compare Zip Codes
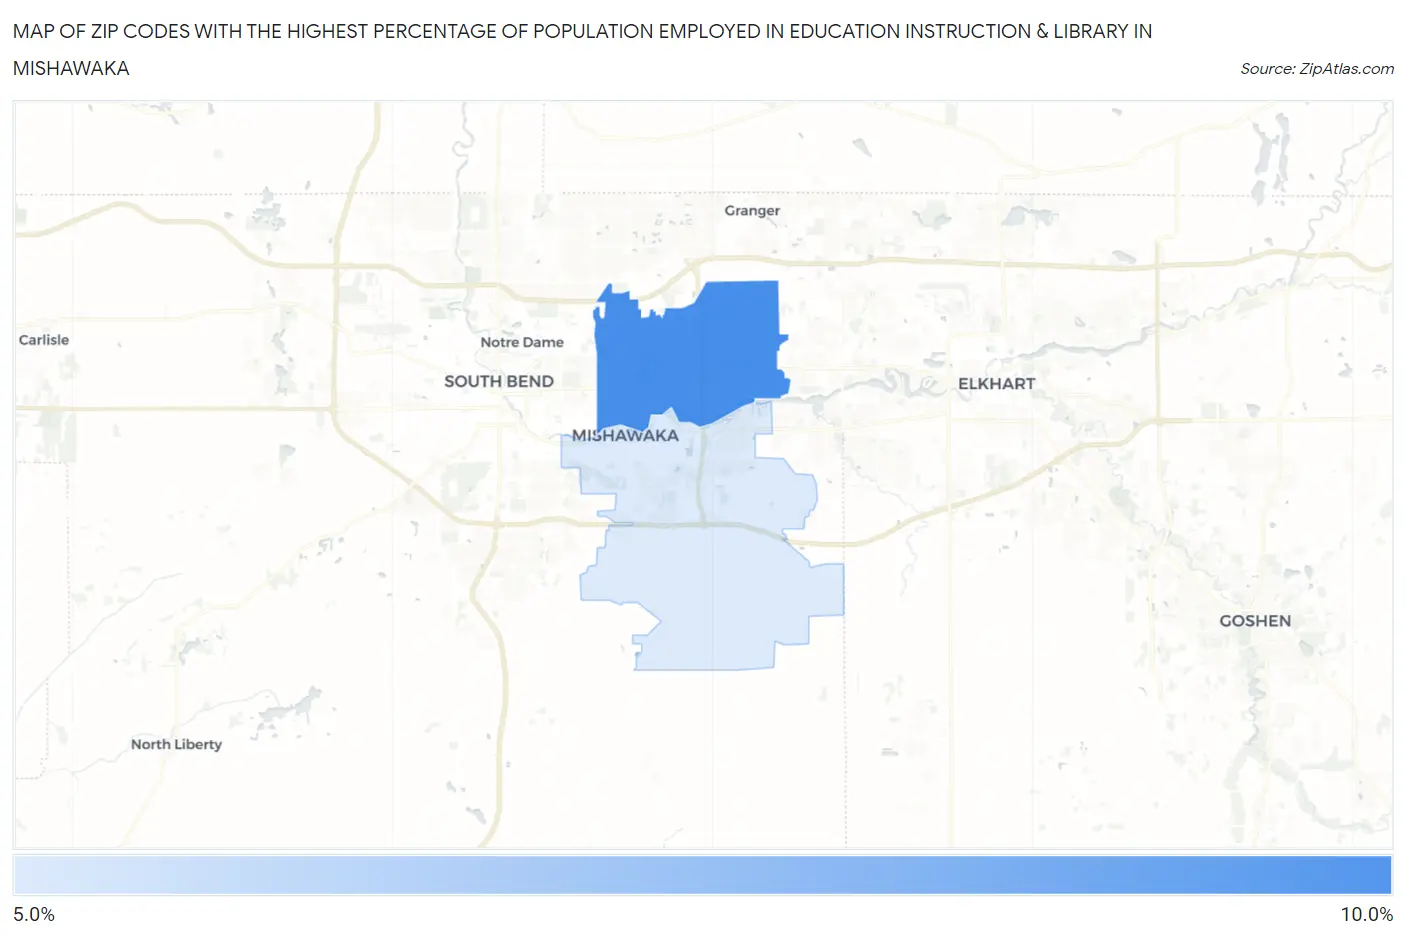
Map of Zip Codes with the Highest Percentage of Population Employed in Education Instruction & Library in Mishawaka
5.2%
8.7%
Zip Codes with the Highest Percentage of Population Employed in Education Instruction & Library in Mishawaka, IN
| Zip Code | % Employed | vs State | vs National | |
| 1. | 46545 | 8.7% | 5.8%(+2.97)#75 | 6.2%(+2.54)#5,664 |
| 2. | 46544 | 5.2% | 5.8%(-0.569)#299 | 6.2%(-0.994)#16,825 |
1
Common Questions
What are the Top Zip Codes with the Highest Percentage of Population Employed in Education Instruction & Library in Mishawaka, IN?
Top Zip Codes with the Highest Percentage of Population Employed in Education Instruction & Library in Mishawaka, IN are:
What zip code has the Highest Percentage of Population Employed in Education Instruction & Library in Mishawaka, IN?
46545 has the Highest Percentage of Population Employed in Education Instruction & Library in Mishawaka, IN with 8.7%.
What is the Percentage of Population Employed in Education Instruction & Library in Mishawaka, IN?
Percentage of Population Employed in Education Instruction & Library in Mishawaka is 6.7%.
What is the Percentage of Population Employed in Education Instruction & Library in Indiana?
Percentage of Population Employed in Education Instruction & Library in Indiana is 5.8%.
What is the Percentage of Population Employed in Education Instruction & Library in the United States?
Percentage of Population Employed in Education Instruction & Library in the United States is 6.2%.