Zip Codes with the Highest Percentage of Population Employed in Life, Physical & Social Science in Mishawaka, IN
RELATED REPORTS & OPTIONS
Life, Physical & Social Science
Mishawaka
Compare Zip Codes
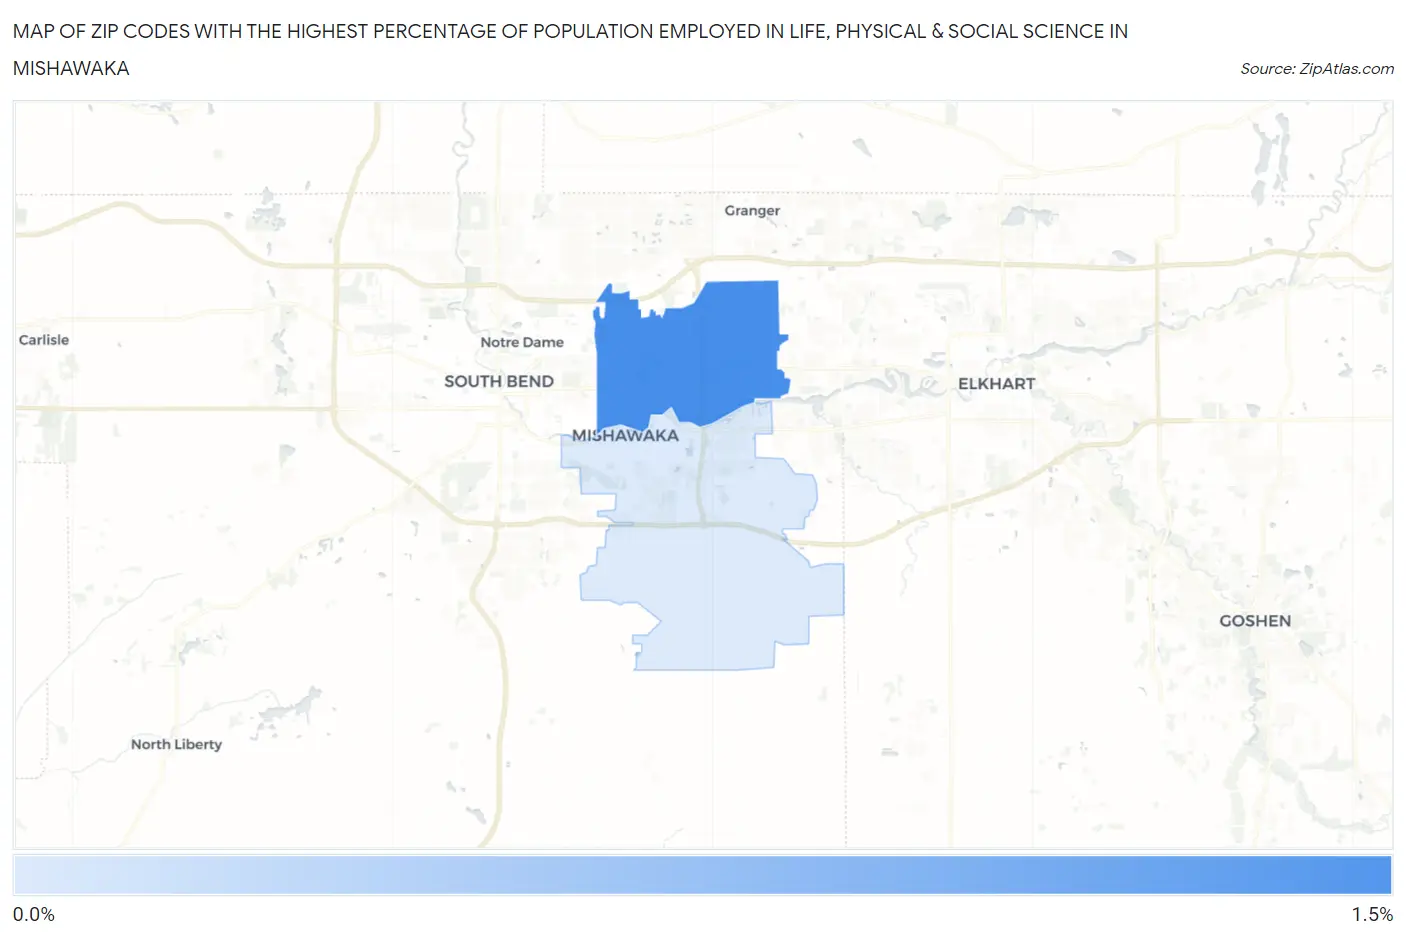
Map of Zip Codes with the Highest Percentage of Population Employed in Life, Physical & Social Science in Mishawaka
0.50%
1.0%
Zip Codes with the Highest Percentage of Population Employed in Life, Physical & Social Science in Mishawaka, IN
| Zip Code | % Employed | vs State | vs National | |
| 1. | 46545 | 1.0% | 0.83%(+0.200)#132 | 1.1%(-0.060)#8,788 |
| 2. | 46544 | 0.50% | 0.83%(-0.333)#271 | 1.1%(-0.592)#14,514 |
1
Common Questions
What are the Top Zip Codes with the Highest Percentage of Population Employed in Life, Physical & Social Science in Mishawaka, IN?
Top Zip Codes with the Highest Percentage of Population Employed in Life, Physical & Social Science in Mishawaka, IN are:
What zip code has the Highest Percentage of Population Employed in Life, Physical & Social Science in Mishawaka, IN?
46545 has the Highest Percentage of Population Employed in Life, Physical & Social Science in Mishawaka, IN with 1.0%.
What is the Percentage of Population Employed in Life, Physical & Social Science in Mishawaka, IN?
Percentage of Population Employed in Life, Physical & Social Science in Mishawaka is 0.98%.
What is the Percentage of Population Employed in Life, Physical & Social Science in Indiana?
Percentage of Population Employed in Life, Physical & Social Science in Indiana is 0.83%.
What is the Percentage of Population Employed in Life, Physical & Social Science in the United States?
Percentage of Population Employed in Life, Physical & Social Science in the United States is 1.1%.