Zip Codes with the Highest Percentage of Households with Income Below $10,000 in Evansville, IN
RELATED REPORTS & OPTIONS
Household Income | $0-10k
Evansville
Compare Zip Codes
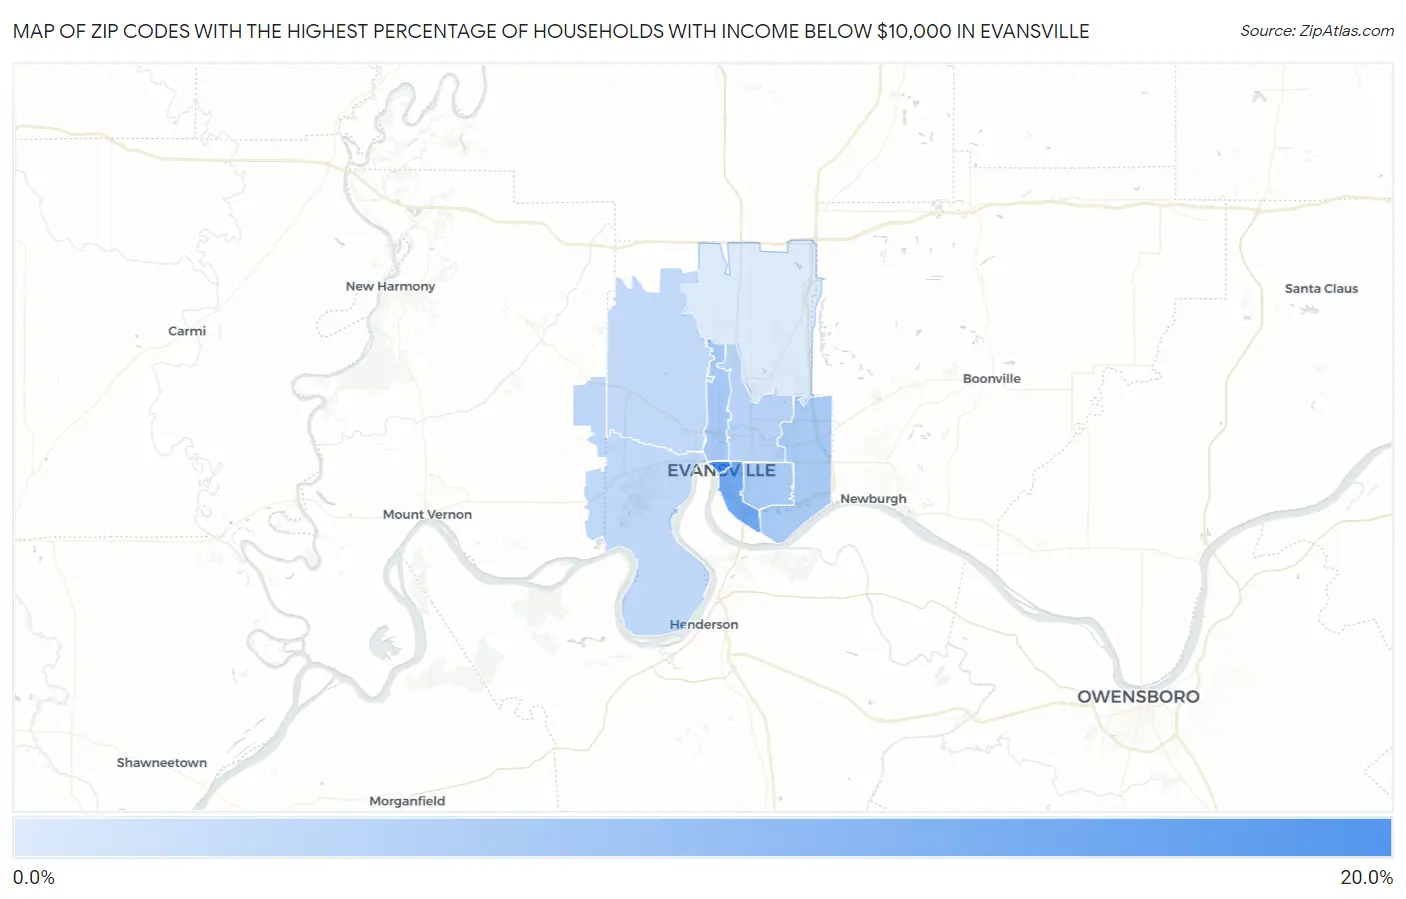
Map of Zip Codes with the Highest Percentage of Households with Income Below $10,000 in Evansville
1.6%
15.4%
Zip Codes with the Highest Percentage of Households with Income Below $10,000 in Evansville, IN
| Zip Code | Households with Income < $10k | vs State | vs National | |
| 1. | 47708 | 15.4% | 5.0%(+10.4)#22 | 4.9%(+10.5)#1,446 |
| 2. | 47713 | 11.5% | 5.0%(+6.50)#49 | 4.9%(+6.60)#2,680 |
| 3. | 47710 | 6.5% | 5.0%(+1.50)#148 | 4.9%(+1.60)#7,927 |
| 4. | 47714 | 6.3% | 5.0%(+1.30)#157 | 4.9%(+1.40)#8,324 |
| 5. | 47715 | 6.2% | 5.0%(+1.20)#161 | 4.9%(+1.30)#8,542 |
| 6. | 47711 | 4.8% | 5.0%(-0.200)#252 | 4.9%(-0.100)#12,312 |
| 7. | 47712 | 4.2% | 5.0%(-0.800)#317 | 4.9%(-0.700)#14,508 |
| 8. | 47720 | 4.0% | 5.0%(-1.00)#339 | 4.9%(-0.900)#15,309 |
| 9. | 47725 | 1.6% | 5.0%(-3.40)#568 | 4.9%(-3.30)#25,115 |
1
Common Questions
What are the Top 5 Zip Codes with the Highest Percentage of Households with Income Below $10,000 in Evansville, IN?
Top 5 Zip Codes with the Highest Percentage of Households with Income Below $10,000 in Evansville, IN are:
What zip code has the Highest Percentage of Households with Income Below $10,000 in Evansville, IN?
47708 has the Highest Percentage of Households with Income Below $10,000 in Evansville, IN with 15.4%.
What is the Percentage of Households with Income Below $10,000 in Evansville, IN?
Percentage of Households with Income Below $10,000 in Evansville is 6.7%.
What is the Percentage of Households with Income Below $10,000 in Indiana?
Percentage of Households with Income Below $10,000 in Indiana is 5.0%.
What is the Percentage of Households with Income Below $10,000 in the United States?
Percentage of Households with Income Below $10,000 in the United States is 4.9%.