Zip Codes with the Highest Percentage of Population Employed in Real Estate, Rental & Leasing in Mishawaka, IN
RELATED REPORTS & OPTIONS
Real Estate, Rental & Leasing
Mishawaka
Compare Zip Codes
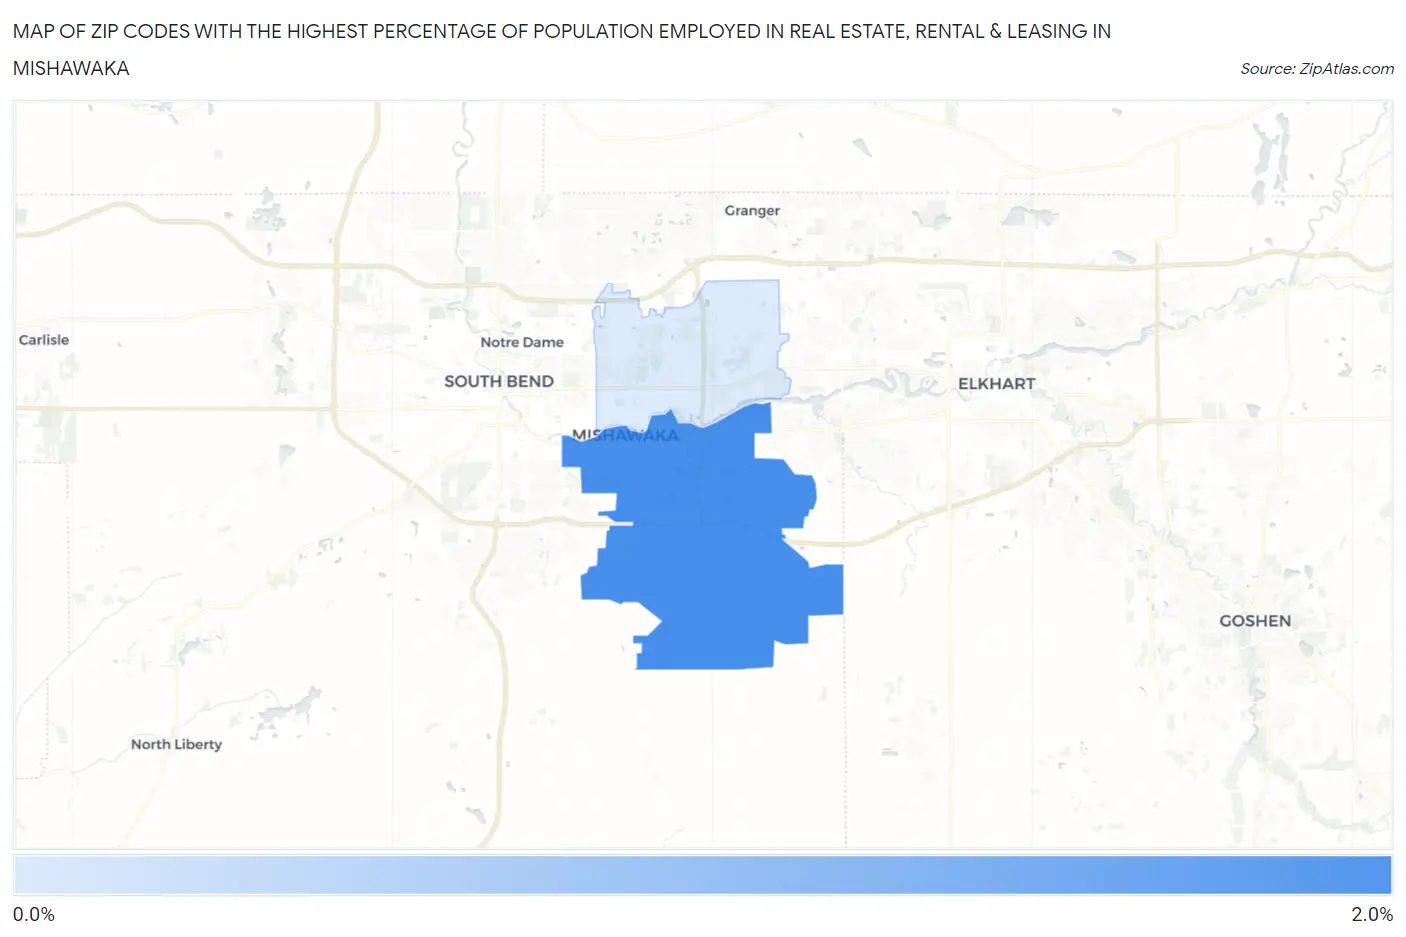
Map of Zip Codes with the Highest Percentage of Population Employed in Real Estate, Rental & Leasing in Mishawaka
0.93%
1.9%
Zip Codes with the Highest Percentage of Population Employed in Real Estate, Rental & Leasing in Mishawaka, IN
| Zip Code | % Employed | vs State | vs National | |
| 1. | 46544 | 1.9% | 1.4%(+0.458)#134 | 1.9%(+0.002)#8,512 |
| 2. | 46545 | 0.93% | 1.4%(-0.507)#332 | 1.9%(-0.962)#15,716 |
1
Common Questions
What are the Top Zip Codes with the Highest Percentage of Population Employed in Real Estate, Rental & Leasing in Mishawaka, IN?
Top Zip Codes with the Highest Percentage of Population Employed in Real Estate, Rental & Leasing in Mishawaka, IN are:
What zip code has the Highest Percentage of Population Employed in Real Estate, Rental & Leasing in Mishawaka, IN?
46544 has the Highest Percentage of Population Employed in Real Estate, Rental & Leasing in Mishawaka, IN with 1.9%.
What is the Percentage of Population Employed in Real Estate, Rental & Leasing in Mishawaka, IN?
Percentage of Population Employed in Real Estate, Rental & Leasing in Mishawaka is 1.3%.
What is the Percentage of Population Employed in Real Estate, Rental & Leasing in Indiana?
Percentage of Population Employed in Real Estate, Rental & Leasing in Indiana is 1.4%.
What is the Percentage of Population Employed in Real Estate, Rental & Leasing in the United States?
Percentage of Population Employed in Real Estate, Rental & Leasing in the United States is 1.9%.