Zip Codes with the Highest Percentage of Households with Income Above $200,000 in Greenwood, IN
RELATED REPORTS & OPTIONS
Household Income | $200k+
Greenwood
Compare Zip Codes
Map of Zip Codes with the Highest Percentage of Households with Income Above $200,000 in Greenwood
8.8%
11.2%
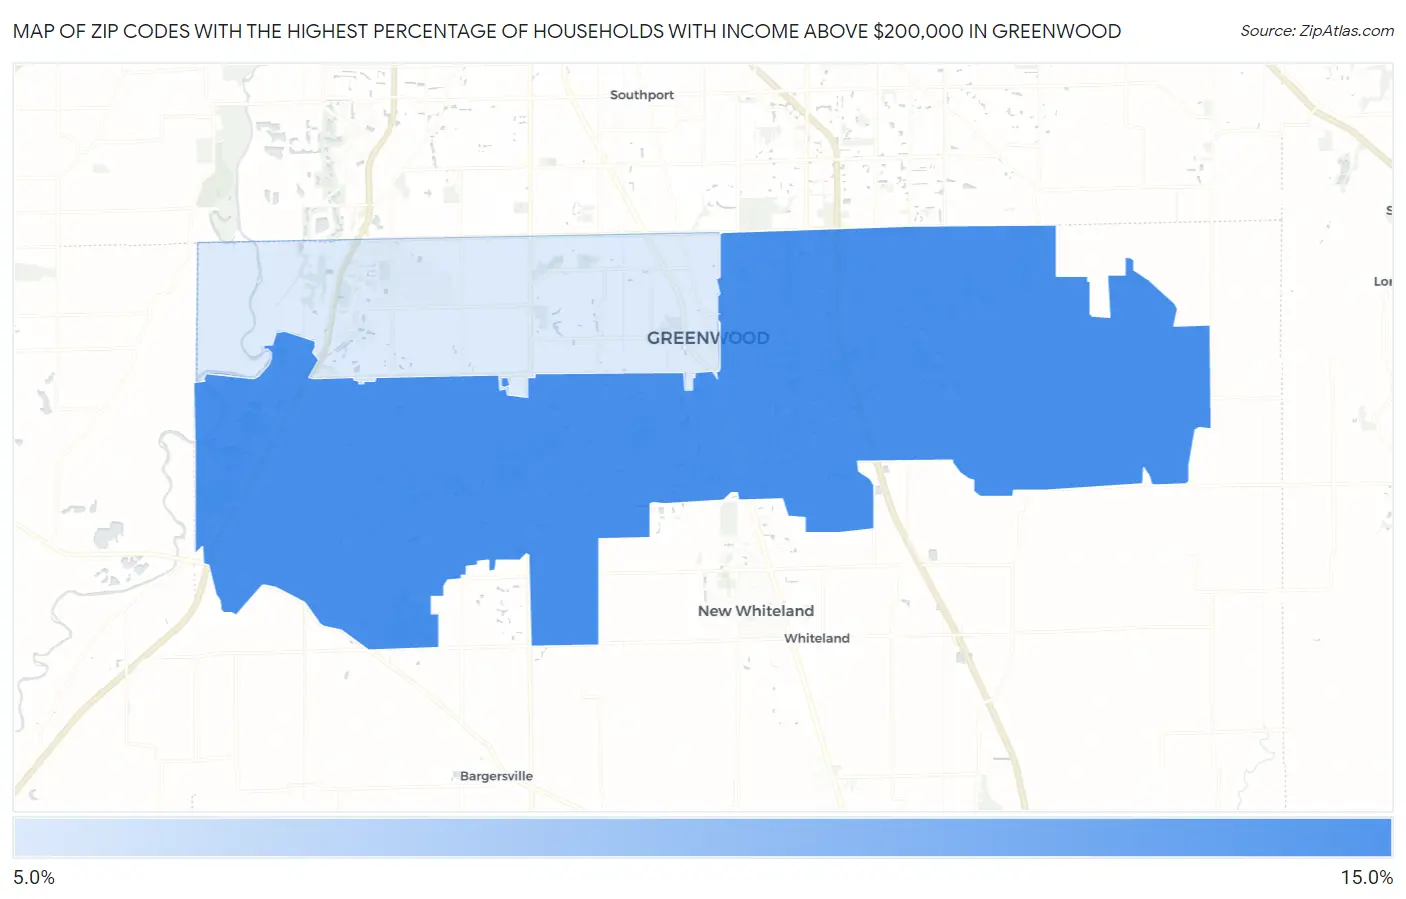
Zip Codes with the Highest Percentage of Households with Income Above $200,000 in Greenwood, IN
| Zip Code | Households with Income > $200k | vs State | vs National | |
| 1. | 46143 | 11.2% | 6.7%(+4.50)#73 | 11.4%(-0.200)#7,219 |
| 2. | 46142 | 8.8% | 6.7%(+2.10)#117 | 11.4%(-2.60)#9,416 |
1
Common Questions
What are the Top Zip Codes with the Highest Percentage of Households with Income Above $200,000 in Greenwood, IN?
Top Zip Codes with the Highest Percentage of Households with Income Above $200,000 in Greenwood, IN are:
What zip code has the Highest Percentage of Households with Income Above $200,000 in Greenwood, IN?
46143 has the Highest Percentage of Households with Income Above $200,000 in Greenwood, IN with 11.2%.
What is the Percentage of Households with Income Above $200,000 in Greenwood, IN?
Percentage of Households with Income Above $200,000 in Greenwood is 6.1%.
What is the Percentage of Households with Income Above $200,000 in Indiana?
Percentage of Households with Income Above $200,000 in Indiana is 6.7%.
What is the Percentage of Households with Income Above $200,000 in the United States?
Percentage of Households with Income Above $200,000 in the United States is 11.4%.