Zip Codes with the Highest Percentage of Households with Income Above $200,000 in Muncie, IN
RELATED REPORTS & OPTIONS
Household Income | $200k+
Muncie
Compare Zip Codes
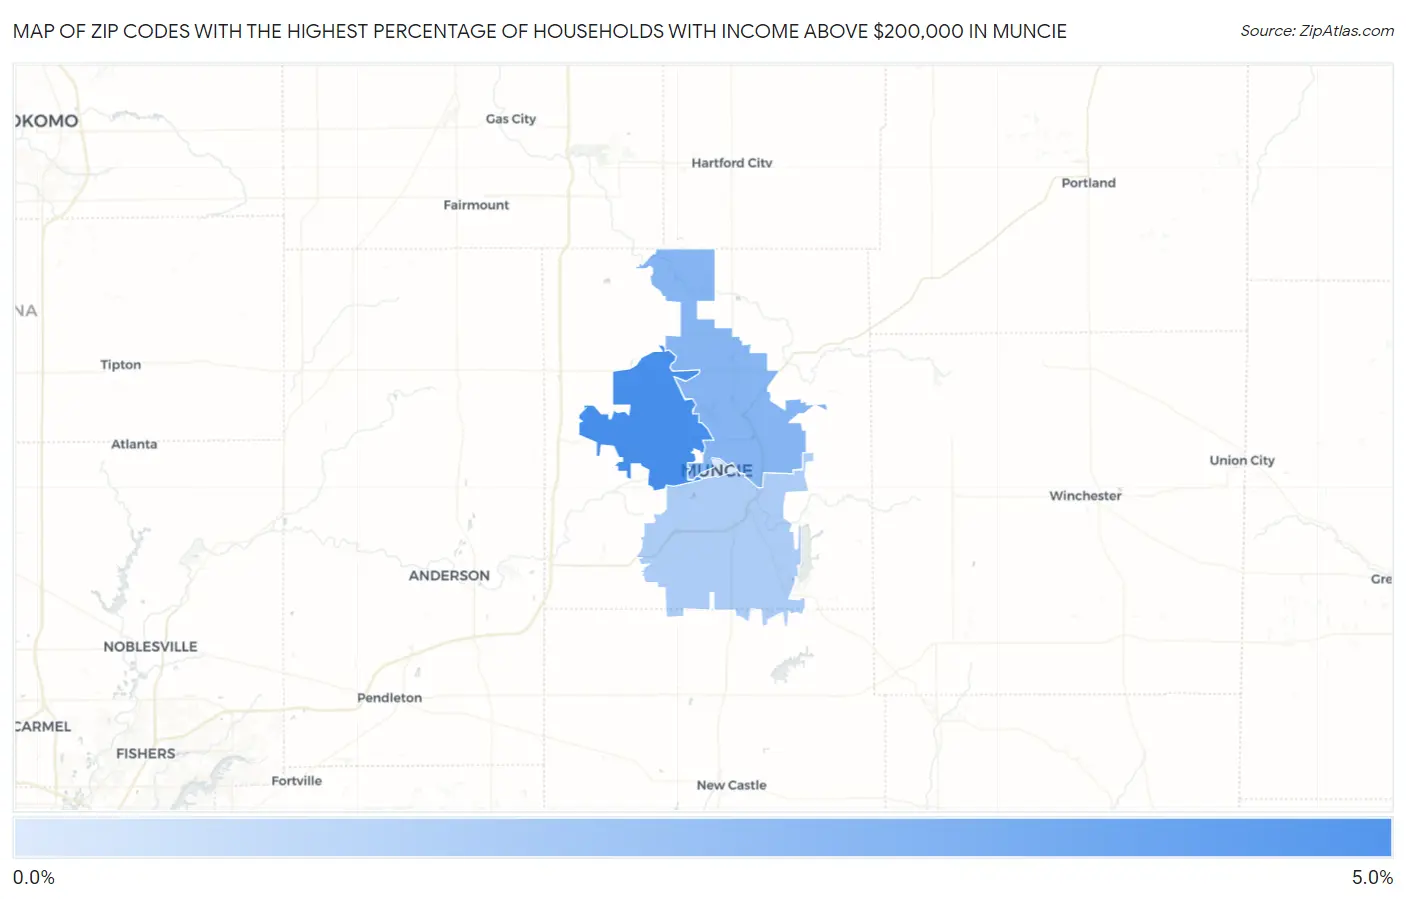
Map of Zip Codes with the Highest Percentage of Households with Income Above $200,000 in Muncie
0.50%
4.6%
Zip Codes with the Highest Percentage of Households with Income Above $200,000 in Muncie, IN
| Zip Code | Households with Income > $200k | vs State | vs National | |
| 1. | 47304 | 4.6% | 6.7%(-2.10)#289 | 11.4%(-6.80)#16,521 |
| 2. | 47303 | 2.9% | 6.7%(-3.80)#430 | 11.4%(-8.50)#21,162 |
| 3. | 47302 | 1.8% | 6.7%(-4.90)#538 | 11.4%(-9.60)#24,303 |
| 4. | 47305 | 0.50% | 6.7%(-6.20)#629 | 11.4%(-10.9)#27,130 |
1
Common Questions
What are the Top 3 Zip Codes with the Highest Percentage of Households with Income Above $200,000 in Muncie, IN?
Top 3 Zip Codes with the Highest Percentage of Households with Income Above $200,000 in Muncie, IN are:
What zip code has the Highest Percentage of Households with Income Above $200,000 in Muncie, IN?
47304 has the Highest Percentage of Households with Income Above $200,000 in Muncie, IN with 4.6%.
What is the Percentage of Households with Income Above $200,000 in Muncie, IN?
Percentage of Households with Income Above $200,000 in Muncie is 1.9%.
What is the Percentage of Households with Income Above $200,000 in Indiana?
Percentage of Households with Income Above $200,000 in Indiana is 6.7%.
What is the Percentage of Households with Income Above $200,000 in the United States?
Percentage of Households with Income Above $200,000 in the United States is 11.4%.