Zip Codes with the Highest Percentage of Households with Income Above $200,000 in Indianapolis, IN

RELATED REPORTS & OPTIONS

Household Income | $200k+
Population
Families and Households
Female Fertility
Female Fertility (Unmarried)
Race (Community Size)
Race (Percentage)
Ancestry (Community Size)
AfghanAfricanAlaskan AthabascanAlbanianAlsatianAmericanApacheArabArgentineanArmenianAustralianAustrianBahamianBangladeshiBarbadianBasqueBelgianBelizeanBhutaneseBlackfeetBolivianBrazilianBritishBritish West IndianBulgarianBurmeseCajunCanadianCelticCentral AmericanCentral American IndianCherokeeChickasawChileanChippewaChoctawColombianCosta RicanCroatianCrowCubanCzechCzechoslovakianDanishDominicanDutchEastern EuropeanEcuadorianEgyptianEnglishEstonianEthiopianEuropeanFilipinoFinnishFrenchFrench CanadianGermanGerman RussianGhanaianGreekGuamanian / ChamorroGuatemalanGuyaneseHaitianHonduranHopiHungarianIcelanderIndian (Asian)IndonesianInupiatIranianIraqiIrishIroquoisIsraeliItalianJamaicanJapaneseJordanianKenyanKoreanLaotianLatvianLebaneseLiberianLithuanianLuxembourgerMacedonianMalaysianMenomineeMexicanMexican American IndianMongolianMoroccanNative HawaiianNavajoNew ZealanderNicaraguanNigerianNorthern EuropeanNorwegianPakistaniPalestinianPanamanianPennsylvania GermanPeruvianPolishPortuguesePotawatomiPuerto RicanRomanianRussianSalvadoranSamoanScandinavianScotch-IrishScottishSeminoleSenegaleseSerbianSierra LeoneanSiouxSlavicSlovakSloveneSouth AfricanSouth AmericanSouth American IndianSpaniardSpanishSri LankanSubsaharan AfricanSudaneseSwedishSwissSyrianThaiTonganTrinidadian and TobagonianTurkishUgandanUkrainianUruguayanVenezuelanVietnameseWelshWest IndianYugoslavianZimbabwean
Ancestry (Percentage)
AfghanAfricanAlaskan AthabascanAlbanianAlsatianAmericanApacheArabArgentineanArmenianAustralianAustrianBahamianBangladeshiBarbadianBasqueBelgianBelizeanBhutaneseBlackfeetBolivianBrazilianBritishBritish West IndianBulgarianBurmeseCajunCanadianCelticCentral AmericanCentral American IndianCherokeeChickasawChileanChippewaChoctawColombianCosta RicanCroatianCrowCubanCzechCzechoslovakianDanishDominicanDutchEastern EuropeanEcuadorianEgyptianEnglishEstonianEthiopianEuropeanFilipinoFinnishFrenchFrench CanadianGermanGerman RussianGhanaianGreekGuamanian / ChamorroGuatemalanGuyaneseHaitianHonduranHopiHungarianIcelanderIndian (Asian)IndonesianInupiatIranianIraqiIrishIroquoisIsraeliItalianJamaicanJapaneseJordanianKenyanKoreanLaotianLatvianLebaneseLiberianLithuanianLuxembourgerMacedonianMalaysianMenomineeMexicanMexican American IndianMongolianMoroccanNative HawaiianNavajoNew ZealanderNicaraguanNigerianNorthern EuropeanNorwegianPakistaniPalestinianPanamanianPennsylvania GermanPeruvianPolishPortuguesePotawatomiPuerto RicanRomanianRussianSalvadoranSamoanScandinavianScotch-IrishScottishSeminoleSenegaleseSerbianSierra LeoneanSiouxSlavicSlovakSloveneSouth AfricanSouth AmericanSouth American IndianSpaniardSpanishSri LankanSubsaharan AfricanSudaneseSwedishSwissSyrianThaiTonganTrinidadian and TobagonianTurkishUgandanUkrainianUruguayanVenezuelanVietnameseWelshWest IndianYugoslavianZimbabwean
Immigrant Origin (Total)
AfghanistanAfricaArgentinaAsiaAustraliaAustriaBahamasBangladeshBarbadosBelarusBoliviaBosnia and HerzegovinaBrazilBulgariaBurma / MyanmarCambodiaCameroonCanadaCaribbeanCentral AmericaChileChinaColombiaCongoCosta RicaCubaDenmarkDominican RepublicEastern AfricaEastern AsiaEastern EuropeEcuadorEgyptEl SalvadorEnglandEritreaEthiopiaEuropeFranceGermanyGhanaGreeceGuatemalaGuyanaHaitiHondurasHong KongHungaryIndiaIndonesiaIranIraqIrelandIsraelItalyJamaicaJapanJordanKenyaKoreaLaosLatin AmericaLatviaLebanonLiberiaMalaysiaMexicoMiddle AfricaMoldovaMoroccoNepalNetherlandsNicaraguaNigeriaNorth MacedoniaNorthern AfricaNorthern EuropeNorwayOceaniaPakistanPanamaPeruPhilippinesPolandPortugalRomaniaRussiaSaudi ArabiaScotlandSenegalSerbiaSierra LeoneSingaporeSouth AfricaSouth AmericaSouth Central AsiaSouth Eastern AsiaSouthern EuropeSpainSt. Vincent and the GrenadinesSudanSyriaTaiwanThailandTrinidad and TobagoTurkeyUgandaUkraineUzbekistanVenezuelaVietnamWest IndiesWestern AfricaWestern AsiaWestern EuropeYemenZaireZimbabwe
Immigrant Origin (Percentage)
AfghanistanAfricaArgentinaAsiaAustraliaAustriaBahamasBangladeshBarbadosBelarusBoliviaBosnia and HerzegovinaBrazilBulgariaBurma / MyanmarCambodiaCameroonCanadaCaribbeanCentral AmericaChileChinaColombiaCongoCosta RicaCubaDenmarkDominican RepublicEastern AfricaEastern AsiaEastern EuropeEcuadorEgyptEl SalvadorEnglandEritreaEthiopiaEuropeFranceGermanyGhanaGreeceGuatemalaGuyanaHaitiHondurasHong KongHungaryIndiaIndonesiaIranIraqIrelandIsraelItalyJamaicaJapanJordanKenyaKoreaLaosLatin AmericaLatviaLebanonLiberiaMalaysiaMexicoMiddle AfricaMoldovaMoroccoNepalNetherlandsNicaraguaNigeriaNorth MacedoniaNorthern AfricaNorthern EuropeNorwayOceaniaPakistanPanamaPeruPhilippinesPolandPortugalRomaniaRussiaSaudi ArabiaScotlandSenegalSerbiaSierra LeoneSingaporeSouth AfricaSouth AmericaSouth Central AsiaSouth Eastern AsiaSouthern EuropeSpainSt. Vincent and the GrenadinesSudanSyriaTaiwanThailandTrinidad and TobagoTurkeyUgandaUkraineUzbekistanVenezuelaVietnamWest IndiesWestern AfricaWestern AsiaWestern EuropeYemenZaireZimbabwe
Income
Income (Families)
Income (Households)
Poverty
Poverty (Families)
Unemployment
Employment Occupations
Employment Industries
Employer Class
Commute Time
Commute Means
School Enrollment
Education by Degree Field
Occupancy
Finances
Physical Characteristics
Indianapolis
Compare Zip Codes
Comparison Subject

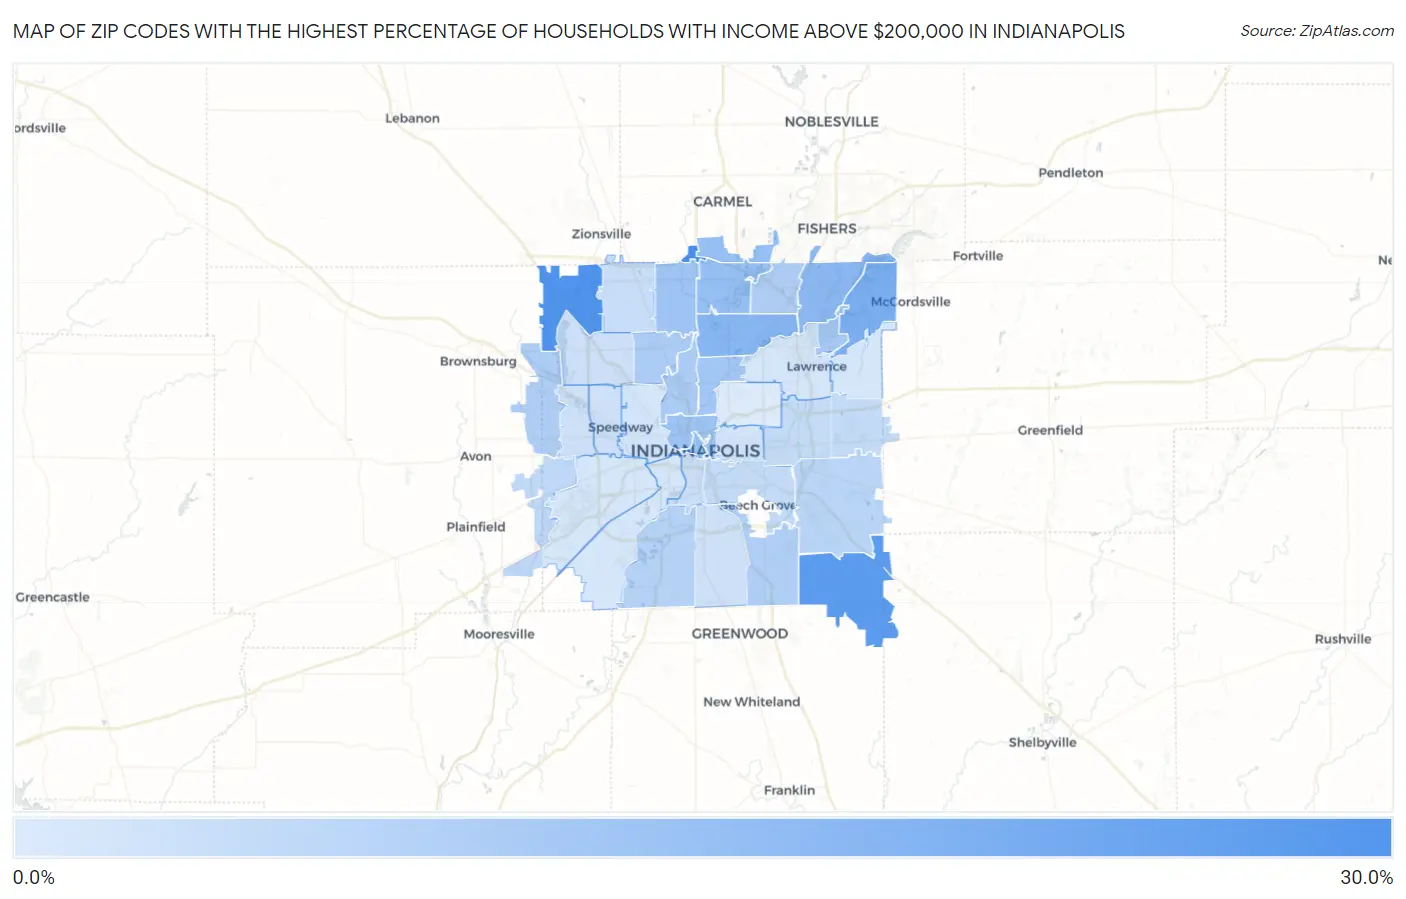
Map of Zip Codes with the Highest Percentage of Households with Income Above $200,000 in Indianapolis

0.0%
30.0%
Zip Codes with the Highest Percentage of Households with Income Above $200,000 in Indianapolis Map

Zip Codes with the Highest Percentage of Households with Income Above $200,000 in Indianapolis, IN

Zip Code Households with Income > $200k vs State vs National
1.4629026.7%6.7%(+20.0)#811.4%(+15.3)#1,925
2.4627824.8%6.7%(+18.1)#1211.4%(+13.4)#2,228
3.4625922.9%6.7%(+16.2)#1411.4%(+11.5)#2,578
4.4623616.6%6.7%(+9.90)#2611.4%(+5.20)#4,331
5.4622014.8%6.7%(+8.10)#3811.4%(+3.40)#5,073
6.4625613.7%6.7%(+7.00)#4311.4%(+2.30)#5,623
7.4624012.1%6.7%(+5.40)#6111.4%(+0.700)#6,608
8.4628011.9%6.7%(+5.20)#6511.4%(+0.500)#6,750
9.4620411.1%6.7%(+4.40)#7611.4%(-0.300)#7,327
10.4626010.7%6.7%(+4.00)#8011.4%(-0.700)#7,613
11.4620210.6%6.7%(+3.90)#8511.4%(-0.800)#7,707
12.462059.7%6.7%(+3.00)#9911.4%(-1.70)#8,552
13.462168.9%6.7%(+2.20)#11611.4%(-2.50)#9,369
14.462288.4%6.7%(+1.70)#12311.4%(-3.00)#9,887
15.462088.3%6.7%(+1.60)#12911.4%(-3.10)#10,012
16.462348.1%6.7%(+1.40)#13711.4%(-3.30)#10,236
17.462508.1%6.7%(+1.40)#13911.4%(-3.30)#10,249
18.462377.4%6.7%(+0.700)#15911.4%(-4.00)#11,185
19.462176.8%6.7%(+0.100)#18011.4%(-4.60)#12,060
20.462396.2%6.7%(-0.500)#20411.4%(-5.20)#13,077
21.462315.4%6.7%(-1.30)#24311.4%(-6.00)#14,708
22.462294.6%6.7%(-2.10)#29111.4%(-6.80)#16,528
23.462034.4%6.7%(-2.30)#30411.4%(-7.00)#17,013
24.462194.2%6.7%(-2.50)#32411.4%(-7.20)#17,543
25.462683.7%6.7%(-3.00)#35911.4%(-7.70)#18,890
26.462543.2%6.7%(-3.50)#40411.4%(-8.20)#20,281
27.462253.1%6.7%(-3.60)#41311.4%(-8.30)#20,686
28.462272.7%6.7%(-4.00)#45611.4%(-8.70)#21,711
29.462242.5%6.7%(-4.20)#47911.4%(-8.90)#22,321
30.462142.5%6.7%(-4.20)#48111.4%(-8.90)#22,344
31.462222.1%6.7%(-4.60)#51711.4%(-9.30)#23,451
32.462012.1%6.7%(-4.60)#51811.4%(-9.30)#23,457
33.462211.7%6.7%(-5.00)#54511.4%(-9.70)#24,552
34.462261.6%6.7%(-5.10)#55211.4%(-9.80)#24,797
35.462411.6%6.7%(-5.10)#55311.4%(-9.80)#24,804
36.462351.5%6.7%(-5.20)#56011.4%(-9.90)#25,048
37.462180.50%6.7%(-6.20)#62711.4%(-10.9)#27,079

Common Questions

What are the Top 10 Zip Codes with the Highest Percentage of Households with Income Above $200,000 in Indianapolis, IN?
Top 10 Zip Codes with the Highest Percentage of Households with Income Above $200,000 in Indianapolis, IN are:
#1
26.7%
#2
24.8%
#3
22.9%
#4
16.6%
#5
14.8%
#6
13.7%
#7
12.1%
#8
11.9%
#9
11.1%
#10
10.7%
What zip code has the Highest Percentage of Households with Income Above $200,000 in Indianapolis, IN?
46290 has the Highest Percentage of Households with Income Above $200,000 in Indianapolis, IN with 26.7%.
What is the Percentage of Households with Income Above $200,000 in Indianapolis, IN?
Percentage of Households with Income Above $200,000 in Indianapolis is 6.1%.
What is the Percentage of Households with Income Above $200,000 in Indiana?
Percentage of Households with Income Above $200,000 in Indiana is 6.7%.
What is the Percentage of Households with Income Above $200,000 in the United States?
Percentage of Households with Income Above $200,000 in the United States is 11.4%.