Cities with the Highest Percentage of Population Employed in Firefighting & Prevention in Indiana
RELATED REPORTS & OPTIONS
Firefighting & Prevention
Indiana
Compare Cities
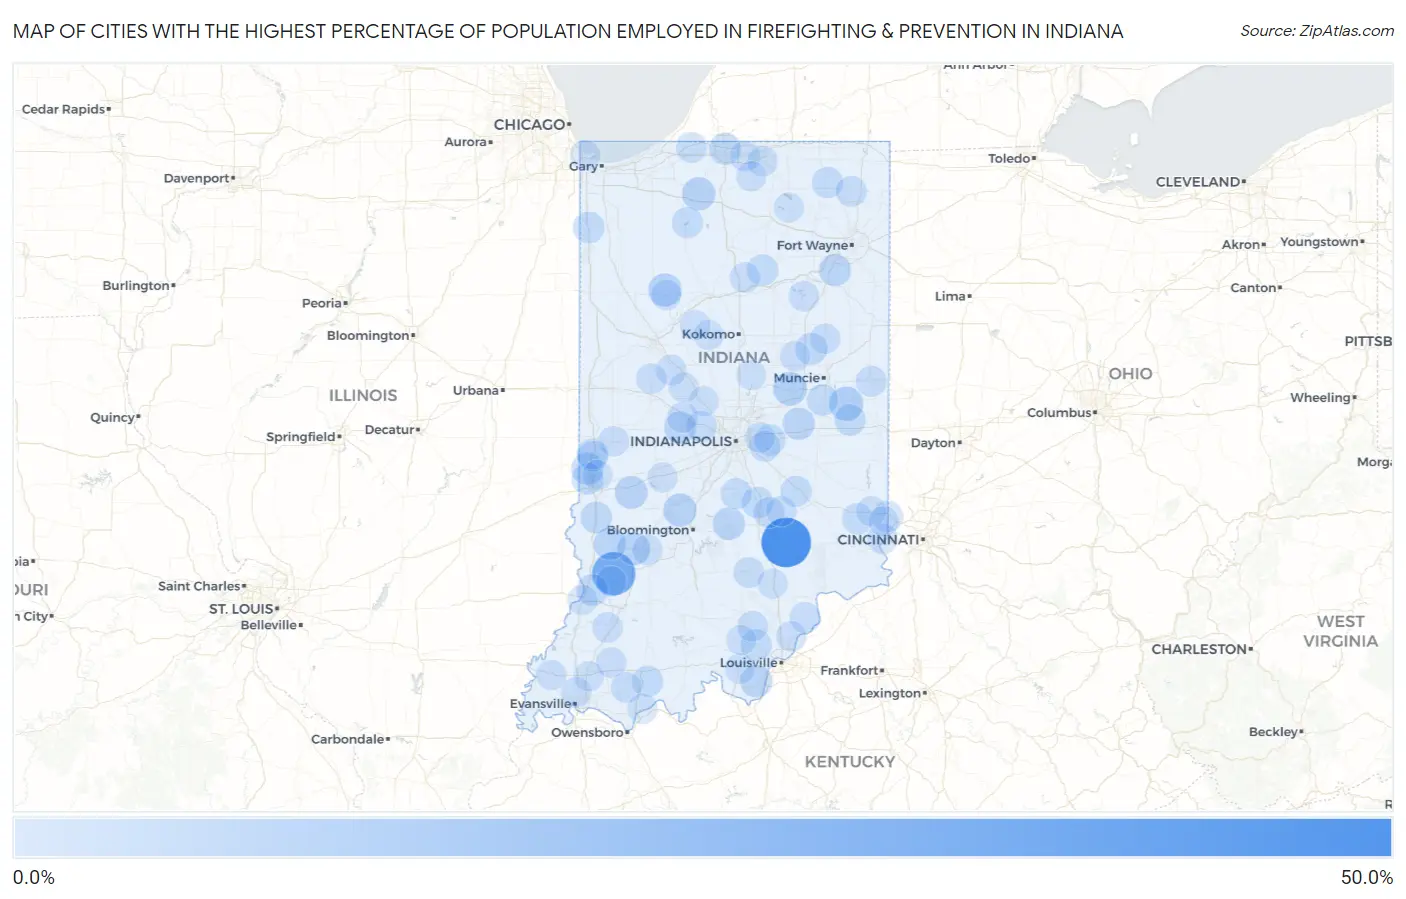
Map of Cities with the Highest Percentage of Population Employed in Firefighting & Prevention in Indiana
0.0%
50.0%
Cities with the Highest Percentage of Population Employed in Firefighting & Prevention in Indiana
| City | % Employed | vs State | vs National | |
| 1. | Scipio | 41.5% | 0.91%(+40.6)#1 | 1.2%(+40.3)#30 |
| 2. | Mays | 33.3% | 0.91%(+32.4)#2 | 1.2%(+32.1)#45 |
| 3. | Westphalia | 28.6% | 0.91%(+27.7)#3 | 1.2%(+27.4)#58 |
| 4. | Needmore | 27.1% | 0.91%(+26.2)#4 | 1.2%(+25.9)#63 |
| 5. | Flat Rock | 24.8% | 0.91%(+23.9)#5 | 1.2%(+23.6)#79 |
| 6. | Gwynneville | 17.5% | 0.91%(+16.6)#6 | 1.2%(+16.3)#144 |
| 7. | Homer | 17.5% | 0.91%(+16.5)#7 | 1.2%(+16.3)#146 |
| 8. | Wyatt | 14.3% | 0.91%(+13.4)#8 | 1.2%(+13.1)#223 |
| 9. | Petersville | 12.9% | 0.91%(+12.0)#9 | 1.2%(+11.7)#277 |
| 10. | Losantville | 9.6% | 0.91%(+8.72)#10 | 1.2%(+8.44)#448 |
| 11. | Glezen | 9.1% | 0.91%(+8.19)#11 | 1.2%(+7.91)#490 |
| 12. | Country Club Heights | 9.1% | 0.91%(+8.19)#12 | 1.2%(+7.91)#493 |
| 13. | Stinesville | 8.0% | 0.91%(+7.09)#13 | 1.2%(+6.81)#619 |
| 14. | Norway | 8.0% | 0.91%(+7.09)#14 | 1.2%(+6.81)#620 |
| 15. | Koontz Lake | 7.9% | 0.91%(+7.01)#15 | 1.2%(+6.73)#631 |
| 16. | Reddington | 7.1% | 0.91%(+6.15)#16 | 1.2%(+5.87)#747 |
| 17. | Center Point | 6.9% | 0.91%(+6.03)#17 | 1.2%(+5.75)#771 |
| 18. | Switz City | 6.9% | 0.91%(+6.01)#18 | 1.2%(+5.73)#773 |
| 19. | Dugger | 6.5% | 0.91%(+5.59)#19 | 1.2%(+5.31)#853 |
| 20. | Nashville | 6.4% | 0.91%(+5.49)#20 | 1.2%(+5.21)#872 |
| 21. | Elizabeth | 6.2% | 0.91%(+5.25)#21 | 1.2%(+4.97)#911 |
| 22. | New Goshen | 5.9% | 0.91%(+5.03)#22 | 1.2%(+4.75)#974 |
| 23. | Wilkinson | 5.9% | 0.91%(+5.02)#23 | 1.2%(+4.74)#975 |
| 24. | Ramsey | 5.8% | 0.91%(+4.91)#24 | 1.2%(+4.63)#1,013 |
| 25. | North Salem | 5.6% | 0.91%(+4.73)#25 | 1.2%(+4.45)#1,060 |
| 26. | Zanesville | 5.6% | 0.91%(+4.67)#26 | 1.2%(+4.39)#1,074 |
| 27. | Roseland | 5.5% | 0.91%(+4.59)#27 | 1.2%(+4.31)#1,099 |
| 28. | Matthews | 5.3% | 0.91%(+4.43)#28 | 1.2%(+4.15)#1,152 |
| 29. | Pleasant View | 5.2% | 0.91%(+4.34)#29 | 1.2%(+4.06)#1,192 |
| 30. | Farmersburg | 5.0% | 0.91%(+4.05)#30 | 1.2%(+3.77)#1,288 |
| 31. | Bruceville | 4.9% | 0.91%(+4.02)#31 | 1.2%(+3.74)#1,299 |
| 32. | St Mary Of The Woods | 4.8% | 0.91%(+3.93)#32 | 1.2%(+3.65)#1,345 |
| 33. | Edinburgh | 4.6% | 0.91%(+3.65)#33 | 1.2%(+3.37)#1,466 |
| 34. | Lakewood | 4.4% | 0.91%(+3.49)#34 | 1.2%(+3.21)#1,559 |
| 35. | Schneider | 4.4% | 0.91%(+3.49)#35 | 1.2%(+3.21)#1,564 |
| 36. | Hagerstown | 4.3% | 0.91%(+3.34)#36 | 1.2%(+3.06)#1,644 |
| 37. | Springport | 4.2% | 0.91%(+3.32)#37 | 1.2%(+3.04)#1,660 |
| 38. | Roann | 4.1% | 0.91%(+3.18)#38 | 1.2%(+2.90)#1,740 |
| 39. | Spring Lake | 4.1% | 0.91%(+3.18)#39 | 1.2%(+2.90)#1,741 |
| 40. | Greenville | 4.1% | 0.91%(+3.14)#40 | 1.2%(+2.86)#1,758 |
| 41. | Santa Claus | 4.0% | 0.91%(+3.12)#41 | 1.2%(+2.84)#1,777 |
| 42. | Rome City | 4.0% | 0.91%(+3.09)#42 | 1.2%(+2.81)#1,804 |
| 43. | Gilmer Park | 3.9% | 0.91%(+3.02)#43 | 1.2%(+2.74)#1,832 |
| 44. | Sunman | 3.8% | 0.91%(+2.89)#44 | 1.2%(+2.61)#1,931 |
| 45. | Bass Lake | 3.7% | 0.91%(+2.83)#45 | 1.2%(+2.55)#1,978 |
| 46. | St Paul | 3.7% | 0.91%(+2.77)#46 | 1.2%(+2.49)#2,046 |
| 47. | Trafalgar | 3.7% | 0.91%(+2.75)#47 | 1.2%(+2.47)#2,068 |
| 48. | Clifford | 3.5% | 0.91%(+2.57)#48 | 1.2%(+2.29)#2,233 |
| 49. | Fairview Park | 3.4% | 0.91%(+2.50)#49 | 1.2%(+2.22)#2,305 |
| 50. | West Harrison | 3.4% | 0.91%(+2.50)#50 | 1.2%(+2.22)#2,310 |
| 51. | New Palestine | 3.4% | 0.91%(+2.49)#51 | 1.2%(+2.21)#2,318 |
| 52. | Corunna | 3.3% | 0.91%(+2.39)#52 | 1.2%(+2.11)#2,417 |
| 53. | Hudson Lake | 3.3% | 0.91%(+2.38)#53 | 1.2%(+2.10)#2,422 |
| 54. | Pittsboro | 3.2% | 0.91%(+2.25)#54 | 1.2%(+1.97)#2,579 |
| 55. | Clinton | 3.1% | 0.91%(+2.19)#55 | 1.2%(+1.91)#2,642 |
| 56. | Winchester | 3.1% | 0.91%(+2.16)#56 | 1.2%(+1.88)#2,676 |
| 57. | Brownstown | 3.0% | 0.91%(+2.12)#57 | 1.2%(+1.84)#2,735 |
| 58. | New Pekin | 3.0% | 0.91%(+2.10)#58 | 1.2%(+1.82)#2,753 |
| 59. | Tennyson | 3.0% | 0.91%(+2.08)#59 | 1.2%(+1.80)#2,804 |
| 60. | Jamestown | 2.9% | 0.91%(+1.99)#60 | 1.2%(+1.71)#2,918 |
| 61. | New Washington | 2.8% | 0.91%(+1.89)#61 | 1.2%(+1.61)#3,033 |
| 62. | Clarks Hill | 2.8% | 0.91%(+1.88)#62 | 1.2%(+1.60)#3,065 |
| 63. | Petersburg | 2.7% | 0.91%(+1.79)#63 | 1.2%(+1.51)#3,197 |
| 64. | Linden | 2.7% | 0.91%(+1.79)#64 | 1.2%(+1.51)#3,207 |
| 65. | Spurgeon | 2.6% | 0.91%(+1.73)#65 | 1.2%(+1.45)#3,299 |
| 66. | Bloomfield | 2.5% | 0.91%(+1.60)#66 | 1.2%(+1.32)#3,546 |
| 67. | Charlestown | 2.5% | 0.91%(+1.59)#67 | 1.2%(+1.31)#3,567 |
| 68. | Denver | 2.5% | 0.91%(+1.59)#68 | 1.2%(+1.31)#3,589 |
| 69. | Rockville | 2.5% | 0.91%(+1.58)#69 | 1.2%(+1.30)#3,596 |
| 70. | Lawrenceburg | 2.5% | 0.91%(+1.56)#70 | 1.2%(+1.28)#3,622 |
| 71. | Poseyville | 2.5% | 0.91%(+1.55)#71 | 1.2%(+1.27)#3,640 |
| 72. | Mount Etna | 2.4% | 0.91%(+1.50)#72 | 1.2%(+1.22)#3,736 |
| 73. | Osceola | 2.4% | 0.91%(+1.49)#73 | 1.2%(+1.21)#3,762 |
| 74. | Edwardsport | 2.4% | 0.91%(+1.46)#74 | 1.2%(+1.18)#3,839 |
| 75. | Hope | 2.4% | 0.91%(+1.45)#75 | 1.2%(+1.17)#3,843 |
| 76. | Highland | 2.3% | 0.91%(+1.44)#76 | 1.2%(+1.16)#3,873 |
| 77. | Hartford City | 2.3% | 0.91%(+1.42)#77 | 1.2%(+1.14)#3,902 |
| 78. | Monticello | 2.3% | 0.91%(+1.40)#78 | 1.2%(+1.12)#3,959 |
| 79. | Summitville | 2.3% | 0.91%(+1.39)#79 | 1.2%(+1.11)#3,979 |
| 80. | Cumberland | 2.3% | 0.91%(+1.35)#80 | 1.2%(+1.07)#4,060 |
| 81. | Dunlap | 2.2% | 0.91%(+1.32)#81 | 1.2%(+1.04)#4,133 |
| 82. | Everton | 2.2% | 0.91%(+1.28)#82 | 1.2%(+0.996)#4,233 |
| 83. | Cloverdale | 2.2% | 0.91%(+1.27)#83 | 1.2%(+0.990)#4,244 |
| 84. | St Leon | 2.2% | 0.91%(+1.26)#84 | 1.2%(+0.979)#4,278 |
| 85. | Whiting | 2.1% | 0.91%(+1.24)#85 | 1.2%(+0.960)#4,330 |
| 86. | Bright | 2.1% | 0.91%(+1.23)#86 | 1.2%(+0.953)#4,354 |
| 87. | North Webster | 2.1% | 0.91%(+1.18)#87 | 1.2%(+0.902)#4,477 |
| 88. | Grandview | 2.1% | 0.91%(+1.17)#88 | 1.2%(+0.892)#4,508 |
| 89. | Elberfeld | 2.1% | 0.91%(+1.16)#89 | 1.2%(+0.878)#4,537 |
| 90. | Thorntown | 2.1% | 0.91%(+1.16)#90 | 1.2%(+0.876)#4,543 |
| 91. | Wakarusa | 2.1% | 0.91%(+1.15)#91 | 1.2%(+0.873)#4,558 |
| 92. | Vincennes | 2.1% | 0.91%(+1.15)#92 | 1.2%(+0.867)#4,577 |
| 93. | Crothersville | 2.0% | 0.91%(+1.11)#93 | 1.2%(+0.833)#4,673 |
| 94. | Corydon | 2.0% | 0.91%(+1.10)#94 | 1.2%(+0.823)#4,703 |
| 95. | Atlanta | 1.9% | 0.91%(+1.01)#95 | 1.2%(+0.731)#4,996 |
| 96. | Burlington | 1.9% | 0.91%(+1.01)#96 | 1.2%(+0.725)#5,020 |
| 97. | Lebanon | 1.9% | 0.91%(+0.998)#97 | 1.2%(+0.718)#5,044 |
| 98. | Palmyra | 1.9% | 0.91%(+0.993)#98 | 1.2%(+0.713)#5,058 |
| 99. | Flora | 1.9% | 0.91%(+0.976)#99 | 1.2%(+0.696)#5,114 |
| 100. | North Terre Haute | 1.9% | 0.91%(+0.973)#100 | 1.2%(+0.693)#5,122 |
Common Questions
What are the Top 10 Cities with the Highest Percentage of Population Employed in Firefighting & Prevention in Indiana?
Top 10 Cities with the Highest Percentage of Population Employed in Firefighting & Prevention in Indiana are:
#1
41.5%
#2
28.6%
#3
9.6%
#4
9.1%
#5
8.0%
#6
8.0%
#7
7.9%
#8
6.9%
#9
6.9%
#10
6.5%
What city has the Highest Percentage of Population Employed in Firefighting & Prevention in Indiana?
Scipio has the Highest Percentage of Population Employed in Firefighting & Prevention in Indiana with 41.5%.
What is the Percentage of Population Employed in Firefighting & Prevention in the State of Indiana?
Percentage of Population Employed in Firefighting & Prevention in Indiana is 0.91%.
What is the Percentage of Population Employed in Firefighting & Prevention in the United States?
Percentage of Population Employed in Firefighting & Prevention in the United States is 1.2%.