Charlestown, IN Map & Demographics
Charlestown Map
Charlestown Overview
$30,900
PER CAPITA INCOME
$78,889
AVG FAMILY INCOME
$66,285
AVG HOUSEHOLD INCOME
22.6%
WAGE / INCOME GAP [ % ]
77.4¢/ $1
WAGE / INCOME GAP [ $ ]
0.42
INEQUALITY / GINI INDEX
7,986
TOTAL POPULATION
3,626
MALE POPULATION
4,360
FEMALE POPULATION
83.17
MALES / 100 FEMALES
120.24
FEMALES / 100 MALES
37.4
MEDIAN AGE
3.2
AVG FAMILY SIZE
2.6
AVG HOUSEHOLD SIZE
3,957
LABOR FORCE [ PEOPLE ]
64.9%
PERCENT IN LABOR FORCE
1.9%
UNEMPLOYMENT RATE
Charlestown Zip Codes
Charlestown Area Codes
Income in Charlestown
Income Overview in Charlestown
Per Capita Income in Charlestown is $30,900, while median incomes of families and households are $78,889 and $66,285 respectively.
| Characteristic | Number | Measure |
| Per Capita Income | 7,986 | $30,900 |
| Median Family Income | 1,980 | $78,889 |
| Mean Family Income | 1,980 | $91,303 |
| Median Household Income | 3,051 | $66,285 |
| Mean Household Income | 3,051 | $75,767 |
| Income Deficit | 1,980 | $0 |
| Wage / Income Gap (%) | 7,986 | 22.59% |
| Wage / Income Gap ($) | 7,986 | 77.41¢ per $1 |
| Gini / Inequality Index | 7,986 | 0.42 |
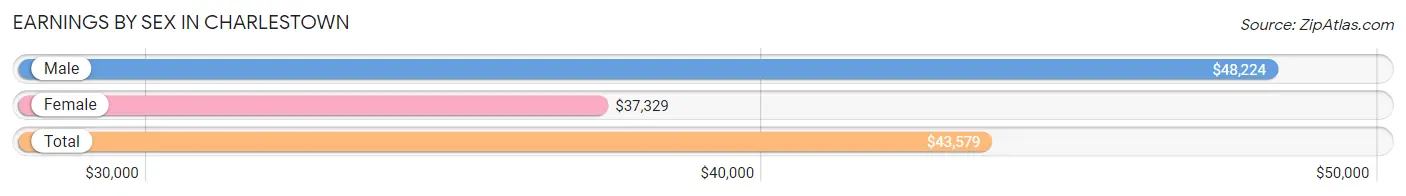
Earnings by Sex in Charlestown
Average Earnings in Charlestown are $43,579, $48,224 for men and $37,329 for women, a difference of 22.6%.
| Sex | Number | Average Earnings |
| Male | 1,992 (49.1%) | $48,224 |
| Female | 2,068 (50.9%) | $37,329 |
| Total | 4,060 (100.0%) | $43,579 |
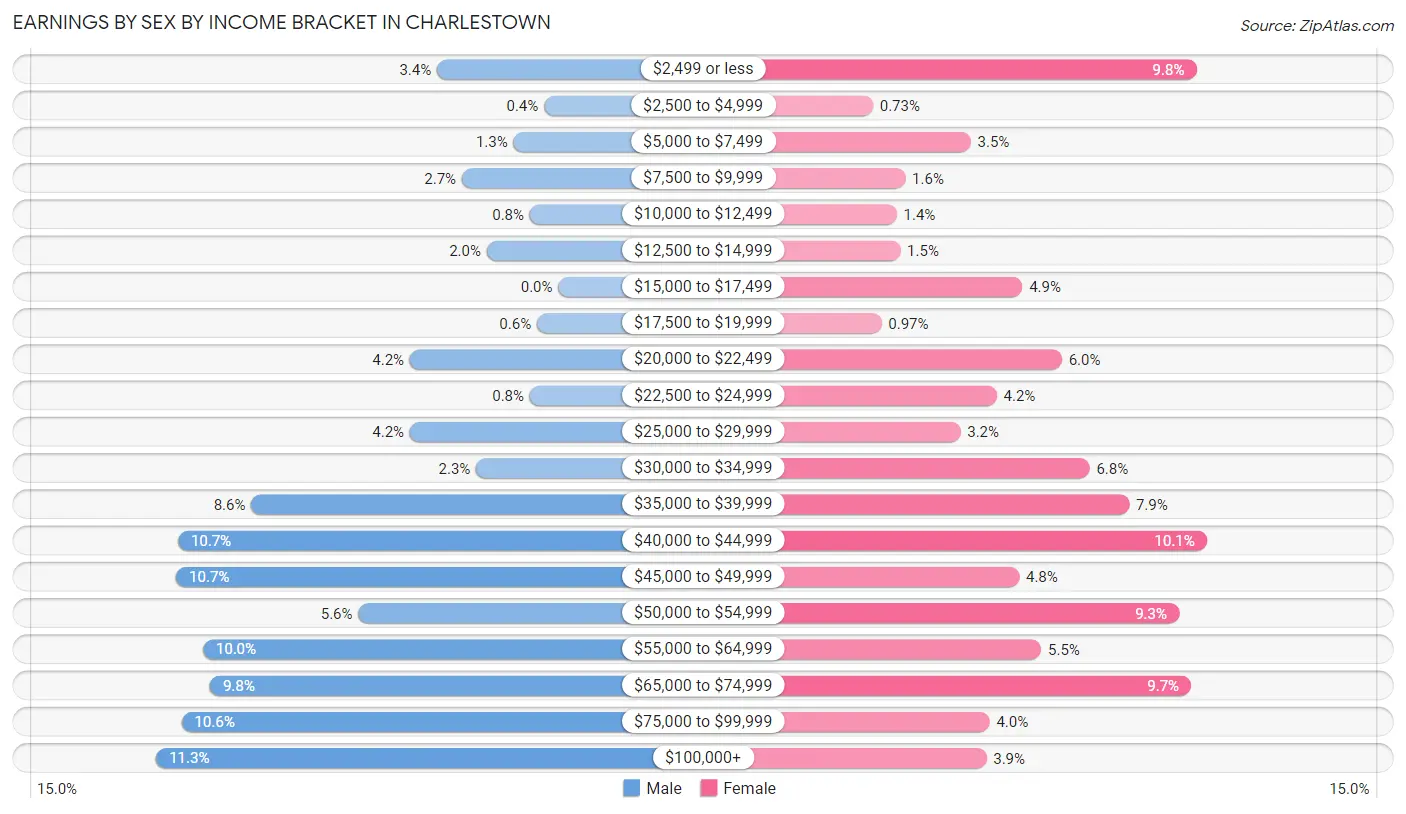
Earnings by Sex by Income Bracket in Charlestown
The most common earnings brackets in Charlestown are $100,000+ for men (225 | 11.3%) and $40,000 to $44,999 for women (209 | 10.1%).
| Income | Male | Female |
| $2,499 or less | 68 (3.4%) | 203 (9.8%) |
| $2,500 to $4,999 | 8 (0.4%) | 15 (0.7%) |
| $5,000 to $7,499 | 25 (1.3%) | 72 (3.5%) |
| $7,500 to $9,999 | 54 (2.7%) | 34 (1.6%) |
| $10,000 to $12,499 | 16 (0.8%) | 29 (1.4%) |
| $12,500 to $14,999 | 40 (2.0%) | 31 (1.5%) |
| $15,000 to $17,499 | 0 (0.0%) | 102 (4.9%) |
| $17,500 to $19,999 | 12 (0.6%) | 20 (1.0%) |
| $20,000 to $22,499 | 83 (4.2%) | 125 (6.0%) |
| $22,500 to $24,999 | 16 (0.8%) | 87 (4.2%) |
| $25,000 to $29,999 | 83 (4.2%) | 66 (3.2%) |
| $30,000 to $34,999 | 46 (2.3%) | 141 (6.8%) |
| $35,000 to $39,999 | 172 (8.6%) | 164 (7.9%) |
| $40,000 to $44,999 | 213 (10.7%) | 209 (10.1%) |
| $45,000 to $49,999 | 214 (10.7%) | 100 (4.8%) |
| $50,000 to $54,999 | 112 (5.6%) | 193 (9.3%) |
| $55,000 to $64,999 | 199 (10.0%) | 113 (5.5%) |
| $65,000 to $74,999 | 195 (9.8%) | 200 (9.7%) |
| $75,000 to $99,999 | 211 (10.6%) | 83 (4.0%) |
| $100,000+ | 225 (11.3%) | 81 (3.9%) |
| Total | 1,992 (100.0%) | 2,068 (100.0%) |
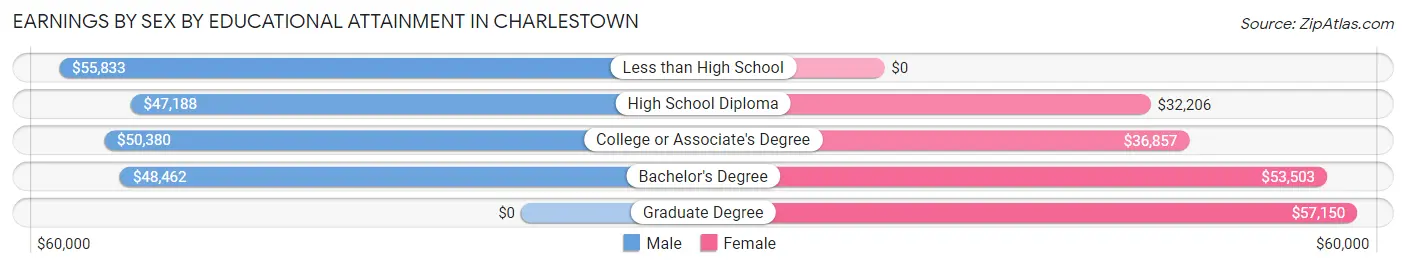
Earnings by Sex by Educational Attainment in Charlestown
Average earnings in Charlestown are $52,547 for men and $41,194 for women, a difference of 21.6%. Men with an educational attainment of less than high school enjoy the highest average annual earnings of $55,833, while those with high school diploma education earn the least with $47,188. Women with an educational attainment of graduate degree earn the most with the average annual earnings of $57,150, while those with high school diploma education have the smallest earnings of $32,206.
| Educational Attainment | Male Income | Female Income |
| Less than High School | $55,833 | $0 |
| High School Diploma | $47,188 | $32,206 |
| College or Associate's Degree | $50,380 | $36,857 |
| Bachelor's Degree | $48,462 | $53,503 |
| Graduate Degree | - | - |
| Total | $52,547 | $41,194 |
Family Income in Charlestown
Family Income Brackets in Charlestown
According to the Charlestown family income data, there are 463 families falling into the $100,000 to $149,999 income range, which is the most common income bracket and makes up 23.4% of all families. Conversely, the $15,000 to $24,999 income bracket is the least frequent group with only 16 families (0.8%) belonging to this category.
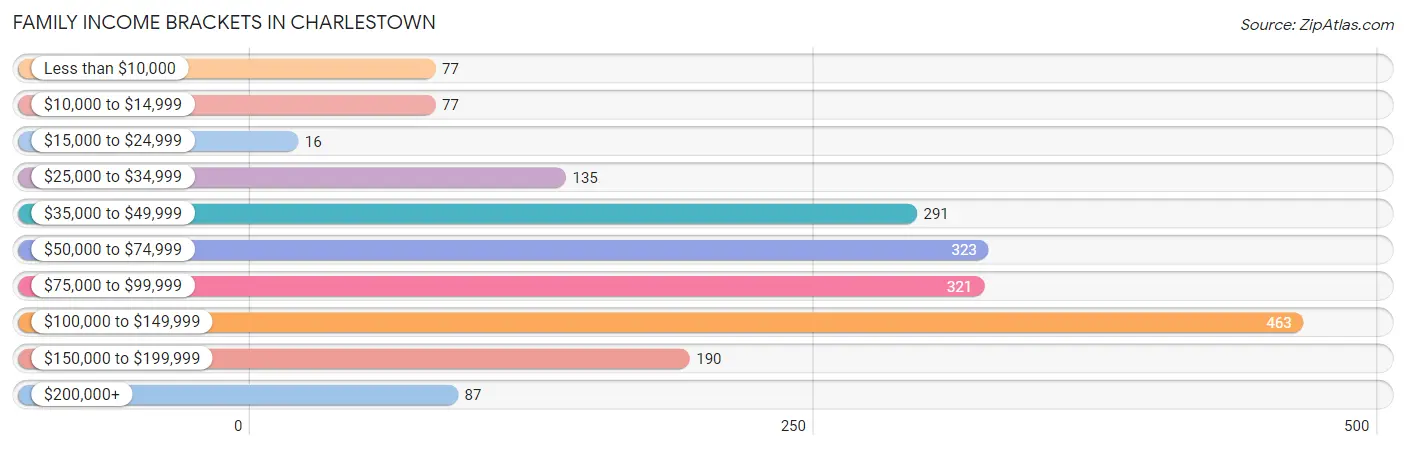
| Income Bracket | # Families | % Families |
| Less than $10,000 | 77 | 3.9% |
| $10,000 to $14,999 | 77 | 3.9% |
| $15,000 to $24,999 | 16 | 0.8% |
| $25,000 to $34,999 | 135 | 6.8% |
| $35,000 to $49,999 | 291 | 14.7% |
| $50,000 to $74,999 | 323 | 16.3% |
| $75,000 to $99,999 | 321 | 16.2% |
| $100,000 to $149,999 | 463 | 23.4% |
| $150,000 to $199,999 | 190 | 9.6% |
| $200,000+ | 87 | 4.4% |
Family Income by Famaliy Size in Charlestown
3-person families (463 | 23.4%) account for the highest median family income in Charlestown with $124,330 per family, while 3-person families (463 | 23.4%) have the highest median income of $41,443 per family member.
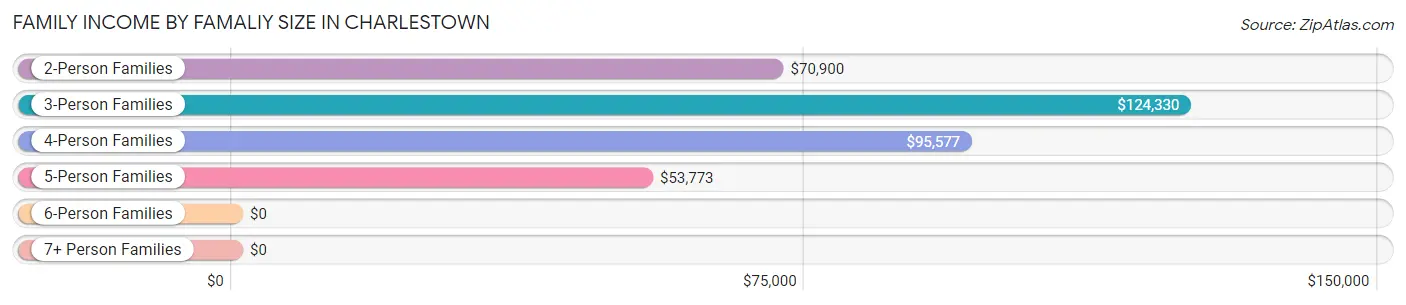
| Income Bracket | # Families | Median Income |
| 2-Person Families | 1,088 (54.9%) | $70,900 |
| 3-Person Families | 463 (23.4%) | $124,330 |
| 4-Person Families | 236 (11.9%) | $95,577 |
| 5-Person Families | 151 (7.6%) | $53,773 |
| 6-Person Families | 25 (1.3%) | $0 |
| 7+ Person Families | 17 (0.9%) | $0 |
| Total | 1,980 (100.0%) | $78,889 |
Family Income by Number of Earners in Charlestown
The median family income in Charlestown is $78,889, with families comprising 3+ earners (161) having the highest median family income of $142,279, while families with no earners (258) have the lowest median family income of $48,409, accounting for 8.1% and 13.0% of families, respectively.
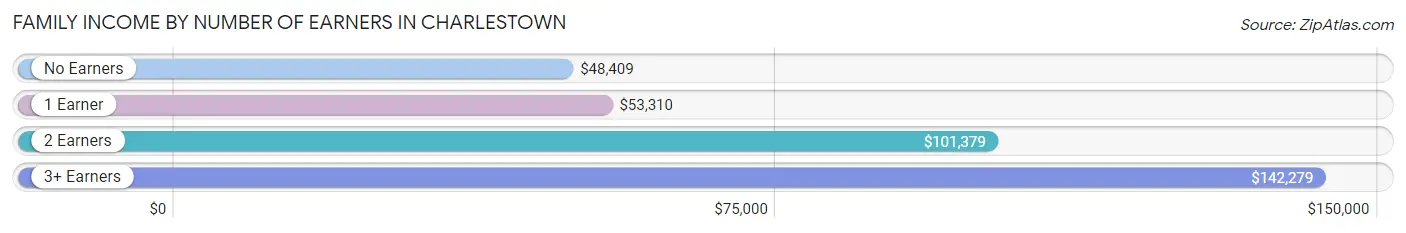
| Number of Earners | # Families | Median Income |
| No Earners | 258 (13.0%) | $48,409 |
| 1 Earner | 782 (39.5%) | $53,310 |
| 2 Earners | 779 (39.3%) | $101,379 |
| 3+ Earners | 161 (8.1%) | $142,279 |
| Total | 1,980 (100.0%) | $78,889 |
Household Income in Charlestown
Household Income Brackets in Charlestown
With 555 households falling in the category, the $100,000 to $149,999 income range is the most frequent in Charlestown, accounting for 18.2% of all households. In contrast, only 88 households (2.9%) fall into the $200,000+ income bracket, making it the least populous group.
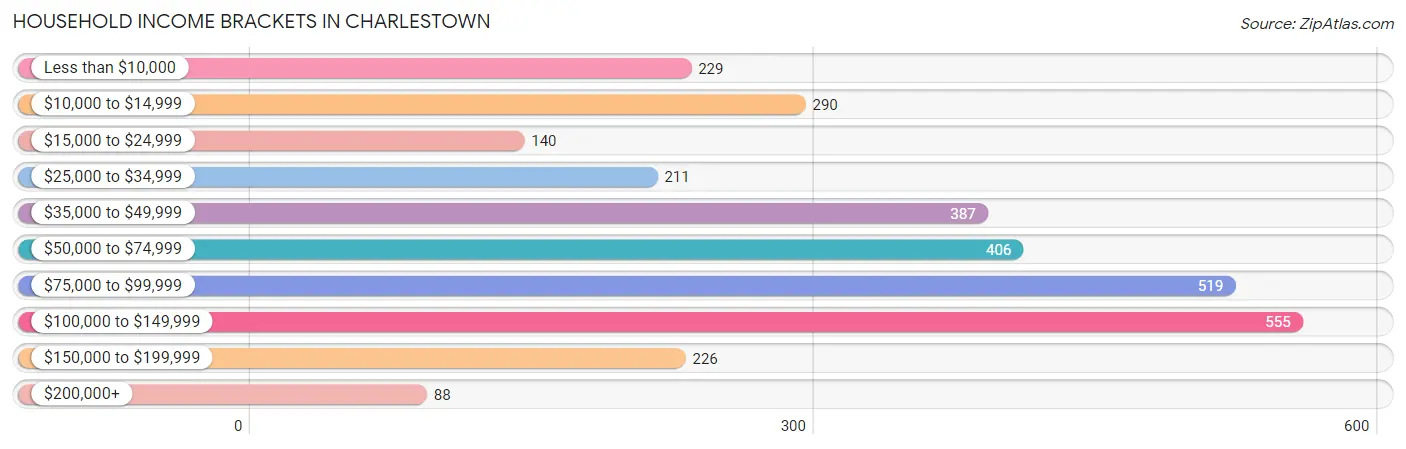
| Income Bracket | # Households | % Households |
| Less than $10,000 | 229 | 7.5% |
| $10,000 to $14,999 | 290 | 9.5% |
| $15,000 to $24,999 | 140 | 4.6% |
| $25,000 to $34,999 | 211 | 6.9% |
| $35,000 to $49,999 | 387 | 12.7% |
| $50,000 to $74,999 | 406 | 13.3% |
| $75,000 to $99,999 | 519 | 17.0% |
| $100,000 to $149,999 | 555 | 18.2% |
| $150,000 to $199,999 | 226 | 7.4% |
| $200,000+ | 88 | 2.9% |
Household Income by Householder Age in Charlestown
The median household income in Charlestown is $66,285, with the highest median household income of $89,118 found in the 25 to 44 years age bracket for the primary householder. A total of 994 households (32.6%) fall into this category. Meanwhile, the 65+ years age bracket for the primary householder has the lowest median household income of $33,466, with 763 households (25.0%) in this group.
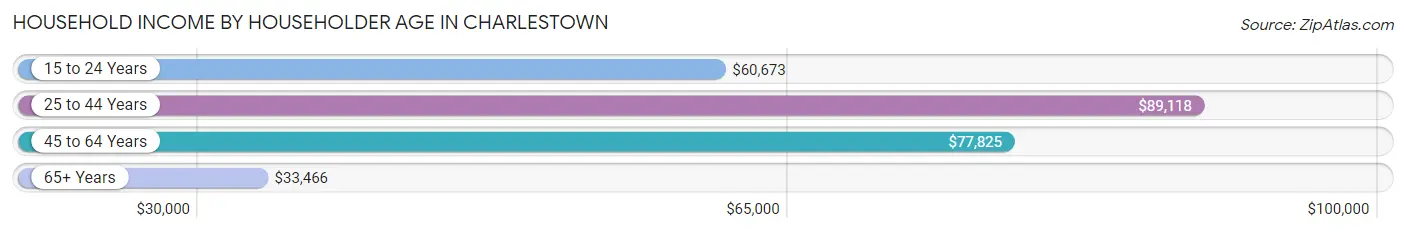
| Income Bracket | # Households | Median Income |
| 15 to 24 Years | 65 (2.1%) | $60,673 |
| 25 to 44 Years | 994 (32.6%) | $89,118 |
| 45 to 64 Years | 1,229 (40.3%) | $77,825 |
| 65+ Years | 763 (25.0%) | $33,466 |
| Total | 3,051 (100.0%) | $66,285 |
Poverty in Charlestown
Income Below Poverty by Sex and Age in Charlestown
With 12.4% poverty level for males and 16.3% for females among the residents of Charlestown, 15 year old males and 65 to 74 year old females are the most vulnerable to poverty, with 28 males (54.9%) and 182 females (49.9%) in their respective age groups living below the poverty level.
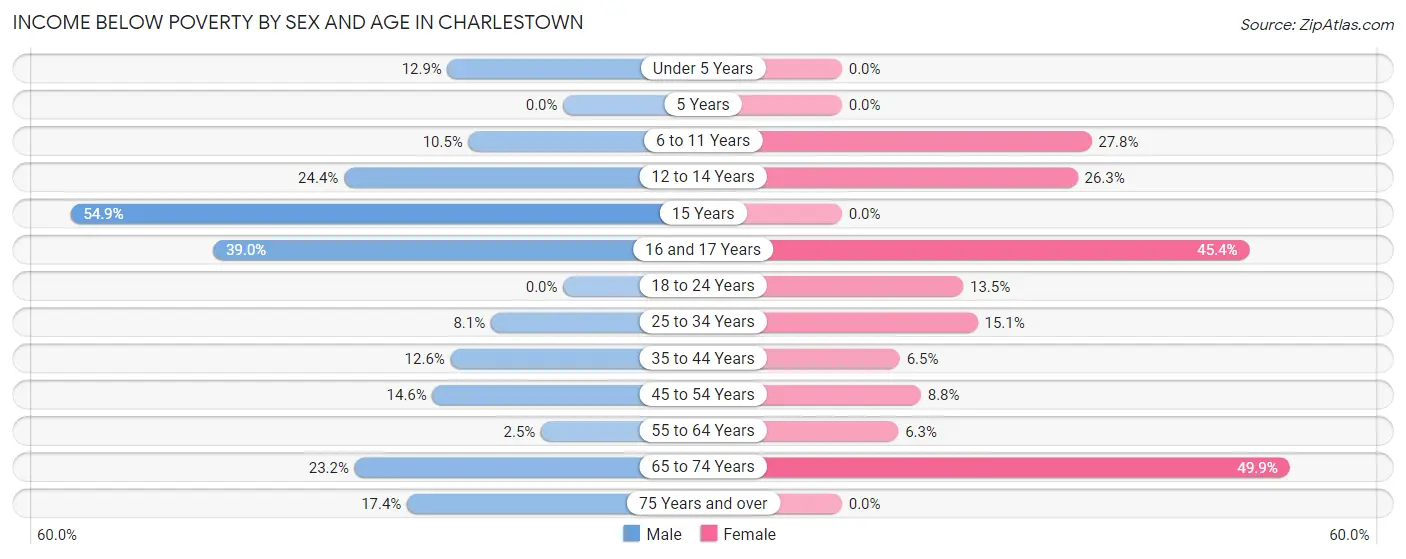
| Age Bracket | Male | Female |
| Under 5 Years | 30 (12.9%) | 0 (0.0%) |
| 5 Years | 0 (0.0%) | 0 (0.0%) |
| 6 to 11 Years | 39 (10.5%) | 112 (27.8%) |
| 12 to 14 Years | 62 (24.4%) | 84 (26.3%) |
| 15 Years | 28 (54.9%) | 0 (0.0%) |
| 16 and 17 Years | 16 (39.0%) | 64 (45.4%) |
| 18 to 24 Years | 0 (0.0%) | 42 (13.5%) |
| 25 to 34 Years | 43 (8.1%) | 91 (15.1%) |
| 35 to 44 Years | 65 (12.6%) | 35 (6.5%) |
| 45 to 54 Years | 61 (14.6%) | 50 (8.8%) |
| 55 to 64 Years | 14 (2.5%) | 41 (6.3%) |
| 65 to 74 Years | 69 (23.2%) | 182 (49.9%) |
| 75 Years and over | 20 (17.4%) | 0 (0.0%) |
| Total | 447 (12.4%) | 701 (16.3%) |
Income Above Poverty by Sex and Age in Charlestown
According to the poverty statistics in Charlestown, males aged 18 to 24 years and females aged under 5 years are the age groups that are most secure financially, with 100.0% of males and 100.0% of females in these age groups living above the poverty line.
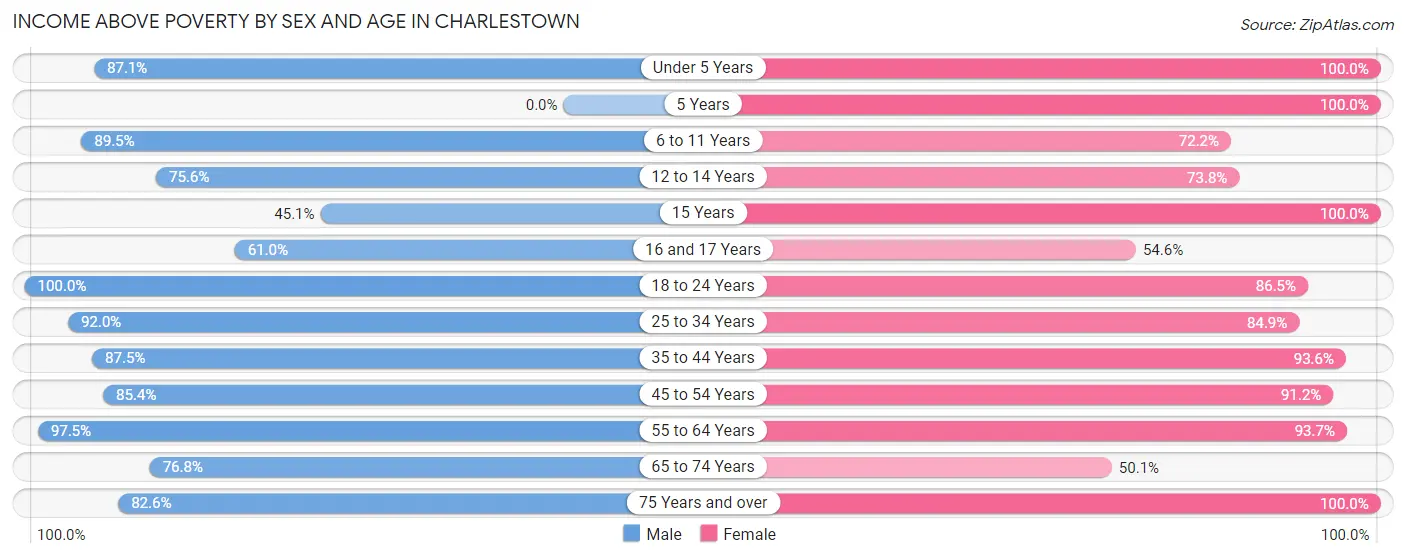
| Age Bracket | Male | Female |
| Under 5 Years | 203 (87.1%) | 108 (100.0%) |
| 5 Years | 0 (0.0%) | 87 (100.0%) |
| 6 to 11 Years | 331 (89.5%) | 291 (72.2%) |
| 12 to 14 Years | 192 (75.6%) | 236 (73.8%) |
| 15 Years | 23 (45.1%) | 11 (100.0%) |
| 16 and 17 Years | 25 (61.0%) | 77 (54.6%) |
| 18 to 24 Years | 208 (100.0%) | 269 (86.5%) |
| 25 to 34 Years | 491 (91.9%) | 511 (84.9%) |
| 35 to 44 Years | 453 (87.5%) | 508 (93.5%) |
| 45 to 54 Years | 358 (85.4%) | 518 (91.2%) |
| 55 to 64 Years | 552 (97.5%) | 612 (93.7%) |
| 65 to 74 Years | 228 (76.8%) | 183 (50.1%) |
| 75 Years and over | 95 (82.6%) | 199 (100.0%) |
| Total | 3,159 (87.6%) | 3,610 (83.7%) |
Income Below Poverty Among Married-Couple Families in Charlestown
The poverty statistics for married-couple families in Charlestown show that 0.8% or 10 of the total 1,189 families live below the poverty line. Families with 1 or 2 children have the highest poverty rate of 3.1%, comprising of 10 families. On the other hand, families with no children have the lowest poverty rate of 0.0%, which includes 0 families.
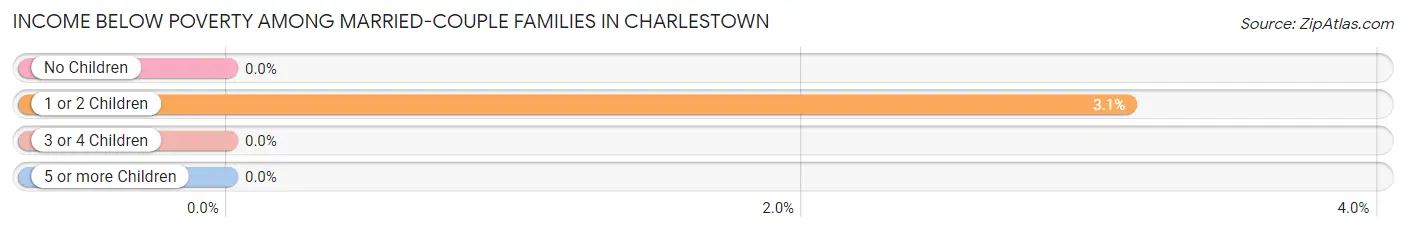
| Children | Above Poverty | Below Poverty |
| No Children | 800 (100.0%) | 0 (0.0%) |
| 1 or 2 Children | 309 (96.9%) | 10 (3.1%) |
| 3 or 4 Children | 70 (100.0%) | 0 (0.0%) |
| 5 or more Children | 0 (0.0%) | 0 (0.0%) |
| Total | 1,179 (99.2%) | 10 (0.8%) |
Income Below Poverty Among Single-Parent Households in Charlestown
According to the poverty data in Charlestown, 12.3% or 45 single-father households and 29.9% or 127 single-mother households are living below the poverty line. Among single-father households, those with 3 or 4 children have the highest poverty rate, with 37 households (40.7%) experiencing poverty. Likewise, among single-mother households, those with 3 or 4 children have the highest poverty rate, with 46 households (100.0%) falling below the poverty line.
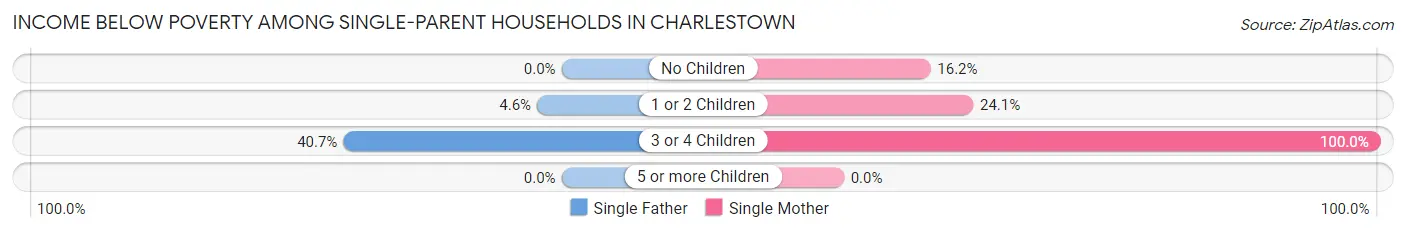
| Children | Single Father | Single Mother |
| No Children | 0 (0.0%) | 21 (16.2%) |
| 1 or 2 Children | 8 (4.6%) | 60 (24.1%) |
| 3 or 4 Children | 37 (40.7%) | 46 (100.0%) |
| 5 or more Children | 0 (0.0%) | 0 (0.0%) |
| Total | 45 (12.3%) | 127 (29.9%) |
Income Below Poverty Among Married-Couple vs Single-Parent Households in Charlestown
The poverty data for Charlestown shows that 10 of the married-couple family households (0.8%) and 172 of the single-parent households (21.7%) are living below the poverty level. Within the married-couple family households, those with 1 or 2 children have the highest poverty rate, with 10 households (3.1%) falling below the poverty line. Among the single-parent households, those with 3 or 4 children have the highest poverty rate, with 83 household (60.6%) living below poverty.
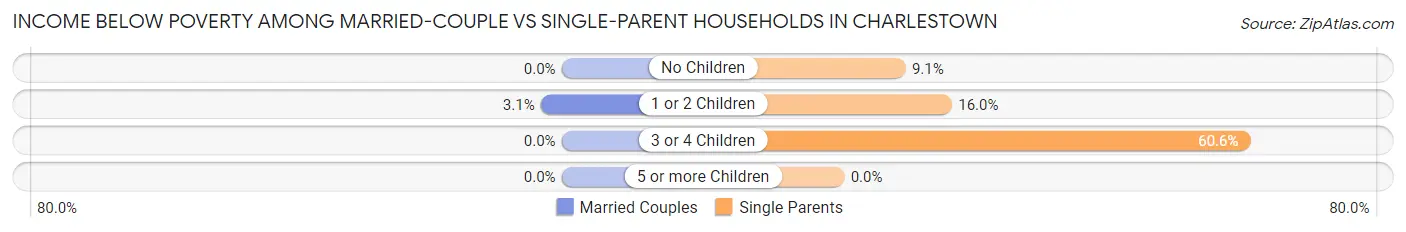
| Children | Married-Couple Families | Single-Parent Households |
| No Children | 0 (0.0%) | 21 (9.1%) |
| 1 or 2 Children | 10 (3.1%) | 68 (16.0%) |
| 3 or 4 Children | 0 (0.0%) | 83 (60.6%) |
| 5 or more Children | 0 (0.0%) | 0 (0.0%) |
| Total | 10 (0.8%) | 172 (21.7%) |
Race in Charlestown
The most populous races in Charlestown are White / Caucasian (6,785 | 85.0%), Two or more Races (529 | 6.6%), and Hispanic or Latino (375 | 4.7%).
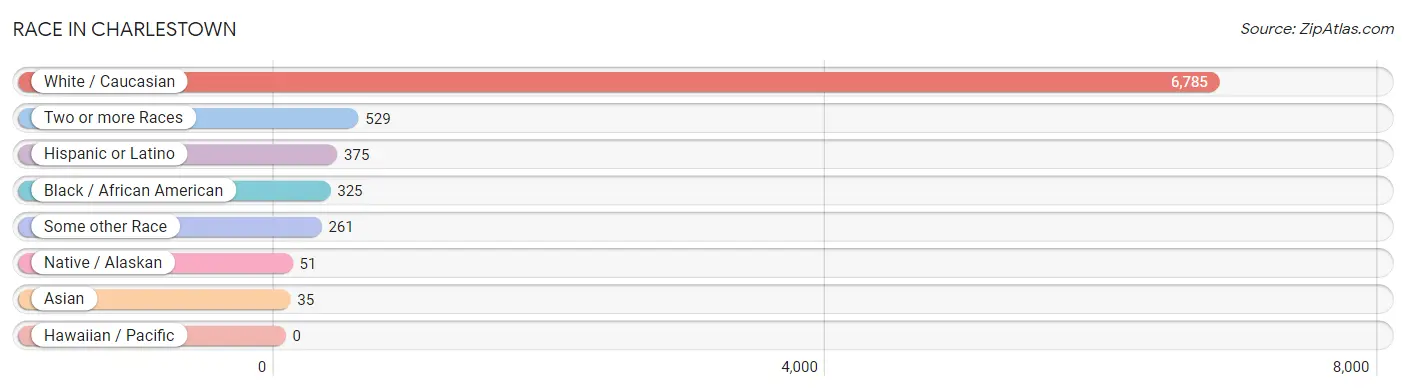
| Race | # Population | % Population |
| Asian | 35 | 0.4% |
| Black / African American | 325 | 4.1% |
| Hawaiian / Pacific | 0 | 0.0% |
| Hispanic or Latino | 375 | 4.7% |
| Native / Alaskan | 51 | 0.6% |
| White / Caucasian | 6,785 | 85.0% |
| Two or more Races | 529 | 6.6% |
| Some other Race | 261 | 3.3% |
| Total | 7,986 | 100.0% |
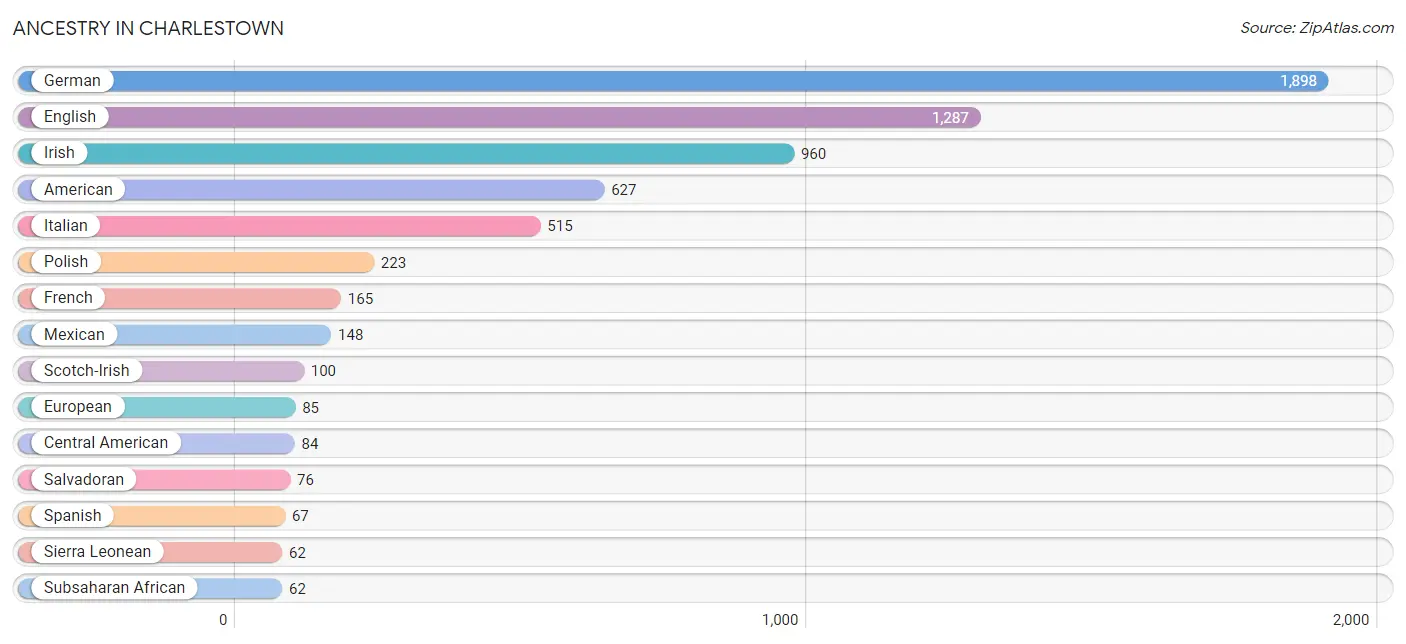
Ancestry in Charlestown
The most populous ancestries reported in Charlestown are German (1,898 | 23.8%), English (1,287 | 16.1%), Irish (960 | 12.0%), American (627 | 7.9%), and Italian (515 | 6.5%), together accounting for 66.2% of all Charlestown residents.
| Ancestry | # Population | % Population |
| American | 627 | 7.9% |
| Bhutanese | 33 | 0.4% |
| Blackfeet | 42 | 0.5% |
| British | 12 | 0.2% |
| Burmese | 19 | 0.2% |
| Central American | 84 | 1.1% |
| Cherokee | 58 | 0.7% |
| Danish | 21 | 0.3% |
| Dutch | 19 | 0.2% |
| Eastern European | 24 | 0.3% |
| English | 1,287 | 16.1% |
| European | 85 | 1.1% |
| French | 165 | 2.1% |
| German | 1,898 | 23.8% |
| Greek | 8 | 0.1% |
| Haitian | 31 | 0.4% |
| Hungarian | 17 | 0.2% |
| Irish | 960 | 12.0% |
| Italian | 515 | 6.5% |
| Kiowa | 11 | 0.1% |
| Mexican | 148 | 1.8% |
| Native Hawaiian | 19 | 0.2% |
| Navajo | 13 | 0.2% |
| Norwegian | 18 | 0.2% |
| Panamanian | 8 | 0.1% |
| Polish | 223 | 2.8% |
| Salvadoran | 76 | 0.9% |
| Scandinavian | 10 | 0.1% |
| Scotch-Irish | 100 | 1.3% |
| Scottish | 35 | 0.4% |
| Sierra Leonean | 62 | 0.8% |
| Slovak | 18 | 0.2% |
| Spaniard | 8 | 0.1% |
| Spanish | 67 | 0.8% |
| Subsaharan African | 62 | 0.8% |
| Swiss | 17 | 0.2% |
| Ukrainian | 10 | 0.1% | View All 37 Rows |
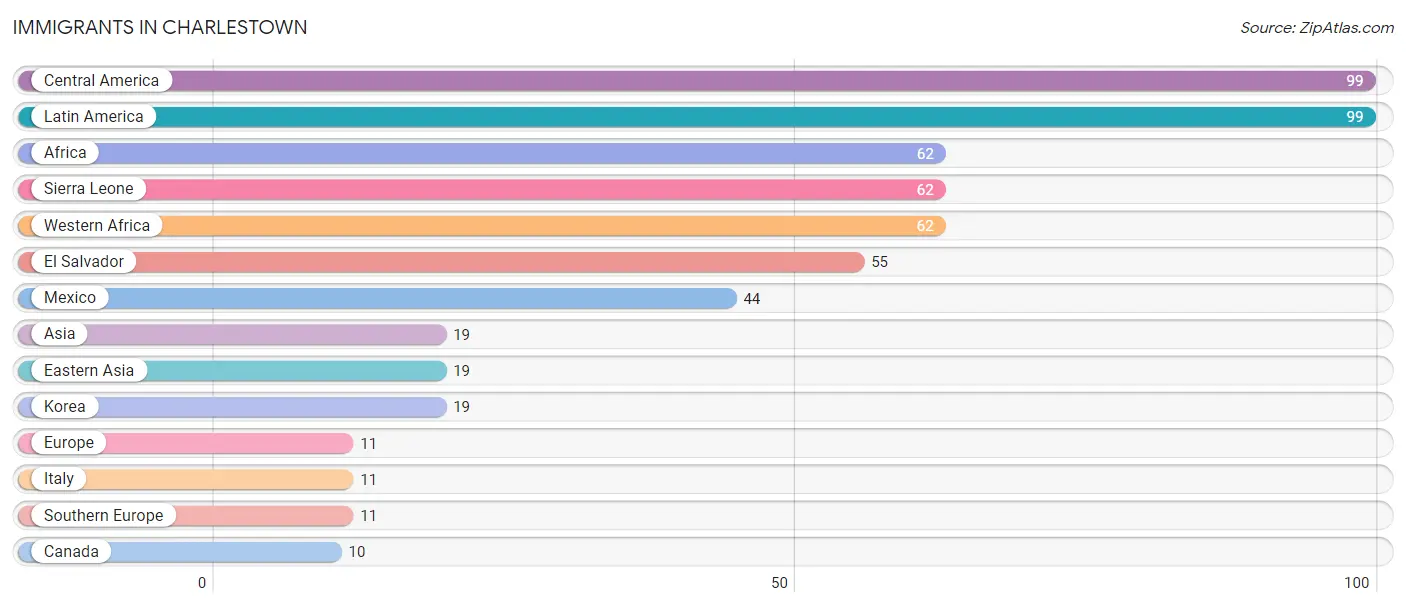
Immigrants in Charlestown
The most numerous immigrant groups reported in Charlestown came from Central America (99 | 1.2%), Latin America (99 | 1.2%), Africa (62 | 0.8%), Sierra Leone (62 | 0.8%), and Western Africa (62 | 0.8%), together accounting for 4.8% of all Charlestown residents.
| Immigration Origin | # Population | % Population |
| Africa | 62 | 0.8% |
| Asia | 19 | 0.2% |
| Canada | 10 | 0.1% |
| Central America | 99 | 1.2% |
| Eastern Asia | 19 | 0.2% |
| El Salvador | 55 | 0.7% |
| Europe | 11 | 0.1% |
| Italy | 11 | 0.1% |
| Korea | 19 | 0.2% |
| Latin America | 99 | 1.2% |
| Mexico | 44 | 0.5% |
| Sierra Leone | 62 | 0.8% |
| Southern Europe | 11 | 0.1% |
| Western Africa | 62 | 0.8% | View All 14 Rows |
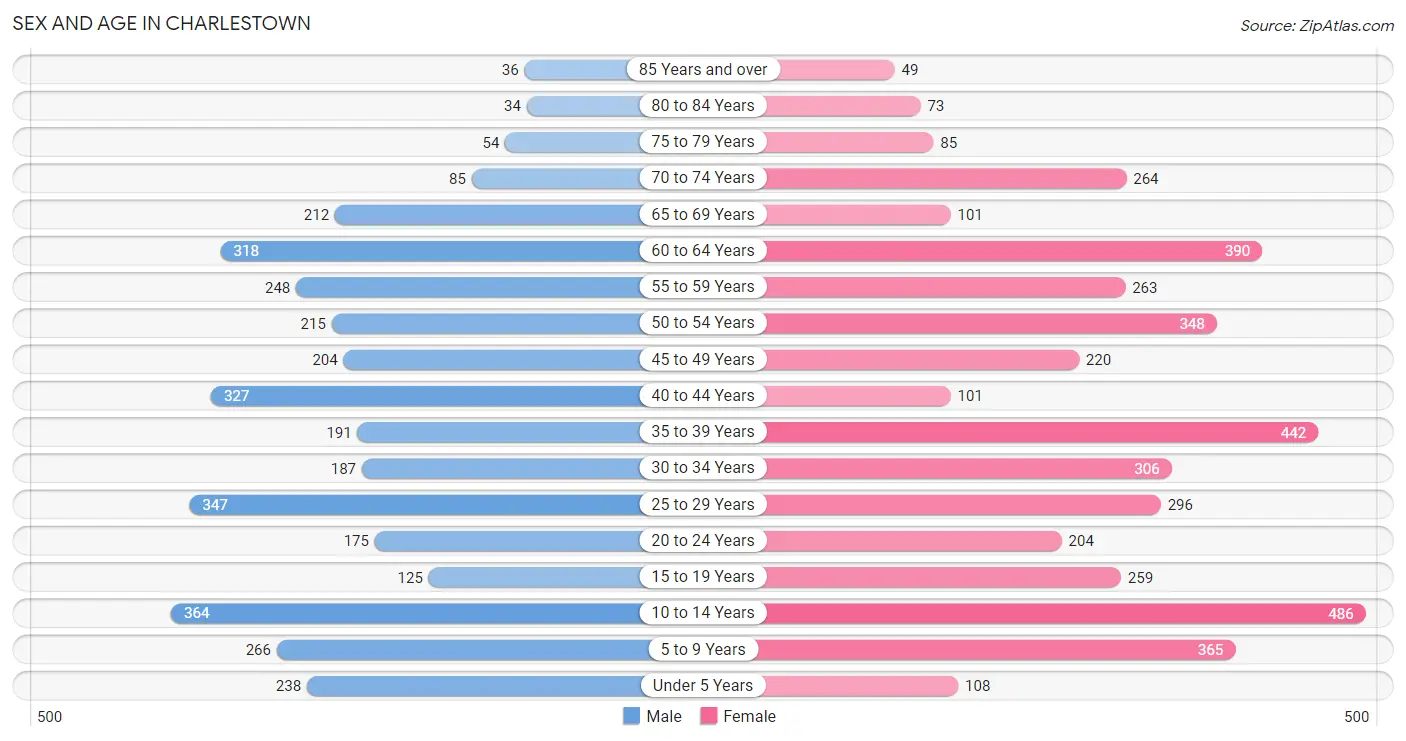
Sex and Age in Charlestown
Sex and Age in Charlestown
The most populous age groups in Charlestown are 10 to 14 Years (364 | 10.0%) for men and 10 to 14 Years (486 | 11.2%) for women.
| Age Bracket | Male | Female |
| Under 5 Years | 238 (6.6%) | 108 (2.5%) |
| 5 to 9 Years | 266 (7.3%) | 365 (8.4%) |
| 10 to 14 Years | 364 (10.0%) | 486 (11.2%) |
| 15 to 19 Years | 125 (3.5%) | 259 (5.9%) |
| 20 to 24 Years | 175 (4.8%) | 204 (4.7%) |
| 25 to 29 Years | 347 (9.6%) | 296 (6.8%) |
| 30 to 34 Years | 187 (5.2%) | 306 (7.0%) |
| 35 to 39 Years | 191 (5.3%) | 442 (10.1%) |
| 40 to 44 Years | 327 (9.0%) | 101 (2.3%) |
| 45 to 49 Years | 204 (5.6%) | 220 (5.1%) |
| 50 to 54 Years | 215 (5.9%) | 348 (8.0%) |
| 55 to 59 Years | 248 (6.8%) | 263 (6.0%) |
| 60 to 64 Years | 318 (8.8%) | 390 (8.9%) |
| 65 to 69 Years | 212 (5.9%) | 101 (2.3%) |
| 70 to 74 Years | 85 (2.3%) | 264 (6.1%) |
| 75 to 79 Years | 54 (1.5%) | 85 (1.9%) |
| 80 to 84 Years | 34 (0.9%) | 73 (1.7%) |
| 85 Years and over | 36 (1.0%) | 49 (1.1%) |
| Total | 3,626 (100.0%) | 4,360 (100.0%) |
Families and Households in Charlestown
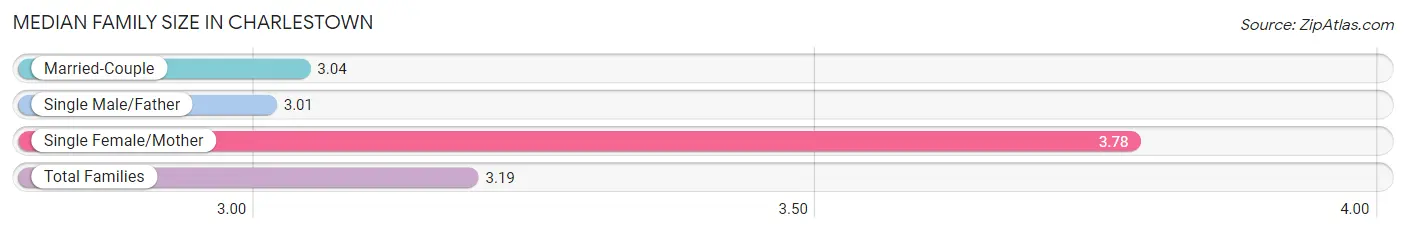
Median Family Size in Charlestown
The median family size in Charlestown is 3.19 persons per family, with single female/mother families (425 | 21.5%) accounting for the largest median family size of 3.78 persons per family. On the other hand, single male/father families (366 | 18.5%) represent the smallest median family size with 3.01 persons per family.
| Family Type | # Families | Family Size |
| Married-Couple | 1,189 (60.1%) | 3.04 |
| Single Male/Father | 366 (18.5%) | 3.01 |
| Single Female/Mother | 425 (21.5%) | 3.78 |
| Total Families | 1,980 (100.0%) | 3.19 |
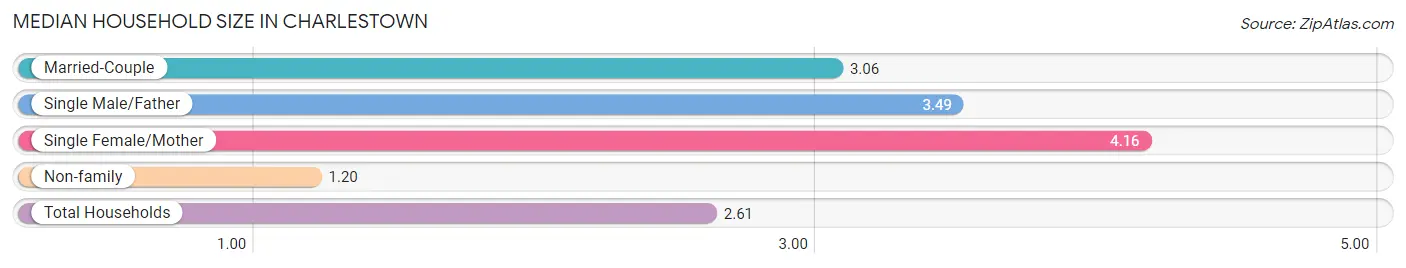
Median Household Size in Charlestown
The median household size in Charlestown is 2.61 persons per household, with single female/mother households (425 | 13.9%) accounting for the largest median household size of 4.16 persons per household. non-family households (1,071 | 35.1%) represent the smallest median household size with 1.20 persons per household.
| Household Type | # Households | Household Size |
| Married-Couple | 1,189 (39.0%) | 3.06 |
| Single Male/Father | 366 (12.0%) | 3.49 |
| Single Female/Mother | 425 (13.9%) | 4.16 |
| Non-family | 1,071 (35.1%) | 1.20 |
| Total Households | 3,051 (100.0%) | 2.61 |
Household Size by Marriage Status in Charlestown
Out of a total of 3,051 households in Charlestown, 1,980 (64.9%) are family households, while 1,071 (35.1%) are nonfamily households. The most numerous type of family households are 2-person households, comprising 958, and the most common type of nonfamily households are 1-person households, comprising 898.
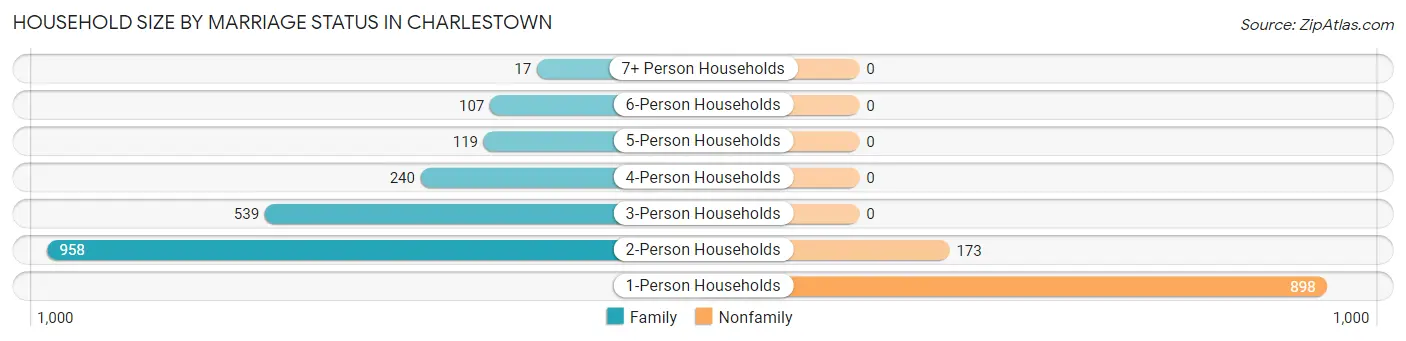
| Household Size | Family Households | Nonfamily Households |
| 1-Person Households | - | 898 (29.4%) |
| 2-Person Households | 958 (31.4%) | 173 (5.7%) |
| 3-Person Households | 539 (17.7%) | 0 (0.0%) |
| 4-Person Households | 240 (7.9%) | 0 (0.0%) |
| 5-Person Households | 119 (3.9%) | 0 (0.0%) |
| 6-Person Households | 107 (3.5%) | 0 (0.0%) |
| 7+ Person Households | 17 (0.6%) | 0 (0.0%) |
| Total | 1,980 (64.9%) | 1,071 (35.1%) |
Female Fertility in Charlestown
Fertility by Age in Charlestown
Average fertility rate in Charlestown is 15.0 births per 1,000 women. Women in the age bracket of 20 to 34 years have the highest fertility rate with 36.0 births per 1,000 women. Women in the age bracket of 20 to 34 years acount for 100.0% of all women with births.
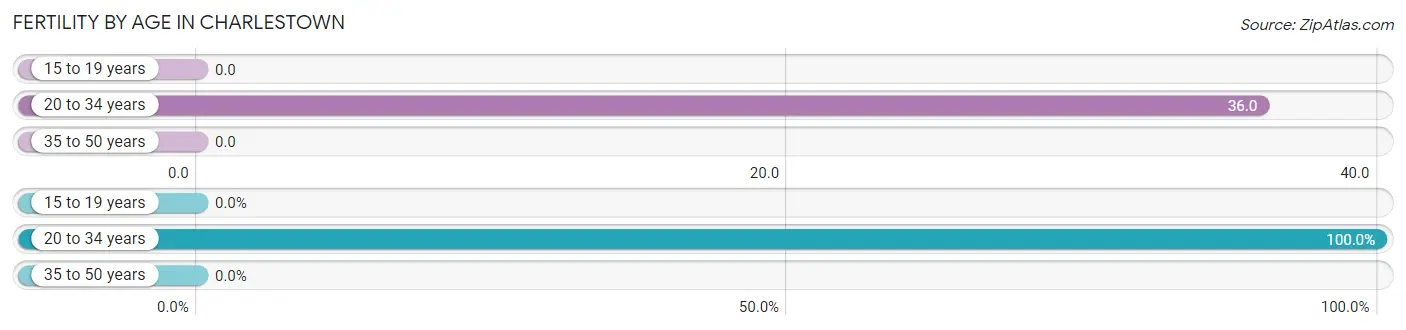
| Age Bracket | Women with Births | Births / 1,000 Women |
| 15 to 19 years | 0 (0.0%) | 0.0 |
| 20 to 34 years | 29 (100.0%) | 36.0 |
| 35 to 50 years | 0 (0.0%) | 0.0 |
| Total | 29 (100.0%) | 15.0 |
Fertility by Age by Marriage Status in Charlestown
37.9% of women with births (29) in Charlestown are married. The highest percentage of unmarried women with births falls into 20 to 34 years age bracket with 62.1% of them unmarried at the time of birth, while the lowest percentage of unmarried women with births belong to 20 to 34 years age bracket with 62.1% of them unmarried.
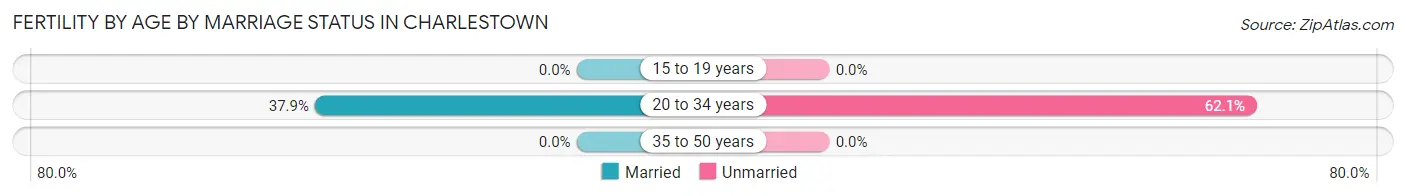
| Age Bracket | Married | Unmarried |
| 15 to 19 years | 0 (0.0%) | 0 (0.0%) |
| 20 to 34 years | 11 (37.9%) | 18 (62.1%) |
| 35 to 50 years | 0 (0.0%) | 0 (0.0%) |
| Total | 11 (37.9%) | 18 (62.1%) |
Fertility by Education in Charlestown
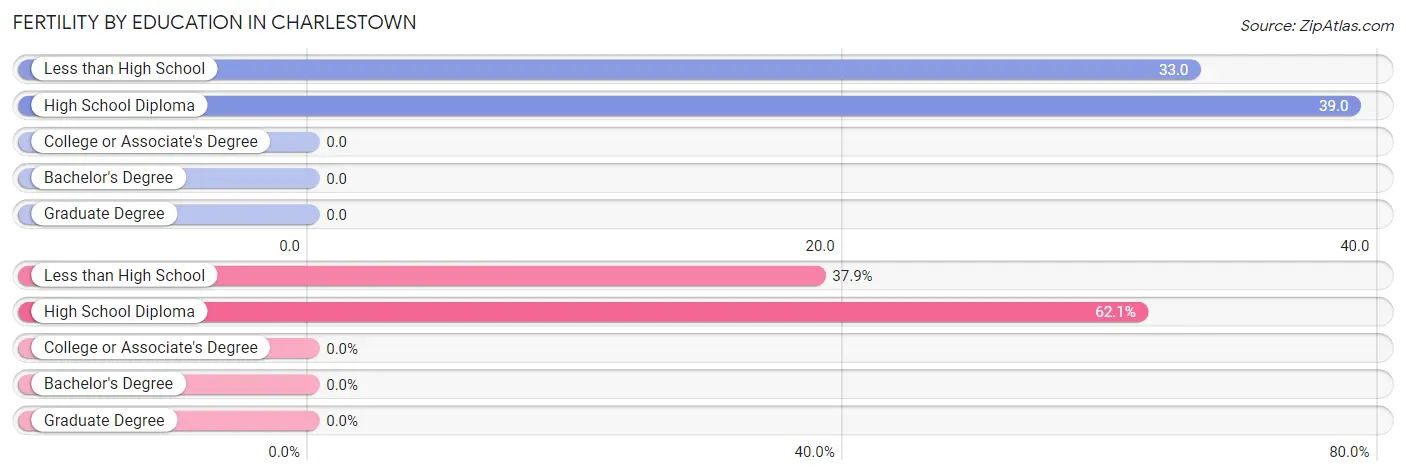
| Educational Attainment | Women with Births | Births / 1,000 Women |
| Less than High School | 11 (37.9%) | 33.0 |
| High School Diploma | 18 (62.1%) | 39.0 |
| College or Associate's Degree | 0 (0.0%) | 0.0 |
| Bachelor's Degree | 0 (0.0%) | 0.0 |
| Graduate Degree | 0 (0.0%) | 0.0 |
| Total | 29 (100.0%) | 15.0 |
Fertility by Education by Marriage Status in Charlestown
62.1% of women with births in Charlestown are unmarried. Women with the educational attainment of less than high school are most likely to be married with 100.0% of them married at childbirth, while women with the educational attainment of high school diploma are least likely to be married with 100.0% of them unmarried at childbirth.
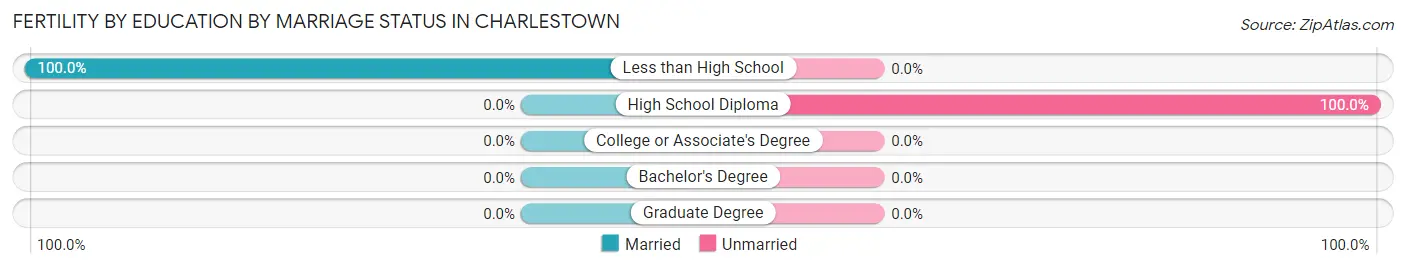
| Educational Attainment | Married | Unmarried |
| Less than High School | 11 (100.0%) | 0 (0.0%) |
| High School Diploma | 0 (0.0%) | 18 (100.0%) |
| College or Associate's Degree | 0 (0.0%) | 0 (0.0%) |
| Bachelor's Degree | 0 (0.0%) | 0 (0.0%) |
| Graduate Degree | 0 (0.0%) | 0 (0.0%) |
| Total | 11 (37.9%) | 18 (62.1%) |
Employment Characteristics in Charlestown
Employment by Class of Employer in Charlestown
Among the 3,793 employed individuals in Charlestown, private company employees (2,569 | 67.7%), local government employees (504 | 13.3%), and not-for-profit organizations (280 | 7.4%) make up the most common classes of employment.
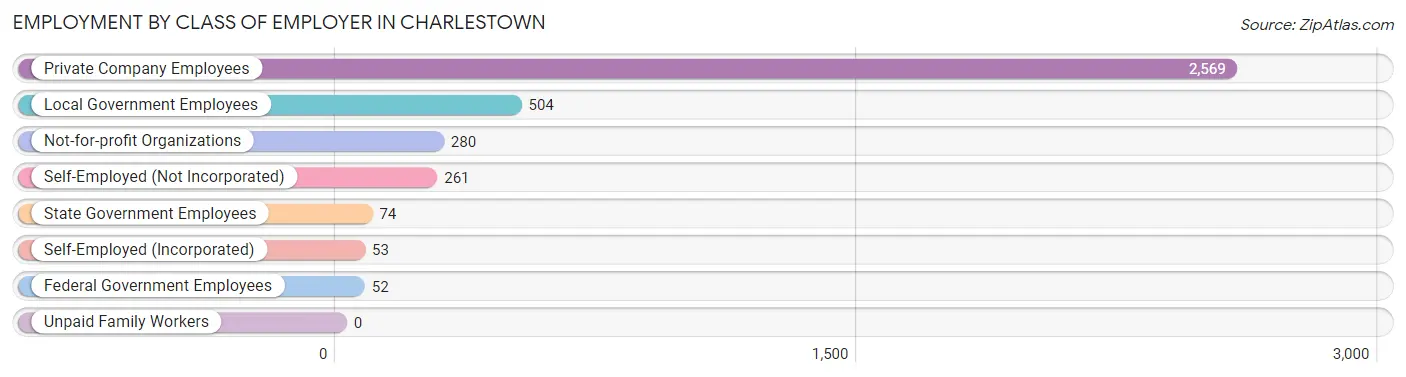
| Employer Class | # Employees | % Employees |
| Private Company Employees | 2,569 | 67.7% |
| Self-Employed (Incorporated) | 53 | 1.4% |
| Self-Employed (Not Incorporated) | 261 | 6.9% |
| Not-for-profit Organizations | 280 | 7.4% |
| Local Government Employees | 504 | 13.3% |
| State Government Employees | 74 | 1.9% |
| Federal Government Employees | 52 | 1.4% |
| Unpaid Family Workers | 0 | 0.0% |
| Total | 3,793 | 100.0% |
Employment Status by Age in Charlestown
According to the labor force statistics for Charlestown, out of the total population over 16 years of age (6,097), 64.9% or 3,957 individuals are in the labor force, with 1.9% or 75 of them unemployed. The age group with the highest labor force participation rate is 30 to 34 years, with 90.9% or 448 individuals in the labor force. Within the labor force, the 55 to 59 years age range has the highest percentage of unemployed individuals, with 7.5% or 28 of them being unemployed.
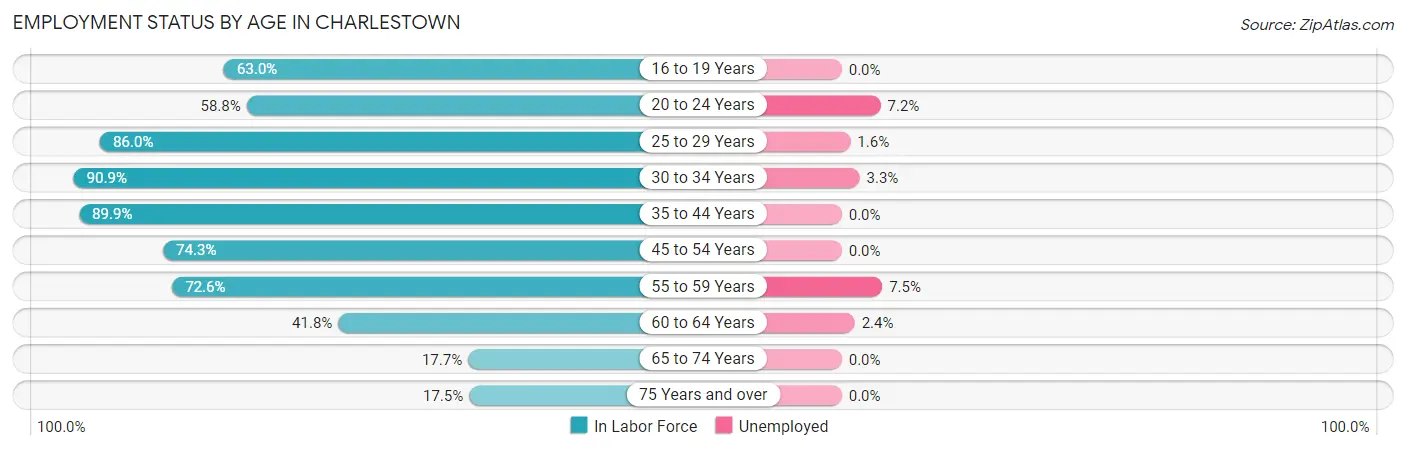
| Age Bracket | In Labor Force | Unemployed |
| 16 to 19 Years | 203 (63.0%) | 0 (0.0%) |
| 20 to 24 Years | 223 (58.8%) | 16 (7.2%) |
| 25 to 29 Years | 553 (86.0%) | 9 (1.6%) |
| 30 to 34 Years | 448 (90.9%) | 15 (3.3%) |
| 35 to 44 Years | 954 (89.9%) | 0 (0.0%) |
| 45 to 54 Years | 733 (74.3%) | 0 (0.0%) |
| 55 to 59 Years | 371 (72.6%) | 28 (7.5%) |
| 60 to 64 Years | 296 (41.8%) | 7 (2.4%) |
| 65 to 74 Years | 117 (17.7%) | 0 (0.0%) |
| 75 Years and over | 58 (17.5%) | 0 (0.0%) |
| Total | 3,957 (64.9%) | 75 (1.9%) |
Employment Status by Educational Attainment in Charlestown
According to labor force statistics for Charlestown, 76.2% of individuals (3,355) out of the total population between 25 and 64 years of age (4,403) are in the labor force, with 1.8% or 60 of them being unemployed. The group with the highest labor force participation rate are those with the educational attainment of college / associate degree, with 88.0% or 1,171 individuals in the labor force. Within the labor force, individuals with less than high school education have the highest percentage of unemployment, with 4.2% or 15 of them being unemployed.
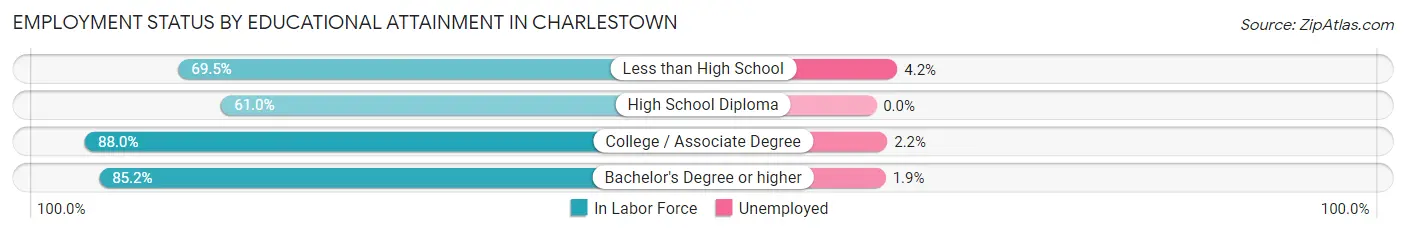
| Educational Attainment | In Labor Force | Unemployed |
| Less than High School | 358 (69.5%) | 22 (4.2%) |
| High School Diploma | 888 (61.0%) | 0 (0.0%) |
| College / Associate Degree | 1,171 (88.0%) | 29 (2.2%) |
| Bachelor's Degree or higher | 939 (85.2%) | 21 (1.9%) |
| Total | 3,355 (76.2%) | 79 (1.8%) |
Employment Occupations by Sex in Charlestown
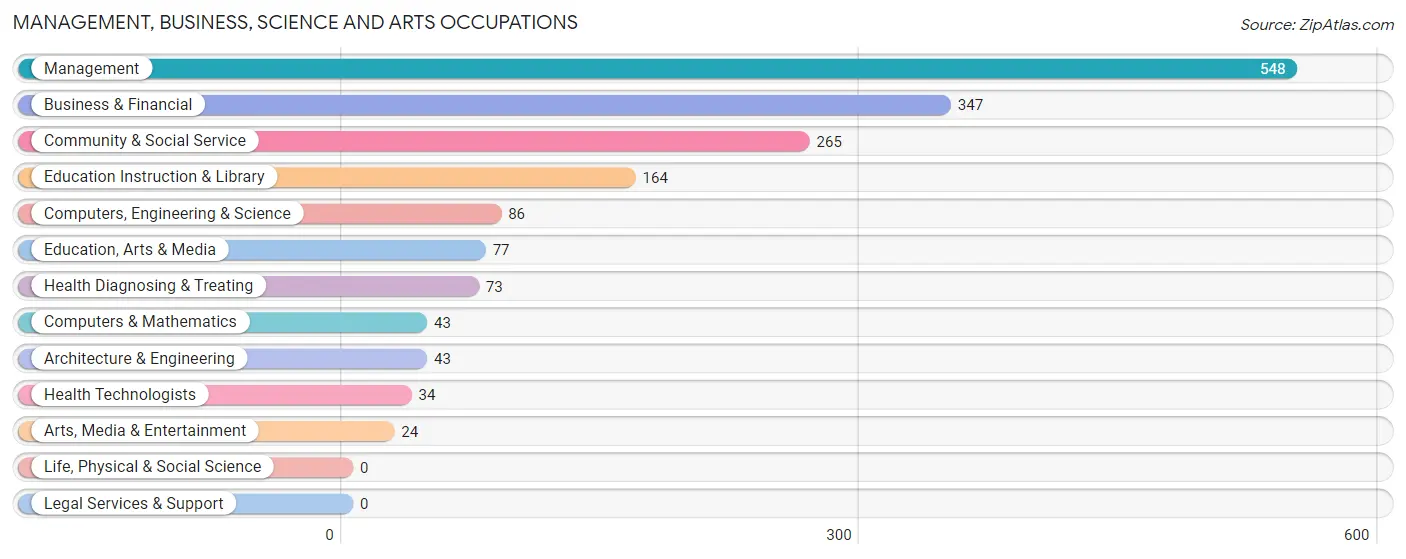
Management, Business, Science and Arts Occupations
The most common Management, Business, Science and Arts occupations in Charlestown are Management (548 | 14.1%), Business & Financial (347 | 8.9%), Community & Social Service (265 | 6.8%), Education Instruction & Library (164 | 4.2%), and Computers, Engineering & Science (86 | 2.2%).
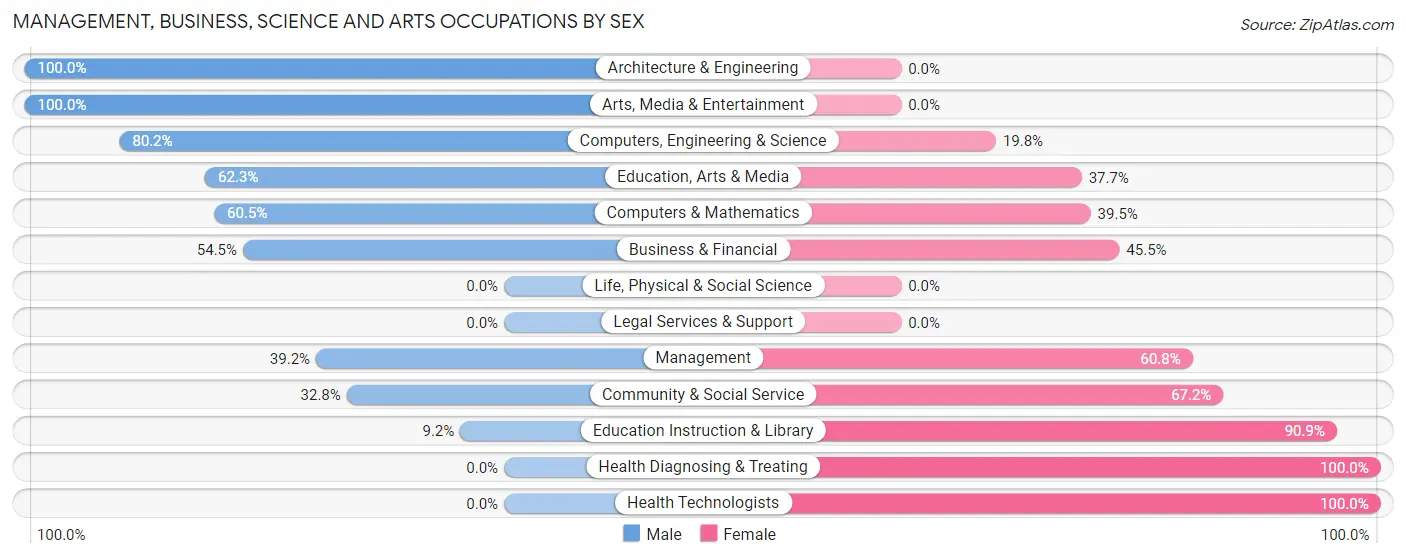
Management, Business, Science and Arts Occupations by Sex
Within the Management, Business, Science and Arts occupations in Charlestown, the most male-oriented occupations are Architecture & Engineering (100.0%), Arts, Media & Entertainment (100.0%), and Computers, Engineering & Science (80.2%), while the most female-oriented occupations are Health Diagnosing & Treating (100.0%), Health Technologists (100.0%), and Education Instruction & Library (90.8%).
| Occupation | Male | Female |
| Management | 215 (39.2%) | 333 (60.8%) |
| Business & Financial | 189 (54.5%) | 158 (45.5%) |
| Computers, Engineering & Science | 69 (80.2%) | 17 (19.8%) |
| Computers & Mathematics | 26 (60.5%) | 17 (39.5%) |
| Architecture & Engineering | 43 (100.0%) | 0 (0.0%) |
| Life, Physical & Social Science | 0 (0.0%) | 0 (0.0%) |
| Community & Social Service | 87 (32.8%) | 178 (67.2%) |
| Education, Arts & Media | 48 (62.3%) | 29 (37.7%) |
| Legal Services & Support | 0 (0.0%) | 0 (0.0%) |
| Education Instruction & Library | 15 (9.1%) | 149 (90.8%) |
| Arts, Media & Entertainment | 24 (100.0%) | 0 (0.0%) |
| Health Diagnosing & Treating | 0 (0.0%) | 73 (100.0%) |
| Health Technologists | 0 (0.0%) | 34 (100.0%) |
| Total (Category) | 560 (42.5%) | 759 (57.5%) |
| Total (Overall) | 1,918 (49.4%) | 1,963 (50.6%) |
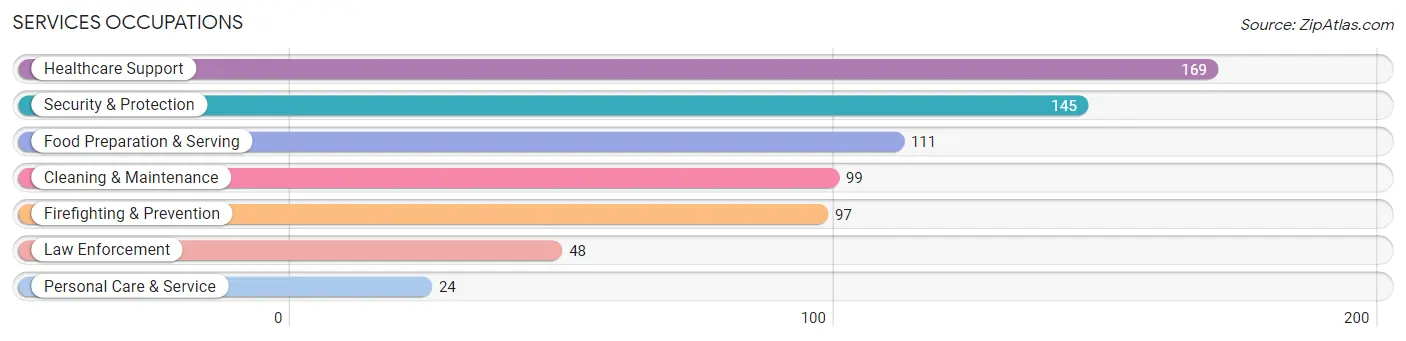
Services Occupations
The most common Services occupations in Charlestown are Healthcare Support (169 | 4.3%), Security & Protection (145 | 3.7%), Food Preparation & Serving (111 | 2.9%), Cleaning & Maintenance (99 | 2.5%), and Firefighting & Prevention (97 | 2.5%).
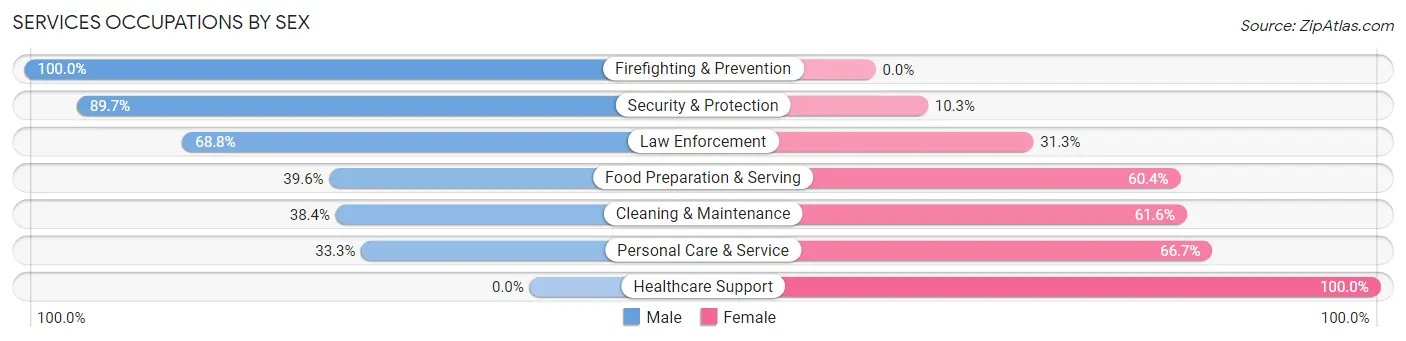
Services Occupations by Sex
Within the Services occupations in Charlestown, the most male-oriented occupations are Firefighting & Prevention (100.0%), Security & Protection (89.7%), and Law Enforcement (68.8%), while the most female-oriented occupations are Healthcare Support (100.0%), Personal Care & Service (66.7%), and Cleaning & Maintenance (61.6%).
| Occupation | Male | Female |
| Healthcare Support | 0 (0.0%) | 169 (100.0%) |
| Security & Protection | 130 (89.7%) | 15 (10.3%) |
| Firefighting & Prevention | 97 (100.0%) | 0 (0.0%) |
| Law Enforcement | 33 (68.8%) | 15 (31.2%) |
| Food Preparation & Serving | 44 (39.6%) | 67 (60.4%) |
| Cleaning & Maintenance | 38 (38.4%) | 61 (61.6%) |
| Personal Care & Service | 8 (33.3%) | 16 (66.7%) |
| Total (Category) | 220 (40.2%) | 328 (59.9%) |
| Total (Overall) | 1,918 (49.4%) | 1,963 (50.6%) |
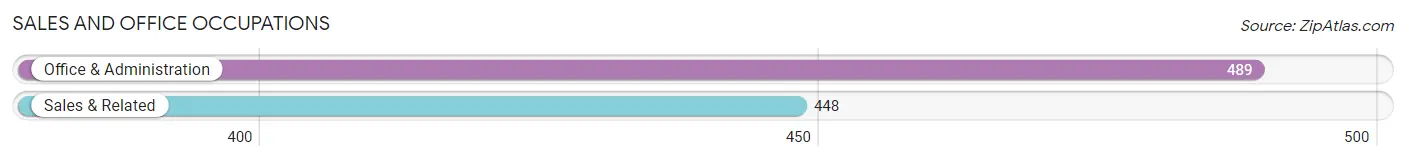
Sales and Office Occupations
The most common Sales and Office occupations in Charlestown are Office & Administration (489 | 12.6%), and Sales & Related (448 | 11.5%).
Sales and Office Occupations by Sex
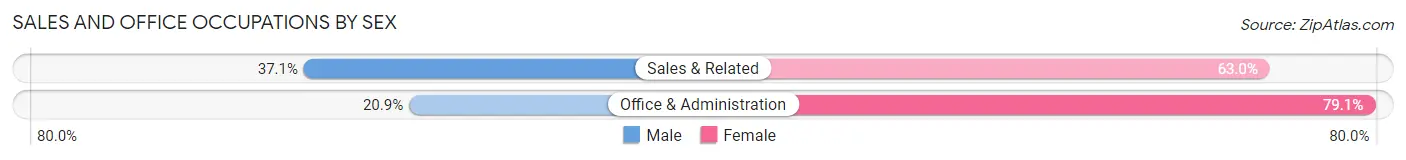
| Occupation | Male | Female |
| Sales & Related | 166 (37.0%) | 282 (62.9%) |
| Office & Administration | 102 (20.9%) | 387 (79.1%) |
| Total (Category) | 268 (28.6%) | 669 (71.4%) |
| Total (Overall) | 1,918 (49.4%) | 1,963 (50.6%) |
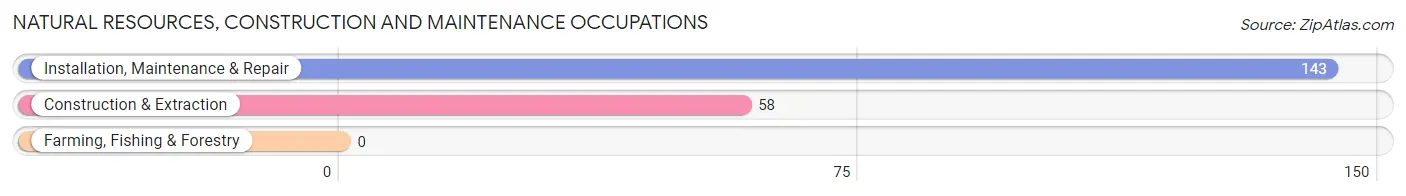
Natural Resources, Construction and Maintenance Occupations
The most common Natural Resources, Construction and Maintenance occupations in Charlestown are Installation, Maintenance & Repair (143 | 3.7%), and Construction & Extraction (58 | 1.5%).
Natural Resources, Construction and Maintenance Occupations by Sex
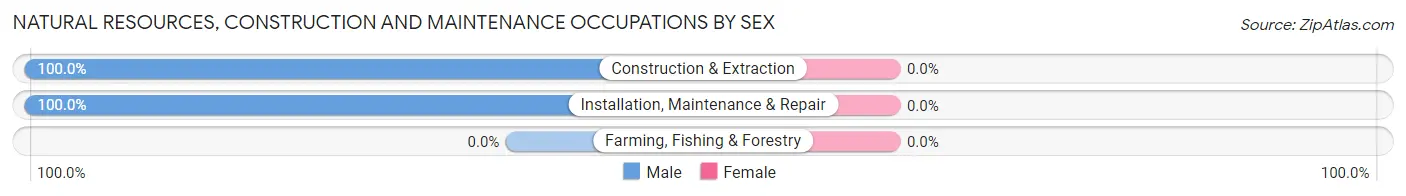
| Occupation | Male | Female |
| Farming, Fishing & Forestry | 0 (0.0%) | 0 (0.0%) |
| Construction & Extraction | 58 (100.0%) | 0 (0.0%) |
| Installation, Maintenance & Repair | 143 (100.0%) | 0 (0.0%) |
| Total (Category) | 201 (100.0%) | 0 (0.0%) |
| Total (Overall) | 1,918 (49.4%) | 1,963 (50.6%) |
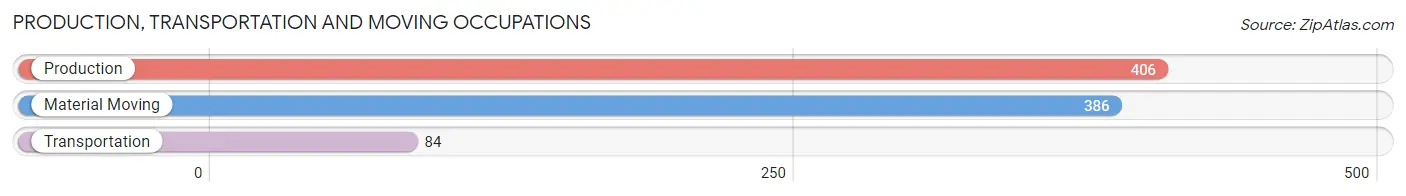
Production, Transportation and Moving Occupations
The most common Production, Transportation and Moving occupations in Charlestown are Production (406 | 10.5%), Material Moving (386 | 10.0%), and Transportation (84 | 2.2%).
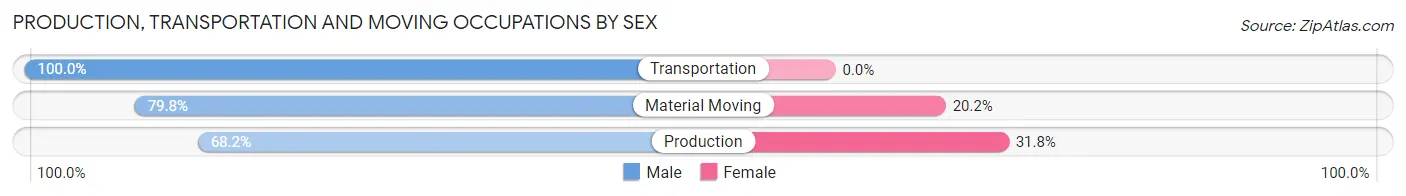
Production, Transportation and Moving Occupations by Sex
| Occupation | Male | Female |
| Production | 277 (68.2%) | 129 (31.8%) |
| Transportation | 84 (100.0%) | 0 (0.0%) |
| Material Moving | 308 (79.8%) | 78 (20.2%) |
| Total (Category) | 669 (76.4%) | 207 (23.6%) |
| Total (Overall) | 1,918 (49.4%) | 1,963 (50.6%) |
Employment Industries by Sex in Charlestown
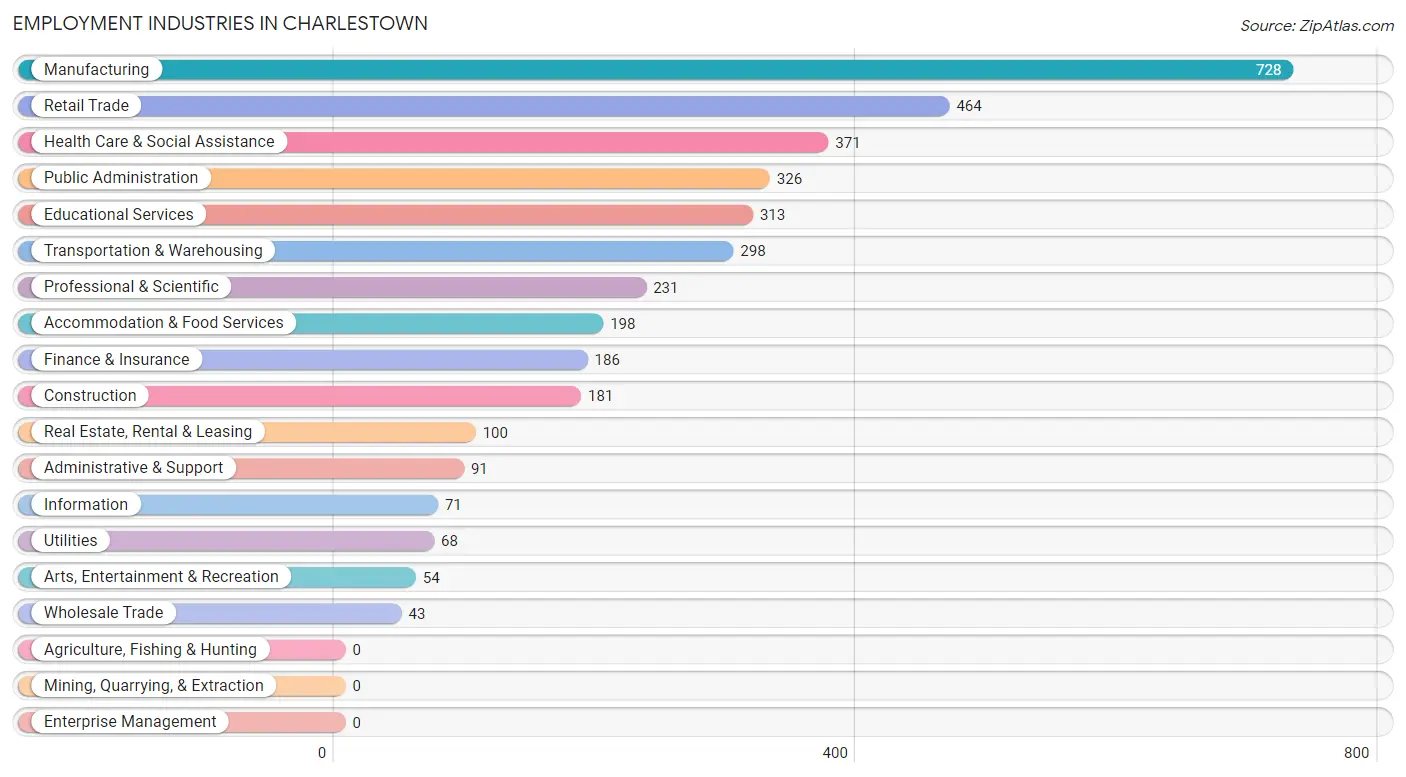
Employment Industries in Charlestown
The major employment industries in Charlestown include Manufacturing (728 | 18.8%), Retail Trade (464 | 12.0%), Health Care & Social Assistance (371 | 9.6%), Public Administration (326 | 8.4%), and Educational Services (313 | 8.1%).
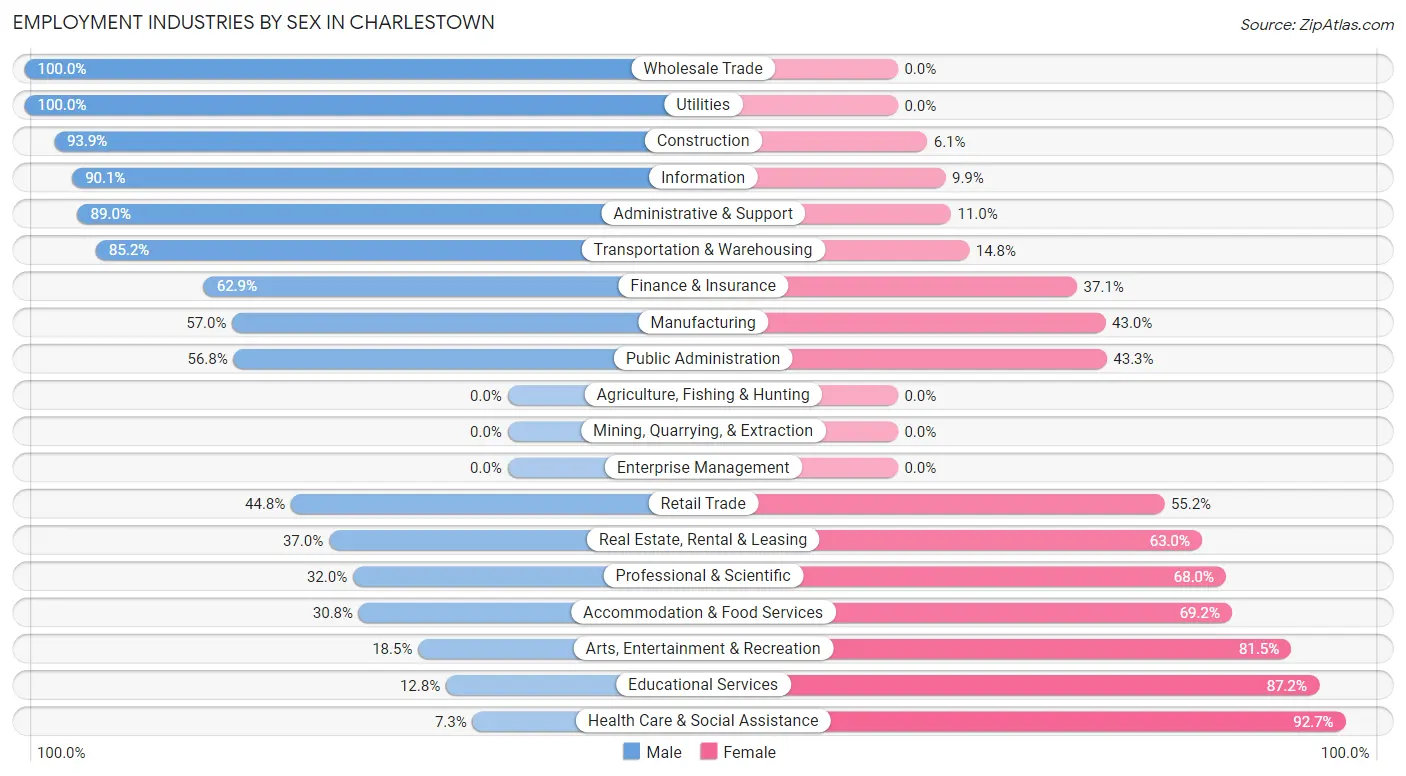
Employment Industries by Sex in Charlestown
The Charlestown industries that see more men than women are Wholesale Trade (100.0%), Utilities (100.0%), and Construction (93.9%), whereas the industries that tend to have a higher number of women are Health Care & Social Assistance (92.7%), Educational Services (87.2%), and Arts, Entertainment & Recreation (81.5%).
| Industry | Male | Female |
| Agriculture, Fishing & Hunting | 0 (0.0%) | 0 (0.0%) |
| Mining, Quarrying, & Extraction | 0 (0.0%) | 0 (0.0%) |
| Construction | 170 (93.9%) | 11 (6.1%) |
| Manufacturing | 415 (57.0%) | 313 (43.0%) |
| Wholesale Trade | 43 (100.0%) | 0 (0.0%) |
| Retail Trade | 208 (44.8%) | 256 (55.2%) |
| Transportation & Warehousing | 254 (85.2%) | 44 (14.8%) |
| Utilities | 68 (100.0%) | 0 (0.0%) |
| Information | 64 (90.1%) | 7 (9.9%) |
| Finance & Insurance | 117 (62.9%) | 69 (37.1%) |
| Real Estate, Rental & Leasing | 37 (37.0%) | 63 (63.0%) |
| Professional & Scientific | 74 (32.0%) | 157 (68.0%) |
| Enterprise Management | 0 (0.0%) | 0 (0.0%) |
| Administrative & Support | 81 (89.0%) | 10 (11.0%) |
| Educational Services | 40 (12.8%) | 273 (87.2%) |
| Health Care & Social Assistance | 27 (7.3%) | 344 (92.7%) |
| Arts, Entertainment & Recreation | 10 (18.5%) | 44 (81.5%) |
| Accommodation & Food Services | 61 (30.8%) | 137 (69.2%) |
| Public Administration | 185 (56.8%) | 141 (43.2%) |
| Total | 1,918 (49.4%) | 1,963 (50.6%) |
Education in Charlestown
School Enrollment in Charlestown
The most common levels of schooling among the 2,092 students in Charlestown are middle school (770 | 36.8%), elementary school (427 | 20.4%), and high school (385 | 18.4%).
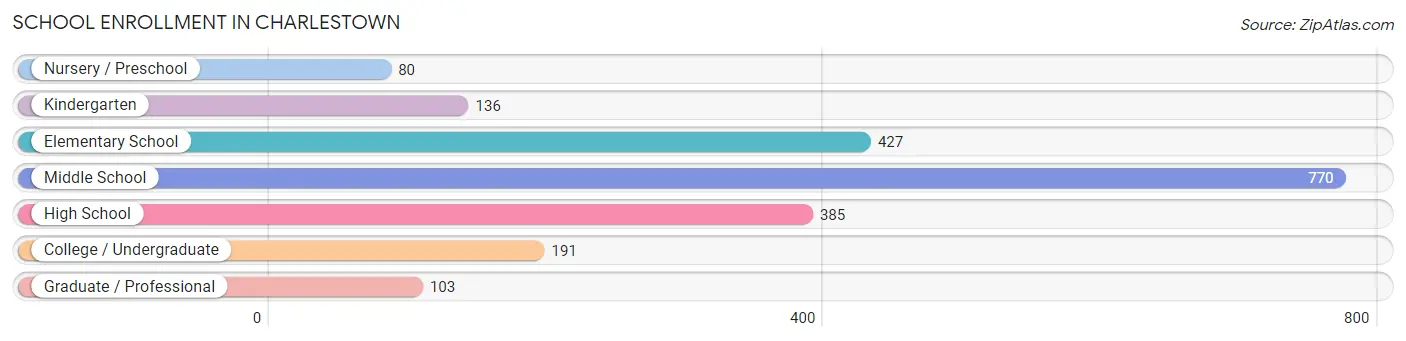
| School Level | # Students | % Students |
| Nursery / Preschool | 80 | 3.8% |
| Kindergarten | 136 | 6.5% |
| Elementary School | 427 | 20.4% |
| Middle School | 770 | 36.8% |
| High School | 385 | 18.4% |
| College / Undergraduate | 191 | 9.1% |
| Graduate / Professional | 103 | 4.9% |
| Total | 2,092 | 100.0% |
School Enrollment by Age by Funding Source in Charlestown
Out of a total of 2,092 students who are enrolled in schools in Charlestown, 165 (7.9%) attend a private institution, while the remaining 1,927 (92.1%) are enrolled in public schools. The age group of 3 to 4 year olds has the highest likelihood of being enrolled in private schools, with 11 (52.4% in the age bracket) enrolled. Conversely, the age group of 18 to 19 year olds has the lowest likelihood of being enrolled in a private school, with 100 (100.0% in the age bracket) attending a public institution.
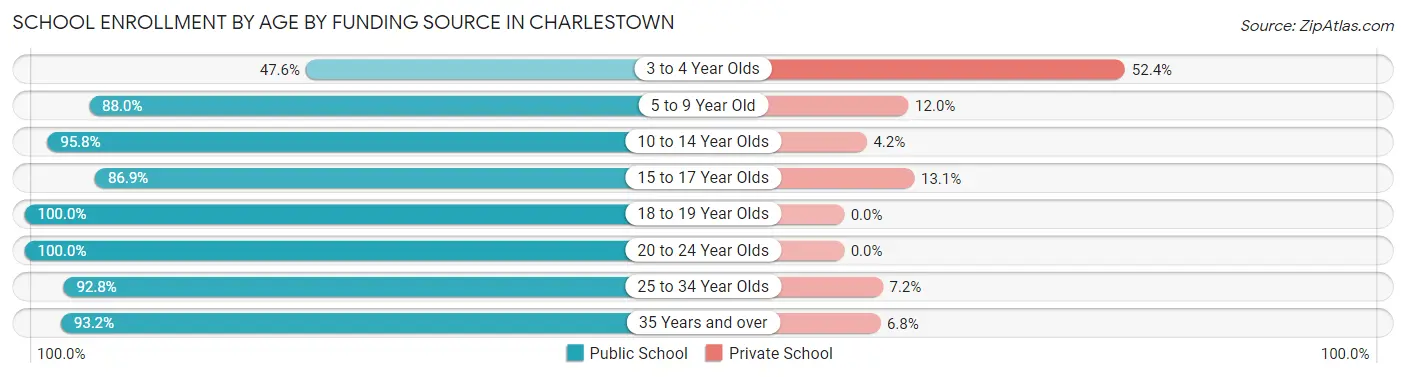
| Age Bracket | Public School | Private School |
| 3 to 4 Year Olds | 10 (47.6%) | 11 (52.4%) |
| 5 to 9 Year Old | 513 (88.0%) | 70 (12.0%) |
| 10 to 14 Year Olds | 814 (95.8%) | 36 (4.2%) |
| 15 to 17 Year Olds | 212 (86.9%) | 32 (13.1%) |
| 18 to 19 Year Olds | 100 (100.0%) | 0 (0.0%) |
| 20 to 24 Year Olds | 68 (100.0%) | 0 (0.0%) |
| 25 to 34 Year Olds | 141 (92.8%) | 11 (7.2%) |
| 35 Years and over | 69 (93.2%) | 5 (6.8%) |
| Total | 1,927 (92.1%) | 165 (7.9%) |
Educational Attainment by Field of Study in Charlestown
Business (354 | 29.5%), education (163 | 13.6%), communications (161 | 13.4%), liberal arts & history (98 | 8.2%), and arts & humanities (77 | 6.4%) are the most common fields of study among 1,200 individuals in Charlestown who have obtained a bachelor's degree or higher.
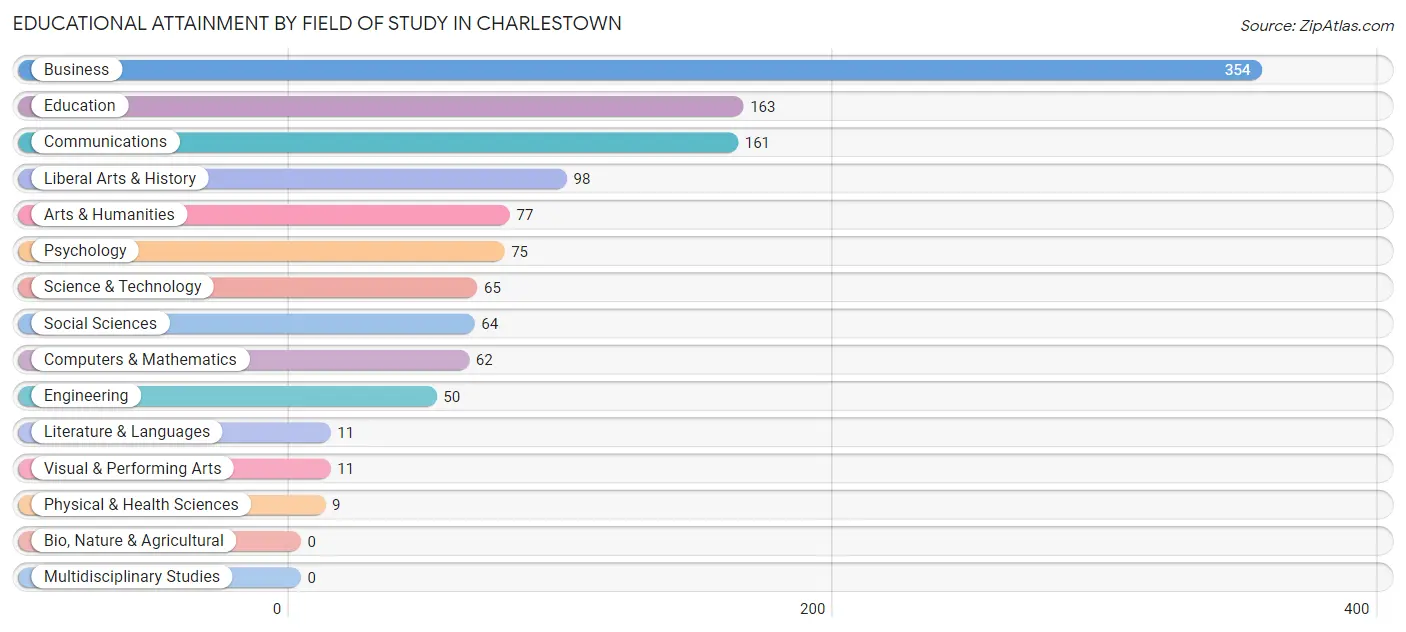
| Field of Study | # Graduates | % Graduates |
| Computers & Mathematics | 62 | 5.2% |
| Bio, Nature & Agricultural | 0 | 0.0% |
| Physical & Health Sciences | 9 | 0.7% |
| Psychology | 75 | 6.2% |
| Social Sciences | 64 | 5.3% |
| Engineering | 50 | 4.2% |
| Multidisciplinary Studies | 0 | 0.0% |
| Science & Technology | 65 | 5.4% |
| Business | 354 | 29.5% |
| Education | 163 | 13.6% |
| Literature & Languages | 11 | 0.9% |
| Liberal Arts & History | 98 | 8.2% |
| Visual & Performing Arts | 11 | 0.9% |
| Communications | 161 | 13.4% |
| Arts & Humanities | 77 | 6.4% |
| Total | 1,200 | 100.0% |
Transportation & Commute in Charlestown
Vehicle Availability by Sex in Charlestown
The most prevalent vehicle ownership categories in Charlestown are males with 2 vehicles (969, accounting for 50.9%) and females with 2 vehicles (838, making up 51.2%).
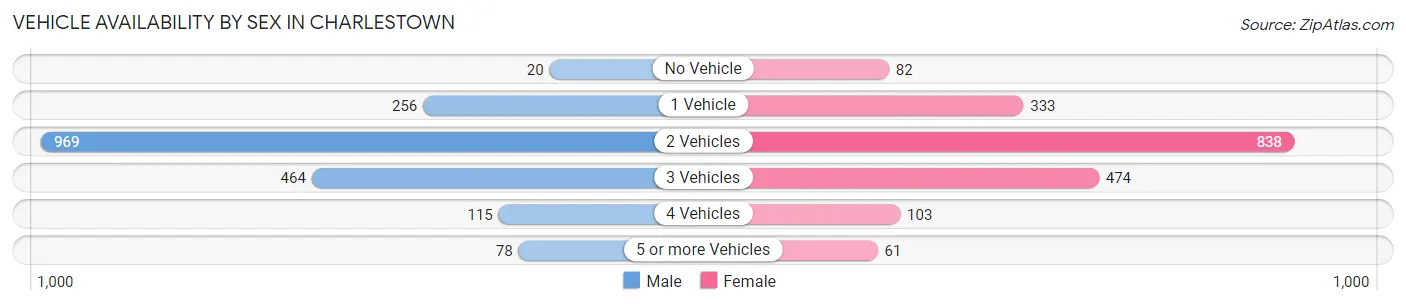
| Vehicles Available | Male | Female |
| No Vehicle | 20 (1.1%) | 82 (4.3%) |
| 1 Vehicle | 256 (13.5%) | 333 (17.6%) |
| 2 Vehicles | 969 (50.9%) | 838 (44.3%) |
| 3 Vehicles | 464 (24.4%) | 474 (25.1%) |
| 4 Vehicles | 115 (6.0%) | 103 (5.4%) |
| 5 or more Vehicles | 78 (4.1%) | 61 (3.2%) |
| Total | 1,902 (100.0%) | 1,891 (100.0%) |
Commute Time in Charlestown
The most frequently occuring commute durations in Charlestown are 20 to 24 minutes (990 commuters, 27.3%), 30 to 34 minutes (808 commuters, 22.3%), and 25 to 29 minutes (486 commuters, 13.4%).
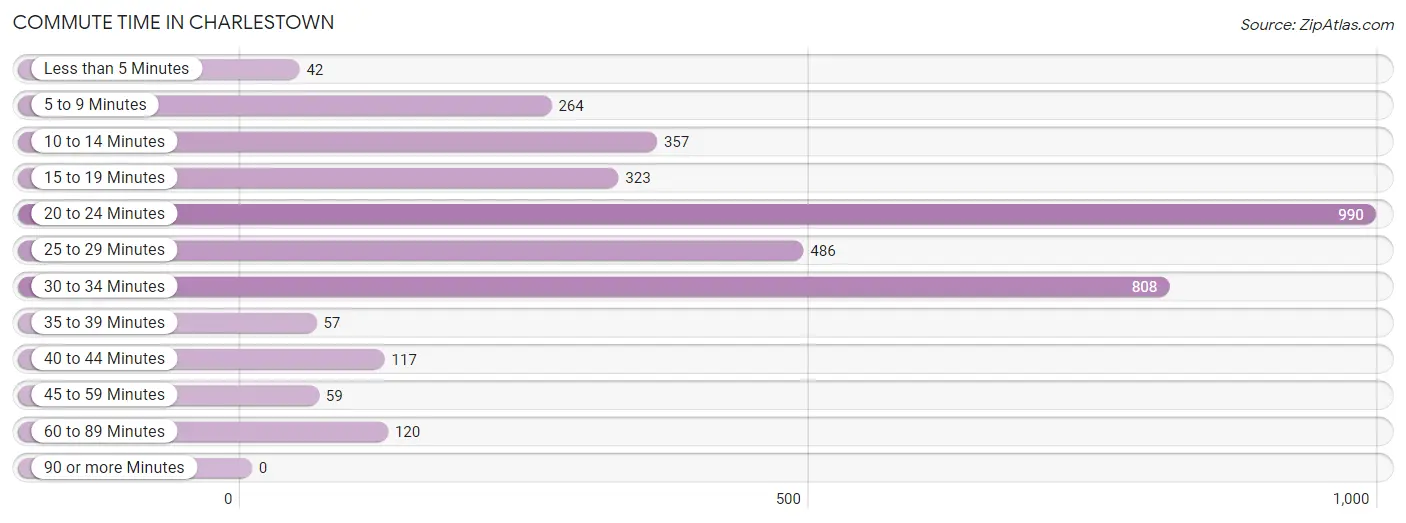
| Commute Time | # Commuters | % Commuters |
| Less than 5 Minutes | 42 | 1.2% |
| 5 to 9 Minutes | 264 | 7.3% |
| 10 to 14 Minutes | 357 | 9.9% |
| 15 to 19 Minutes | 323 | 8.9% |
| 20 to 24 Minutes | 990 | 27.3% |
| 25 to 29 Minutes | 486 | 13.4% |
| 30 to 34 Minutes | 808 | 22.3% |
| 35 to 39 Minutes | 57 | 1.6% |
| 40 to 44 Minutes | 117 | 3.2% |
| 45 to 59 Minutes | 59 | 1.6% |
| 60 to 89 Minutes | 120 | 3.3% |
| 90 or more Minutes | 0 | 0.0% |
Commute Time by Sex in Charlestown
The most common commute times in Charlestown are 30 to 34 minutes (491 commuters, 26.9%) for males and 20 to 24 minutes (524 commuters, 29.2%) for females.
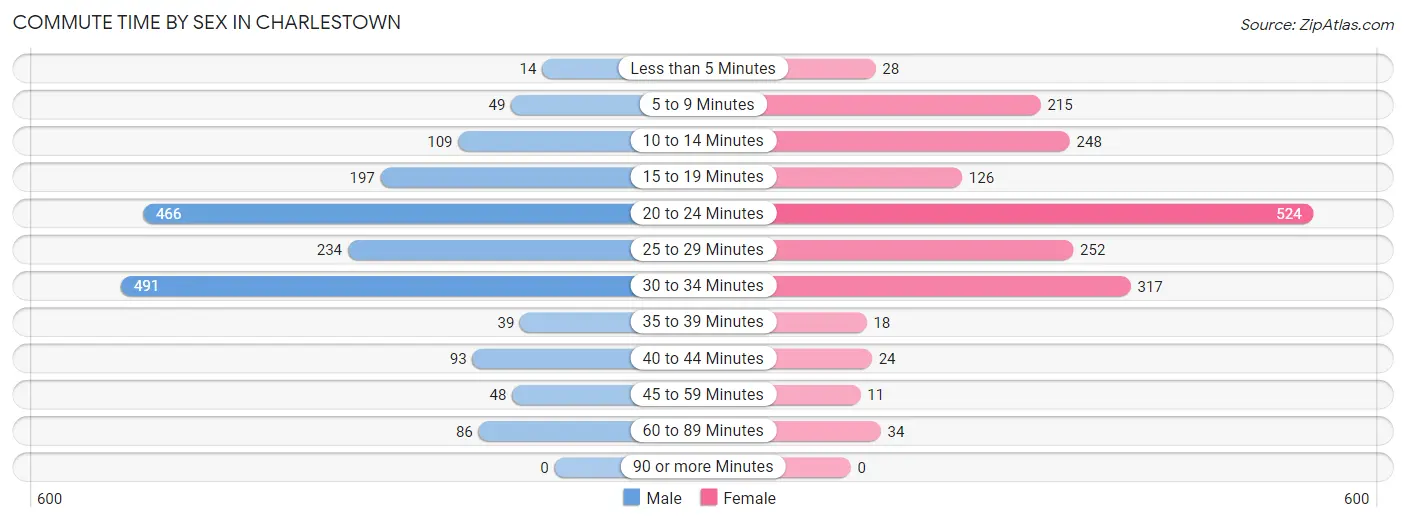
| Commute Time | Male | Female |
| Less than 5 Minutes | 14 (0.8%) | 28 (1.6%) |
| 5 to 9 Minutes | 49 (2.7%) | 215 (12.0%) |
| 10 to 14 Minutes | 109 (6.0%) | 248 (13.8%) |
| 15 to 19 Minutes | 197 (10.8%) | 126 (7.0%) |
| 20 to 24 Minutes | 466 (25.5%) | 524 (29.2%) |
| 25 to 29 Minutes | 234 (12.8%) | 252 (14.0%) |
| 30 to 34 Minutes | 491 (26.9%) | 317 (17.6%) |
| 35 to 39 Minutes | 39 (2.1%) | 18 (1.0%) |
| 40 to 44 Minutes | 93 (5.1%) | 24 (1.3%) |
| 45 to 59 Minutes | 48 (2.6%) | 11 (0.6%) |
| 60 to 89 Minutes | 86 (4.7%) | 34 (1.9%) |
| 90 or more Minutes | 0 (0.0%) | 0 (0.0%) |
Time of Departure to Work by Sex in Charlestown
The most frequent times of departure to work in Charlestown are 7:00 AM to 7:29 AM (323, 17.7%) for males and 7:30 AM to 7:59 AM (318, 17.7%) for females.
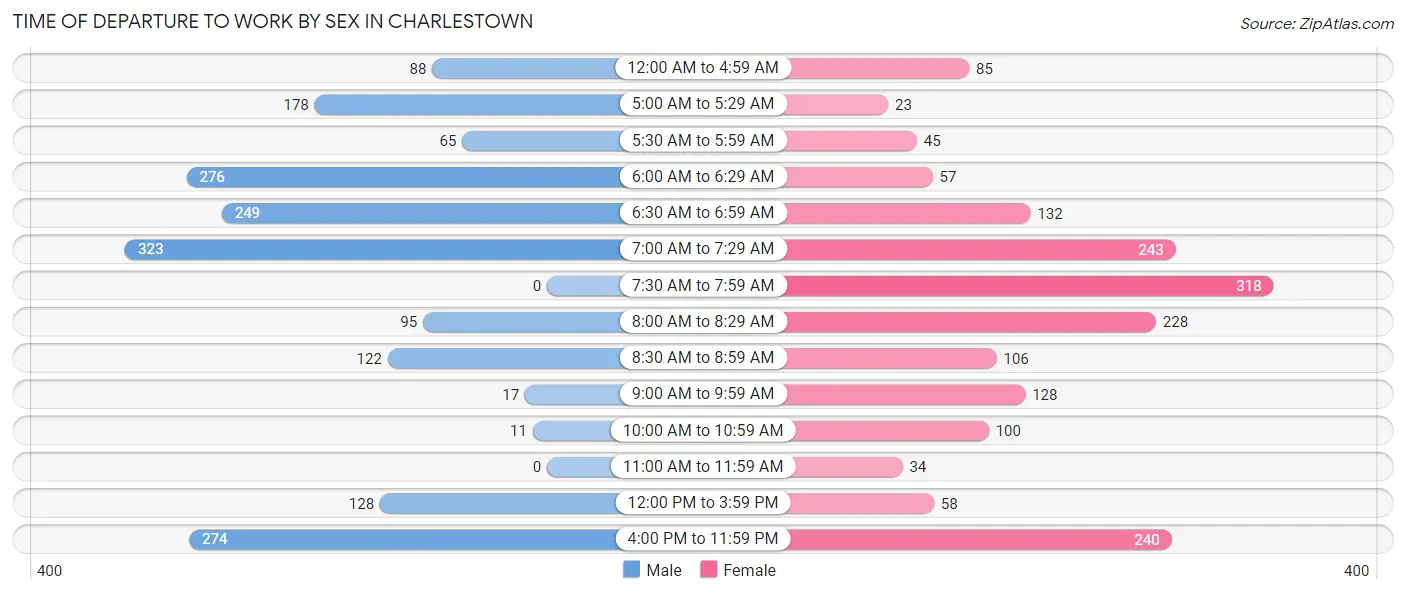
| Time of Departure | Male | Female |
| 12:00 AM to 4:59 AM | 88 (4.8%) | 85 (4.7%) |
| 5:00 AM to 5:29 AM | 178 (9.8%) | 23 (1.3%) |
| 5:30 AM to 5:59 AM | 65 (3.6%) | 45 (2.5%) |
| 6:00 AM to 6:29 AM | 276 (15.1%) | 57 (3.2%) |
| 6:30 AM to 6:59 AM | 249 (13.6%) | 132 (7.3%) |
| 7:00 AM to 7:29 AM | 323 (17.7%) | 243 (13.5%) |
| 7:30 AM to 7:59 AM | 0 (0.0%) | 318 (17.7%) |
| 8:00 AM to 8:29 AM | 95 (5.2%) | 228 (12.7%) |
| 8:30 AM to 8:59 AM | 122 (6.7%) | 106 (5.9%) |
| 9:00 AM to 9:59 AM | 17 (0.9%) | 128 (7.1%) |
| 10:00 AM to 10:59 AM | 11 (0.6%) | 100 (5.6%) |
| 11:00 AM to 11:59 AM | 0 (0.0%) | 34 (1.9%) |
| 12:00 PM to 3:59 PM | 128 (7.0%) | 58 (3.2%) |
| 4:00 PM to 11:59 PM | 274 (15.0%) | 240 (13.4%) |
| Total | 1,826 (100.0%) | 1,797 (100.0%) |
Housing Occupancy in Charlestown
Occupancy by Ownership in Charlestown
Of the total 3,051 dwellings in Charlestown, owner-occupied units account for 2,223 (72.9%), while renter-occupied units make up 828 (27.1%).
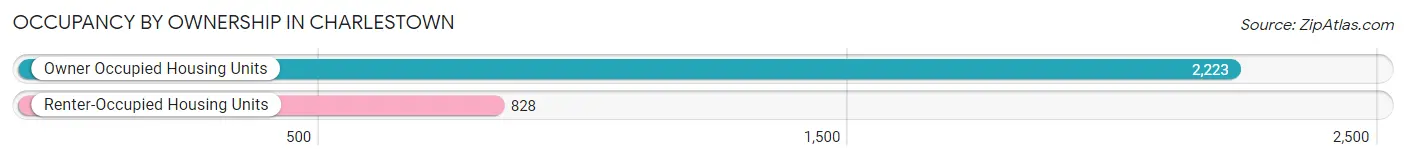
| Occupancy | # Housing Units | % Housing Units |
| Owner Occupied Housing Units | 2,223 | 72.9% |
| Renter-Occupied Housing Units | 828 | 27.1% |
| Total Occupied Housing Units | 3,051 | 100.0% |
Occupancy by Household Size in Charlestown
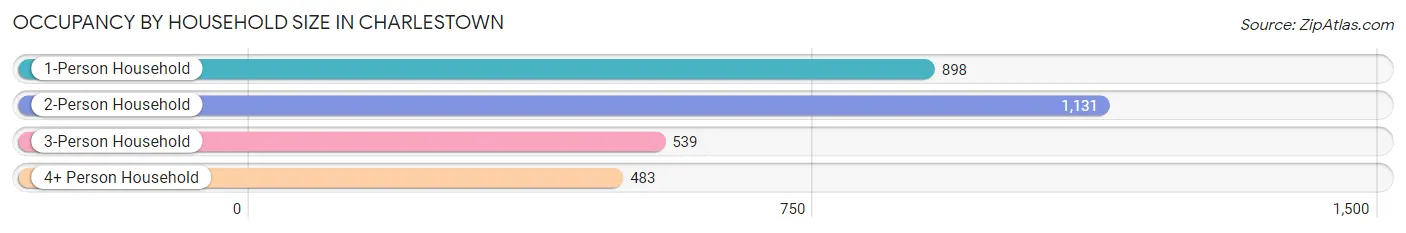
| Household Size | # Housing Units | % Housing Units |
| 1-Person Household | 898 | 29.4% |
| 2-Person Household | 1,131 | 37.1% |
| 3-Person Household | 539 | 17.7% |
| 4+ Person Household | 483 | 15.8% |
| Total Housing Units | 3,051 | 100.0% |
Occupancy by Ownership by Household Size in Charlestown
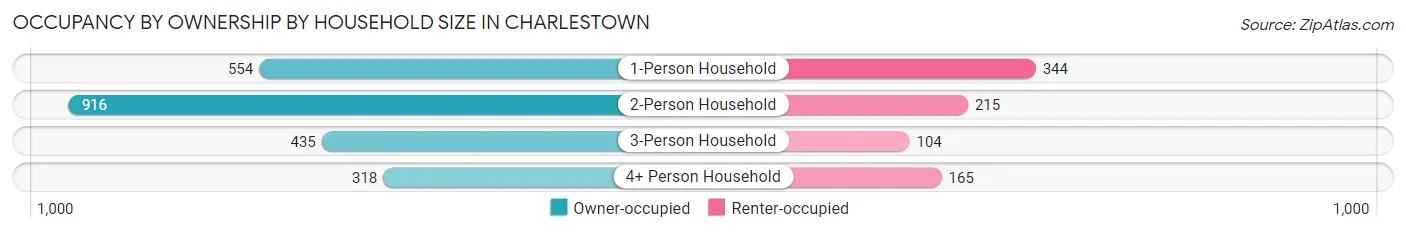
| Household Size | Owner-occupied | Renter-occupied |
| 1-Person Household | 554 (61.7%) | 344 (38.3%) |
| 2-Person Household | 916 (81.0%) | 215 (19.0%) |
| 3-Person Household | 435 (80.7%) | 104 (19.3%) |
| 4+ Person Household | 318 (65.8%) | 165 (34.2%) |
| Total Housing Units | 2,223 (72.9%) | 828 (27.1%) |
Occupancy by Educational Attainment in Charlestown
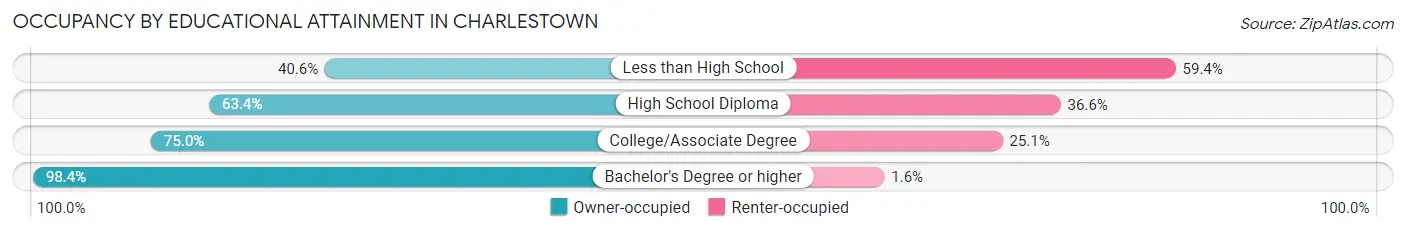
| Household Size | Owner-occupied | Renter-occupied |
| Less than High School | 141 (40.6%) | 206 (59.4%) |
| High School Diploma | 645 (63.4%) | 372 (36.6%) |
| College/Associate Degree | 712 (75.0%) | 238 (25.1%) |
| Bachelor's Degree or higher | 725 (98.4%) | 12 (1.6%) |
Occupancy by Age of Householder in Charlestown
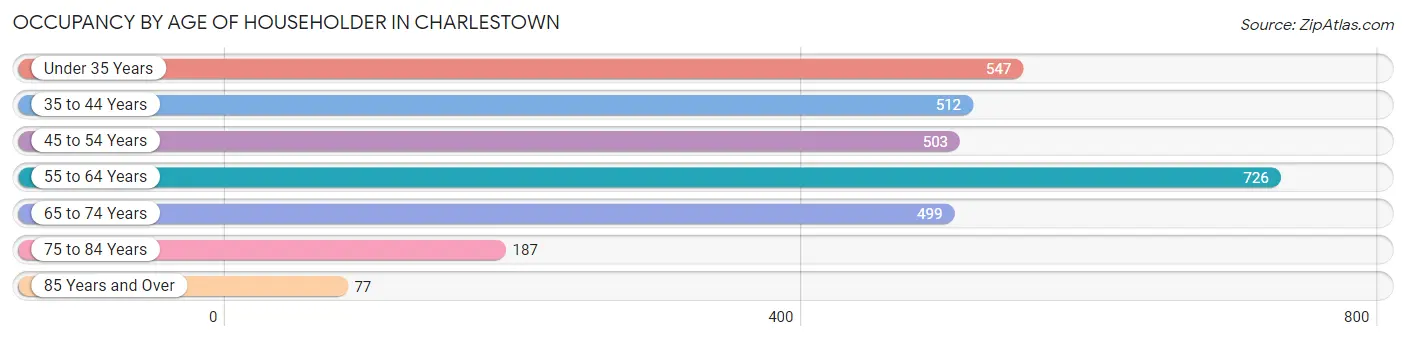
| Age Bracket | # Households | % Households |
| Under 35 Years | 547 | 17.9% |
| 35 to 44 Years | 512 | 16.8% |
| 45 to 54 Years | 503 | 16.5% |
| 55 to 64 Years | 726 | 23.8% |
| 65 to 74 Years | 499 | 16.4% |
| 75 to 84 Years | 187 | 6.1% |
| 85 Years and Over | 77 | 2.5% |
| Total | 3,051 | 100.0% |
Housing Finances in Charlestown
Median Income by Occupancy in Charlestown
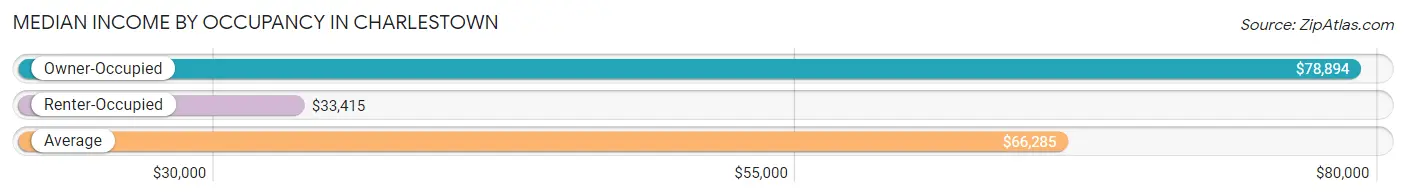
| Occupancy Type | # Households | Median Income |
| Owner-Occupied | 2,223 (72.9%) | $78,894 |
| Renter-Occupied | 828 (27.1%) | $33,415 |
| Average | 3,051 (100.0%) | $66,285 |
Occupancy by Householder Income Bracket in Charlestown
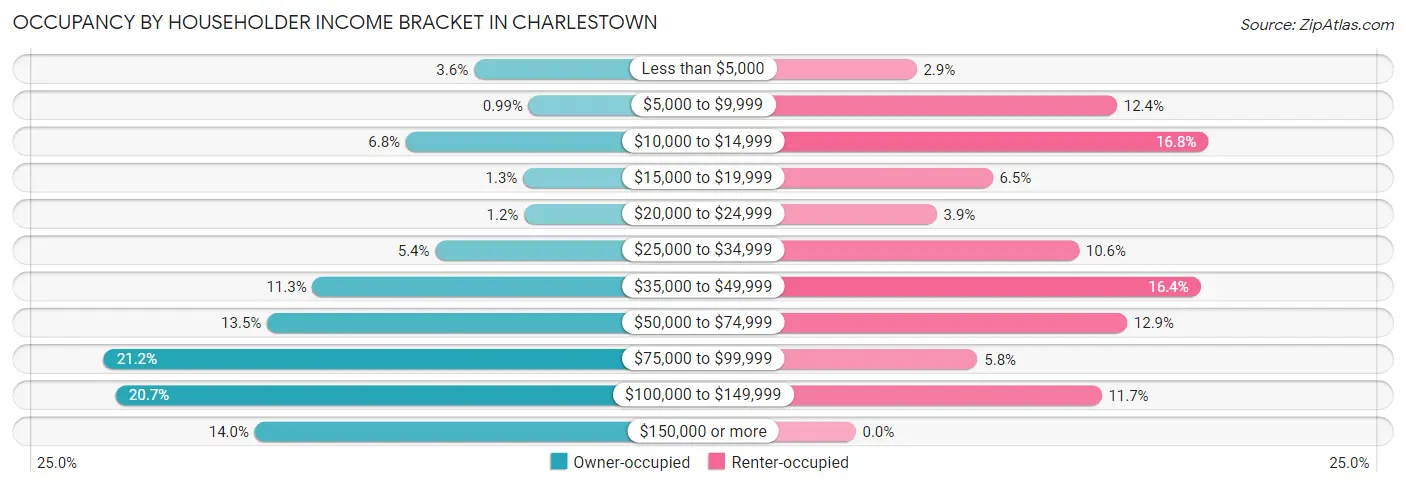
| Income Bracket | Owner-occupied | Renter-occupied |
| Less than $5,000 | 80 (3.6%) | 24 (2.9%) |
| $5,000 to $9,999 | 22 (1.0%) | 103 (12.4%) |
| $10,000 to $14,999 | 152 (6.8%) | 139 (16.8%) |
| $15,000 to $19,999 | 28 (1.3%) | 54 (6.5%) |
| $20,000 to $24,999 | 27 (1.2%) | 32 (3.9%) |
| $25,000 to $34,999 | 121 (5.4%) | 88 (10.6%) |
| $35,000 to $49,999 | 251 (11.3%) | 136 (16.4%) |
| $50,000 to $74,999 | 299 (13.5%) | 107 (12.9%) |
| $75,000 to $99,999 | 472 (21.2%) | 48 (5.8%) |
| $100,000 to $149,999 | 459 (20.6%) | 97 (11.7%) |
| $150,000 or more | 312 (14.0%) | 0 (0.0%) |
| Total | 2,223 (100.0%) | 828 (100.0%) |
Monthly Housing Cost Tiers in Charlestown
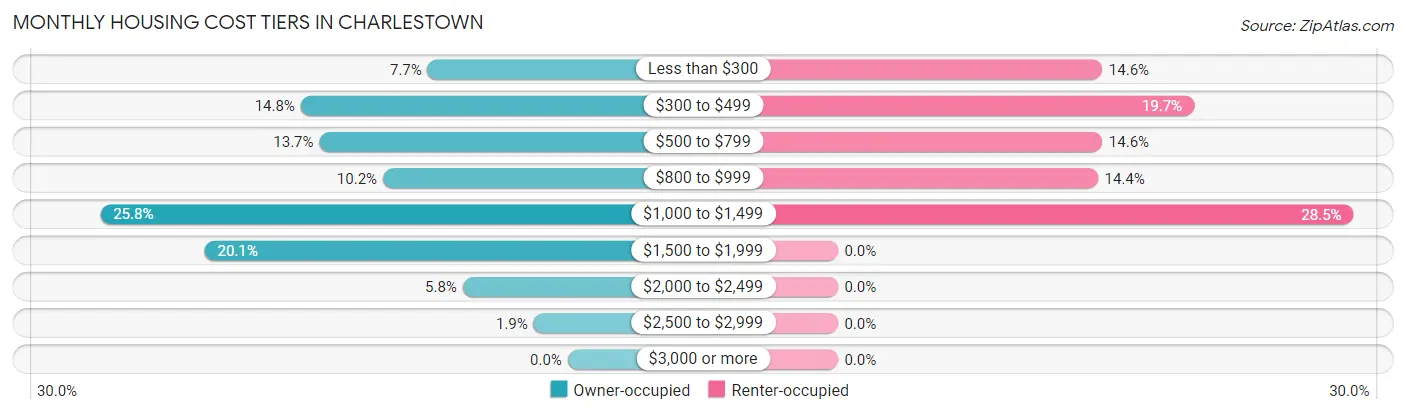
| Monthly Cost | Owner-occupied | Renter-occupied |
| Less than $300 | 172 (7.7%) | 121 (14.6%) |
| $300 to $499 | 328 (14.7%) | 163 (19.7%) |
| $500 to $799 | 305 (13.7%) | 121 (14.6%) |
| $800 to $999 | 227 (10.2%) | 119 (14.4%) |
| $1,000 to $1,499 | 574 (25.8%) | 236 (28.5%) |
| $1,500 to $1,999 | 446 (20.1%) | 0 (0.0%) |
| $2,000 to $2,499 | 129 (5.8%) | 0 (0.0%) |
| $2,500 to $2,999 | 42 (1.9%) | 0 (0.0%) |
| $3,000 or more | 0 (0.0%) | 0 (0.0%) |
| Total | 2,223 (100.0%) | 828 (100.0%) |
Physical Housing Characteristics in Charlestown
Housing Structures in Charlestown
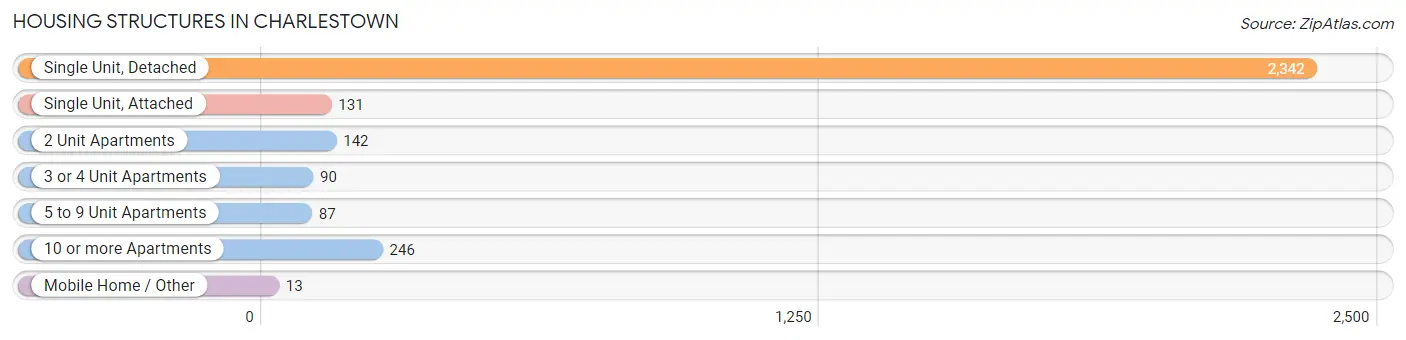
| Structure Type | # Housing Units | % Housing Units |
| Single Unit, Detached | 2,342 | 76.8% |
| Single Unit, Attached | 131 | 4.3% |
| 2 Unit Apartments | 142 | 4.6% |
| 3 or 4 Unit Apartments | 90 | 2.9% |
| 5 to 9 Unit Apartments | 87 | 2.9% |
| 10 or more Apartments | 246 | 8.1% |
| Mobile Home / Other | 13 | 0.4% |
| Total | 3,051 | 100.0% |
Housing Structures by Occupancy in Charlestown
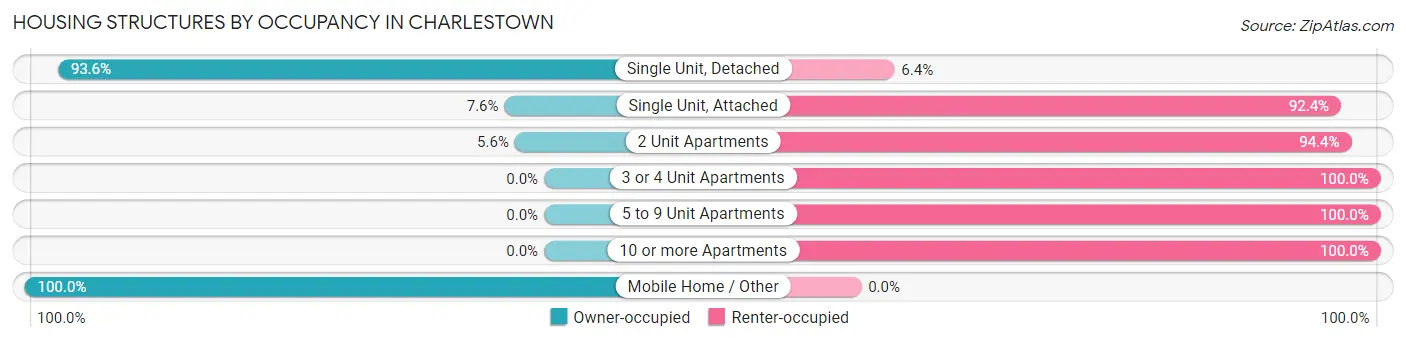
| Structure Type | Owner-occupied | Renter-occupied |
| Single Unit, Detached | 2,192 (93.6%) | 150 (6.4%) |
| Single Unit, Attached | 10 (7.6%) | 121 (92.4%) |
| 2 Unit Apartments | 8 (5.6%) | 134 (94.4%) |
| 3 or 4 Unit Apartments | 0 (0.0%) | 90 (100.0%) |
| 5 to 9 Unit Apartments | 0 (0.0%) | 87 (100.0%) |
| 10 or more Apartments | 0 (0.0%) | 246 (100.0%) |
| Mobile Home / Other | 13 (100.0%) | 0 (0.0%) |
| Total | 2,223 (72.9%) | 828 (27.1%) |
Housing Structures by Number of Rooms in Charlestown
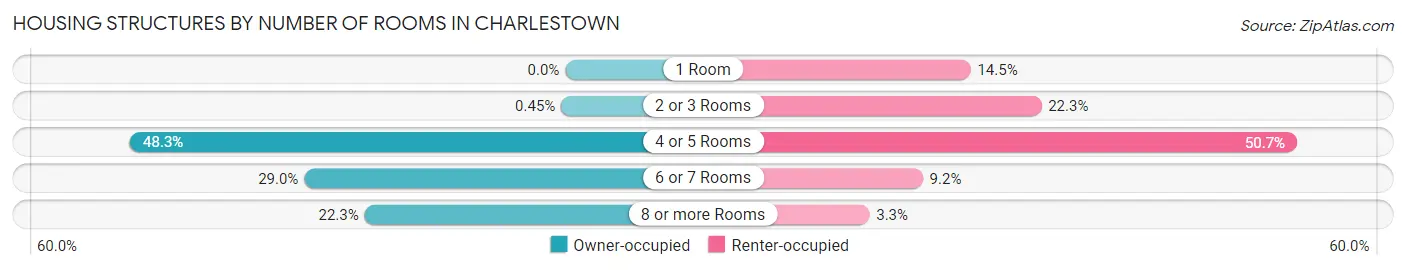
| Number of Rooms | Owner-occupied | Renter-occupied |
| 1 Room | 0 (0.0%) | 120 (14.5%) |
| 2 or 3 Rooms | 10 (0.4%) | 185 (22.3%) |
| 4 or 5 Rooms | 1,074 (48.3%) | 420 (50.7%) |
| 6 or 7 Rooms | 644 (29.0%) | 76 (9.2%) |
| 8 or more Rooms | 495 (22.3%) | 27 (3.3%) |
| Total | 2,223 (100.0%) | 828 (100.0%) |
Housing Structure by Heating Type in Charlestown
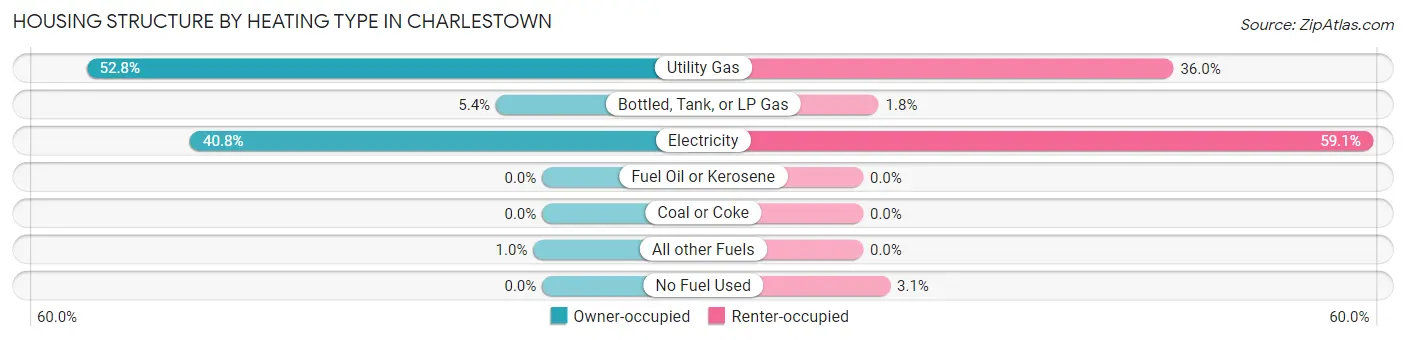
| Heating Type | Owner-occupied | Renter-occupied |
| Utility Gas | 1,174 (52.8%) | 298 (36.0%) |
| Bottled, Tank, or LP Gas | 119 (5.3%) | 15 (1.8%) |
| Electricity | 907 (40.8%) | 489 (59.1%) |
| Fuel Oil or Kerosene | 0 (0.0%) | 0 (0.0%) |
| Coal or Coke | 0 (0.0%) | 0 (0.0%) |
| All other Fuels | 23 (1.0%) | 0 (0.0%) |
| No Fuel Used | 0 (0.0%) | 26 (3.1%) |
| Total | 2,223 (100.0%) | 828 (100.0%) |
Household Vehicle Usage in Charlestown
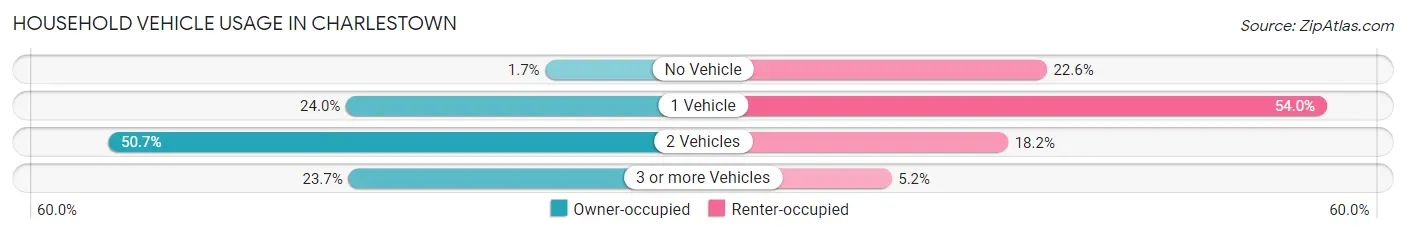
| Vehicles per Household | Owner-occupied | Renter-occupied |
| No Vehicle | 37 (1.7%) | 187 (22.6%) |
| 1 Vehicle | 533 (24.0%) | 447 (54.0%) |
| 2 Vehicles | 1,126 (50.6%) | 151 (18.2%) |
| 3 or more Vehicles | 527 (23.7%) | 43 (5.2%) |
| Total | 2,223 (100.0%) | 828 (100.0%) |
Real Estate & Mortgages in Charlestown
Real Estate and Mortgage Overview in Charlestown
| Characteristic | Without Mortgage | With Mortgage |
| Housing Units | 600 | 1,623 |
| Median Property Value | $130,400 | $200,100 |
| Median Household Income | $47,434 | $249 |
| Monthly Housing Costs | $406 | $0 |
| Real Estate Taxes | $785 | $0 |
Property Value by Mortgage Status in Charlestown
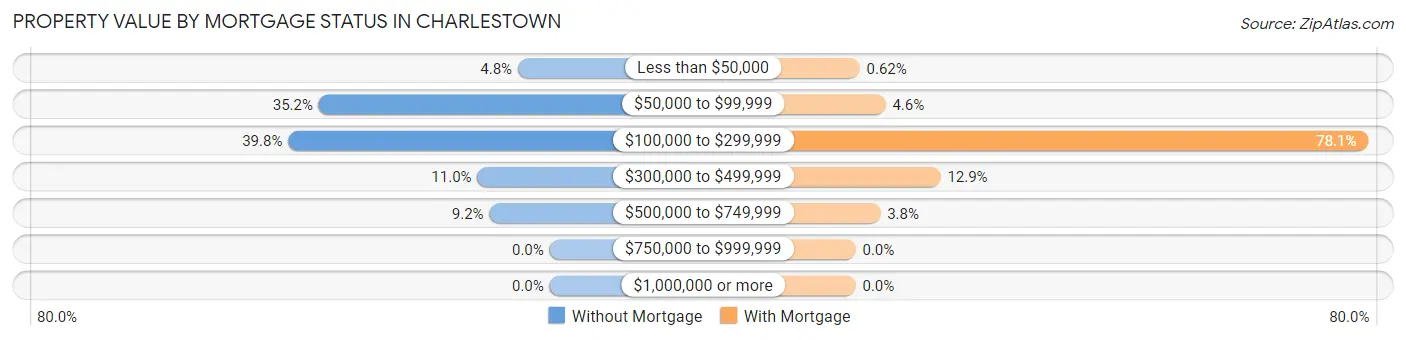
| Property Value | Without Mortgage | With Mortgage |
| Less than $50,000 | 29 (4.8%) | 10 (0.6%) |
| $50,000 to $99,999 | 211 (35.2%) | 74 (4.6%) |
| $100,000 to $299,999 | 239 (39.8%) | 1,268 (78.1%) |
| $300,000 to $499,999 | 66 (11.0%) | 210 (12.9%) |
| $500,000 to $749,999 | 55 (9.2%) | 61 (3.8%) |
| $750,000 to $999,999 | 0 (0.0%) | 0 (0.0%) |
| $1,000,000 or more | 0 (0.0%) | 0 (0.0%) |
| Total | 600 (100.0%) | 1,623 (100.0%) |
Household Income by Mortgage Status in Charlestown
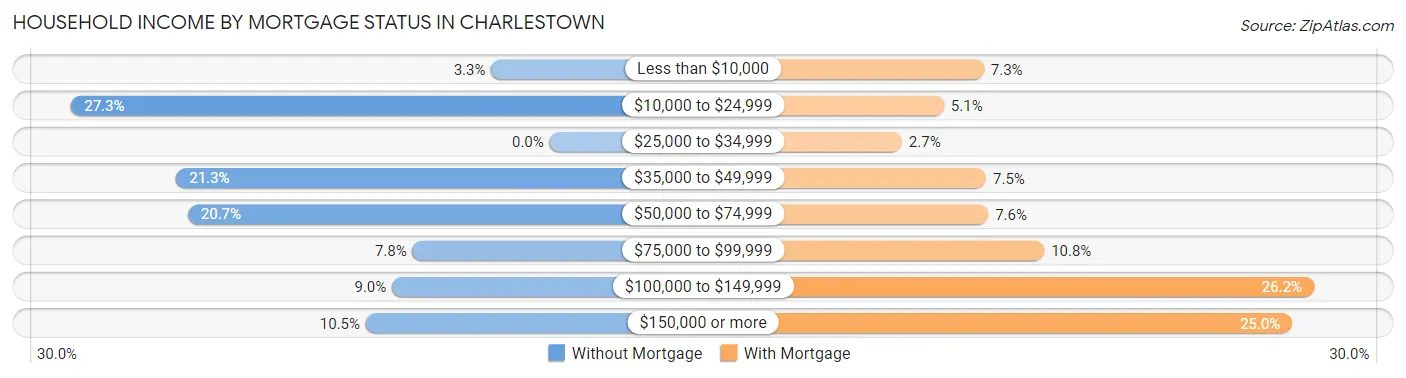
| Household Income | Without Mortgage | With Mortgage |
| Less than $10,000 | 20 (3.3%) | 119 (7.3%) |
| $10,000 to $24,999 | 164 (27.3%) | 82 (5.1%) |
| $25,000 to $34,999 | 0 (0.0%) | 43 (2.6%) |
| $35,000 to $49,999 | 128 (21.3%) | 121 (7.5%) |
| $50,000 to $74,999 | 124 (20.7%) | 123 (7.6%) |
| $75,000 to $99,999 | 47 (7.8%) | 175 (10.8%) |
| $100,000 to $149,999 | 54 (9.0%) | 425 (26.2%) |
| $150,000 or more | 63 (10.5%) | 405 (24.9%) |
| Total | 600 (100.0%) | 1,623 (100.0%) |
Property Value to Household Income Ratio in Charlestown
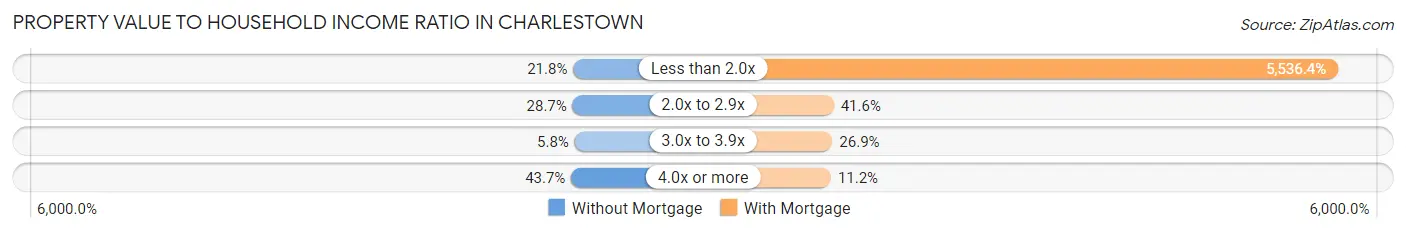
| Value-to-Income Ratio | Without Mortgage | With Mortgage |
| Less than 2.0x | 131 (21.8%) | 89,856 (5,536.4%) |
| 2.0x to 2.9x | 172 (28.7%) | 675 (41.6%) |
| 3.0x to 3.9x | 35 (5.8%) | 437 (26.9%) |
| 4.0x or more | 262 (43.7%) | 182 (11.2%) |
| Total | 600 (100.0%) | 1,623 (100.0%) |
Real Estate Taxes by Mortgage Status in Charlestown
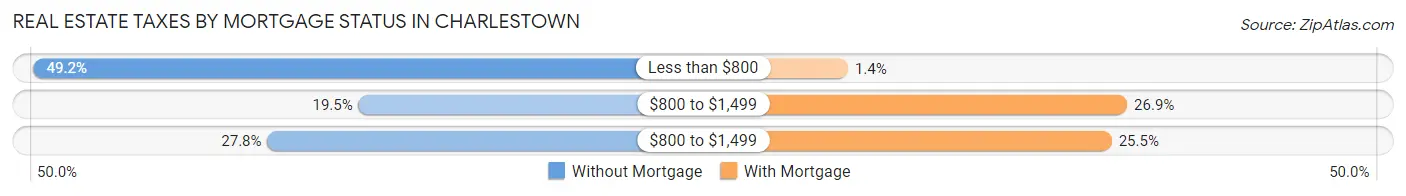
| Property Taxes | Without Mortgage | With Mortgage |
| Less than $800 | 295 (49.2%) | 22 (1.4%) |
| $800 to $1,499 | 117 (19.5%) | 436 (26.9%) |
| $800 to $1,499 | 167 (27.8%) | 413 (25.5%) |
| Total | 600 (100.0%) | 1,623 (100.0%) |
Health & Disability in Charlestown
Health Insurance Coverage by Age in Charlestown
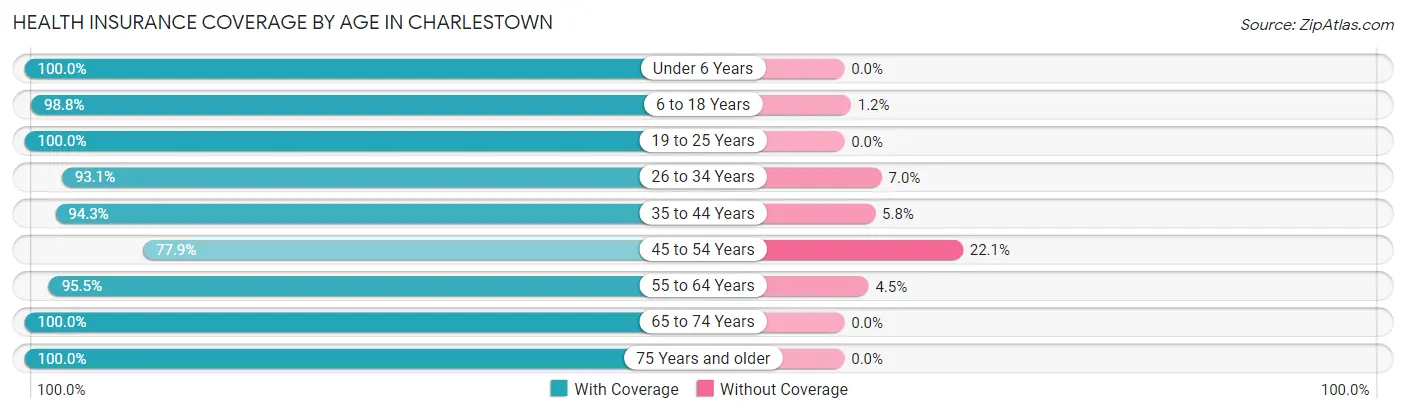
| Age Bracket | With Coverage | Without Coverage |
| Under 6 Years | 439 (100.0%) | 0 (0.0%) |
| 6 to 18 Years | 1,718 (98.8%) | 21 (1.2%) |
| 19 to 25 Years | 641 (100.0%) | 0 (0.0%) |
| 26 to 34 Years | 844 (93.0%) | 63 (7.0%) |
| 35 to 44 Years | 1,000 (94.3%) | 61 (5.8%) |
| 45 to 54 Years | 769 (77.9%) | 218 (22.1%) |
| 55 to 64 Years | 1,164 (95.5%) | 55 (4.5%) |
| 65 to 74 Years | 662 (100.0%) | 0 (0.0%) |
| 75 Years and older | 314 (100.0%) | 0 (0.0%) |
| Total | 7,551 (94.8%) | 418 (5.2%) |
Health Insurance Coverage by Citizenship Status in Charlestown
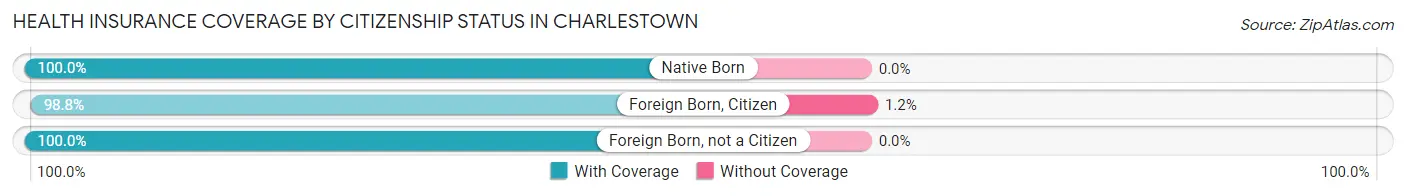
| Citizenship Status | With Coverage | Without Coverage |
| Native Born | 439 (100.0%) | 0 (0.0%) |
| Foreign Born, Citizen | 1,718 (98.8%) | 21 (1.2%) |
| Foreign Born, not a Citizen | 641 (100.0%) | 0 (0.0%) |
Health Insurance Coverage by Household Income in Charlestown
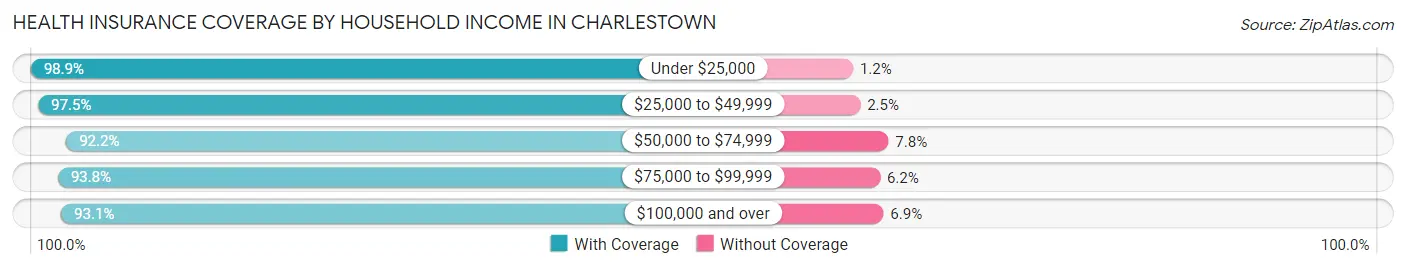
| Household Income | With Coverage | Without Coverage |
| Under $25,000 | 1,119 (98.9%) | 13 (1.1%) |
| $25,000 to $49,999 | 1,395 (97.5%) | 36 (2.5%) |
| $50,000 to $74,999 | 780 (92.2%) | 66 (7.8%) |
| $75,000 to $99,999 | 1,435 (93.8%) | 95 (6.2%) |
| $100,000 and over | 2,822 (93.1%) | 208 (6.9%) |
Public vs Private Health Insurance Coverage by Age in Charlestown
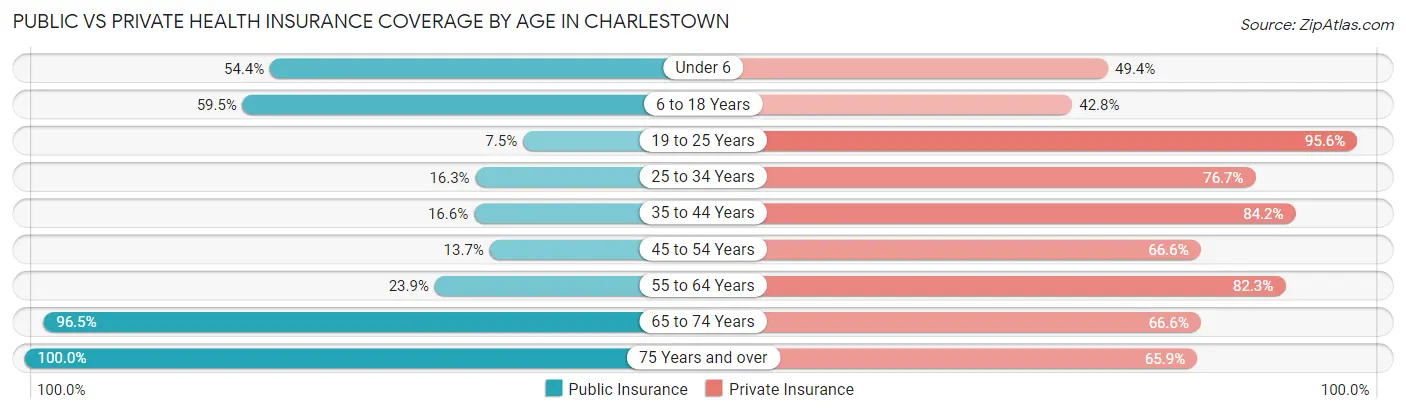
| Age Bracket | Public Insurance | Private Insurance |
| Under 6 | 239 (54.4%) | 217 (49.4%) |
| 6 to 18 Years | 1,035 (59.5%) | 744 (42.8%) |
| 19 to 25 Years | 48 (7.5%) | 613 (95.6%) |
| 25 to 34 Years | 148 (16.3%) | 696 (76.7%) |
| 35 to 44 Years | 176 (16.6%) | 893 (84.2%) |
| 45 to 54 Years | 135 (13.7%) | 657 (66.6%) |
| 55 to 64 Years | 291 (23.9%) | 1,003 (82.3%) |
| 65 to 74 Years | 639 (96.5%) | 441 (66.6%) |
| 75 Years and over | 314 (100.0%) | 207 (65.9%) |
| Total | 3,025 (38.0%) | 5,471 (68.6%) |
Disability Status by Sex by Age in Charlestown
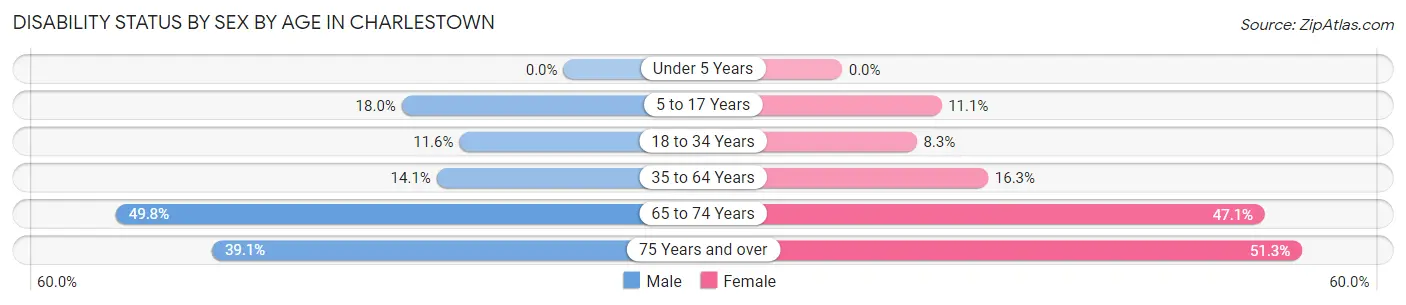
| Age Bracket | Male | Female |
| Under 5 Years | 0 (0.0%) | 0 (0.0%) |
| 5 to 17 Years | 130 (18.0%) | 111 (11.1%) |
| 18 to 34 Years | 86 (11.6%) | 76 (8.3%) |
| 35 to 64 Years | 212 (14.1%) | 287 (16.3%) |
| 65 to 74 Years | 148 (49.8%) | 172 (47.1%) |
| 75 Years and over | 45 (39.1%) | 102 (51.3%) |
Disability Class by Sex by Age in Charlestown
Disability Class: Hearing Difficulty
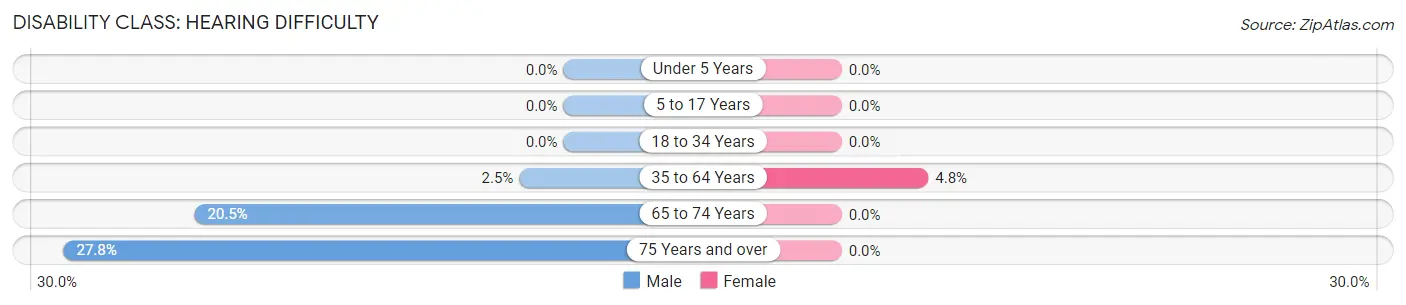
| Age Bracket | Male | Female |
| Under 5 Years | 0 (0.0%) | 0 (0.0%) |
| 5 to 17 Years | 0 (0.0%) | 0 (0.0%) |
| 18 to 34 Years | 0 (0.0%) | 0 (0.0%) |
| 35 to 64 Years | 37 (2.5%) | 85 (4.8%) |
| 65 to 74 Years | 61 (20.5%) | 0 (0.0%) |
| 75 Years and over | 32 (27.8%) | 0 (0.0%) |
Disability Class: Vision Difficulty
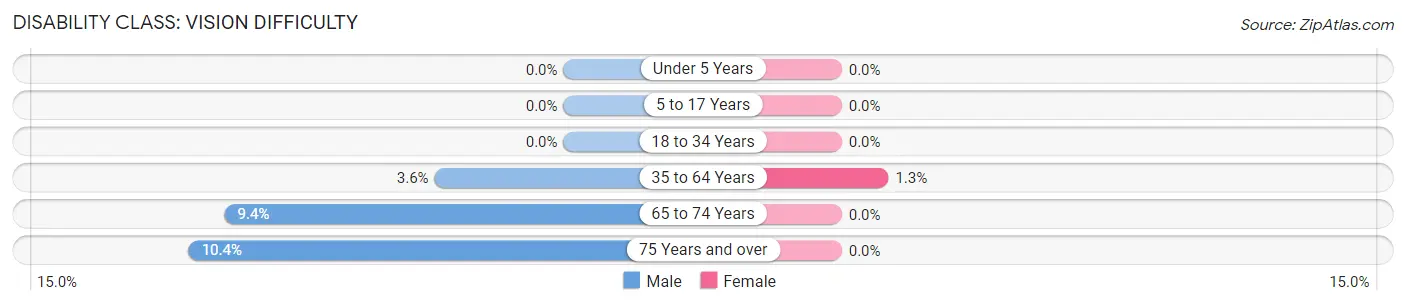
| Age Bracket | Male | Female |
| Under 5 Years | 0 (0.0%) | 0 (0.0%) |
| 5 to 17 Years | 0 (0.0%) | 0 (0.0%) |
| 18 to 34 Years | 0 (0.0%) | 0 (0.0%) |
| 35 to 64 Years | 54 (3.6%) | 23 (1.3%) |
| 65 to 74 Years | 28 (9.4%) | 0 (0.0%) |
| 75 Years and over | 12 (10.4%) | 0 (0.0%) |
Disability Class: Cognitive Difficulty
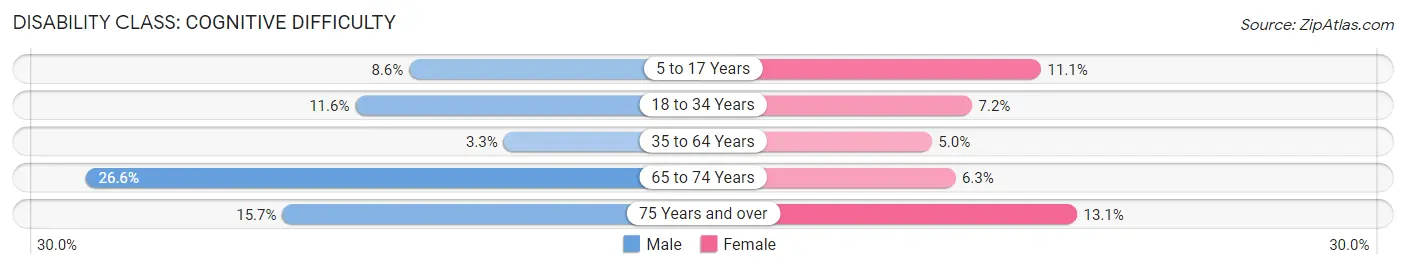
| Age Bracket | Male | Female |
| 5 to 17 Years | 62 (8.6%) | 111 (11.1%) |
| 18 to 34 Years | 86 (11.6%) | 66 (7.2%) |
| 35 to 64 Years | 50 (3.3%) | 88 (5.0%) |
| 65 to 74 Years | 79 (26.6%) | 23 (6.3%) |
| 75 Years and over | 18 (15.7%) | 26 (13.1%) |
Disability Class: Ambulatory Difficulty
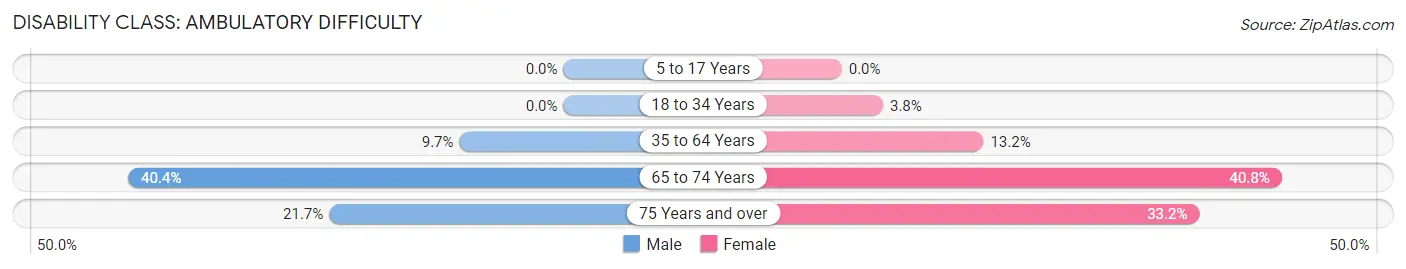
| Age Bracket | Male | Female |
| 5 to 17 Years | 0 (0.0%) | 0 (0.0%) |
| 18 to 34 Years | 0 (0.0%) | 35 (3.8%) |
| 35 to 64 Years | 145 (9.7%) | 232 (13.2%) |
| 65 to 74 Years | 120 (40.4%) | 149 (40.8%) |
| 75 Years and over | 25 (21.7%) | 66 (33.2%) |
Disability Class: Self-Care Difficulty
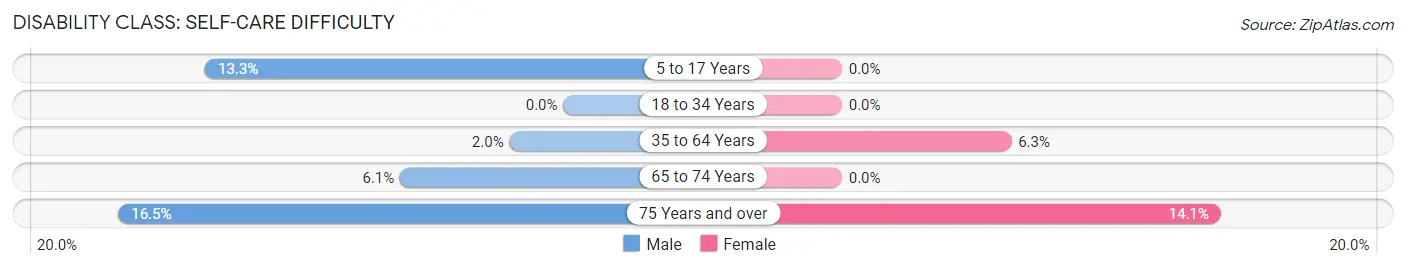
| Age Bracket | Male | Female |
| 5 to 17 Years | 96 (13.3%) | 0 (0.0%) |
| 18 to 34 Years | 0 (0.0%) | 0 (0.0%) |
| 35 to 64 Years | 30 (2.0%) | 111 (6.3%) |
| 65 to 74 Years | 18 (6.1%) | 0 (0.0%) |
| 75 Years and over | 19 (16.5%) | 28 (14.1%) |
Technology Access in Charlestown
Computing Device Access in Charlestown
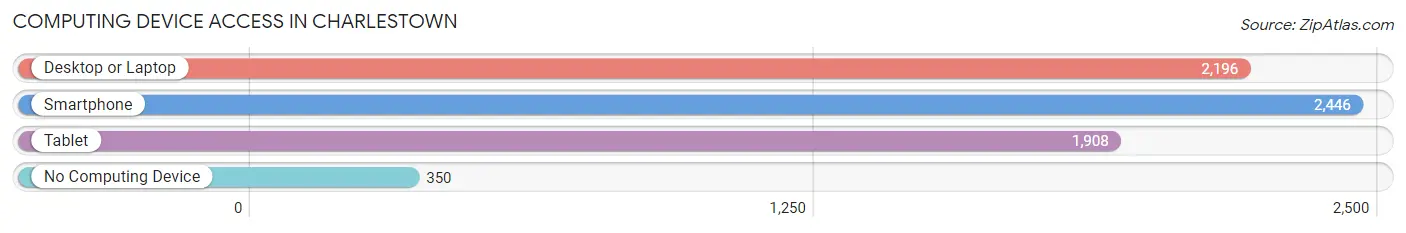
| Device Type | # Households | % Households |
| Desktop or Laptop | 2,196 | 72.0% |
| Smartphone | 2,446 | 80.2% |
| Tablet | 1,908 | 62.5% |
| No Computing Device | 350 | 11.5% |
| Total | 3,051 | 100.0% |
Internet Access in Charlestown
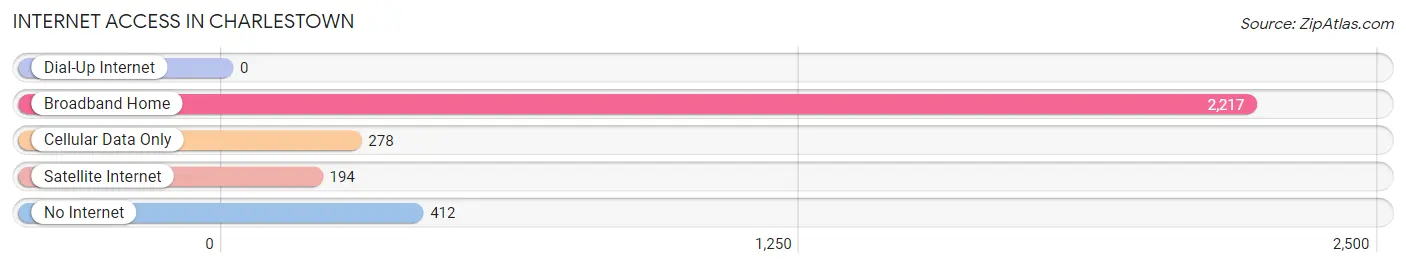
| Internet Type | # Households | % Households |
| Dial-Up Internet | 0 | 0.0% |
| Broadband Home | 2,217 | 72.7% |
| Cellular Data Only | 278 | 9.1% |
| Satellite Internet | 194 | 6.4% |
| No Internet | 412 | 13.5% |
| Total | 3,051 | 100.0% |
Charlestown Summary
Charlestown, Indiana is a small city located in Clark County, Indiana, United States. It is situated along the Ohio River, just across the river from Louisville, Kentucky. The city has a population of 8,637 as of the 2010 census, making it the second-largest city in Clark County.
History
Charlestown was founded in 1808 by a group of settlers from North Carolina. The town was named after Charles Beggs, one of the original settlers. The town was incorporated in 1817 and was the first town in Clark County.
In the early 19th century, Charlestown was a major port on the Ohio River, and it was a major stop on the Underground Railroad. The town was also a major center for the production of hemp and tobacco.
Geography
Charlestown is located at 38°20'N 85°45'W (38.33, -85.75). It is situated along the Ohio River, just across the river from Louisville, Kentucky. The city has a total area of 4.2 square miles, all of which is land.
Economy
Charlestown’s economy is largely based on manufacturing and tourism. The city is home to several large manufacturing companies, including Cummins, Inc., a diesel engine manufacturer, and the Charlestown Foundry, a steel foundry. The city is also home to several tourist attractions, including the Charlestown State Park, the Charlestown Riverfront, and the Charlestown Historic District.
Demographics
As of the 2010 census, there were 8,637 people, 3,541 households, and 2,092 families residing in the city. The population density was 2,062.2 people per square mile. The racial makeup of the city was 92.2% White, 4.2% African American, 0.3% Native American, 0.7% Asian, 0.1% Pacific Islander, 0.9% from other races, and 1.6% from two or more races. Hispanic or Latino of any race were 2.2% of the population.
The median income for a household in the city was $37,945, and the median income for a family was $45,945. The per capita income for the city was $19,945. About 11.3% of families and 14.2% of the population were below the poverty line, including 19.2% of those under age 18 and 8.2% of those age 65 or over.
Conclusion
Charlestown, Indiana is a small city located in Clark County, Indiana, United States. It is situated along the Ohio River, just across the river from Louisville, Kentucky. The city has a population of 8,637 as of the 2010 census, making it the second-largest city in Clark County. The city’s economy is largely based on manufacturing and tourism, and it is home to several large manufacturing companies and tourist attractions. The racial makeup of the city is 92.2% White, 4.2% African American, 0.3% Native American, 0.7% Asian, 0.1% Pacific Islander, 0.9% from other races, and 1.6% from two or more races. The median income for a household in the city was $37,945, and the median income for a family was $45,945. About 11.3% of families and 14.2% of the population were below the poverty line.
Common Questions
What is Per Capita Income in Charlestown?
Per Capita income in Charlestown is $30,900.
What is the Median Family Income in Charlestown?
Median Family Income in Charlestown is $78,889.
What is the Median Household income in Charlestown?
Median Household Income in Charlestown is $66,285.
What is Income or Wage Gap in Charlestown?
Income or Wage Gap in Charlestown is 22.6%.
Women in Charlestown earn 77.4 cents for every dollar earned by a man.
What is Inequality or Gini Index in Charlestown?
Inequality or Gini Index in Charlestown is 0.42.
What is the Total Population of Charlestown?
Total Population of Charlestown is 7,986.
What is the Total Male Population of Charlestown?
Total Male Population of Charlestown is 3,626.
What is the Total Female Population of Charlestown?
Total Female Population of Charlestown is 4,360.
What is the Ratio of Males per 100 Females in Charlestown?
There are 83.17 Males per 100 Females in Charlestown.
What is the Ratio of Females per 100 Males in Charlestown?
There are 120.24 Females per 100 Males in Charlestown.
What is the Median Population Age in Charlestown?
Median Population Age in Charlestown is 37.4 Years.
What is the Average Family Size in Charlestown
Average Family Size in Charlestown is 3.2 People.
What is the Average Household Size in Charlestown
Average Household Size in Charlestown is 2.6 People.
How Large is the Labor Force in Charlestown?
There are 3,957 People in the Labor Forcein in Charlestown.
What is the Percentage of People in the Labor Force in Charlestown?
64.9% of People are in the Labor Force in Charlestown.
What is the Unemployment Rate in Charlestown?
Unemployment Rate in Charlestown is 1.9%.