Edinburgh, IN Map & Demographics
Edinburgh Map
Edinburgh Overview
$25,378
PER CAPITA INCOME
$67,794
AVG FAMILY INCOME
$51,496
AVG HOUSEHOLD INCOME
1.2%
WAGE / INCOME GAP [ % ]
98.8¢/ $1
WAGE / INCOME GAP [ $ ]
0.33
INEQUALITY / GINI INDEX
4,144
TOTAL POPULATION
2,084
MALE POPULATION
2,060
FEMALE POPULATION
101.17
MALES / 100 FEMALES
98.85
FEMALES / 100 MALES
40.1
MEDIAN AGE
2.9
AVG FAMILY SIZE
2.4
AVG HOUSEHOLD SIZE
2,437
LABOR FORCE [ PEOPLE ]
70.8%
PERCENT IN LABOR FORCE
8.1%
UNEMPLOYMENT RATE
Edinburgh Zip Codes
Income in Edinburgh
Income Overview in Edinburgh
Per Capita Income in Edinburgh is $25,378, while median incomes of families and households are $67,794 and $51,496 respectively.
| Characteristic | Number | Measure |
| Per Capita Income | 4,144 | $25,378 |
| Median Family Income | 1,052 | $67,794 |
| Mean Family Income | 1,052 | $68,366 |
| Median Household Income | 1,749 | $51,496 |
| Mean Household Income | 1,749 | $59,143 |
| Income Deficit | 1,052 | $0 |
| Wage / Income Gap (%) | 4,144 | 1.24% |
| Wage / Income Gap ($) | 4,144 | 98.76¢ per $1 |
| Gini / Inequality Index | 4,144 | 0.33 |
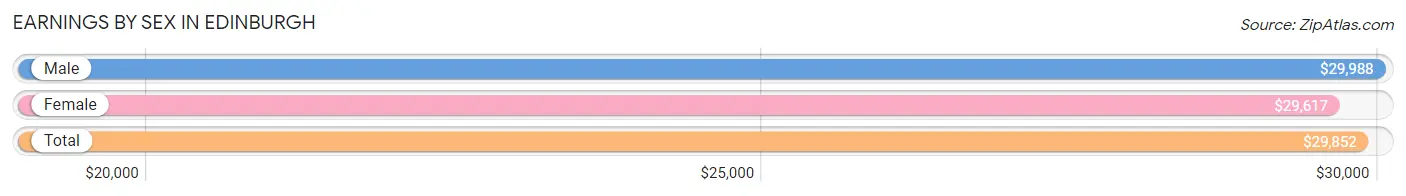
Earnings by Sex in Edinburgh
Average Earnings in Edinburgh are $29,852, $29,988 for men and $29,617 for women, a difference of 1.2%.
| Sex | Number | Average Earnings |
| Male | 1,209 (49.7%) | $29,988 |
| Female | 1,221 (50.2%) | $29,617 |
| Total | 2,430 (100.0%) | $29,852 |
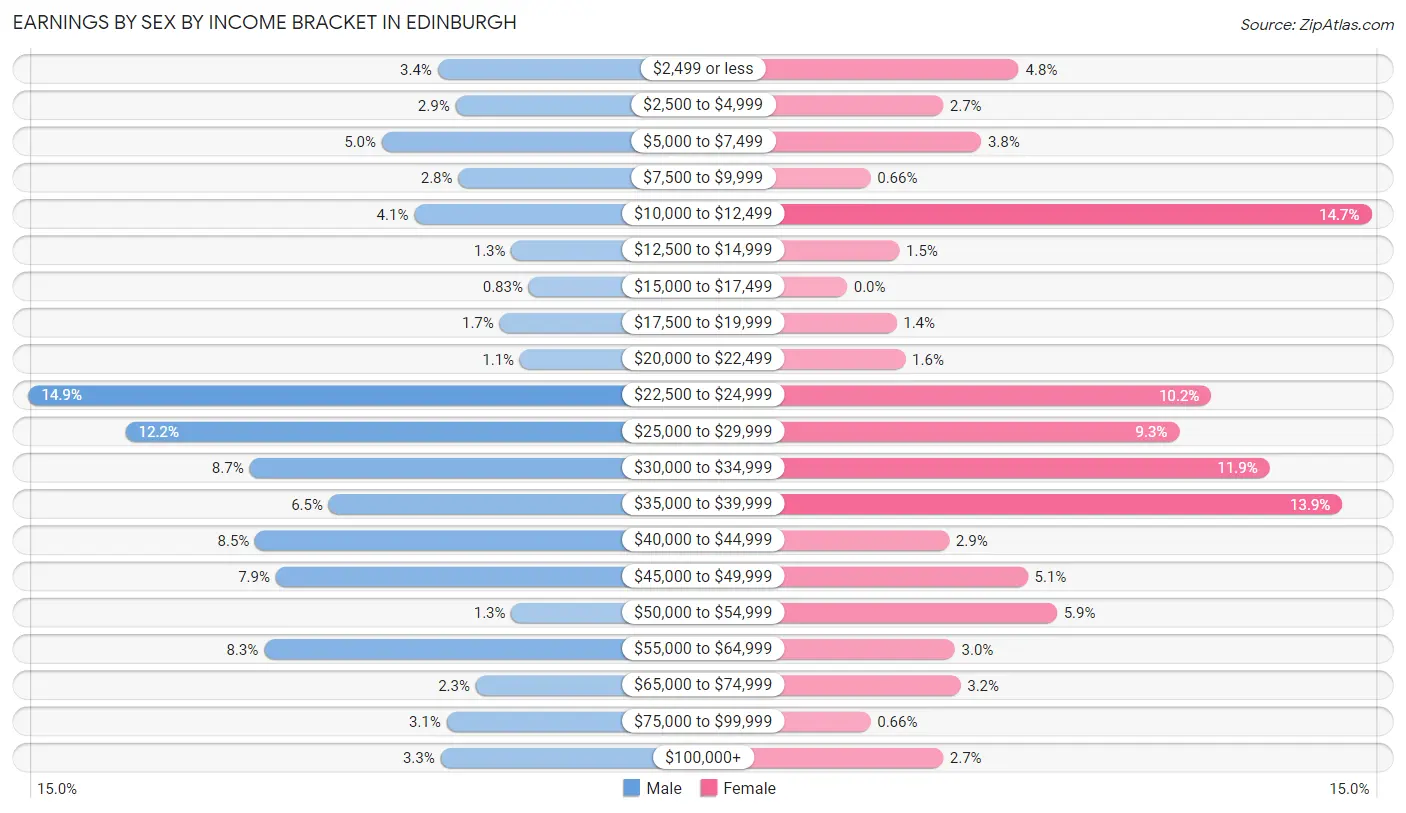
Earnings by Sex by Income Bracket in Edinburgh
The most common earnings brackets in Edinburgh are $22,500 to $24,999 for men (180 | 14.9%) and $10,000 to $12,499 for women (180 | 14.7%).
| Income | Male | Female |
| $2,499 or less | 41 (3.4%) | 59 (4.8%) |
| $2,500 to $4,999 | 35 (2.9%) | 33 (2.7%) |
| $5,000 to $7,499 | 60 (5.0%) | 46 (3.8%) |
| $7,500 to $9,999 | 34 (2.8%) | 8 (0.7%) |
| $10,000 to $12,499 | 49 (4.1%) | 180 (14.7%) |
| $12,500 to $14,999 | 16 (1.3%) | 18 (1.5%) |
| $15,000 to $17,499 | 10 (0.8%) | 0 (0.0%) |
| $17,500 to $19,999 | 20 (1.7%) | 17 (1.4%) |
| $20,000 to $22,499 | 13 (1.1%) | 20 (1.6%) |
| $22,500 to $24,999 | 180 (14.9%) | 125 (10.2%) |
| $25,000 to $29,999 | 147 (12.2%) | 114 (9.3%) |
| $30,000 to $34,999 | 105 (8.7%) | 145 (11.9%) |
| $35,000 to $39,999 | 78 (6.5%) | 170 (13.9%) |
| $40,000 to $44,999 | 103 (8.5%) | 35 (2.9%) |
| $45,000 to $49,999 | 96 (7.9%) | 62 (5.1%) |
| $50,000 to $54,999 | 16 (1.3%) | 72 (5.9%) |
| $55,000 to $64,999 | 100 (8.3%) | 37 (3.0%) |
| $65,000 to $74,999 | 28 (2.3%) | 39 (3.2%) |
| $75,000 to $99,999 | 38 (3.1%) | 8 (0.7%) |
| $100,000+ | 40 (3.3%) | 33 (2.7%) |
| Total | 1,209 (100.0%) | 1,221 (100.0%) |
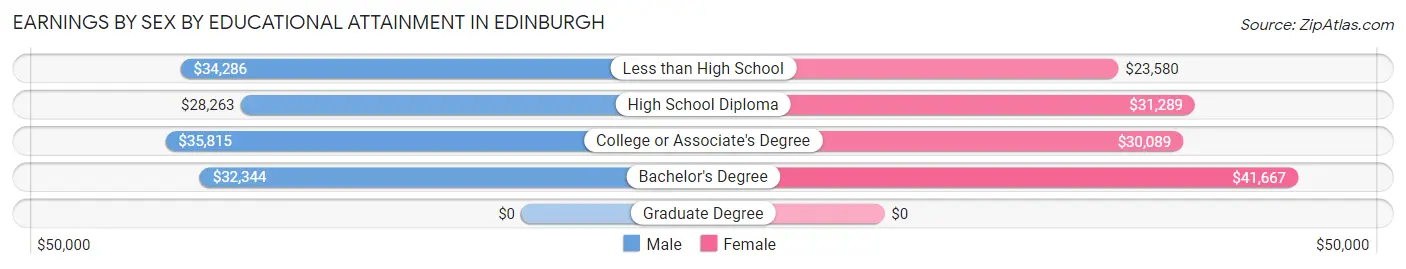
Earnings by Sex by Educational Attainment in Edinburgh
Average earnings in Edinburgh are $30,611 for men and $30,347 for women, a difference of 0.9%. Men with an educational attainment of college or associate's degree enjoy the highest average annual earnings of $35,815, while those with high school diploma education earn the least with $28,263. Women with an educational attainment of bachelor's degree earn the most with the average annual earnings of $41,667, while those with less than high school education have the smallest earnings of $23,580.
| Educational Attainment | Male Income | Female Income |
| Less than High School | $34,286 | $23,580 |
| High School Diploma | $28,263 | $31,289 |
| College or Associate's Degree | $35,815 | $30,089 |
| Bachelor's Degree | $32,344 | $41,667 |
| Graduate Degree | - | - |
| Total | $30,611 | $30,347 |
Family Income in Edinburgh
Family Income Brackets in Edinburgh
According to the Edinburgh family income data, there are 329 families falling into the $75,000 to $99,999 income range, which is the most common income bracket and makes up 31.3% of all families.
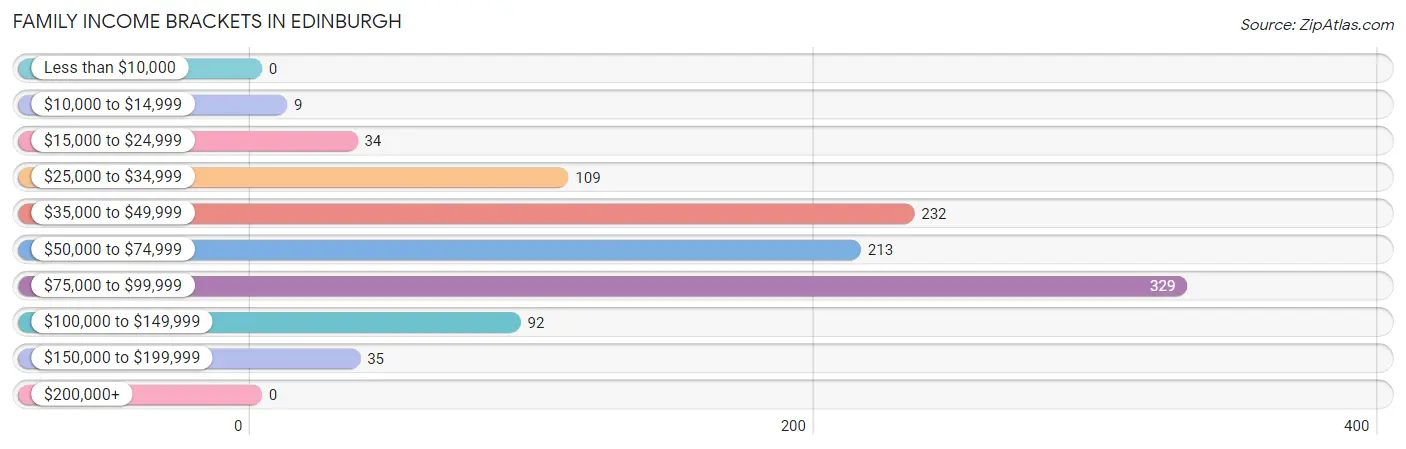
| Income Bracket | # Families | % Families |
| Less than $10,000 | 0 | 0.0% |
| $10,000 to $14,999 | 9 | 0.9% |
| $15,000 to $24,999 | 34 | 3.2% |
| $25,000 to $34,999 | 109 | 10.4% |
| $35,000 to $49,999 | 232 | 22.1% |
| $50,000 to $74,999 | 213 | 20.2% |
| $75,000 to $99,999 | 329 | 31.3% |
| $100,000 to $149,999 | 92 | 8.7% |
| $150,000 to $199,999 | 35 | 3.3% |
| $200,000+ | 0 | 0.0% |
Family Income by Famaliy Size in Edinburgh
3-person families (292 | 27.8%) account for the highest median family income in Edinburgh with $82,659 per family, while 2-person families (490 | 46.6%) have the highest median income of $32,322 per family member.
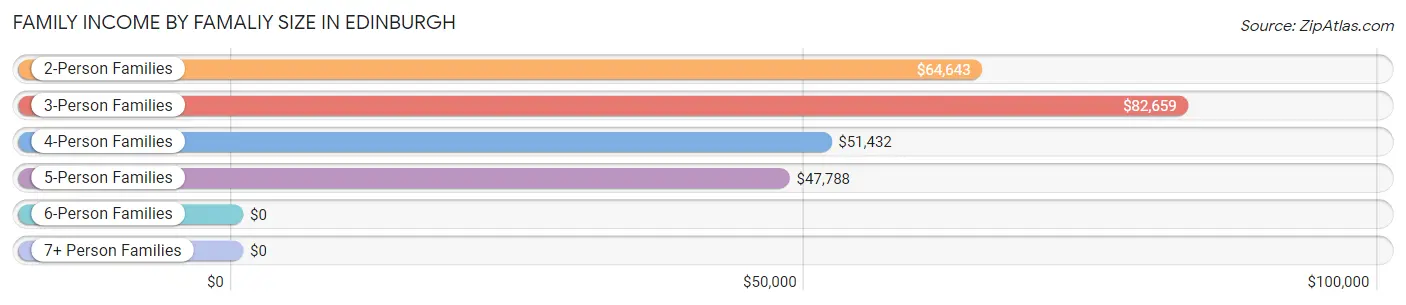
| Income Bracket | # Families | Median Income |
| 2-Person Families | 490 (46.6%) | $64,643 |
| 3-Person Families | 292 (27.8%) | $82,659 |
| 4-Person Families | 189 (18.0%) | $51,432 |
| 5-Person Families | 68 (6.5%) | $47,788 |
| 6-Person Families | 13 (1.2%) | $0 |
| 7+ Person Families | 0 (0.0%) | $0 |
| Total | 1,052 (100.0%) | $67,794 |
Family Income by Number of Earners in Edinburgh
The median family income in Edinburgh is $67,794, with families comprising 3+ earners (111) having the highest median family income of $81,705, while families with no earners (71) have the lowest median family income of $38,558, accounting for 10.5% and 6.8% of families, respectively.
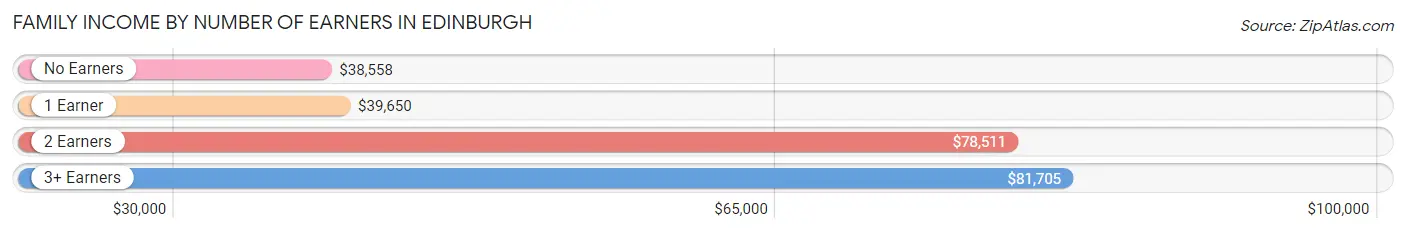
| Number of Earners | # Families | Median Income |
| No Earners | 71 (6.8%) | $38,558 |
| 1 Earner | 290 (27.6%) | $39,650 |
| 2 Earners | 580 (55.1%) | $78,511 |
| 3+ Earners | 111 (10.5%) | $81,705 |
| Total | 1,052 (100.0%) | $67,794 |
Household Income in Edinburgh
Household Income Brackets in Edinburgh
With 374 households falling in the category, the $50,000 to $74,999 income range is the most frequent in Edinburgh, accounting for 21.4% of all households.
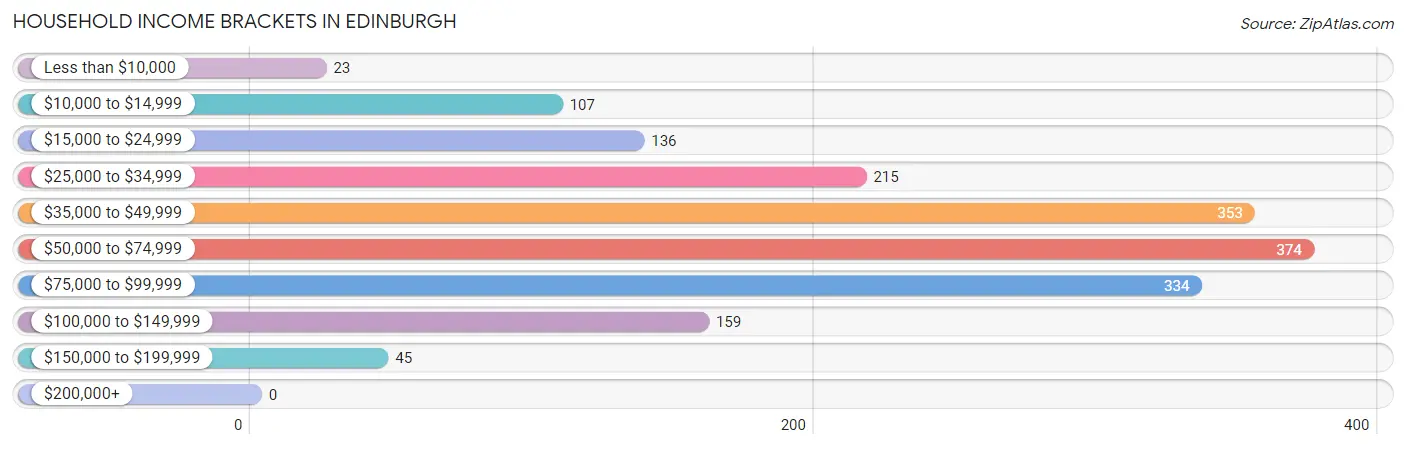
| Income Bracket | # Households | % Households |
| Less than $10,000 | 23 | 1.3% |
| $10,000 to $14,999 | 107 | 6.1% |
| $15,000 to $24,999 | 136 | 7.8% |
| $25,000 to $34,999 | 215 | 12.3% |
| $35,000 to $49,999 | 353 | 20.2% |
| $50,000 to $74,999 | 374 | 21.4% |
| $75,000 to $99,999 | 334 | 19.1% |
| $100,000 to $149,999 | 159 | 9.1% |
| $150,000 to $199,999 | 45 | 2.6% |
| $200,000+ | 0 | 0.0% |
Household Income by Householder Age in Edinburgh
The median household income in Edinburgh is $51,496, with the highest median household income of $80,833 found in the 15 to 24 years age bracket for the primary householder. A total of 40 households (2.3%) fall into this category. Meanwhile, the 65+ years age bracket for the primary householder has the lowest median household income of $41,250, with 416 households (23.8%) in this group.

| Income Bracket | # Households | Median Income |
| 15 to 24 Years | 40 (2.3%) | $80,833 |
| 25 to 44 Years | 517 (29.6%) | $61,675 |
| 45 to 64 Years | 776 (44.4%) | $50,318 |
| 65+ Years | 416 (23.8%) | $41,250 |
| Total | 1,749 (100.0%) | $51,496 |
Poverty in Edinburgh
Income Below Poverty by Sex and Age in Edinburgh
With 15.6% poverty level for males and 10.9% for females among the residents of Edinburgh, 6 to 11 year old males and 12 to 14 year old females are the most vulnerable to poverty, with 48 males (37.5%) and 26 females (28.9%) in their respective age groups living below the poverty level.
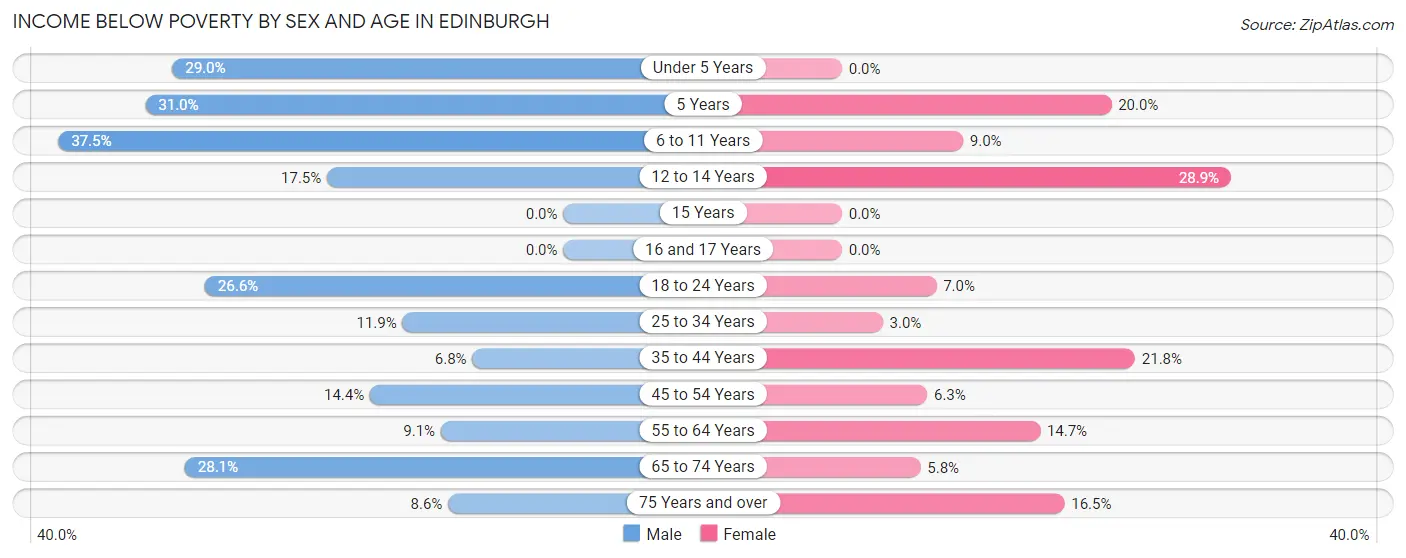
| Age Bracket | Male | Female |
| Under 5 Years | 27 (29.0%) | 0 (0.0%) |
| 5 Years | 9 (31.0%) | 8 (20.0%) |
| 6 to 11 Years | 48 (37.5%) | 8 (9.0%) |
| 12 to 14 Years | 10 (17.5%) | 26 (28.9%) |
| 15 Years | 0 (0.0%) | 0 (0.0%) |
| 16 and 17 Years | 0 (0.0%) | 0 (0.0%) |
| 18 to 24 Years | 29 (26.6%) | 11 (7.0%) |
| 25 to 34 Years | 48 (11.9%) | 10 (3.0%) |
| 35 to 44 Years | 21 (6.8%) | 52 (21.8%) |
| 45 to 54 Years | 32 (14.3%) | 20 (6.3%) |
| 55 to 64 Years | 29 (9.1%) | 55 (14.7%) |
| 65 to 74 Years | 59 (28.1%) | 7 (5.8%) |
| 75 Years and over | 13 (8.6%) | 19 (16.5%) |
| Total | 325 (15.6%) | 216 (10.9%) |
Income Above Poverty by Sex and Age in Edinburgh
According to the poverty statistics in Edinburgh, males aged 15 years and females aged under 5 years are the age groups that are most secure financially, with 100.0% of males and 100.0% of females in these age groups living above the poverty line.
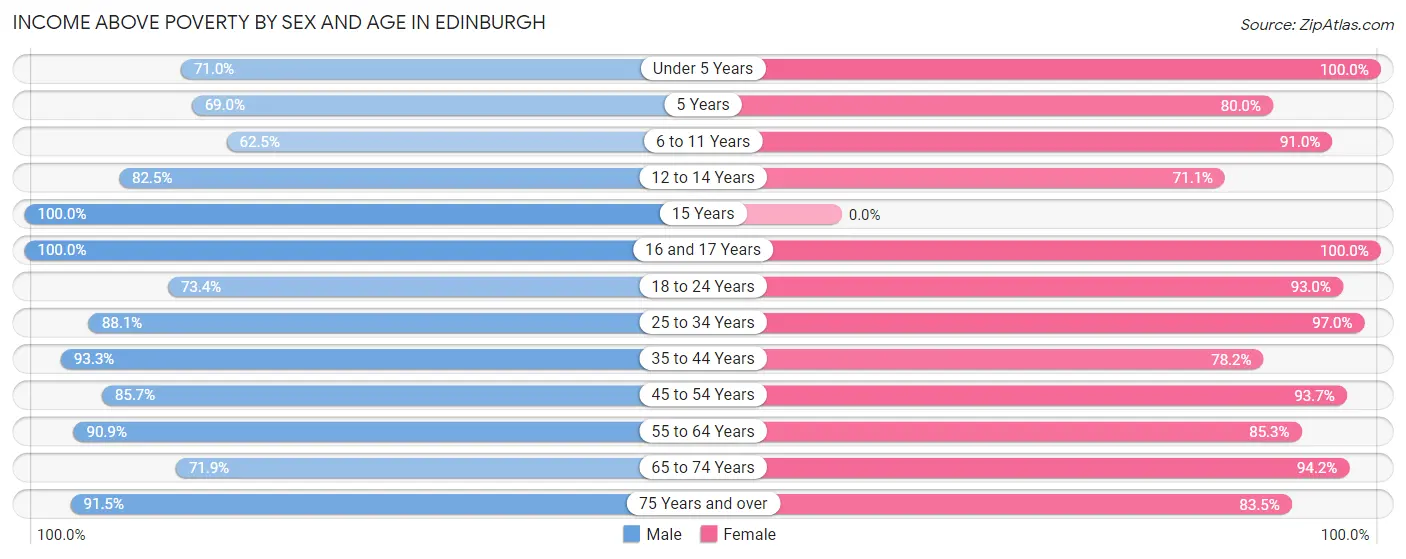
| Age Bracket | Male | Female |
| Under 5 Years | 66 (71.0%) | 85 (100.0%) |
| 5 Years | 20 (69.0%) | 32 (80.0%) |
| 6 to 11 Years | 80 (62.5%) | 81 (91.0%) |
| 12 to 14 Years | 47 (82.5%) | 64 (71.1%) |
| 15 Years | 8 (100.0%) | 0 (0.0%) |
| 16 and 17 Years | 43 (100.0%) | 22 (100.0%) |
| 18 to 24 Years | 80 (73.4%) | 146 (93.0%) |
| 25 to 34 Years | 354 (88.1%) | 320 (97.0%) |
| 35 to 44 Years | 290 (93.2%) | 187 (78.2%) |
| 45 to 54 Years | 191 (85.7%) | 296 (93.7%) |
| 55 to 64 Years | 290 (90.9%) | 319 (85.3%) |
| 65 to 74 Years | 151 (71.9%) | 113 (94.2%) |
| 75 Years and over | 139 (91.4%) | 96 (83.5%) |
| Total | 1,759 (84.4%) | 1,761 (89.1%) |
Income Below Poverty Among Married-Couple Families in Edinburgh
The poverty statistics for married-couple families in Edinburgh show that 4.6% or 34 of the total 733 families live below the poverty line. Families with 3 or 4 children have the highest poverty rate of 19.2%, comprising of 10 families. On the other hand, families with no children have the lowest poverty rate of 3.2%, which includes 15 families.
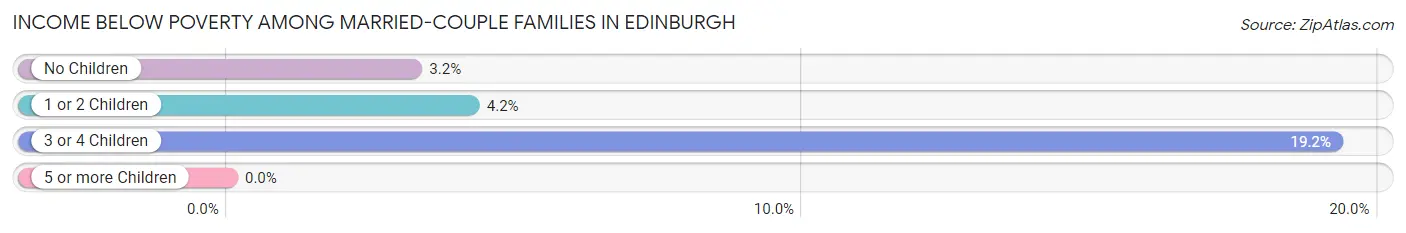
| Children | Above Poverty | Below Poverty |
| No Children | 452 (96.8%) | 15 (3.2%) |
| 1 or 2 Children | 205 (95.8%) | 9 (4.2%) |
| 3 or 4 Children | 42 (80.8%) | 10 (19.2%) |
| 5 or more Children | 0 (0.0%) | 0 (0.0%) |
| Total | 699 (95.4%) | 34 (4.6%) |
Income Below Poverty Among Single-Parent Households in Edinburgh
According to the poverty data in Edinburgh, 31.2% or 10 single-father households and 12.2% or 35 single-mother households are living below the poverty line. Among single-father households, those with 1 or 2 children have the highest poverty rate, with 10 households (31.2%) experiencing poverty. Likewise, among single-mother households, those with 3 or 4 children have the highest poverty rate, with 29 households (100.0%) falling below the poverty line.
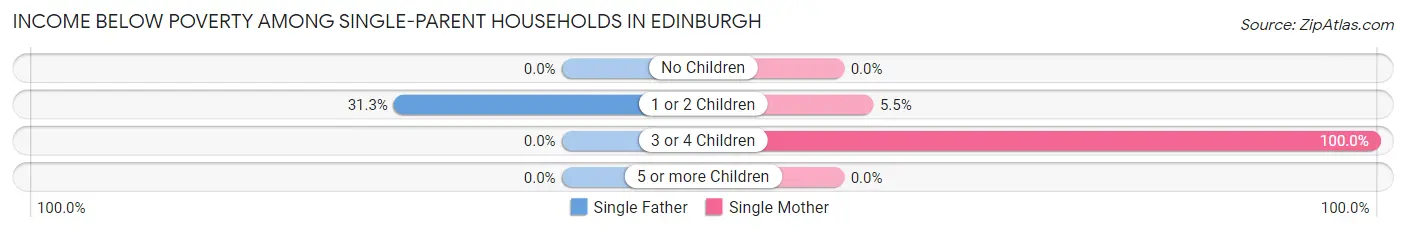
| Children | Single Father | Single Mother |
| No Children | 0 (0.0%) | 0 (0.0%) |
| 1 or 2 Children | 10 (31.2%) | 6 (5.4%) |
| 3 or 4 Children | 0 (0.0%) | 29 (100.0%) |
| 5 or more Children | 0 (0.0%) | 0 (0.0%) |
| Total | 10 (31.2%) | 35 (12.2%) |
Income Below Poverty Among Married-Couple vs Single-Parent Households in Edinburgh
The poverty data for Edinburgh shows that 34 of the married-couple family households (4.6%) and 45 of the single-parent households (14.1%) are living below the poverty level. Within the married-couple family households, those with 3 or 4 children have the highest poverty rate, with 10 households (19.2%) falling below the poverty line. Among the single-parent households, those with 3 or 4 children have the highest poverty rate, with 29 household (100.0%) living below poverty.
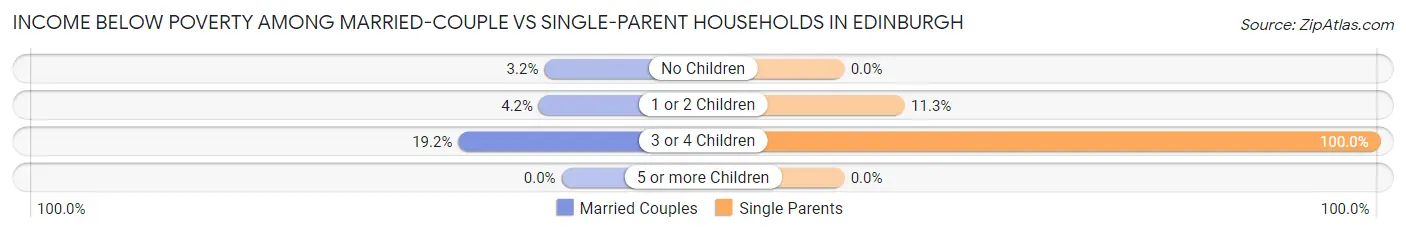
| Children | Married-Couple Families | Single-Parent Households |
| No Children | 15 (3.2%) | 0 (0.0%) |
| 1 or 2 Children | 9 (4.2%) | 16 (11.3%) |
| 3 or 4 Children | 10 (19.2%) | 29 (100.0%) |
| 5 or more Children | 0 (0.0%) | 0 (0.0%) |
| Total | 34 (4.6%) | 45 (14.1%) |
Race in Edinburgh
The most populous races in Edinburgh are White / Caucasian (4,052 | 97.8%), Two or more Races (56 | 1.3%), and Black / African American (13 | 0.3%).
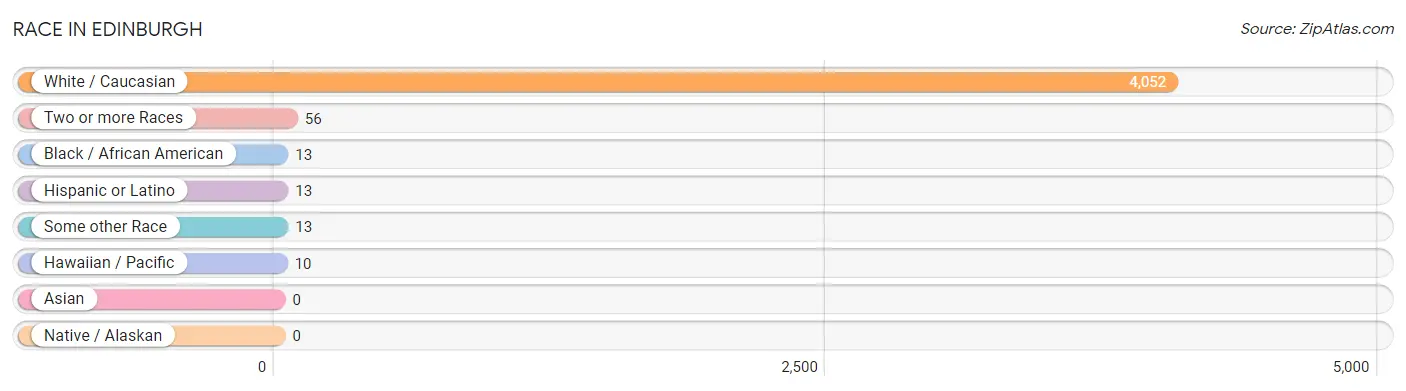
| Race | # Population | % Population |
| Asian | 0 | 0.0% |
| Black / African American | 13 | 0.3% |
| Hawaiian / Pacific | 10 | 0.2% |
| Hispanic or Latino | 13 | 0.3% |
| Native / Alaskan | 0 | 0.0% |
| White / Caucasian | 4,052 | 97.8% |
| Two or more Races | 56 | 1.3% |
| Some other Race | 13 | 0.3% |
| Total | 4,144 | 100.0% |
Ancestry in Edinburgh
The most populous ancestries reported in Edinburgh are German (514 | 12.4%), American (446 | 10.8%), Irish (354 | 8.5%), English (324 | 7.8%), and Welsh (86 | 2.1%), together accounting for 41.6% of all Edinburgh residents.
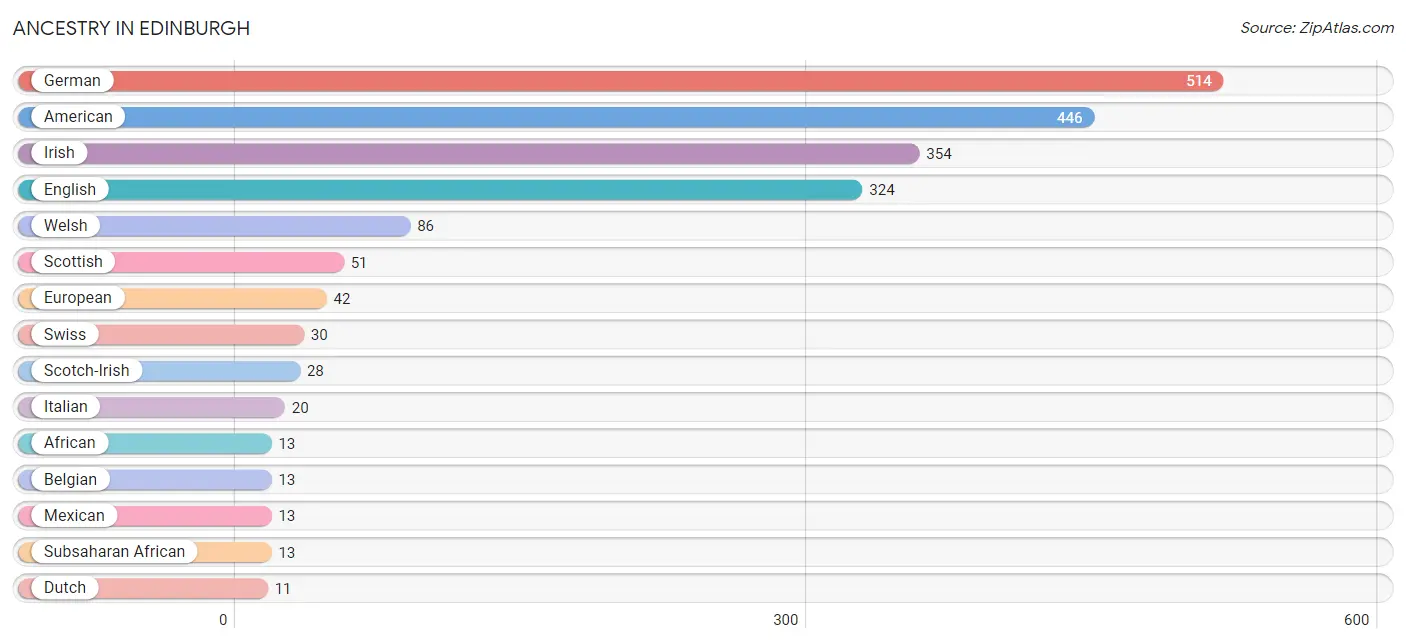
| Ancestry | # Population | % Population |
| African | 13 | 0.3% |
| American | 446 | 10.8% |
| Belgian | 13 | 0.3% |
| British | 6 | 0.1% |
| Dutch | 11 | 0.3% |
| English | 324 | 7.8% |
| European | 42 | 1.0% |
| French | 11 | 0.3% |
| German | 514 | 12.4% |
| Guamanian / Chamorro | 10 | 0.2% |
| Irish | 354 | 8.5% |
| Italian | 20 | 0.5% |
| Mexican | 13 | 0.3% |
| Native Hawaiian | 2 | 0.1% |
| Scandinavian | 7 | 0.2% |
| Scotch-Irish | 28 | 0.7% |
| Scottish | 51 | 1.2% |
| Subsaharan African | 13 | 0.3% |
| Swiss | 30 | 0.7% |
| Welsh | 86 | 2.1% | View All 20 Rows |
Immigrants in Edinburgh
The most numerous immigrant groups reported in Edinburgh came from Africa (13 | 0.3%), Eastern Africa (13 | 0.3%), Central America (3 | 0.1%), Latin America (3 | 0.1%), and Mexico (3 | 0.1%), together accounting for 0.8% of all Edinburgh residents.
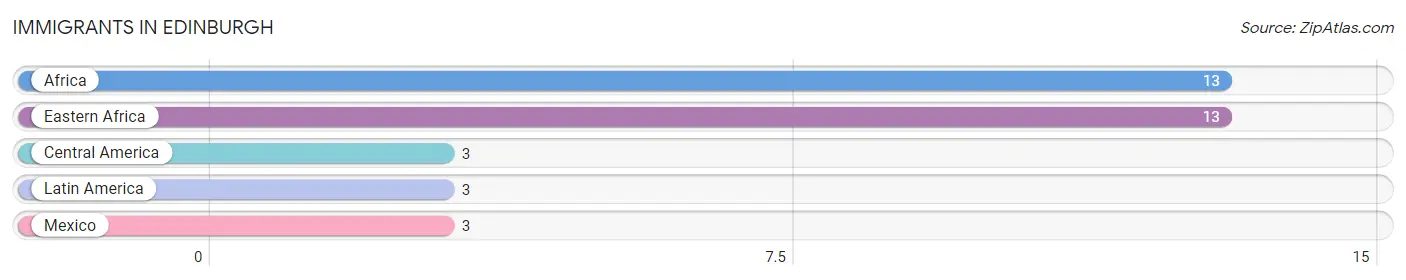
| Immigration Origin | # Population | % Population |
| Africa | 13 | 0.3% |
| Central America | 3 | 0.1% |
| Eastern Africa | 13 | 0.3% |
| Latin America | 3 | 0.1% |
| Mexico | 3 | 0.1% | View All 5 Rows |
Sex and Age in Edinburgh
Sex and Age in Edinburgh
The most populous age groups in Edinburgh are 25 to 29 Years (241 | 11.6%) for men and 25 to 29 Years (240 | 11.7%) for women.
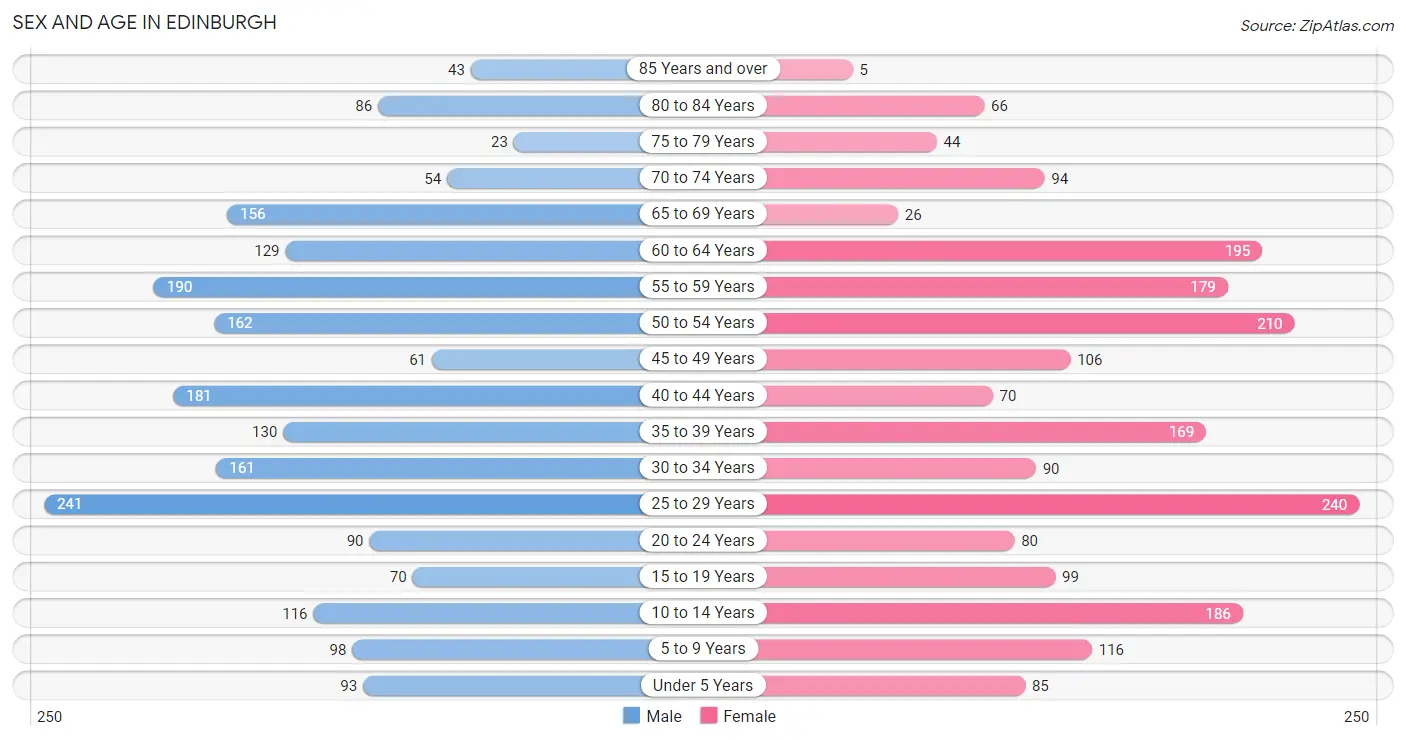
| Age Bracket | Male | Female |
| Under 5 Years | 93 (4.5%) | 85 (4.1%) |
| 5 to 9 Years | 98 (4.7%) | 116 (5.6%) |
| 10 to 14 Years | 116 (5.6%) | 186 (9.0%) |
| 15 to 19 Years | 70 (3.4%) | 99 (4.8%) |
| 20 to 24 Years | 90 (4.3%) | 80 (3.9%) |
| 25 to 29 Years | 241 (11.6%) | 240 (11.7%) |
| 30 to 34 Years | 161 (7.7%) | 90 (4.4%) |
| 35 to 39 Years | 130 (6.2%) | 169 (8.2%) |
| 40 to 44 Years | 181 (8.7%) | 70 (3.4%) |
| 45 to 49 Years | 61 (2.9%) | 106 (5.1%) |
| 50 to 54 Years | 162 (7.8%) | 210 (10.2%) |
| 55 to 59 Years | 190 (9.1%) | 179 (8.7%) |
| 60 to 64 Years | 129 (6.2%) | 195 (9.5%) |
| 65 to 69 Years | 156 (7.5%) | 26 (1.3%) |
| 70 to 74 Years | 54 (2.6%) | 94 (4.6%) |
| 75 to 79 Years | 23 (1.1%) | 44 (2.1%) |
| 80 to 84 Years | 86 (4.1%) | 66 (3.2%) |
| 85 Years and over | 43 (2.1%) | 5 (0.2%) |
| Total | 2,084 (100.0%) | 2,060 (100.0%) |
Families and Households in Edinburgh
Median Family Size in Edinburgh
The median family size in Edinburgh is 2.88 persons per family, with single male/father families (32 | 3.0%) accounting for the largest median family size of 3.97 persons per family. On the other hand, married-couple families (733 | 69.7%) represent the smallest median family size with 2.83 persons per family.
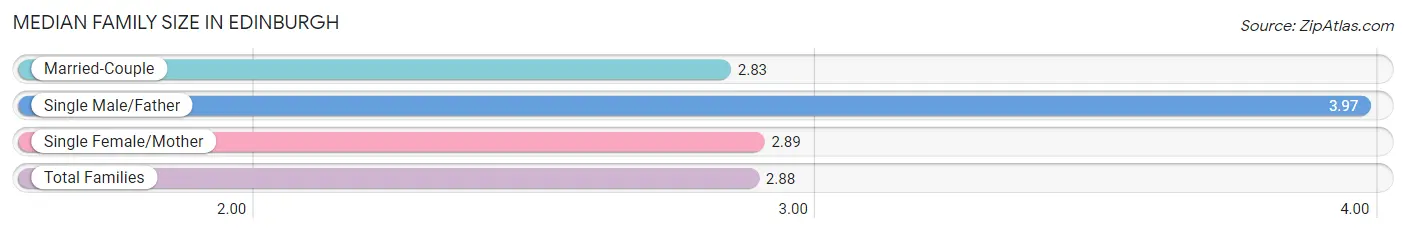
| Family Type | # Families | Family Size |
| Married-Couple | 733 (69.7%) | 2.83 |
| Single Male/Father | 32 (3.0%) | 3.97 |
| Single Female/Mother | 287 (27.3%) | 2.89 |
| Total Families | 1,052 (100.0%) | 2.88 |
Median Household Size in Edinburgh
The median household size in Edinburgh is 2.37 persons per household, with single male/father households (32 | 1.8%) accounting for the largest median household size of 3.97 persons per household. non-family households (697 | 39.9%) represent the smallest median household size with 1.17 persons per household.
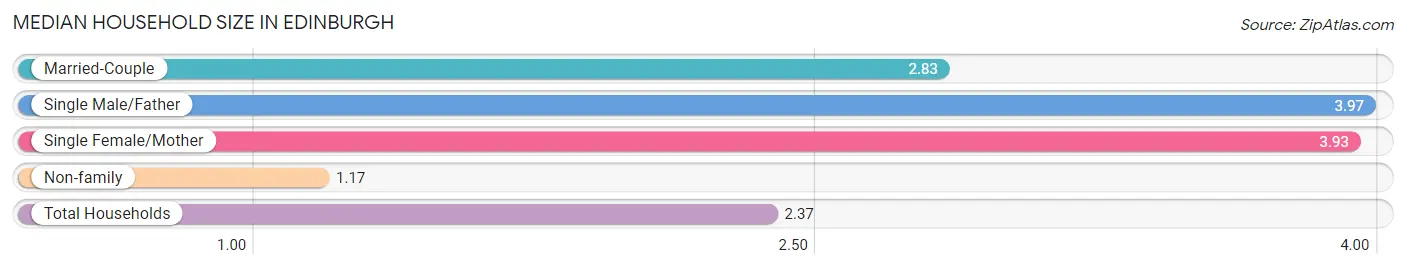
| Household Type | # Households | Household Size |
| Married-Couple | 733 (41.9%) | 2.83 |
| Single Male/Father | 32 (1.8%) | 3.97 |
| Single Female/Mother | 287 (16.4%) | 3.93 |
| Non-family | 697 (39.9%) | 1.17 |
| Total Households | 1,749 (100.0%) | 2.37 |
Household Size by Marriage Status in Edinburgh
Out of a total of 1,749 households in Edinburgh, 1,052 (60.2%) are family households, while 697 (39.9%) are nonfamily households. The most numerous type of family households are 2-person households, comprising 400, and the most common type of nonfamily households are 1-person households, comprising 595.
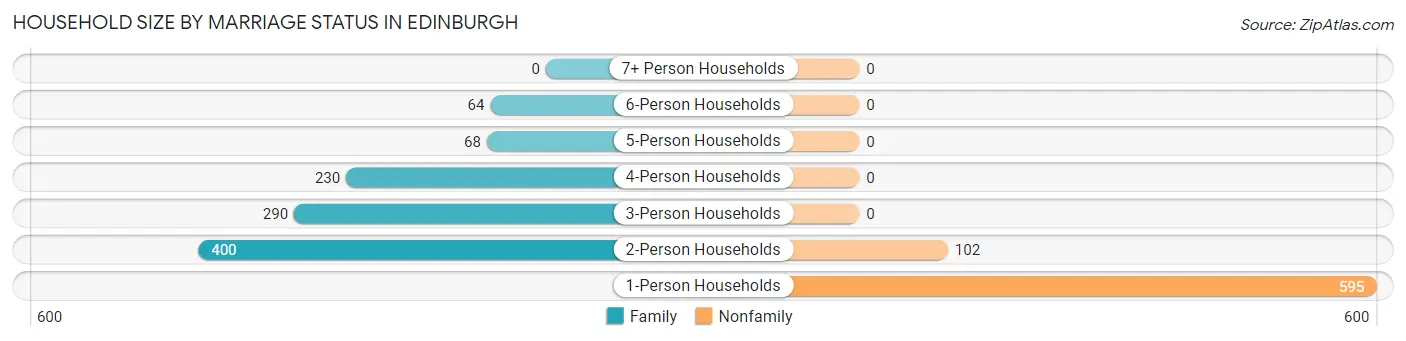
| Household Size | Family Households | Nonfamily Households |
| 1-Person Households | - | 595 (34.0%) |
| 2-Person Households | 400 (22.9%) | 102 (5.8%) |
| 3-Person Households | 290 (16.6%) | 0 (0.0%) |
| 4-Person Households | 230 (13.2%) | 0 (0.0%) |
| 5-Person Households | 68 (3.9%) | 0 (0.0%) |
| 6-Person Households | 64 (3.7%) | 0 (0.0%) |
| 7+ Person Households | 0 (0.0%) | 0 (0.0%) |
| Total | 1,052 (60.2%) | 697 (39.9%) |
Female Fertility in Edinburgh
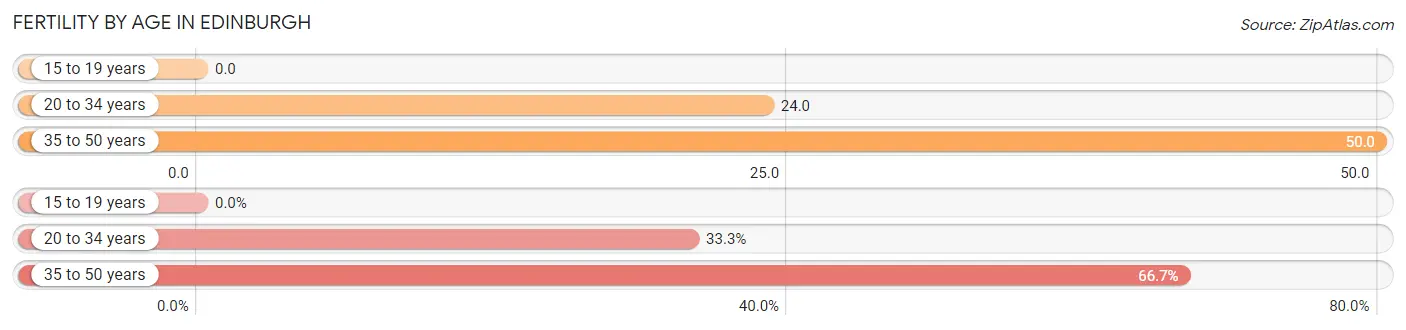
Fertility by Age in Edinburgh
Average fertility rate in Edinburgh is 33.0 births per 1,000 women. Women in the age bracket of 35 to 50 years have the highest fertility rate with 50.0 births per 1,000 women. Women in the age bracket of 35 to 50 years acount for 66.7% of all women with births.
| Age Bracket | Women with Births | Births / 1,000 Women |
| 15 to 19 years | 0 (0.0%) | 0.0 |
| 20 to 34 years | 10 (33.3%) | 24.0 |
| 35 to 50 years | 20 (66.7%) | 50.0 |
| Total | 30 (100.0%) | 33.0 |
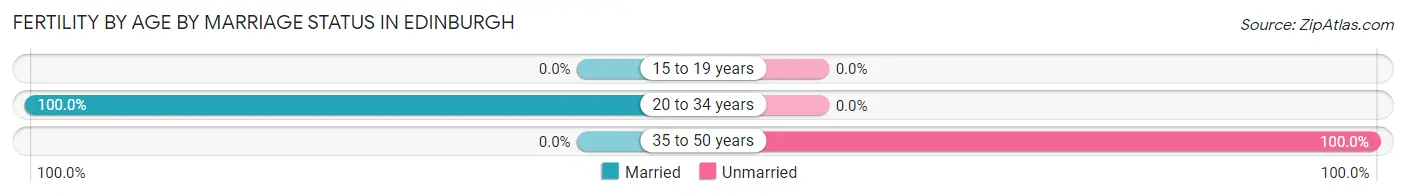
Fertility by Age by Marriage Status in Edinburgh
33.3% of women with births (30) in Edinburgh are married. The highest percentage of unmarried women with births falls into 35 to 50 years age bracket with 100.0% of them unmarried at the time of birth, while the lowest percentage of unmarried women with births belong to 20 to 34 years age bracket with 0.0% of them unmarried.
| Age Bracket | Married | Unmarried |
| 15 to 19 years | 0 (0.0%) | 0 (0.0%) |
| 20 to 34 years | 10 (100.0%) | 0 (0.0%) |
| 35 to 50 years | 0 (0.0%) | 20 (100.0%) |
| Total | 10 (33.3%) | 20 (66.7%) |
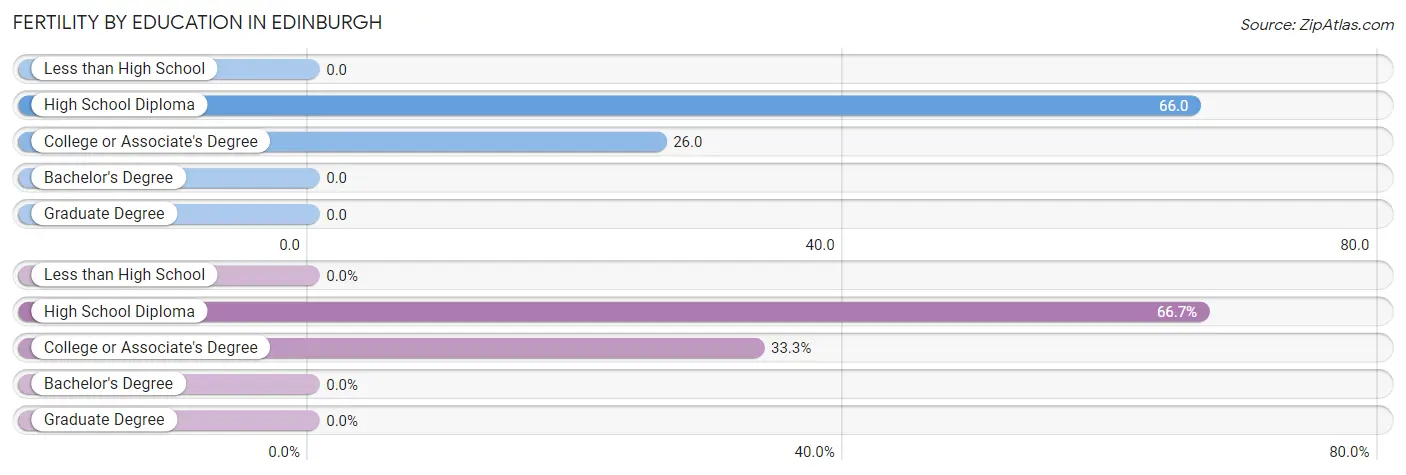
Fertility by Education in Edinburgh
| Educational Attainment | Women with Births | Births / 1,000 Women |
| Less than High School | 0 (0.0%) | 0.0 |
| High School Diploma | 20 (66.7%) | 66.0 |
| College or Associate's Degree | 10 (33.3%) | 26.0 |
| Bachelor's Degree | 0 (0.0%) | 0.0 |
| Graduate Degree | 0 (0.0%) | 0.0 |
| Total | 30 (100.0%) | 33.0 |
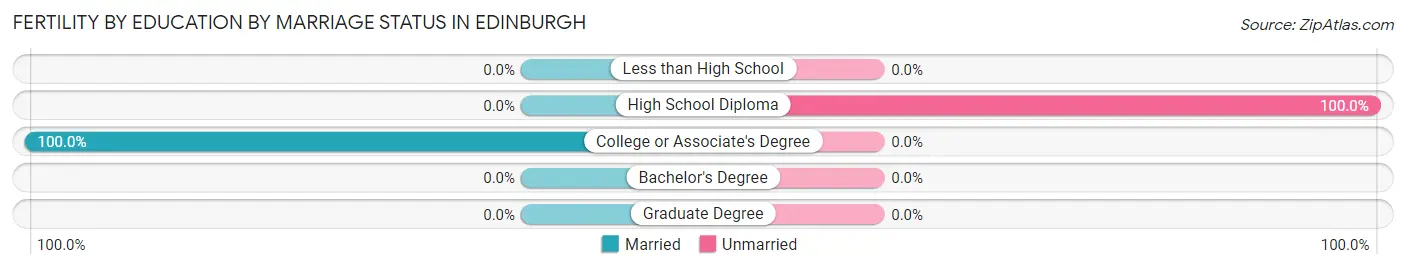
Fertility by Education by Marriage Status in Edinburgh
66.7% of women with births in Edinburgh are unmarried. Women with the educational attainment of college or associate's degree are most likely to be married with 100.0% of them married at childbirth, while women with the educational attainment of high school diploma are least likely to be married with 100.0% of them unmarried at childbirth.
| Educational Attainment | Married | Unmarried |
| Less than High School | 0 (0.0%) | 0 (0.0%) |
| High School Diploma | 0 (0.0%) | 20 (100.0%) |
| College or Associate's Degree | 10 (100.0%) | 0 (0.0%) |
| Bachelor's Degree | 0 (0.0%) | 0 (0.0%) |
| Graduate Degree | 0 (0.0%) | 0 (0.0%) |
| Total | 10 (33.3%) | 20 (66.7%) |
Employment Characteristics in Edinburgh
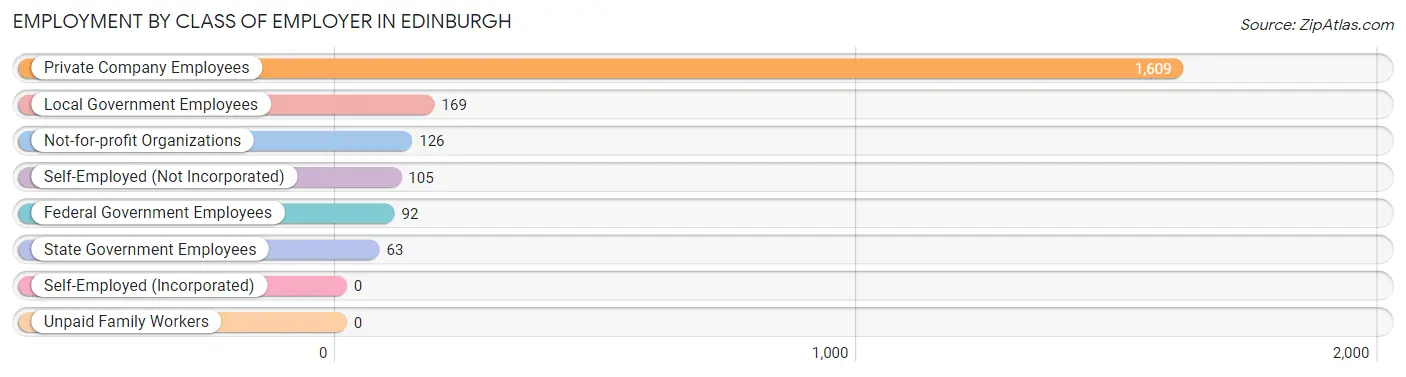
Employment by Class of Employer in Edinburgh
Among the 2,164 employed individuals in Edinburgh, private company employees (1,609 | 74.4%), local government employees (169 | 7.8%), and not-for-profit organizations (126 | 5.8%) make up the most common classes of employment.
| Employer Class | # Employees | % Employees |
| Private Company Employees | 1,609 | 74.4% |
| Self-Employed (Incorporated) | 0 | 0.0% |
| Self-Employed (Not Incorporated) | 105 | 4.9% |
| Not-for-profit Organizations | 126 | 5.8% |
| Local Government Employees | 169 | 7.8% |
| State Government Employees | 63 | 2.9% |
| Federal Government Employees | 92 | 4.3% |
| Unpaid Family Workers | 0 | 0.0% |
| Total | 2,164 | 100.0% |
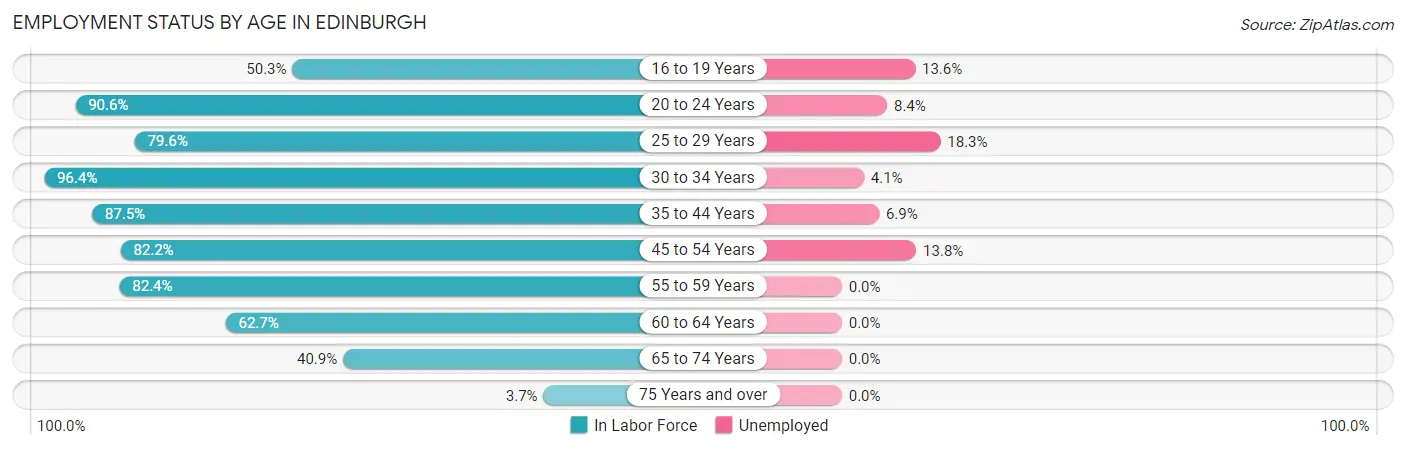
Employment Status by Age in Edinburgh
According to the labor force statistics for Edinburgh, out of the total population over 16 years of age (3,442), 70.8% or 2,437 individuals are in the labor force, with 8.1% or 197 of them unemployed. The age group with the highest labor force participation rate is 30 to 34 years, with 96.4% or 242 individuals in the labor force. Within the labor force, the 25 to 29 years age range has the highest percentage of unemployed individuals, with 18.3% or 70 of them being unemployed.
| Age Bracket | In Labor Force | Unemployed |
| 16 to 19 Years | 81 (50.3%) | 11 (13.6%) |
| 20 to 24 Years | 154 (90.6%) | 13 (8.4%) |
| 25 to 29 Years | 383 (79.6%) | 70 (18.3%) |
| 30 to 34 Years | 242 (96.4%) | 10 (4.1%) |
| 35 to 44 Years | 481 (87.5%) | 33 (6.9%) |
| 45 to 54 Years | 443 (82.2%) | 61 (13.8%) |
| 55 to 59 Years | 304 (82.4%) | 0 (0.0%) |
| 60 to 64 Years | 203 (62.7%) | 0 (0.0%) |
| 65 to 74 Years | 135 (40.9%) | 0 (0.0%) |
| 75 Years and over | 10 (3.7%) | 0 (0.0%) |
| Total | 2,437 (70.8%) | 197 (8.1%) |
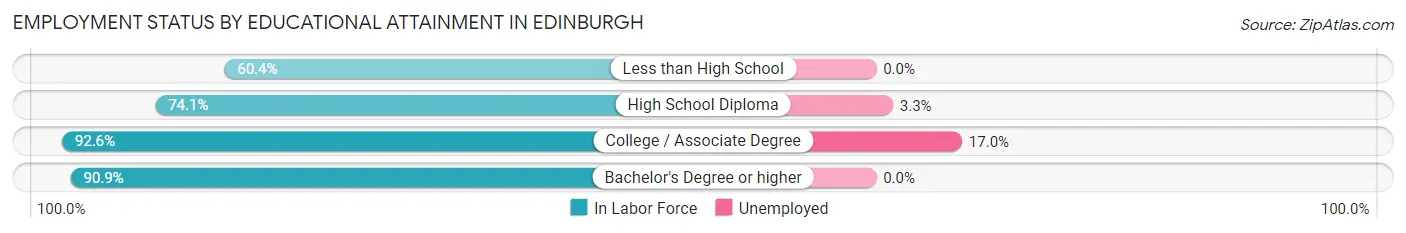
Employment Status by Educational Attainment in Edinburgh
According to labor force statistics for Edinburgh, 81.8% of individuals (2,056) out of the total population between 25 and 64 years of age (2,514) are in the labor force, with 8.5% or 175 of them being unemployed. The group with the highest labor force participation rate are those with the educational attainment of college / associate degree, with 92.6% or 865 individuals in the labor force. Within the labor force, individuals with college / associate degree education have the highest percentage of unemployment, with 17.0% or 147 of them being unemployed.
| Educational Attainment | In Labor Force | Unemployed |
| Less than High School | 113 (60.4%) | 0 (0.0%) |
| High School Diploma | 828 (74.1%) | 37 (3.3%) |
| College / Associate Degree | 865 (92.6%) | 159 (17.0%) |
| Bachelor's Degree or higher | 250 (90.9%) | 0 (0.0%) |
| Total | 2,056 (81.8%) | 214 (8.5%) |
Employment Occupations by Sex in Edinburgh
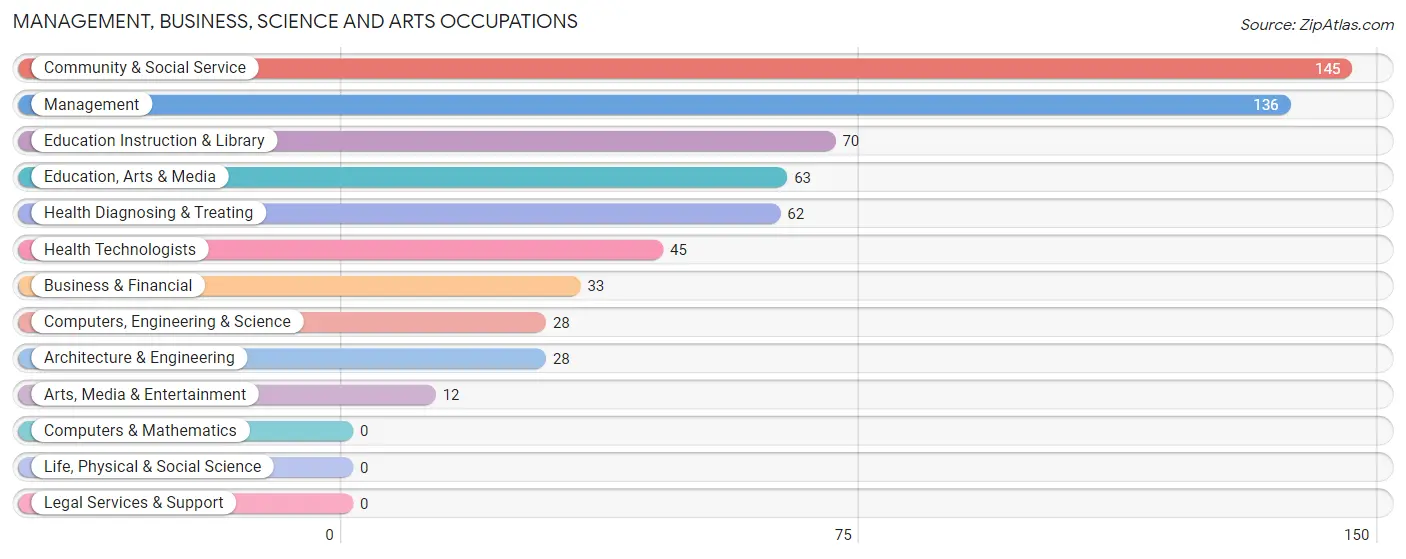
Management, Business, Science and Arts Occupations
The most common Management, Business, Science and Arts occupations in Edinburgh are Community & Social Service (145 | 6.5%), Management (136 | 6.1%), Education Instruction & Library (70 | 3.1%), Education, Arts & Media (63 | 2.8%), and Health Diagnosing & Treating (62 | 2.8%).
Management, Business, Science and Arts Occupations by Sex
Within the Management, Business, Science and Arts occupations in Edinburgh, the most male-oriented occupations are Computers, Engineering & Science (100.0%), Architecture & Engineering (100.0%), and Arts, Media & Entertainment (100.0%), while the most female-oriented occupations are Health Diagnosing & Treating (100.0%), Health Technologists (100.0%), and Education Instruction & Library (64.3%).
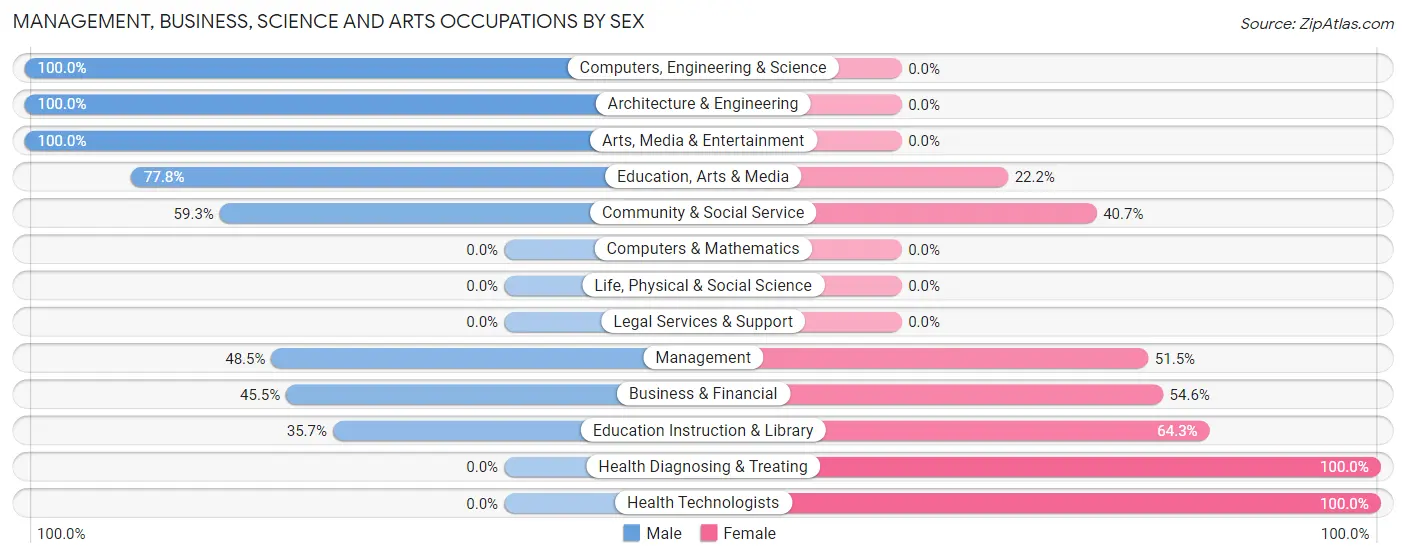
| Occupation | Male | Female |
| Management | 66 (48.5%) | 70 (51.5%) |
| Business & Financial | 15 (45.5%) | 18 (54.5%) |
| Computers, Engineering & Science | 28 (100.0%) | 0 (0.0%) |
| Computers & Mathematics | 0 (0.0%) | 0 (0.0%) |
| Architecture & Engineering | 28 (100.0%) | 0 (0.0%) |
| Life, Physical & Social Science | 0 (0.0%) | 0 (0.0%) |
| Community & Social Service | 86 (59.3%) | 59 (40.7%) |
| Education, Arts & Media | 49 (77.8%) | 14 (22.2%) |
| Legal Services & Support | 0 (0.0%) | 0 (0.0%) |
| Education Instruction & Library | 25 (35.7%) | 45 (64.3%) |
| Arts, Media & Entertainment | 12 (100.0%) | 0 (0.0%) |
| Health Diagnosing & Treating | 0 (0.0%) | 62 (100.0%) |
| Health Technologists | 0 (0.0%) | 45 (100.0%) |
| Total (Category) | 195 (48.3%) | 209 (51.7%) |
| Total (Overall) | 1,125 (50.3%) | 1,113 (49.7%) |
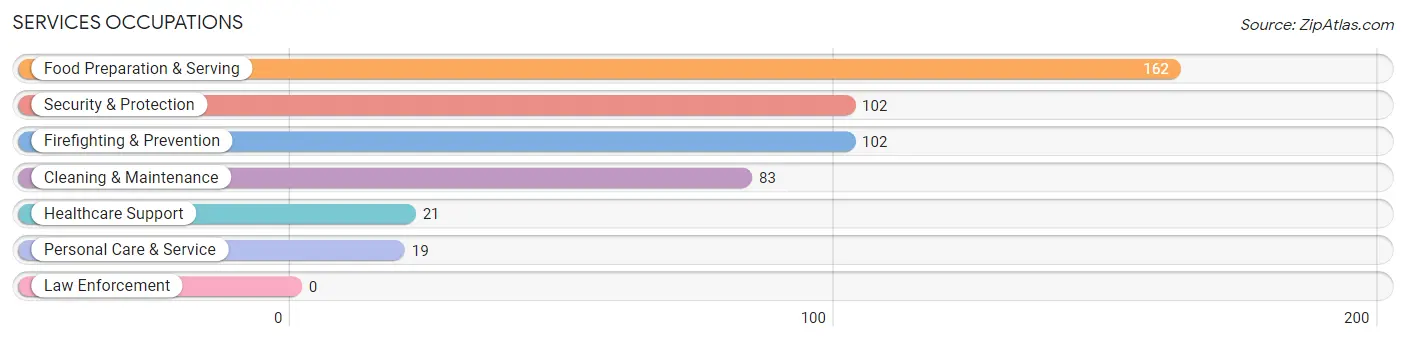
Services Occupations
The most common Services occupations in Edinburgh are Food Preparation & Serving (162 | 7.2%), Security & Protection (102 | 4.6%), Firefighting & Prevention (102 | 4.6%), Cleaning & Maintenance (83 | 3.7%), and Healthcare Support (21 | 0.9%).
Services Occupations by Sex
Within the Services occupations in Edinburgh, the most male-oriented occupations are Security & Protection (100.0%), Firefighting & Prevention (100.0%), and Personal Care & Service (84.2%), while the most female-oriented occupations are Healthcare Support (100.0%), Food Preparation & Serving (100.0%), and Cleaning & Maintenance (54.2%).
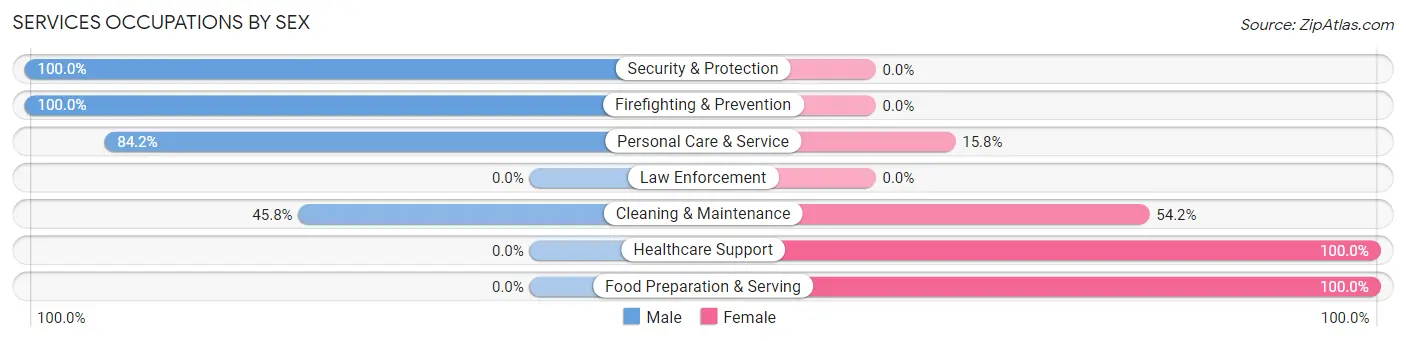
| Occupation | Male | Female |
| Healthcare Support | 0 (0.0%) | 21 (100.0%) |
| Security & Protection | 102 (100.0%) | 0 (0.0%) |
| Firefighting & Prevention | 102 (100.0%) | 0 (0.0%) |
| Law Enforcement | 0 (0.0%) | 0 (0.0%) |
| Food Preparation & Serving | 0 (0.0%) | 162 (100.0%) |
| Cleaning & Maintenance | 38 (45.8%) | 45 (54.2%) |
| Personal Care & Service | 16 (84.2%) | 3 (15.8%) |
| Total (Category) | 156 (40.3%) | 231 (59.7%) |
| Total (Overall) | 1,125 (50.3%) | 1,113 (49.7%) |
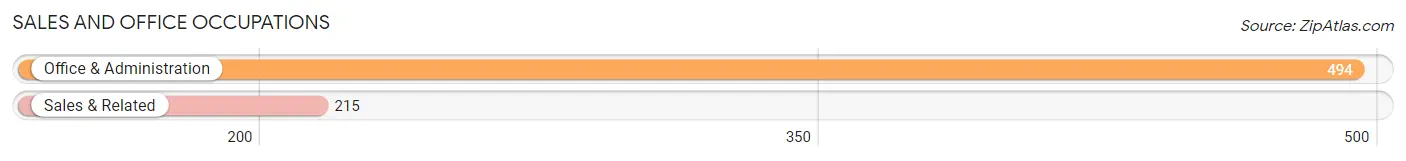
Sales and Office Occupations
The most common Sales and Office occupations in Edinburgh are Office & Administration (494 | 22.1%), and Sales & Related (215 | 9.6%).
Sales and Office Occupations by Sex
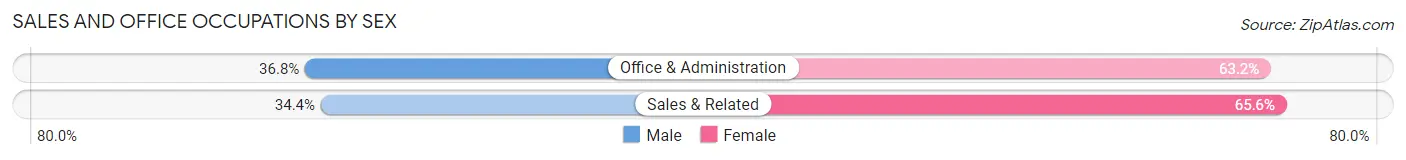
| Occupation | Male | Female |
| Sales & Related | 74 (34.4%) | 141 (65.6%) |
| Office & Administration | 182 (36.8%) | 312 (63.2%) |
| Total (Category) | 256 (36.1%) | 453 (63.9%) |
| Total (Overall) | 1,125 (50.3%) | 1,113 (49.7%) |
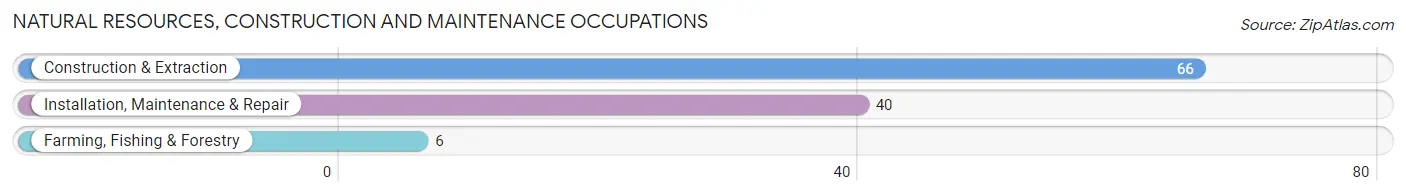
Natural Resources, Construction and Maintenance Occupations
The most common Natural Resources, Construction and Maintenance occupations in Edinburgh are Construction & Extraction (66 | 2.9%), Installation, Maintenance & Repair (40 | 1.8%), and Farming, Fishing & Forestry (6 | 0.3%).
Natural Resources, Construction and Maintenance Occupations by Sex
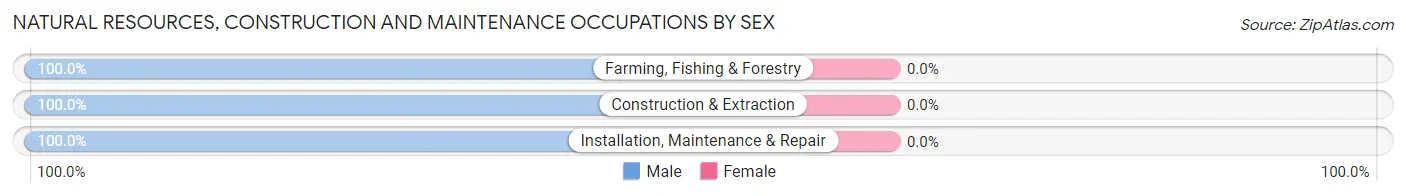
| Occupation | Male | Female |
| Farming, Fishing & Forestry | 6 (100.0%) | 0 (0.0%) |
| Construction & Extraction | 66 (100.0%) | 0 (0.0%) |
| Installation, Maintenance & Repair | 40 (100.0%) | 0 (0.0%) |
| Total (Category) | 112 (100.0%) | 0 (0.0%) |
| Total (Overall) | 1,125 (50.3%) | 1,113 (49.7%) |
Production, Transportation and Moving Occupations
The most common Production, Transportation and Moving occupations in Edinburgh are Material Moving (275 | 12.3%), Production (260 | 11.6%), and Transportation (91 | 4.1%).
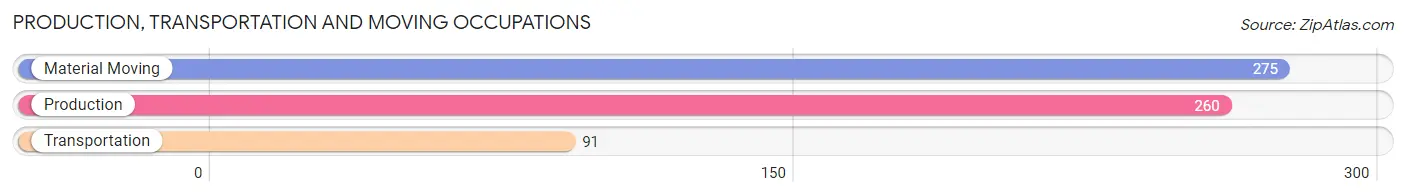
Production, Transportation and Moving Occupations by Sex
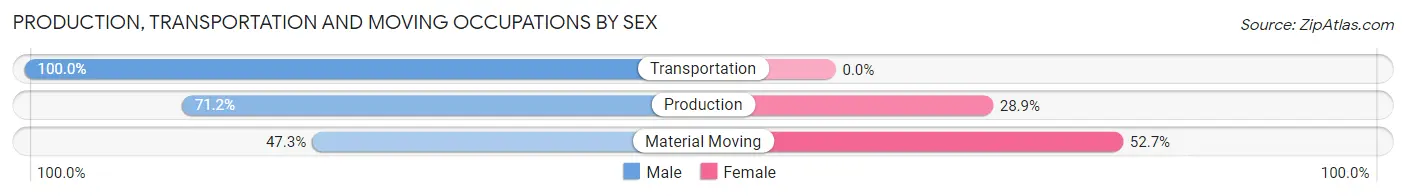
| Occupation | Male | Female |
| Production | 185 (71.2%) | 75 (28.8%) |
| Transportation | 91 (100.0%) | 0 (0.0%) |
| Material Moving | 130 (47.3%) | 145 (52.7%) |
| Total (Category) | 406 (64.9%) | 220 (35.1%) |
| Total (Overall) | 1,125 (50.3%) | 1,113 (49.7%) |
Employment Industries by Sex in Edinburgh
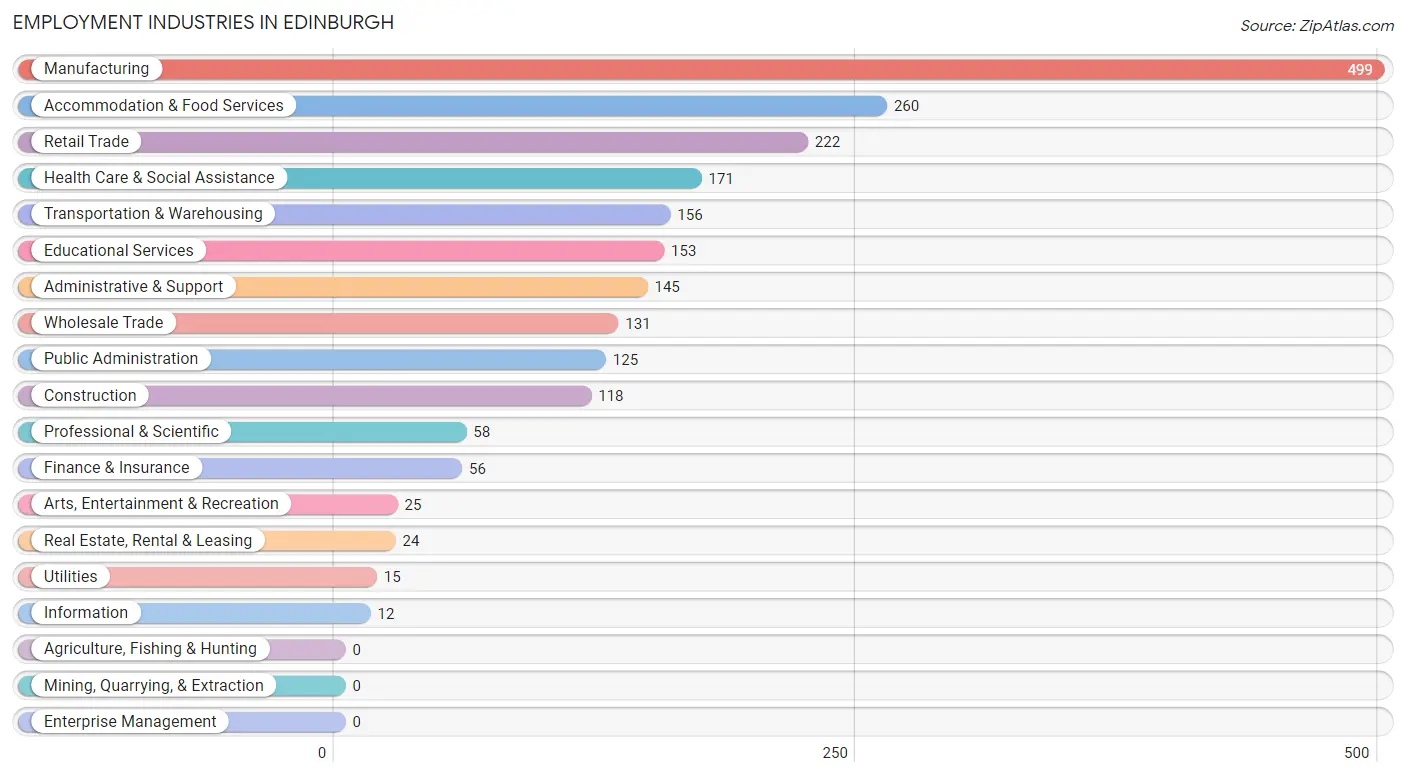
Employment Industries in Edinburgh
The major employment industries in Edinburgh include Manufacturing (499 | 22.3%), Accommodation & Food Services (260 | 11.6%), Retail Trade (222 | 9.9%), Health Care & Social Assistance (171 | 7.6%), and Transportation & Warehousing (156 | 7.0%).
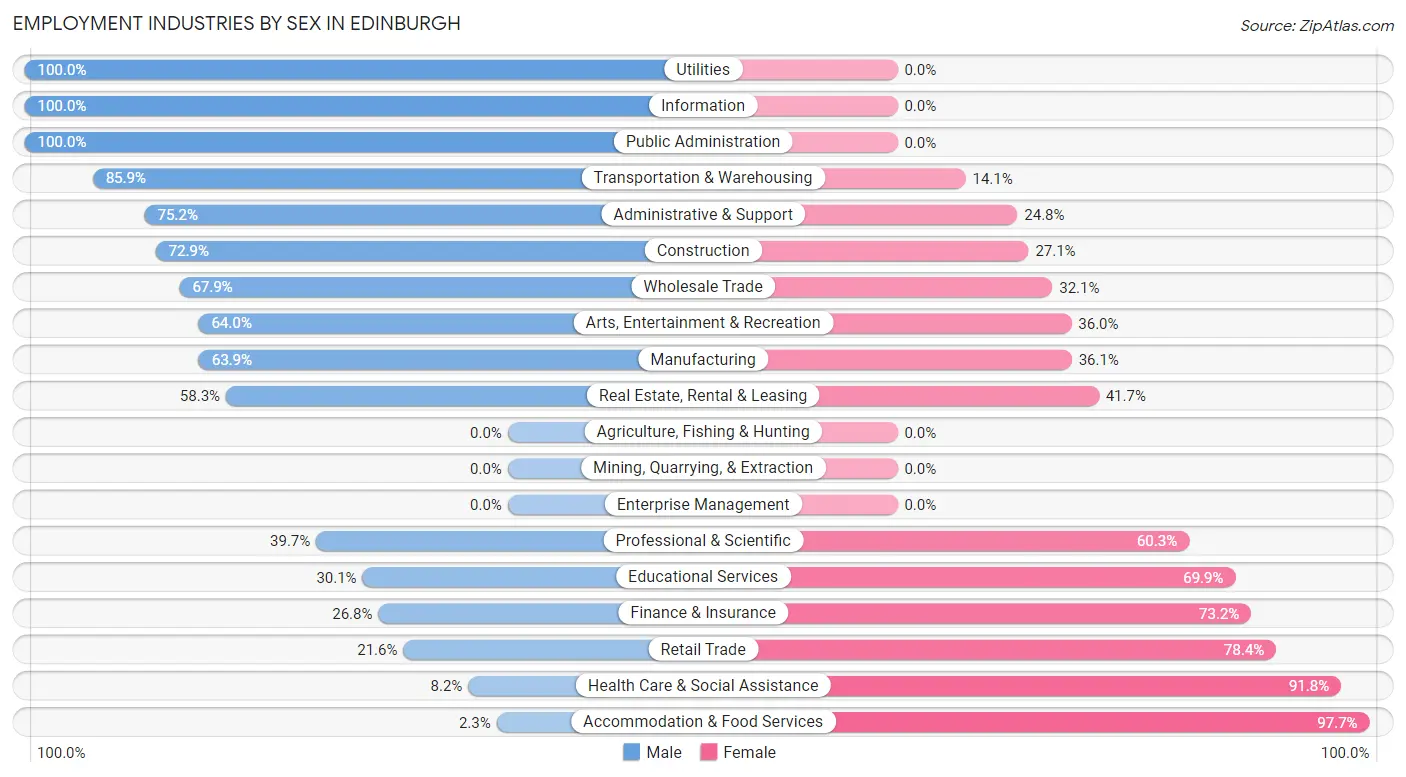
Employment Industries by Sex in Edinburgh
The Edinburgh industries that see more men than women are Utilities (100.0%), Information (100.0%), and Public Administration (100.0%), whereas the industries that tend to have a higher number of women are Accommodation & Food Services (97.7%), Health Care & Social Assistance (91.8%), and Retail Trade (78.4%).
| Industry | Male | Female |
| Agriculture, Fishing & Hunting | 0 (0.0%) | 0 (0.0%) |
| Mining, Quarrying, & Extraction | 0 (0.0%) | 0 (0.0%) |
| Construction | 86 (72.9%) | 32 (27.1%) |
| Manufacturing | 319 (63.9%) | 180 (36.1%) |
| Wholesale Trade | 89 (67.9%) | 42 (32.1%) |
| Retail Trade | 48 (21.6%) | 174 (78.4%) |
| Transportation & Warehousing | 134 (85.9%) | 22 (14.1%) |
| Utilities | 15 (100.0%) | 0 (0.0%) |
| Information | 12 (100.0%) | 0 (0.0%) |
| Finance & Insurance | 15 (26.8%) | 41 (73.2%) |
| Real Estate, Rental & Leasing | 14 (58.3%) | 10 (41.7%) |
| Professional & Scientific | 23 (39.7%) | 35 (60.3%) |
| Enterprise Management | 0 (0.0%) | 0 (0.0%) |
| Administrative & Support | 109 (75.2%) | 36 (24.8%) |
| Educational Services | 46 (30.1%) | 107 (69.9%) |
| Health Care & Social Assistance | 14 (8.2%) | 157 (91.8%) |
| Arts, Entertainment & Recreation | 16 (64.0%) | 9 (36.0%) |
| Accommodation & Food Services | 6 (2.3%) | 254 (97.7%) |
| Public Administration | 125 (100.0%) | 0 (0.0%) |
| Total | 1,125 (50.3%) | 1,113 (49.7%) |
Education in Edinburgh
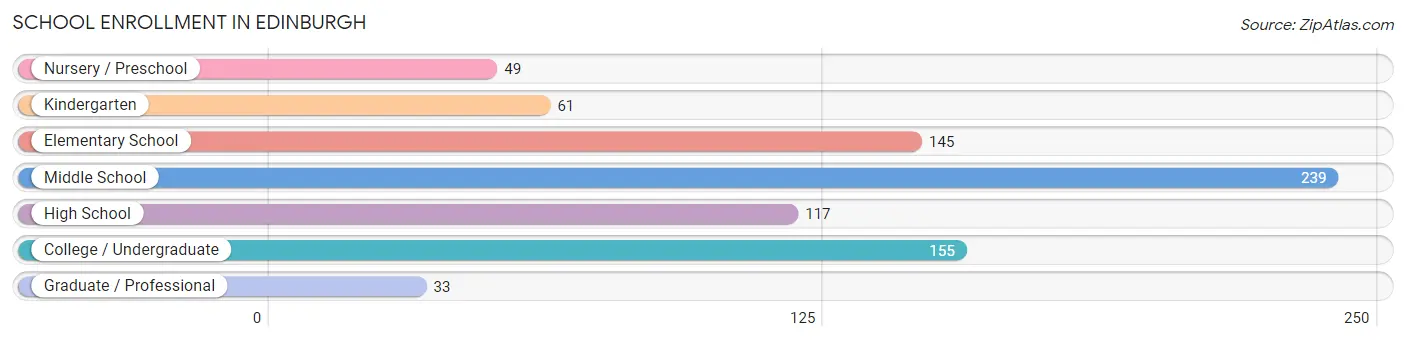
School Enrollment in Edinburgh
The most common levels of schooling among the 799 students in Edinburgh are middle school (239 | 29.9%), college / undergraduate (155 | 19.4%), and elementary school (145 | 18.1%).
| School Level | # Students | % Students |
| Nursery / Preschool | 49 | 6.1% |
| Kindergarten | 61 | 7.6% |
| Elementary School | 145 | 18.1% |
| Middle School | 239 | 29.9% |
| High School | 117 | 14.6% |
| College / Undergraduate | 155 | 19.4% |
| Graduate / Professional | 33 | 4.1% |
| Total | 799 | 100.0% |
School Enrollment by Age by Funding Source in Edinburgh
Out of a total of 799 students who are enrolled in schools in Edinburgh, 138 (17.3%) attend a private institution, while the remaining 661 (82.7%) are enrolled in public schools. The age group of 3 to 4 year olds has the highest likelihood of being enrolled in private schools, with 40 (81.6% in the age bracket) enrolled. Conversely, the age group of 5 to 9 year old has the lowest likelihood of being enrolled in a private school, with 187 (100.0% in the age bracket) attending a public institution.
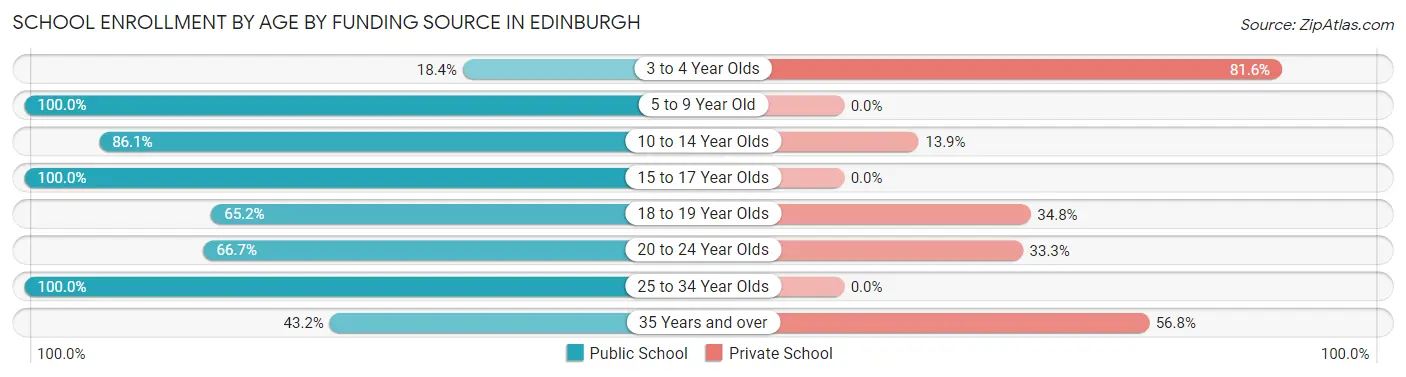
| Age Bracket | Public School | Private School |
| 3 to 4 Year Olds | 9 (18.4%) | 40 (81.6%) |
| 5 to 9 Year Old | 187 (100.0%) | 0 (0.0%) |
| 10 to 14 Year Olds | 260 (86.1%) | 42 (13.9%) |
| 15 to 17 Year Olds | 73 (100.0%) | 0 (0.0%) |
| 18 to 19 Year Olds | 30 (65.2%) | 16 (34.8%) |
| 20 to 24 Year Olds | 30 (66.7%) | 15 (33.3%) |
| 25 to 34 Year Olds | 53 (100.0%) | 0 (0.0%) |
| 35 Years and over | 19 (43.2%) | 25 (56.8%) |
| Total | 661 (82.7%) | 138 (17.3%) |
Educational Attainment by Field of Study in Edinburgh
Liberal arts & history (89 | 29.0%), business (76 | 24.8%), science & technology (57 | 18.6%), psychology (21 | 6.8%), and education (20 | 6.5%) are the most common fields of study among 307 individuals in Edinburgh who have obtained a bachelor's degree or higher.
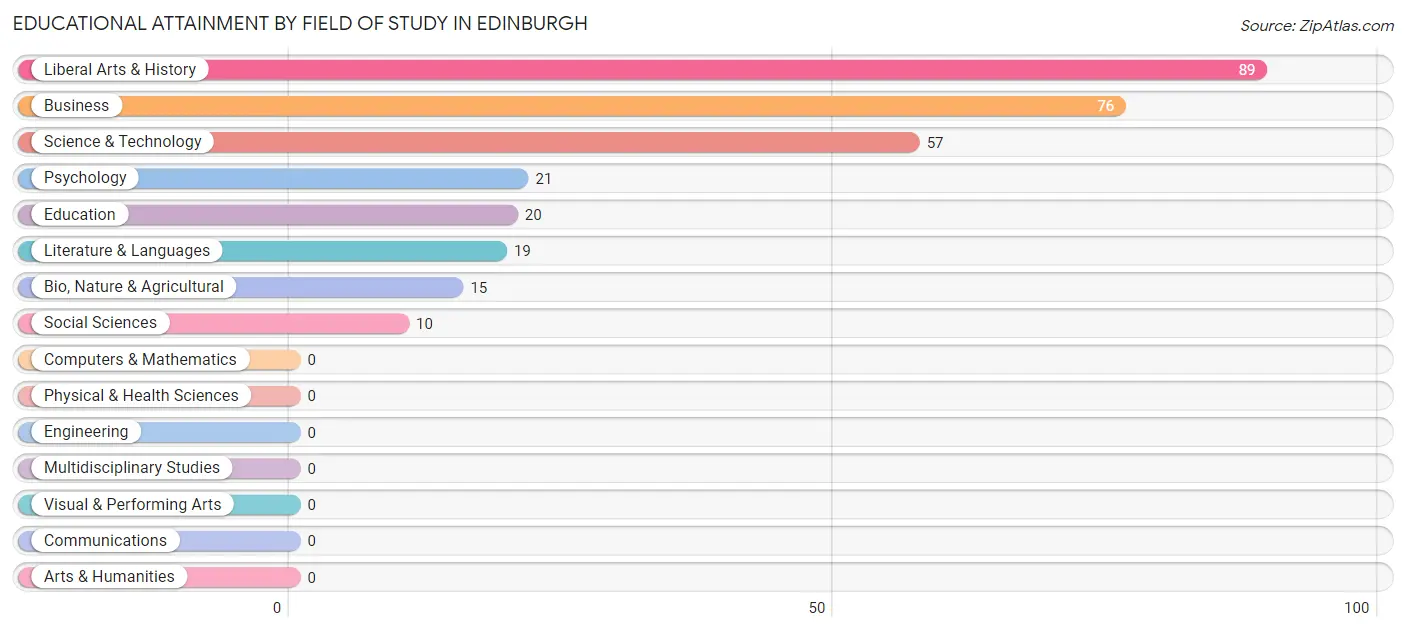
| Field of Study | # Graduates | % Graduates |
| Computers & Mathematics | 0 | 0.0% |
| Bio, Nature & Agricultural | 15 | 4.9% |
| Physical & Health Sciences | 0 | 0.0% |
| Psychology | 21 | 6.8% |
| Social Sciences | 10 | 3.3% |
| Engineering | 0 | 0.0% |
| Multidisciplinary Studies | 0 | 0.0% |
| Science & Technology | 57 | 18.6% |
| Business | 76 | 24.8% |
| Education | 20 | 6.5% |
| Literature & Languages | 19 | 6.2% |
| Liberal Arts & History | 89 | 29.0% |
| Visual & Performing Arts | 0 | 0.0% |
| Communications | 0 | 0.0% |
| Arts & Humanities | 0 | 0.0% |
| Total | 307 | 100.0% |
Transportation & Commute in Edinburgh
Vehicle Availability by Sex in Edinburgh
The most prevalent vehicle ownership categories in Edinburgh are males with 2 vehicles (447, accounting for 42.1%) and females with 2 vehicles (360, making up 40.5%).
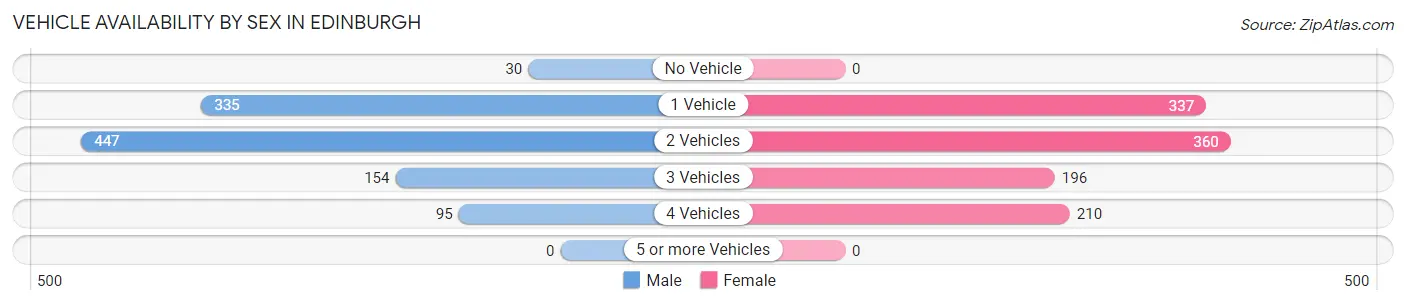
| Vehicles Available | Male | Female |
| No Vehicle | 30 (2.8%) | 0 (0.0%) |
| 1 Vehicle | 335 (31.6%) | 337 (30.5%) |
| 2 Vehicles | 447 (42.1%) | 360 (32.6%) |
| 3 Vehicles | 154 (14.5%) | 196 (17.8%) |
| 4 Vehicles | 95 (8.9%) | 210 (19.0%) |
| 5 or more Vehicles | 0 (0.0%) | 0 (0.0%) |
| Total | 1,061 (100.0%) | 1,103 (100.0%) |
Commute Time in Edinburgh
The most frequently occuring commute durations in Edinburgh are 5 to 9 minutes (442 commuters, 22.4%), 15 to 19 minutes (284 commuters, 14.4%), and 10 to 14 minutes (276 commuters, 14.0%).
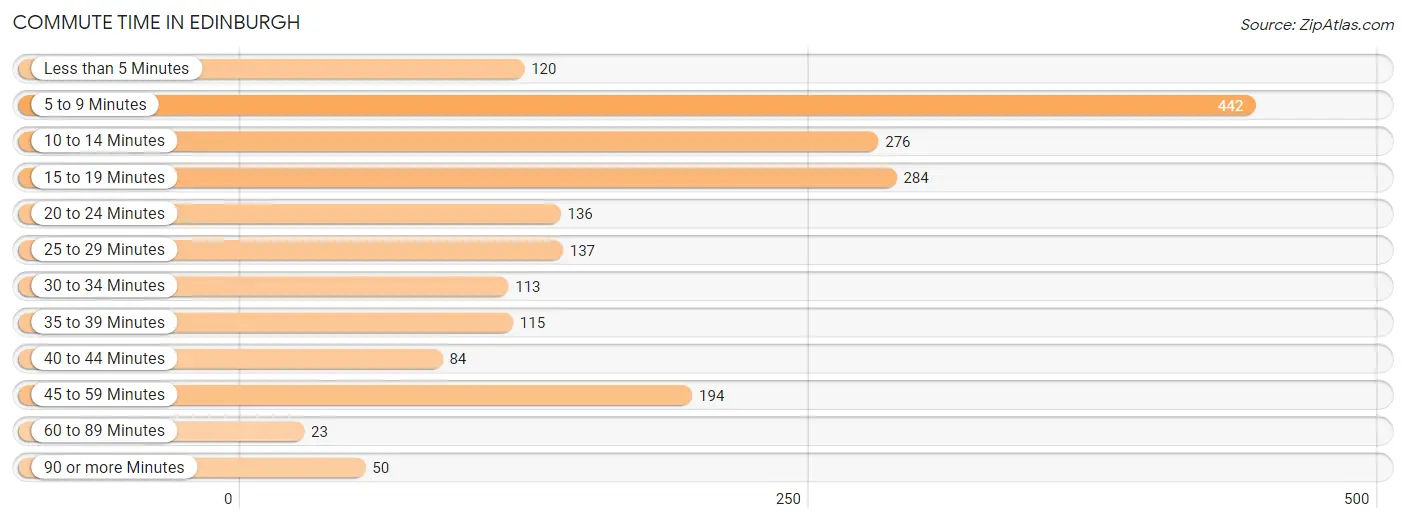
| Commute Time | # Commuters | % Commuters |
| Less than 5 Minutes | 120 | 6.1% |
| 5 to 9 Minutes | 442 | 22.4% |
| 10 to 14 Minutes | 276 | 14.0% |
| 15 to 19 Minutes | 284 | 14.4% |
| 20 to 24 Minutes | 136 | 6.9% |
| 25 to 29 Minutes | 137 | 6.9% |
| 30 to 34 Minutes | 113 | 5.7% |
| 35 to 39 Minutes | 115 | 5.8% |
| 40 to 44 Minutes | 84 | 4.3% |
| 45 to 59 Minutes | 194 | 9.8% |
| 60 to 89 Minutes | 23 | 1.2% |
| 90 or more Minutes | 50 | 2.5% |
Commute Time by Sex in Edinburgh
The most common commute times in Edinburgh are 5 to 9 minutes (256 commuters, 27.6%) for males and 15 to 19 minutes (205 commuters, 19.6%) for females.
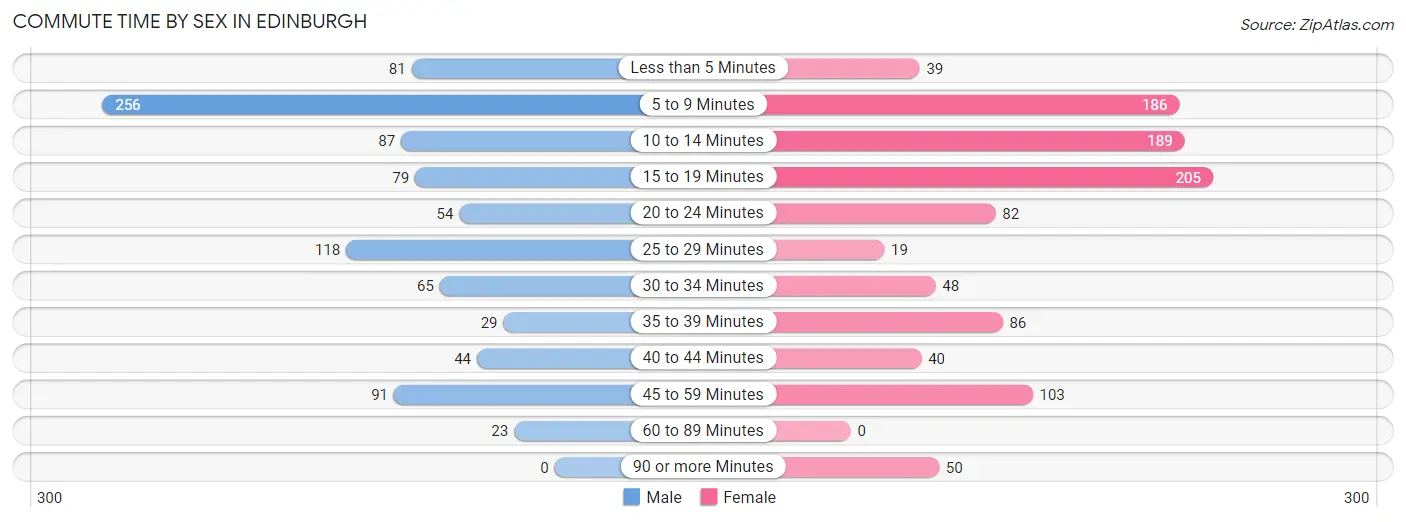
| Commute Time | Male | Female |
| Less than 5 Minutes | 81 (8.7%) | 39 (3.7%) |
| 5 to 9 Minutes | 256 (27.6%) | 186 (17.8%) |
| 10 to 14 Minutes | 87 (9.4%) | 189 (18.0%) |
| 15 to 19 Minutes | 79 (8.5%) | 205 (19.6%) |
| 20 to 24 Minutes | 54 (5.8%) | 82 (7.8%) |
| 25 to 29 Minutes | 118 (12.7%) | 19 (1.8%) |
| 30 to 34 Minutes | 65 (7.0%) | 48 (4.6%) |
| 35 to 39 Minutes | 29 (3.1%) | 86 (8.2%) |
| 40 to 44 Minutes | 44 (4.8%) | 40 (3.8%) |
| 45 to 59 Minutes | 91 (9.8%) | 103 (9.8%) |
| 60 to 89 Minutes | 23 (2.5%) | 0 (0.0%) |
| 90 or more Minutes | 0 (0.0%) | 50 (4.8%) |
Time of Departure to Work by Sex in Edinburgh
The most frequent times of departure to work in Edinburgh are 7:00 AM to 7:29 AM (198, 21.4%) for males and 6:30 AM to 6:59 AM (165, 15.8%) for females.
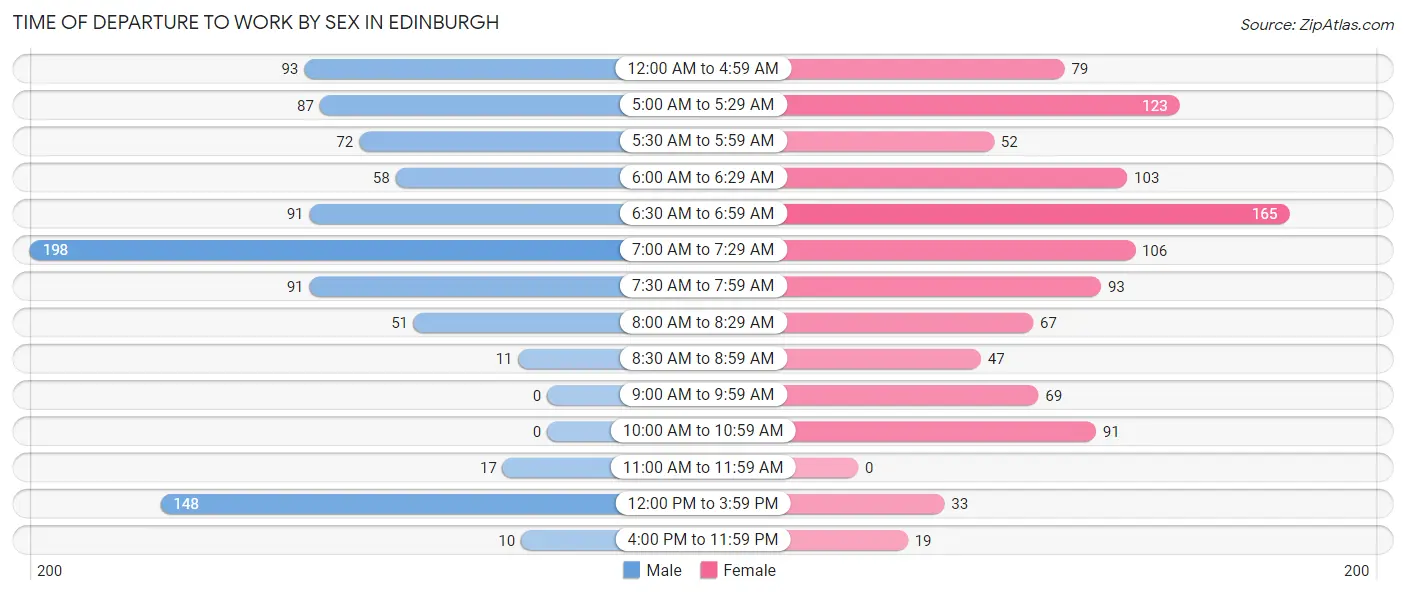
| Time of Departure | Male | Female |
| 12:00 AM to 4:59 AM | 93 (10.0%) | 79 (7.5%) |
| 5:00 AM to 5:29 AM | 87 (9.4%) | 123 (11.7%) |
| 5:30 AM to 5:59 AM | 72 (7.8%) | 52 (5.0%) |
| 6:00 AM to 6:29 AM | 58 (6.3%) | 103 (9.8%) |
| 6:30 AM to 6:59 AM | 91 (9.8%) | 165 (15.8%) |
| 7:00 AM to 7:29 AM | 198 (21.4%) | 106 (10.1%) |
| 7:30 AM to 7:59 AM | 91 (9.8%) | 93 (8.9%) |
| 8:00 AM to 8:29 AM | 51 (5.5%) | 67 (6.4%) |
| 8:30 AM to 8:59 AM | 11 (1.2%) | 47 (4.5%) |
| 9:00 AM to 9:59 AM | 0 (0.0%) | 69 (6.6%) |
| 10:00 AM to 10:59 AM | 0 (0.0%) | 91 (8.7%) |
| 11:00 AM to 11:59 AM | 17 (1.8%) | 0 (0.0%) |
| 12:00 PM to 3:59 PM | 148 (16.0%) | 33 (3.2%) |
| 4:00 PM to 11:59 PM | 10 (1.1%) | 19 (1.8%) |
| Total | 927 (100.0%) | 1,047 (100.0%) |
Housing Occupancy in Edinburgh
Occupancy by Ownership in Edinburgh
Of the total 1,749 dwellings in Edinburgh, owner-occupied units account for 956 (54.7%), while renter-occupied units make up 793 (45.3%).
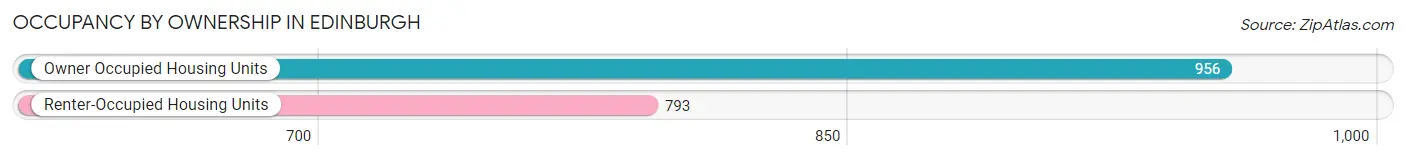
| Occupancy | # Housing Units | % Housing Units |
| Owner Occupied Housing Units | 956 | 54.7% |
| Renter-Occupied Housing Units | 793 | 45.3% |
| Total Occupied Housing Units | 1,749 | 100.0% |
Occupancy by Household Size in Edinburgh
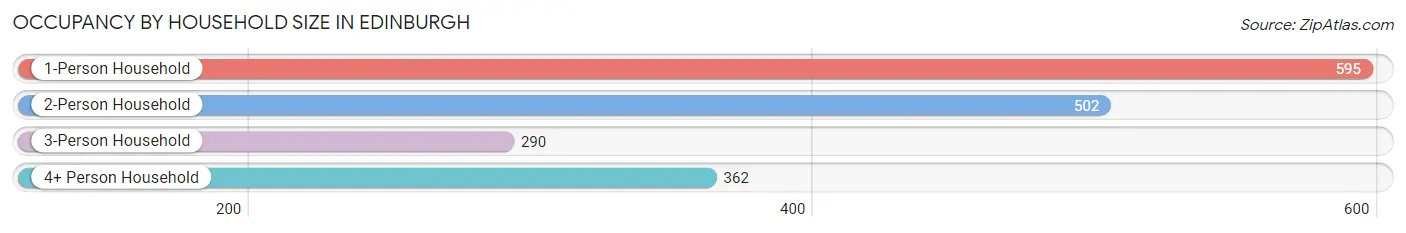
| Household Size | # Housing Units | % Housing Units |
| 1-Person Household | 595 | 34.0% |
| 2-Person Household | 502 | 28.7% |
| 3-Person Household | 290 | 16.6% |
| 4+ Person Household | 362 | 20.7% |
| Total Housing Units | 1,749 | 100.0% |
Occupancy by Ownership by Household Size in Edinburgh
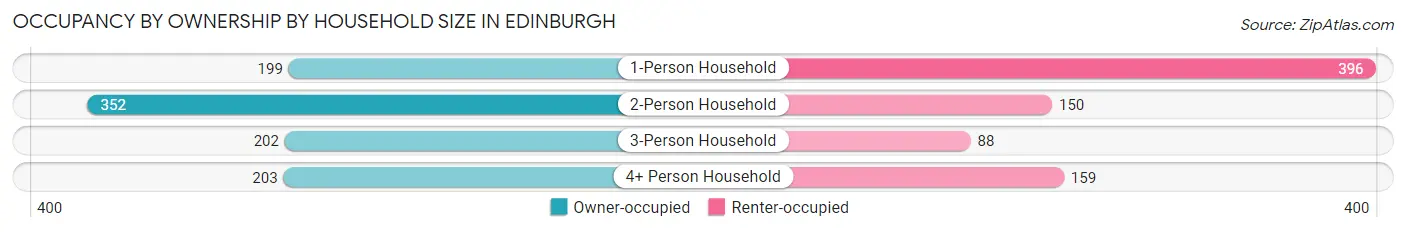
| Household Size | Owner-occupied | Renter-occupied |
| 1-Person Household | 199 (33.5%) | 396 (66.5%) |
| 2-Person Household | 352 (70.1%) | 150 (29.9%) |
| 3-Person Household | 202 (69.7%) | 88 (30.3%) |
| 4+ Person Household | 203 (56.1%) | 159 (43.9%) |
| Total Housing Units | 956 (54.7%) | 793 (45.3%) |
Occupancy by Educational Attainment in Edinburgh
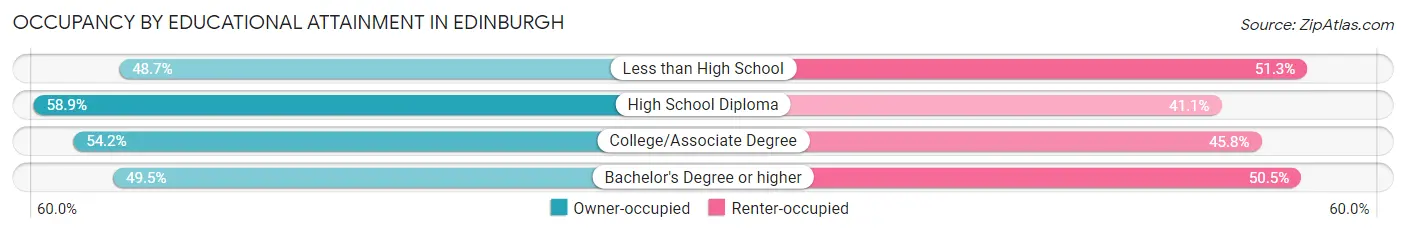
| Household Size | Owner-occupied | Renter-occupied |
| Less than High School | 135 (48.7%) | 142 (51.3%) |
| High School Diploma | 399 (58.9%) | 278 (41.1%) |
| College/Associate Degree | 329 (54.2%) | 278 (45.8%) |
| Bachelor's Degree or higher | 93 (49.5%) | 95 (50.5%) |
Occupancy by Age of Householder in Edinburgh
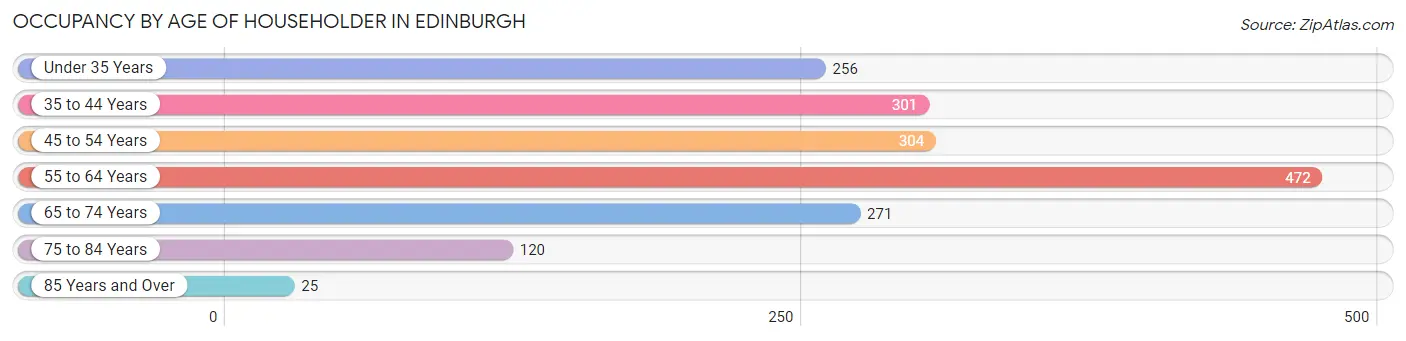
| Age Bracket | # Households | % Households |
| Under 35 Years | 256 | 14.6% |
| 35 to 44 Years | 301 | 17.2% |
| 45 to 54 Years | 304 | 17.4% |
| 55 to 64 Years | 472 | 27.0% |
| 65 to 74 Years | 271 | 15.5% |
| 75 to 84 Years | 120 | 6.9% |
| 85 Years and Over | 25 | 1.4% |
| Total | 1,749 | 100.0% |
Housing Finances in Edinburgh
Median Income by Occupancy in Edinburgh
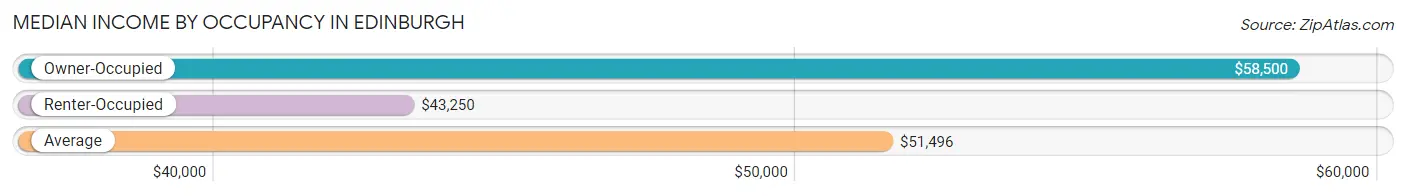
| Occupancy Type | # Households | Median Income |
| Owner-Occupied | 956 (54.7%) | $58,500 |
| Renter-Occupied | 793 (45.3%) | $43,250 |
| Average | 1,749 (100.0%) | $51,496 |
Occupancy by Householder Income Bracket in Edinburgh
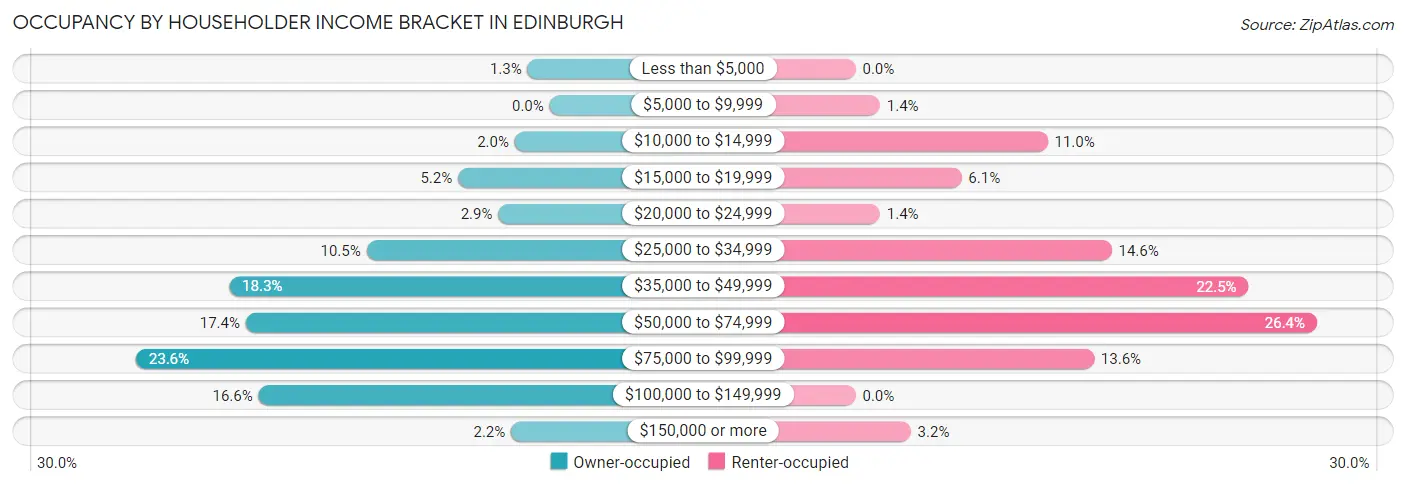
| Income Bracket | Owner-occupied | Renter-occupied |
| Less than $5,000 | 12 (1.3%) | 0 (0.0%) |
| $5,000 to $9,999 | 0 (0.0%) | 11 (1.4%) |
| $10,000 to $14,999 | 19 (2.0%) | 87 (11.0%) |
| $15,000 to $19,999 | 50 (5.2%) | 48 (6.0%) |
| $20,000 to $24,999 | 28 (2.9%) | 11 (1.4%) |
| $25,000 to $34,999 | 100 (10.5%) | 116 (14.6%) |
| $35,000 to $49,999 | 175 (18.3%) | 178 (22.5%) |
| $50,000 to $74,999 | 166 (17.4%) | 209 (26.4%) |
| $75,000 to $99,999 | 226 (23.6%) | 108 (13.6%) |
| $100,000 to $149,999 | 159 (16.6%) | 0 (0.0%) |
| $150,000 or more | 21 (2.2%) | 25 (3.2%) |
| Total | 956 (100.0%) | 793 (100.0%) |
Monthly Housing Cost Tiers in Edinburgh
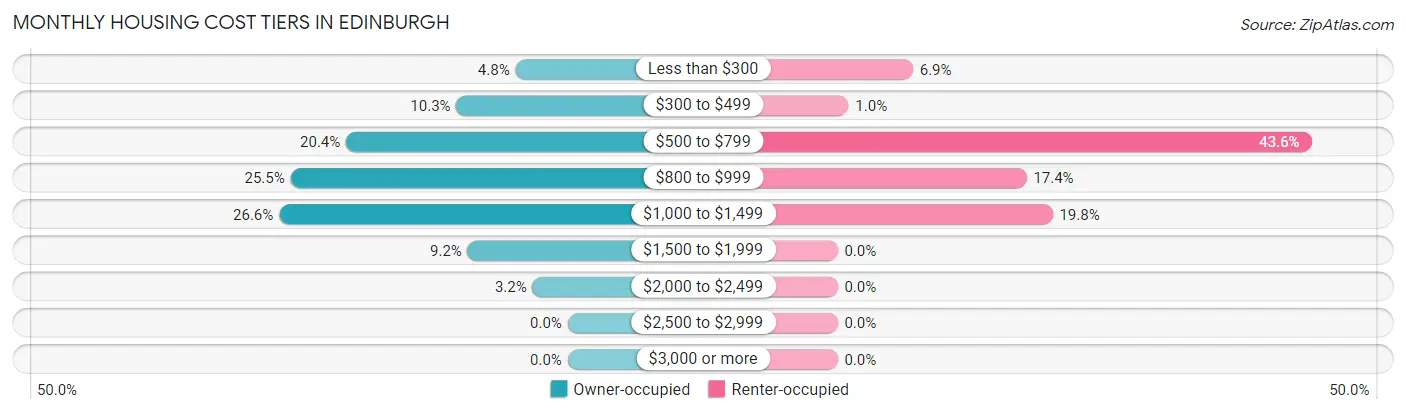
| Monthly Cost | Owner-occupied | Renter-occupied |
| Less than $300 | 46 (4.8%) | 55 (6.9%) |
| $300 to $499 | 98 (10.2%) | 8 (1.0%) |
| $500 to $799 | 195 (20.4%) | 346 (43.6%) |
| $800 to $999 | 244 (25.5%) | 138 (17.4%) |
| $1,000 to $1,499 | 254 (26.6%) | 157 (19.8%) |
| $1,500 to $1,999 | 88 (9.2%) | 0 (0.0%) |
| $2,000 to $2,499 | 31 (3.2%) | 0 (0.0%) |
| $2,500 to $2,999 | 0 (0.0%) | 0 (0.0%) |
| $3,000 or more | 0 (0.0%) | 0 (0.0%) |
| Total | 956 (100.0%) | 793 (100.0%) |
Physical Housing Characteristics in Edinburgh
Housing Structures in Edinburgh
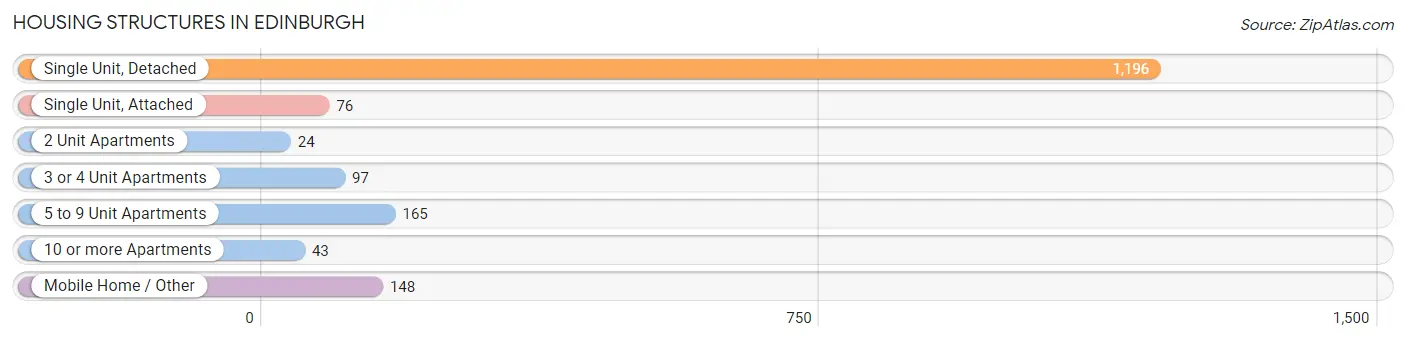
| Structure Type | # Housing Units | % Housing Units |
| Single Unit, Detached | 1,196 | 68.4% |
| Single Unit, Attached | 76 | 4.3% |
| 2 Unit Apartments | 24 | 1.4% |
| 3 or 4 Unit Apartments | 97 | 5.6% |
| 5 to 9 Unit Apartments | 165 | 9.4% |
| 10 or more Apartments | 43 | 2.5% |
| Mobile Home / Other | 148 | 8.5% |
| Total | 1,749 | 100.0% |
Housing Structures by Occupancy in Edinburgh
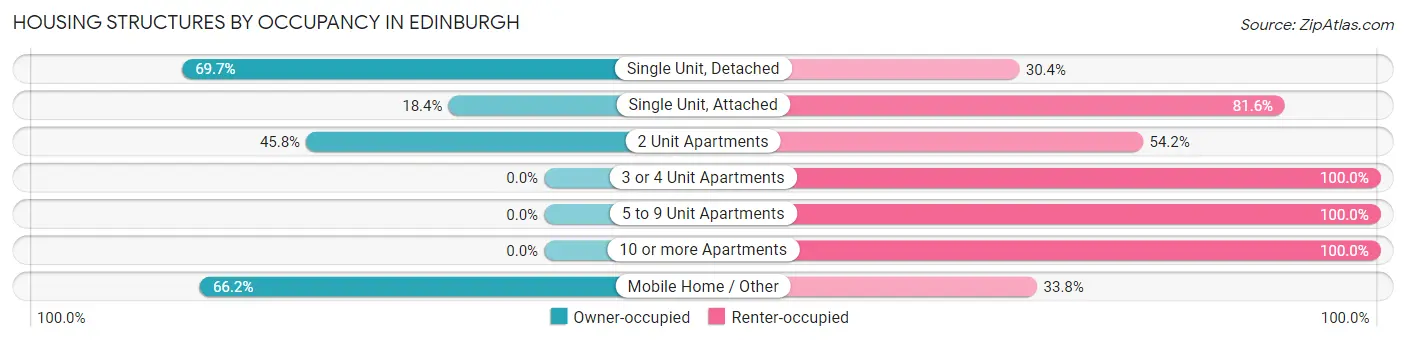
| Structure Type | Owner-occupied | Renter-occupied |
| Single Unit, Detached | 833 (69.7%) | 363 (30.3%) |
| Single Unit, Attached | 14 (18.4%) | 62 (81.6%) |
| 2 Unit Apartments | 11 (45.8%) | 13 (54.2%) |
| 3 or 4 Unit Apartments | 0 (0.0%) | 97 (100.0%) |
| 5 to 9 Unit Apartments | 0 (0.0%) | 165 (100.0%) |
| 10 or more Apartments | 0 (0.0%) | 43 (100.0%) |
| Mobile Home / Other | 98 (66.2%) | 50 (33.8%) |
| Total | 956 (54.7%) | 793 (45.3%) |
Housing Structures by Number of Rooms in Edinburgh
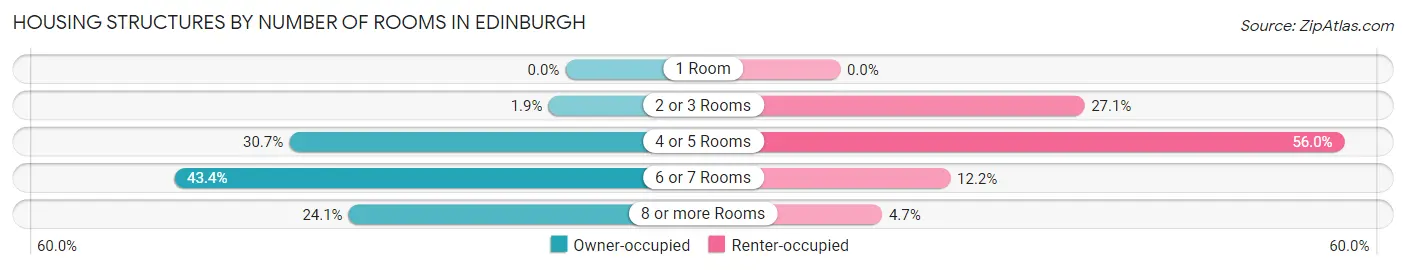
| Number of Rooms | Owner-occupied | Renter-occupied |
| 1 Room | 0 (0.0%) | 0 (0.0%) |
| 2 or 3 Rooms | 18 (1.9%) | 215 (27.1%) |
| 4 or 5 Rooms | 293 (30.6%) | 444 (56.0%) |
| 6 or 7 Rooms | 415 (43.4%) | 97 (12.2%) |
| 8 or more Rooms | 230 (24.1%) | 37 (4.7%) |
| Total | 956 (100.0%) | 793 (100.0%) |
Housing Structure by Heating Type in Edinburgh
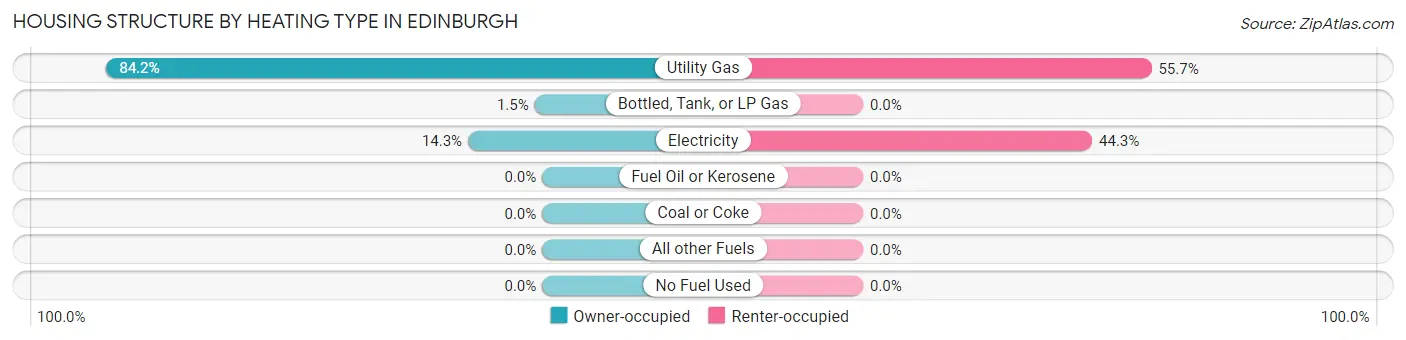
| Heating Type | Owner-occupied | Renter-occupied |
| Utility Gas | 805 (84.2%) | 442 (55.7%) |
| Bottled, Tank, or LP Gas | 14 (1.5%) | 0 (0.0%) |
| Electricity | 137 (14.3%) | 351 (44.3%) |
| Fuel Oil or Kerosene | 0 (0.0%) | 0 (0.0%) |
| Coal or Coke | 0 (0.0%) | 0 (0.0%) |
| All other Fuels | 0 (0.0%) | 0 (0.0%) |
| No Fuel Used | 0 (0.0%) | 0 (0.0%) |
| Total | 956 (100.0%) | 793 (100.0%) |
Household Vehicle Usage in Edinburgh
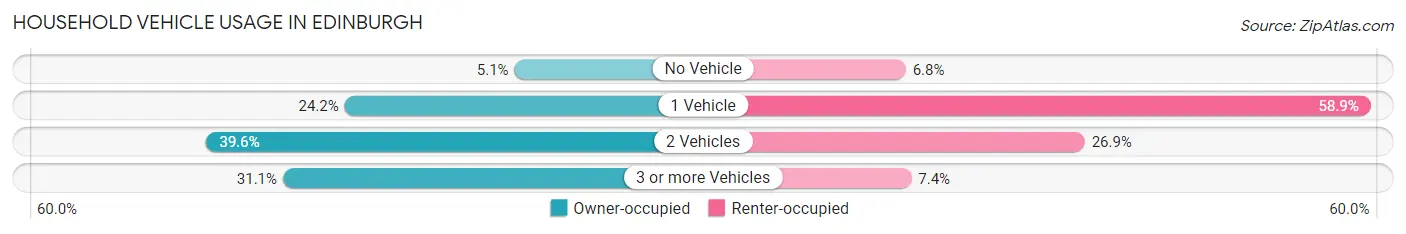
| Vehicles per Household | Owner-occupied | Renter-occupied |
| No Vehicle | 49 (5.1%) | 54 (6.8%) |
| 1 Vehicle | 231 (24.2%) | 467 (58.9%) |
| 2 Vehicles | 379 (39.6%) | 213 (26.9%) |
| 3 or more Vehicles | 297 (31.1%) | 59 (7.4%) |
| Total | 956 (100.0%) | 793 (100.0%) |
Real Estate & Mortgages in Edinburgh
Real Estate and Mortgage Overview in Edinburgh
| Characteristic | Without Mortgage | With Mortgage |
| Housing Units | 287 | 669 |
| Median Property Value | $128,400 | $131,800 |
| Median Household Income | $37,311 | $21 |
| Monthly Housing Costs | $516 | $0 |
| Real Estate Taxes | $1,230 | $36 |
Property Value by Mortgage Status in Edinburgh
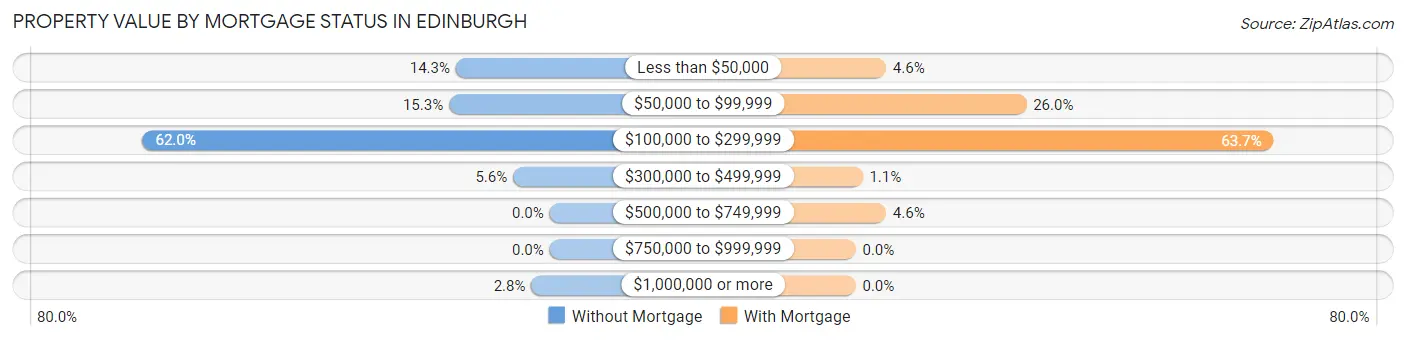
| Property Value | Without Mortgage | With Mortgage |
| Less than $50,000 | 41 (14.3%) | 31 (4.6%) |
| $50,000 to $99,999 | 44 (15.3%) | 174 (26.0%) |
| $100,000 to $299,999 | 178 (62.0%) | 426 (63.7%) |
| $300,000 to $499,999 | 16 (5.6%) | 7 (1.1%) |
| $500,000 to $749,999 | 0 (0.0%) | 31 (4.6%) |
| $750,000 to $999,999 | 0 (0.0%) | 0 (0.0%) |
| $1,000,000 or more | 8 (2.8%) | 0 (0.0%) |
| Total | 287 (100.0%) | 669 (100.0%) |
Household Income by Mortgage Status in Edinburgh
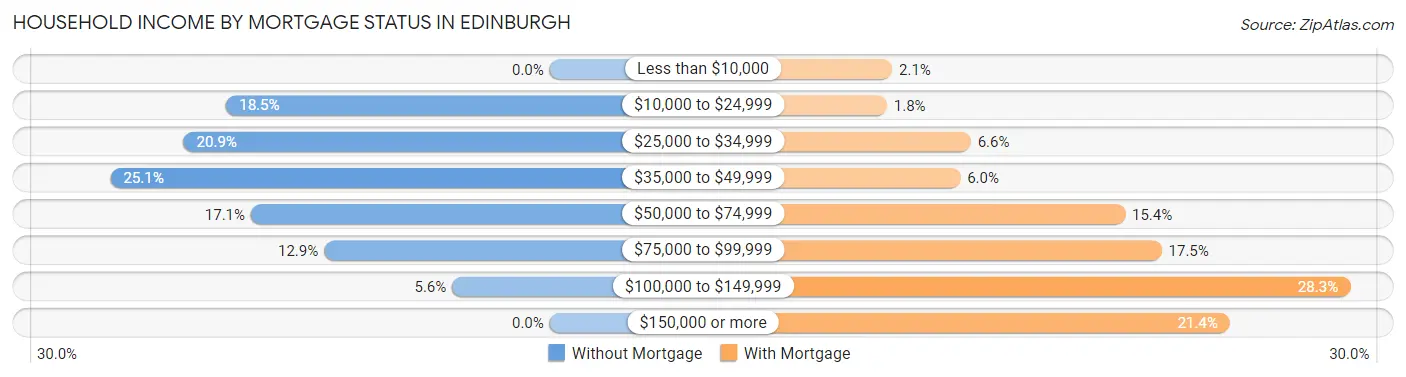
| Household Income | Without Mortgage | With Mortgage |
| Less than $10,000 | 0 (0.0%) | 14 (2.1%) |
| $10,000 to $24,999 | 53 (18.5%) | 12 (1.8%) |
| $25,000 to $34,999 | 60 (20.9%) | 44 (6.6%) |
| $35,000 to $49,999 | 72 (25.1%) | 40 (6.0%) |
| $50,000 to $74,999 | 49 (17.1%) | 103 (15.4%) |
| $75,000 to $99,999 | 37 (12.9%) | 117 (17.5%) |
| $100,000 to $149,999 | 16 (5.6%) | 189 (28.2%) |
| $150,000 or more | 0 (0.0%) | 143 (21.4%) |
| Total | 287 (100.0%) | 669 (100.0%) |
Property Value to Household Income Ratio in Edinburgh
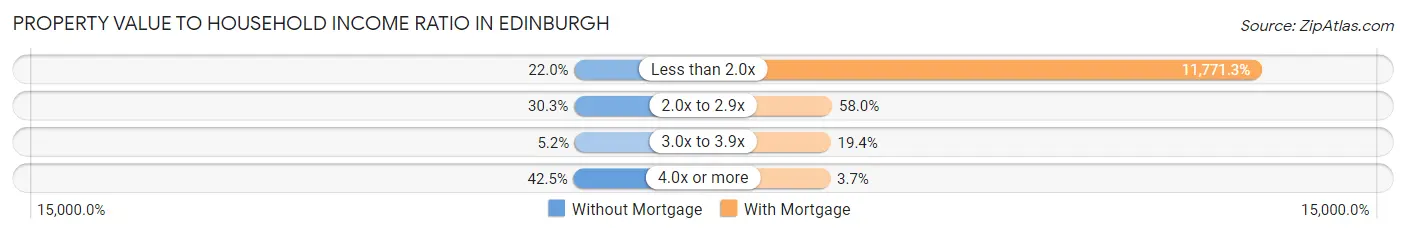
| Value-to-Income Ratio | Without Mortgage | With Mortgage |
| Less than 2.0x | 63 (22.0%) | 78,750 (11,771.3%) |
| 2.0x to 2.9x | 87 (30.3%) | 388 (58.0%) |
| 3.0x to 3.9x | 15 (5.2%) | 130 (19.4%) |
| 4.0x or more | 122 (42.5%) | 25 (3.7%) |
| Total | 287 (100.0%) | 669 (100.0%) |
Real Estate Taxes by Mortgage Status in Edinburgh
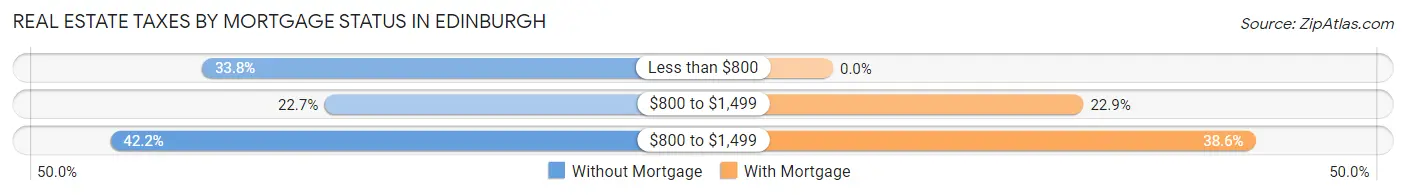
| Property Taxes | Without Mortgage | With Mortgage |
| Less than $800 | 97 (33.8%) | 0 (0.0%) |
| $800 to $1,499 | 65 (22.7%) | 153 (22.9%) |
| $800 to $1,499 | 121 (42.2%) | 258 (38.6%) |
| Total | 287 (100.0%) | 669 (100.0%) |
Health & Disability in Edinburgh
Health Insurance Coverage by Age in Edinburgh
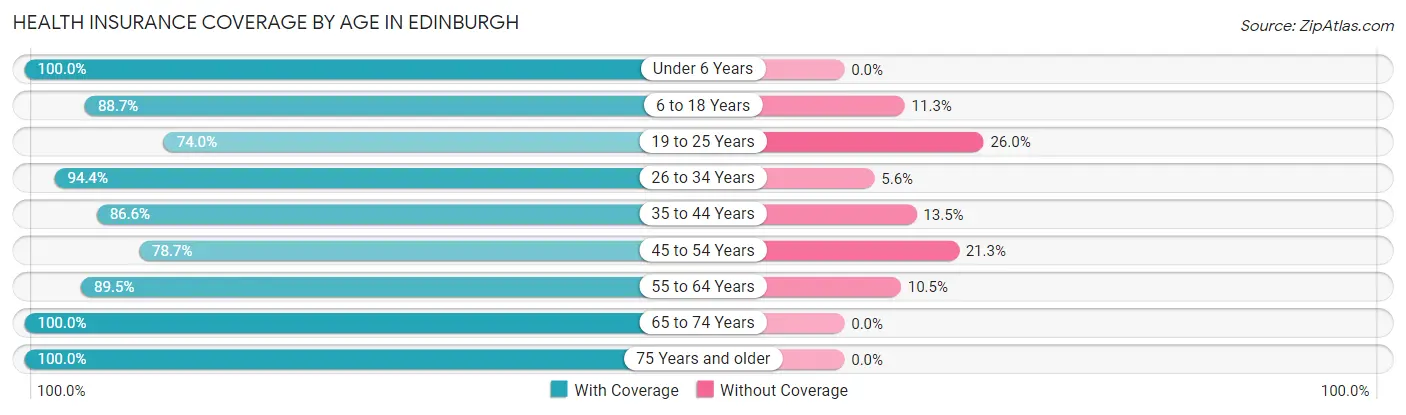
| Age Bracket | With Coverage | Without Coverage |
| Under 6 Years | 247 (100.0%) | 0 (0.0%) |
| 6 to 18 Years | 520 (88.7%) | 66 (11.3%) |
| 19 to 25 Years | 174 (74.0%) | 61 (26.0%) |
| 26 to 34 Years | 658 (94.4%) | 39 (5.6%) |
| 35 to 44 Years | 476 (86.6%) | 74 (13.5%) |
| 45 to 54 Years | 424 (78.7%) | 115 (21.3%) |
| 55 to 64 Years | 620 (89.5%) | 73 (10.5%) |
| 65 to 74 Years | 330 (100.0%) | 0 (0.0%) |
| 75 Years and older | 267 (100.0%) | 0 (0.0%) |
| Total | 3,716 (89.7%) | 428 (10.3%) |
Health Insurance Coverage by Citizenship Status in Edinburgh
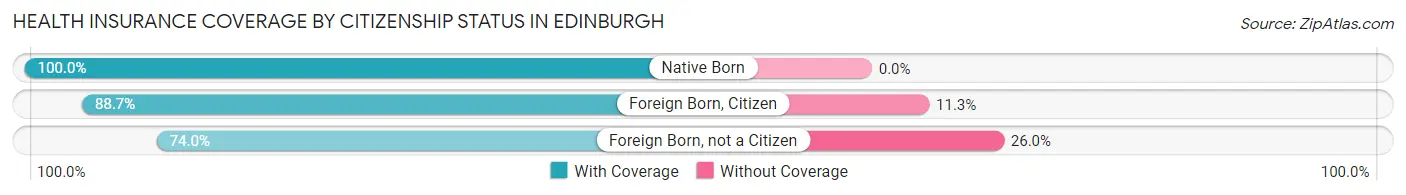
| Citizenship Status | With Coverage | Without Coverage |
| Native Born | 247 (100.0%) | 0 (0.0%) |
| Foreign Born, Citizen | 520 (88.7%) | 66 (11.3%) |
| Foreign Born, not a Citizen | 174 (74.0%) | 61 (26.0%) |
Health Insurance Coverage by Household Income in Edinburgh
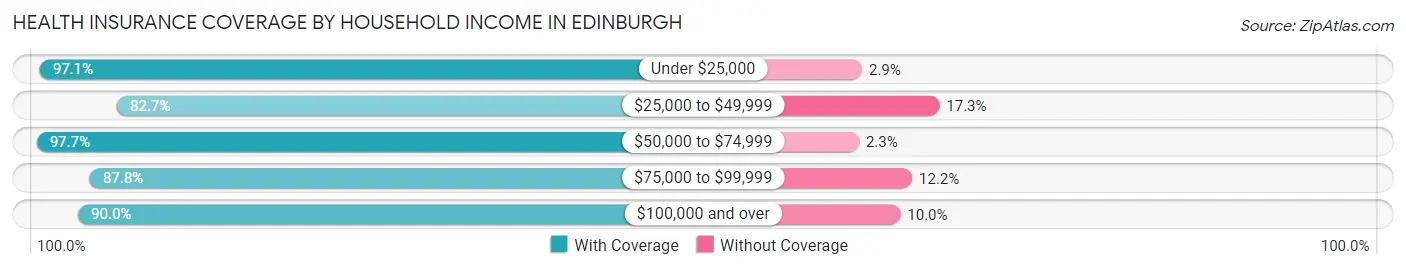
| Household Income | With Coverage | Without Coverage |
| Under $25,000 | 340 (97.1%) | 10 (2.9%) |
| $25,000 to $49,999 | 1,058 (82.7%) | 222 (17.3%) |
| $50,000 to $74,999 | 945 (97.7%) | 22 (2.3%) |
| $75,000 to $99,999 | 746 (87.8%) | 104 (12.2%) |
| $100,000 and over | 627 (90.0%) | 70 (10.0%) |
Public vs Private Health Insurance Coverage by Age in Edinburgh
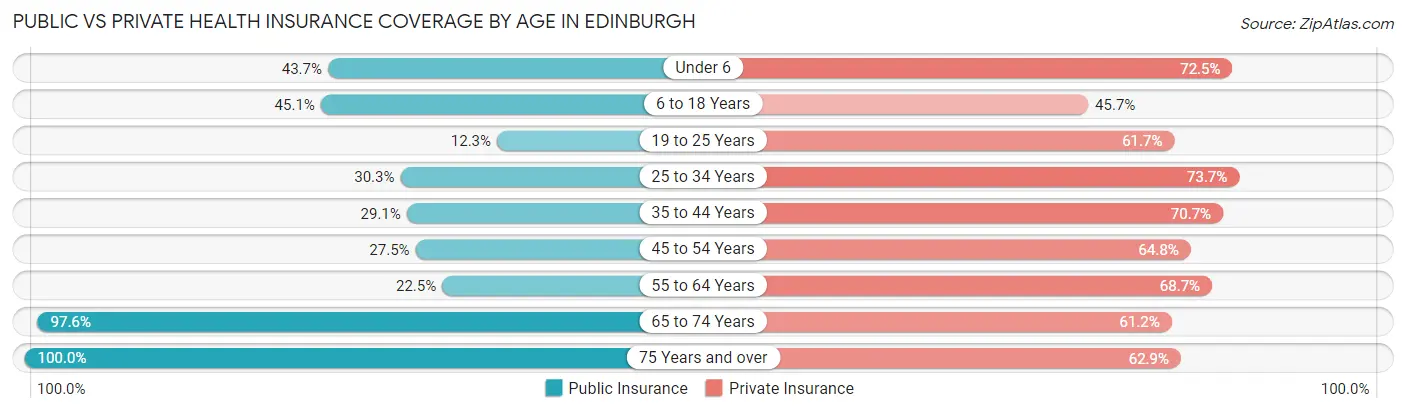
| Age Bracket | Public Insurance | Private Insurance |
| Under 6 | 108 (43.7%) | 179 (72.5%) |
| 6 to 18 Years | 264 (45.1%) | 268 (45.7%) |
| 19 to 25 Years | 29 (12.3%) | 145 (61.7%) |
| 25 to 34 Years | 211 (30.3%) | 514 (73.7%) |
| 35 to 44 Years | 160 (29.1%) | 389 (70.7%) |
| 45 to 54 Years | 148 (27.5%) | 349 (64.7%) |
| 55 to 64 Years | 156 (22.5%) | 476 (68.7%) |
| 65 to 74 Years | 322 (97.6%) | 202 (61.2%) |
| 75 Years and over | 267 (100.0%) | 168 (62.9%) |
| Total | 1,665 (40.2%) | 2,690 (64.9%) |
Disability Status by Sex by Age in Edinburgh
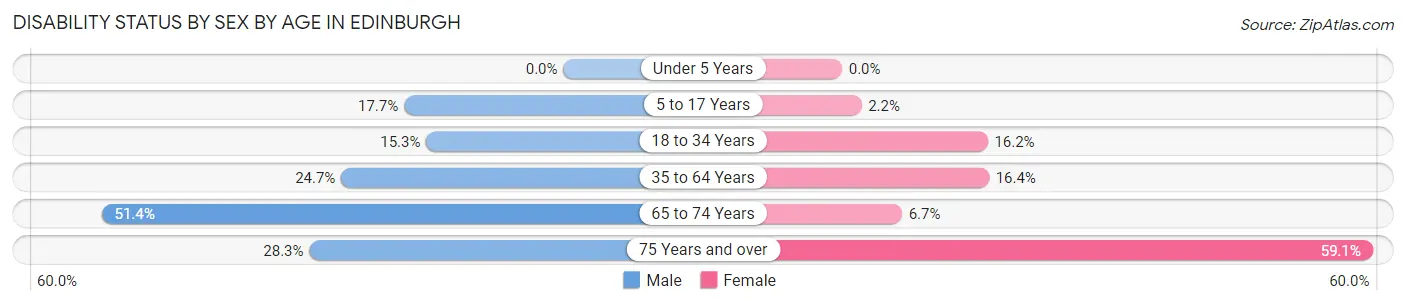
| Age Bracket | Male | Female |
| Under 5 Years | 0 (0.0%) | 0 (0.0%) |
| 5 to 17 Years | 47 (17.7%) | 7 (2.2%) |
| 18 to 34 Years | 78 (15.3%) | 79 (16.2%) |
| 35 to 64 Years | 211 (24.7%) | 152 (16.4%) |
| 65 to 74 Years | 108 (51.4%) | 8 (6.7%) |
| 75 Years and over | 43 (28.3%) | 68 (59.1%) |
Disability Class by Sex by Age in Edinburgh
Disability Class: Hearing Difficulty
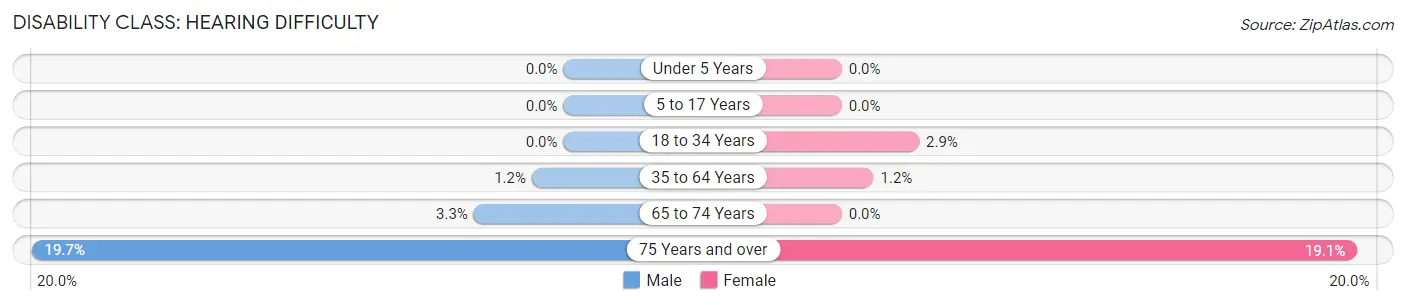
| Age Bracket | Male | Female |
| Under 5 Years | 0 (0.0%) | 0 (0.0%) |
| 5 to 17 Years | 0 (0.0%) | 0 (0.0%) |
| 18 to 34 Years | 0 (0.0%) | 14 (2.9%) |
| 35 to 64 Years | 10 (1.2%) | 11 (1.2%) |
| 65 to 74 Years | 7 (3.3%) | 0 (0.0%) |
| 75 Years and over | 30 (19.7%) | 22 (19.1%) |
Disability Class: Vision Difficulty
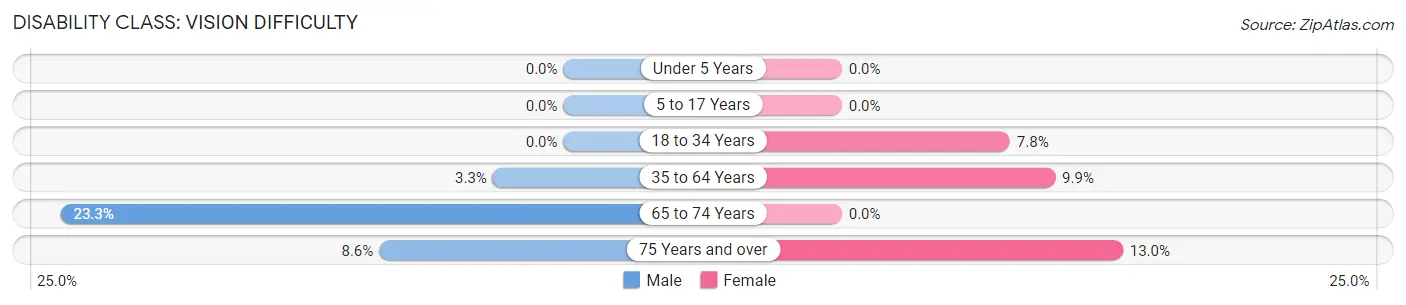
| Age Bracket | Male | Female |
| Under 5 Years | 0 (0.0%) | 0 (0.0%) |
| 5 to 17 Years | 0 (0.0%) | 0 (0.0%) |
| 18 to 34 Years | 0 (0.0%) | 38 (7.8%) |
| 35 to 64 Years | 28 (3.3%) | 92 (9.9%) |
| 65 to 74 Years | 49 (23.3%) | 0 (0.0%) |
| 75 Years and over | 13 (8.6%) | 15 (13.0%) |
Disability Class: Cognitive Difficulty
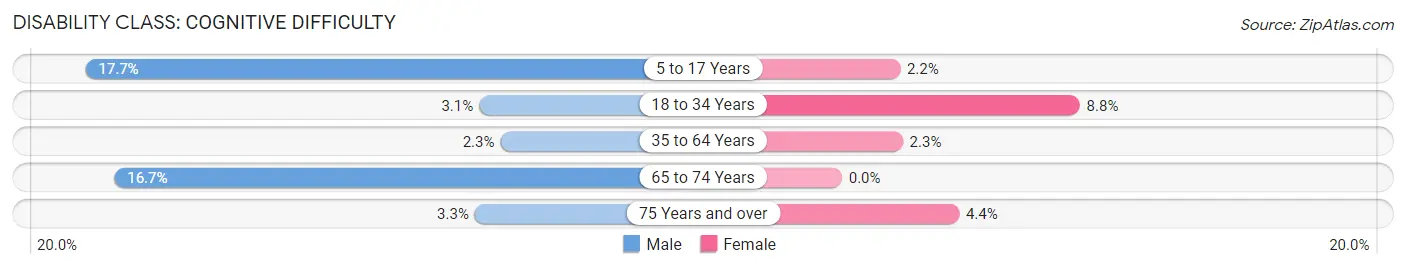
| Age Bracket | Male | Female |
| 5 to 17 Years | 47 (17.7%) | 7 (2.2%) |
| 18 to 34 Years | 16 (3.1%) | 43 (8.8%) |
| 35 to 64 Years | 20 (2.3%) | 21 (2.3%) |
| 65 to 74 Years | 35 (16.7%) | 0 (0.0%) |
| 75 Years and over | 5 (3.3%) | 5 (4.3%) |
Disability Class: Ambulatory Difficulty
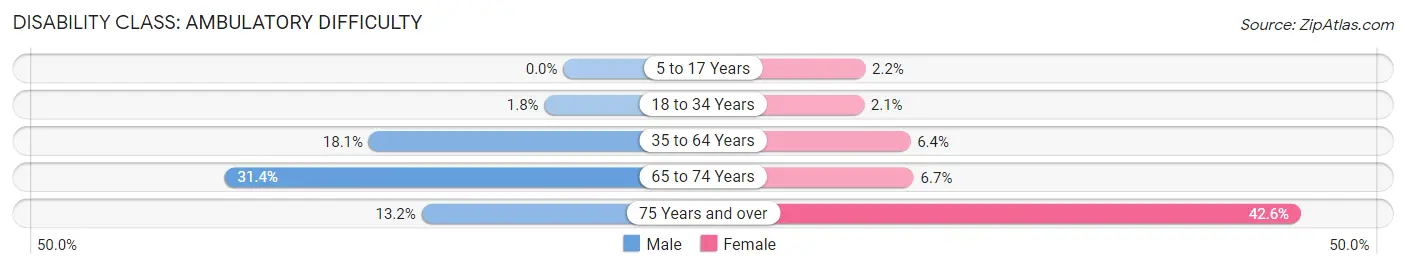
| Age Bracket | Male | Female |
| 5 to 17 Years | 0 (0.0%) | 7 (2.2%) |
| 18 to 34 Years | 9 (1.8%) | 10 (2.1%) |
| 35 to 64 Years | 154 (18.0%) | 59 (6.4%) |
| 65 to 74 Years | 66 (31.4%) | 8 (6.7%) |
| 75 Years and over | 20 (13.2%) | 49 (42.6%) |
Disability Class: Self-Care Difficulty
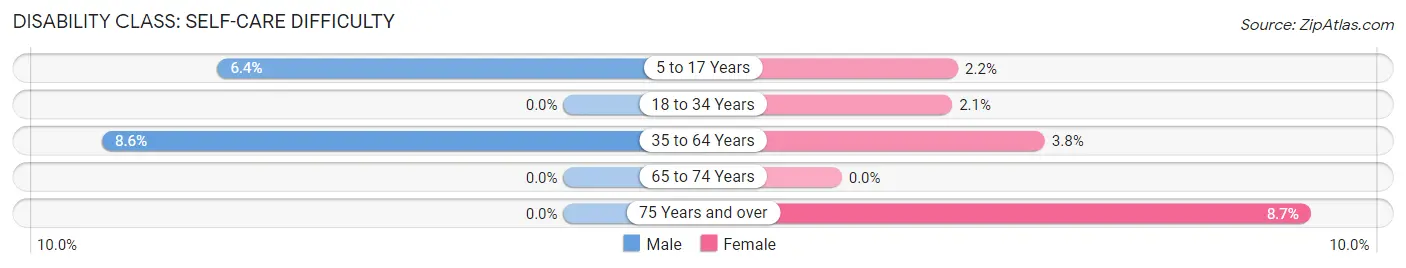
| Age Bracket | Male | Female |
| 5 to 17 Years | 17 (6.4%) | 7 (2.2%) |
| 18 to 34 Years | 0 (0.0%) | 10 (2.1%) |
| 35 to 64 Years | 73 (8.6%) | 35 (3.8%) |
| 65 to 74 Years | 0 (0.0%) | 0 (0.0%) |
| 75 Years and over | 0 (0.0%) | 10 (8.7%) |
Technology Access in Edinburgh
Computing Device Access in Edinburgh
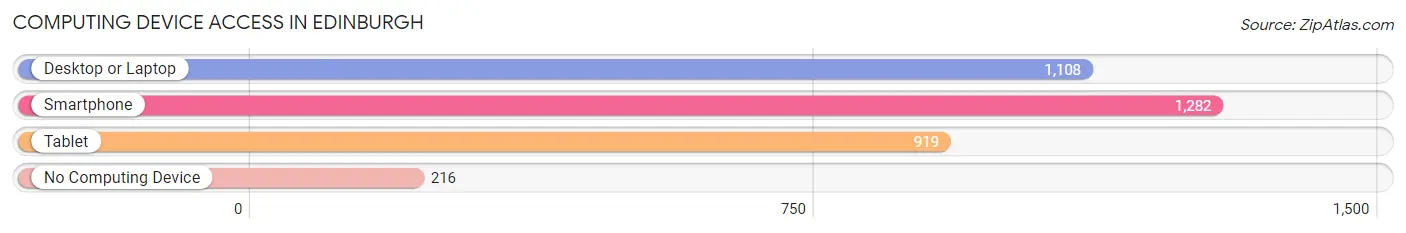
| Device Type | # Households | % Households |
| Desktop or Laptop | 1,108 | 63.3% |
| Smartphone | 1,282 | 73.3% |
| Tablet | 919 | 52.5% |
| No Computing Device | 216 | 12.3% |
| Total | 1,749 | 100.0% |
Internet Access in Edinburgh
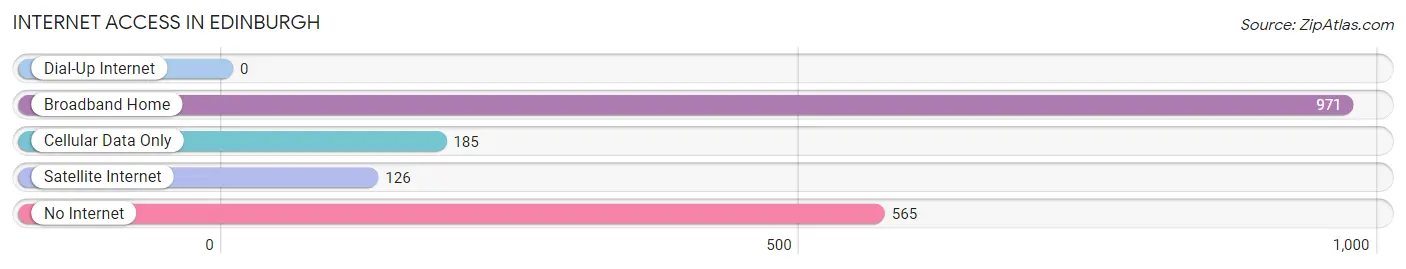
| Internet Type | # Households | % Households |
| Dial-Up Internet | 0 | 0.0% |
| Broadband Home | 971 | 55.5% |
| Cellular Data Only | 185 | 10.6% |
| Satellite Internet | 126 | 7.2% |
| No Internet | 565 | 32.3% |
| Total | 1,749 | 100.0% |
Edinburgh Summary
Edinburgh, Indiana is a small town located in Johnson County, Indiana. It is situated about 20 miles south of Indianapolis and is part of the Indianapolis metropolitan area. The town has a population of approximately 4,500 people and is known for its small-town charm and friendly atmosphere.
Geography
Edinburgh is located in the central part of Johnson County, Indiana. It is situated on the east side of the White River, which is a tributary of the Wabash River. The town is surrounded by rolling hills and farmland, and is located in a rural area. The town is located at an elevation of 830 feet above sea level.
Economy
Edinburgh’s economy is largely based on agriculture and manufacturing. The town is home to several large agricultural operations, including a large hog farm and a large dairy farm. The town is also home to several manufacturing companies, including a plastics manufacturer and a metal fabrication company. The town also has a number of small businesses, including restaurants, retail stores, and service providers.
Demographics
As of the 2010 census, Edinburgh had a population of 4,541 people. The racial makeup of the town was 97.2% White, 0.7% African American, 0.2% Native American, 0.3% Asian, 0.1% Pacific Islander, 0.7% from other races, and 0.9% from two or more races. Hispanic or Latino of any race were 1.7% of the population.
The median income for a household in Edinburgh was $45,938, and the median income for a family was $51,938. The per capita income for the town was $20,938. About 8.2% of families and 10.2% of the population were below the poverty line, including 14.2% of those under age 18 and 8.2% of those age 65 or over.
History
Edinburgh was founded in 1822 by a group of settlers from Scotland. The town was named after the capital of Scotland, Edinburgh. The town was originally a farming community, and the settlers grew corn, wheat, and other crops. The town was also home to several mills, which were used to grind grain and produce flour.
In the late 19th century, the town began to grow and develop. The railroad was built through the town, and several factories were established. The town also became a popular tourist destination, and several hotels and resorts were built.
In the early 20th century, the town continued to grow and develop. The town was home to several large manufacturing companies, including a plastics manufacturer and a metal fabrication company. The town also became a popular tourist destination, and several hotels and resorts were built.
Today, Edinburgh is a small town with a population of approximately 4,500 people. The town is known for its small-town charm and friendly atmosphere. The town is home to several large agricultural operations, manufacturing companies, and small businesses. The town is also a popular tourist destination, and several hotels and resorts are located in the area.
Common Questions
What is Per Capita Income in Edinburgh?
Per Capita income in Edinburgh is $25,378.
What is the Median Family Income in Edinburgh?
Median Family Income in Edinburgh is $67,794.
What is the Median Household income in Edinburgh?
Median Household Income in Edinburgh is $51,496.
What is Income or Wage Gap in Edinburgh?
Income or Wage Gap in Edinburgh is 1.2%.
Women in Edinburgh earn 98.8 cents for every dollar earned by a man.
What is Inequality or Gini Index in Edinburgh?
Inequality or Gini Index in Edinburgh is 0.33.
What is the Total Population of Edinburgh?
Total Population of Edinburgh is 4,144.
What is the Total Male Population of Edinburgh?
Total Male Population of Edinburgh is 2,084.
What is the Total Female Population of Edinburgh?
Total Female Population of Edinburgh is 2,060.
What is the Ratio of Males per 100 Females in Edinburgh?
There are 101.17 Males per 100 Females in Edinburgh.
What is the Ratio of Females per 100 Males in Edinburgh?
There are 98.85 Females per 100 Males in Edinburgh.
What is the Median Population Age in Edinburgh?
Median Population Age in Edinburgh is 40.1 Years.
What is the Average Family Size in Edinburgh
Average Family Size in Edinburgh is 2.9 People.
What is the Average Household Size in Edinburgh
Average Household Size in Edinburgh is 2.4 People.
How Large is the Labor Force in Edinburgh?
There are 2,437 People in the Labor Forcein in Edinburgh.
What is the Percentage of People in the Labor Force in Edinburgh?
70.8% of People are in the Labor Force in Edinburgh.
What is the Unemployment Rate in Edinburgh?
Unemployment Rate in Edinburgh is 8.1%.