Atlanta, IN Map & Demographics
Atlanta Map
Atlanta Overview
$24,988
PER CAPITA INCOME
$51,250
AVG FAMILY INCOME
$57,159
AVG HOUSEHOLD INCOME
24.9%
WAGE / INCOME GAP [ % ]
75.1¢/ $1
WAGE / INCOME GAP [ $ ]
0.39
INEQUALITY / GINI INDEX
773
TOTAL POPULATION
368
MALE POPULATION
405
FEMALE POPULATION
90.86
MALES / 100 FEMALES
110.05
FEMALES / 100 MALES
36.1
MEDIAN AGE
3.0
AVG FAMILY SIZE
2.7
AVG HOUSEHOLD SIZE
352
LABOR FORCE [ PEOPLE ]
60.6%
PERCENT IN LABOR FORCE
10.6%
UNEMPLOYMENT RATE
Atlanta Zip Codes
Atlanta Area Codes
Income in Atlanta
Income Overview in Atlanta
Per Capita Income in Atlanta is $24,988, while median incomes of families and households are $51,250 and $57,159 respectively.
| Characteristic | Number | Measure |
| Per Capita Income | 773 | $24,988 |
| Median Family Income | 203 | $51,250 |
| Mean Family Income | 203 | $63,749 |
| Median Household Income | 281 | $57,159 |
| Mean Household Income | 281 | $67,121 |
| Income Deficit | 203 | $0 |
| Wage / Income Gap (%) | 773 | 24.89% |
| Wage / Income Gap ($) | 773 | 75.11¢ per $1 |
| Gini / Inequality Index | 773 | 0.39 |
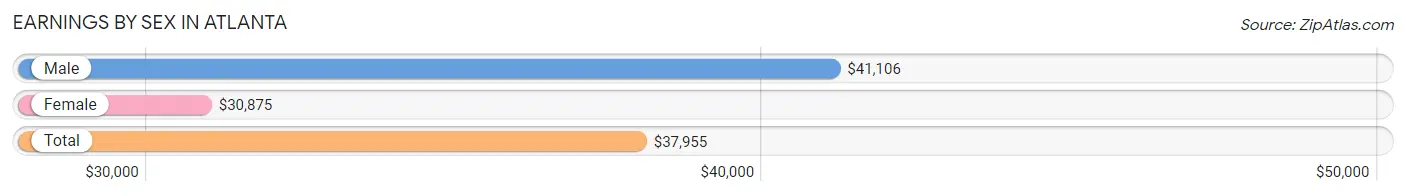
Earnings by Sex in Atlanta
Average Earnings in Atlanta are $37,955, $41,106 for men and $30,875 for women, a difference of 24.9%.
| Sex | Number | Average Earnings |
| Male | 213 (60.2%) | $41,106 |
| Female | 141 (39.8%) | $30,875 |
| Total | 354 (100.0%) | $37,955 |
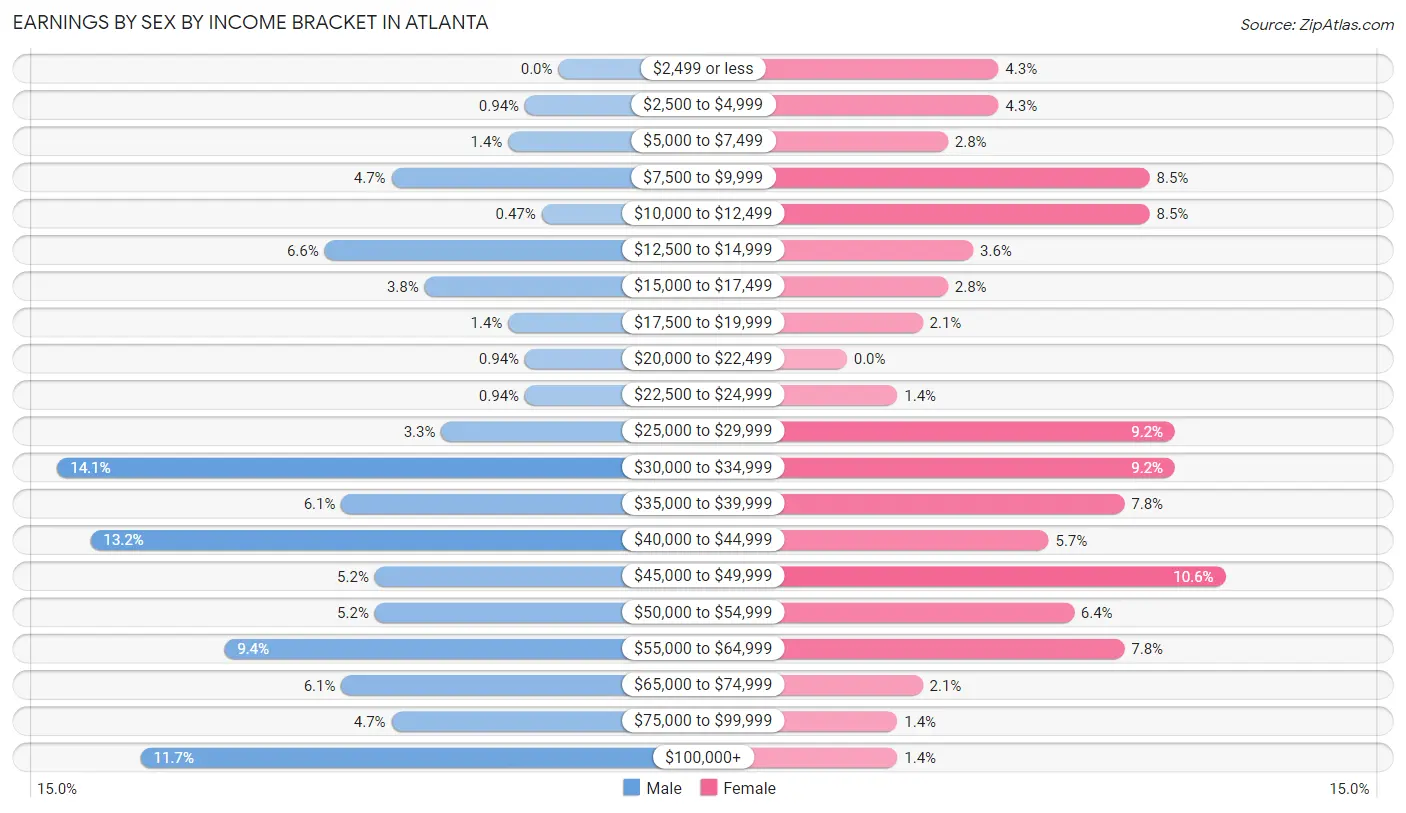
Earnings by Sex by Income Bracket in Atlanta
The most common earnings brackets in Atlanta are $30,000 to $34,999 for men (30 | 14.1%) and $45,000 to $49,999 for women (15 | 10.6%).
| Income | Male | Female |
| $2,499 or less | 0 (0.0%) | 6 (4.3%) |
| $2,500 to $4,999 | 2 (0.9%) | 6 (4.3%) |
| $5,000 to $7,499 | 3 (1.4%) | 4 (2.8%) |
| $7,500 to $9,999 | 10 (4.7%) | 12 (8.5%) |
| $10,000 to $12,499 | 1 (0.5%) | 12 (8.5%) |
| $12,500 to $14,999 | 14 (6.6%) | 5 (3.5%) |
| $15,000 to $17,499 | 8 (3.8%) | 4 (2.8%) |
| $17,500 to $19,999 | 3 (1.4%) | 3 (2.1%) |
| $20,000 to $22,499 | 2 (0.9%) | 0 (0.0%) |
| $22,500 to $24,999 | 2 (0.9%) | 2 (1.4%) |
| $25,000 to $29,999 | 7 (3.3%) | 13 (9.2%) |
| $30,000 to $34,999 | 30 (14.1%) | 13 (9.2%) |
| $35,000 to $39,999 | 13 (6.1%) | 11 (7.8%) |
| $40,000 to $44,999 | 28 (13.2%) | 8 (5.7%) |
| $45,000 to $49,999 | 11 (5.2%) | 15 (10.6%) |
| $50,000 to $54,999 | 11 (5.2%) | 9 (6.4%) |
| $55,000 to $64,999 | 20 (9.4%) | 11 (7.8%) |
| $65,000 to $74,999 | 13 (6.1%) | 3 (2.1%) |
| $75,000 to $99,999 | 10 (4.7%) | 2 (1.4%) |
| $100,000+ | 25 (11.7%) | 2 (1.4%) |
| Total | 213 (100.0%) | 141 (100.0%) |
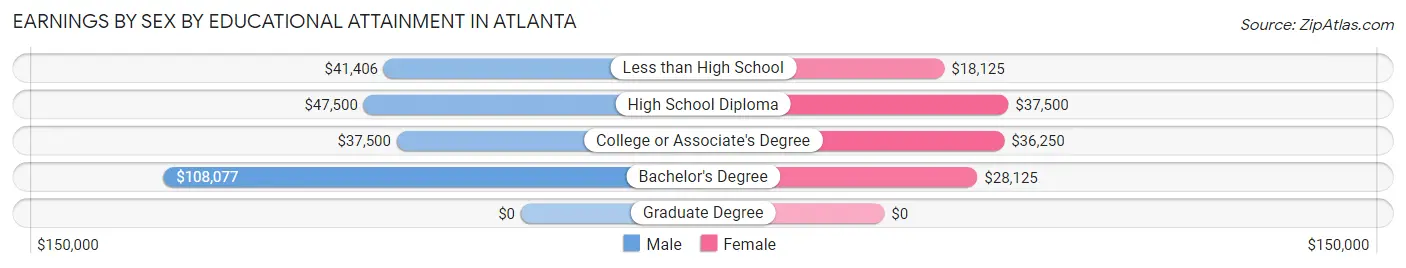
Earnings by Sex by Educational Attainment in Atlanta
Average earnings in Atlanta are $41,683 for men and $32,917 for women, a difference of 21.0%. Men with an educational attainment of bachelor's degree enjoy the highest average annual earnings of $108,077, while those with college or associate's degree education earn the least with $37,500. Women with an educational attainment of high school diploma earn the most with the average annual earnings of $37,500, while those with less than high school education have the smallest earnings of $18,125.
| Educational Attainment | Male Income | Female Income |
| Less than High School | $41,406 | $18,125 |
| High School Diploma | $47,500 | $37,500 |
| College or Associate's Degree | $37,500 | $36,250 |
| Bachelor's Degree | $108,077 | $28,125 |
| Graduate Degree | - | - |
| Total | $41,683 | $32,917 |
Family Income in Atlanta
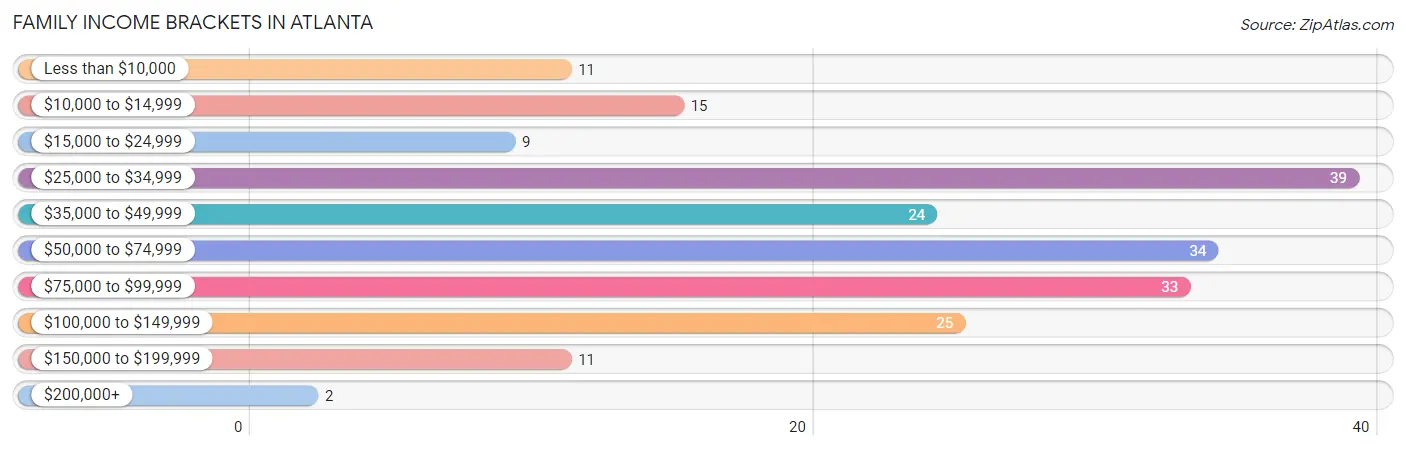
Family Income Brackets in Atlanta
According to the Atlanta family income data, there are 39 families falling into the $25,000 to $34,999 income range, which is the most common income bracket and makes up 19.2% of all families. Conversely, the $200,000+ income bracket is the least frequent group with only 2 families (1.0%) belonging to this category.
| Income Bracket | # Families | % Families |
| Less than $10,000 | 11 | 5.4% |
| $10,000 to $14,999 | 15 | 7.4% |
| $15,000 to $24,999 | 9 | 4.4% |
| $25,000 to $34,999 | 39 | 19.2% |
| $35,000 to $49,999 | 24 | 11.8% |
| $50,000 to $74,999 | 34 | 16.7% |
| $75,000 to $99,999 | 33 | 16.3% |
| $100,000 to $149,999 | 25 | 12.3% |
| $150,000 to $199,999 | 11 | 5.4% |
| $200,000+ | 2 | 1.0% |
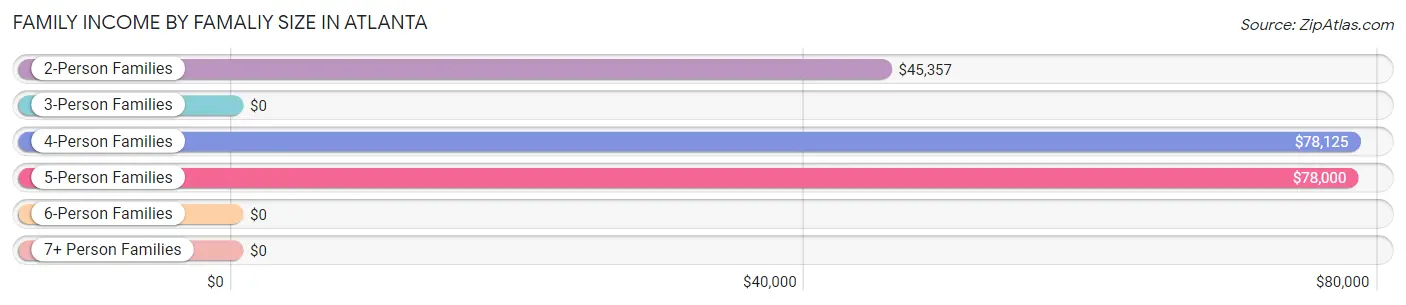
Family Income by Famaliy Size in Atlanta
4-person families (31 | 15.3%) account for the highest median family income in Atlanta with $78,125 per family, while 2-person families (88 | 43.3%) have the highest median income of $22,678 per family member.
| Income Bracket | # Families | Median Income |
| 2-Person Families | 88 (43.3%) | $45,357 |
| 3-Person Families | 62 (30.5%) | $0 |
| 4-Person Families | 31 (15.3%) | $78,125 |
| 5-Person Families | 12 (5.9%) | $78,000 |
| 6-Person Families | 8 (3.9%) | $0 |
| 7+ Person Families | 2 (1.0%) | $0 |
| Total | 203 (100.0%) | $51,250 |
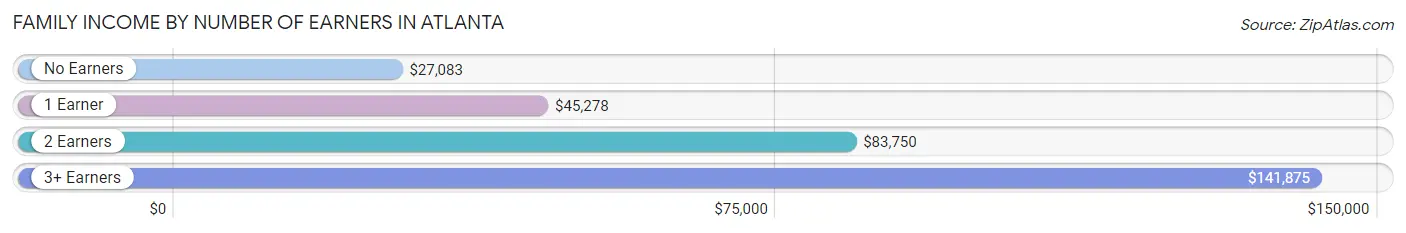
Family Income by Number of Earners in Atlanta
The median family income in Atlanta is $51,250, with families comprising 3+ earners (15) having the highest median family income of $141,875, while families with no earners (42) have the lowest median family income of $27,083, accounting for 7.4% and 20.7% of families, respectively.
| Number of Earners | # Families | Median Income |
| No Earners | 42 (20.7%) | $27,083 |
| 1 Earner | 96 (47.3%) | $45,278 |
| 2 Earners | 50 (24.6%) | $83,750 |
| 3+ Earners | 15 (7.4%) | $141,875 |
| Total | 203 (100.0%) | $51,250 |
Household Income in Atlanta
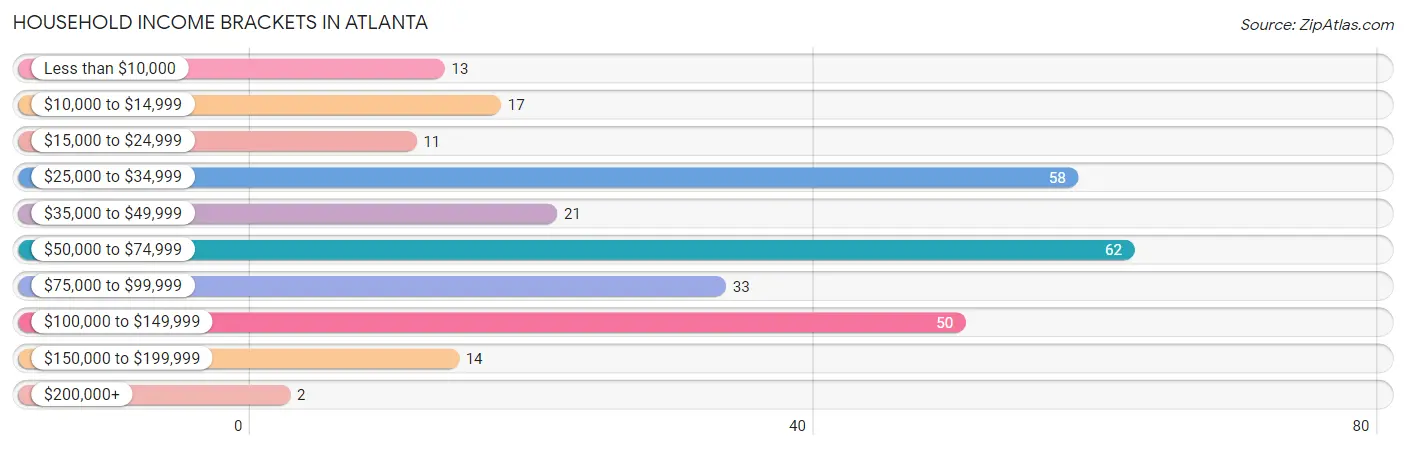
Household Income Brackets in Atlanta
With 62 households falling in the category, the $50,000 to $74,999 income range is the most frequent in Atlanta, accounting for 22.1% of all households. In contrast, only 2 households (0.7%) fall into the $200,000+ income bracket, making it the least populous group.
| Income Bracket | # Households | % Households |
| Less than $10,000 | 13 | 4.6% |
| $10,000 to $14,999 | 17 | 6.0% |
| $15,000 to $24,999 | 11 | 3.9% |
| $25,000 to $34,999 | 58 | 20.6% |
| $35,000 to $49,999 | 21 | 7.5% |
| $50,000 to $74,999 | 62 | 22.1% |
| $75,000 to $99,999 | 33 | 11.7% |
| $100,000 to $149,999 | 50 | 17.8% |
| $150,000 to $199,999 | 14 | 5.0% |
| $200,000+ | 2 | 0.7% |
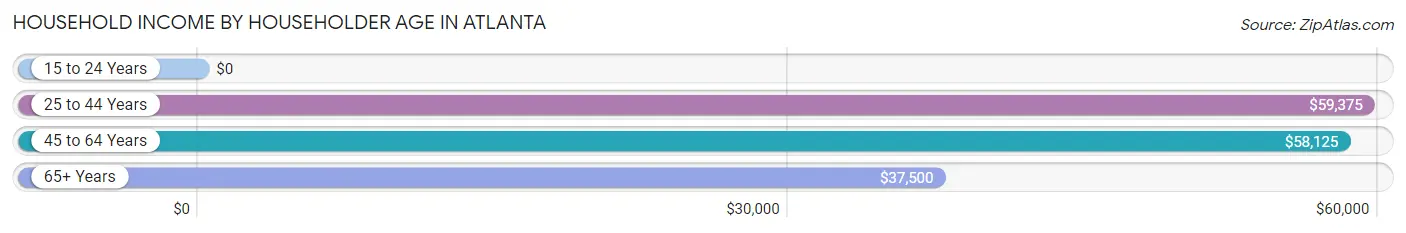
Household Income by Householder Age in Atlanta
The median household income in Atlanta is $57,159, with the highest median household income of $59,375 found in the 25 to 44 years age bracket for the primary householder. A total of 112 households (39.9%) fall into this category.
| Income Bracket | # Households | Median Income |
| 15 to 24 Years | 0 (0.0%) | $0 |
| 25 to 44 Years | 112 (39.9%) | $59,375 |
| 45 to 64 Years | 103 (36.6%) | $58,125 |
| 65+ Years | 66 (23.5%) | $37,500 |
| Total | 281 (100.0%) | $57,159 |
Poverty in Atlanta
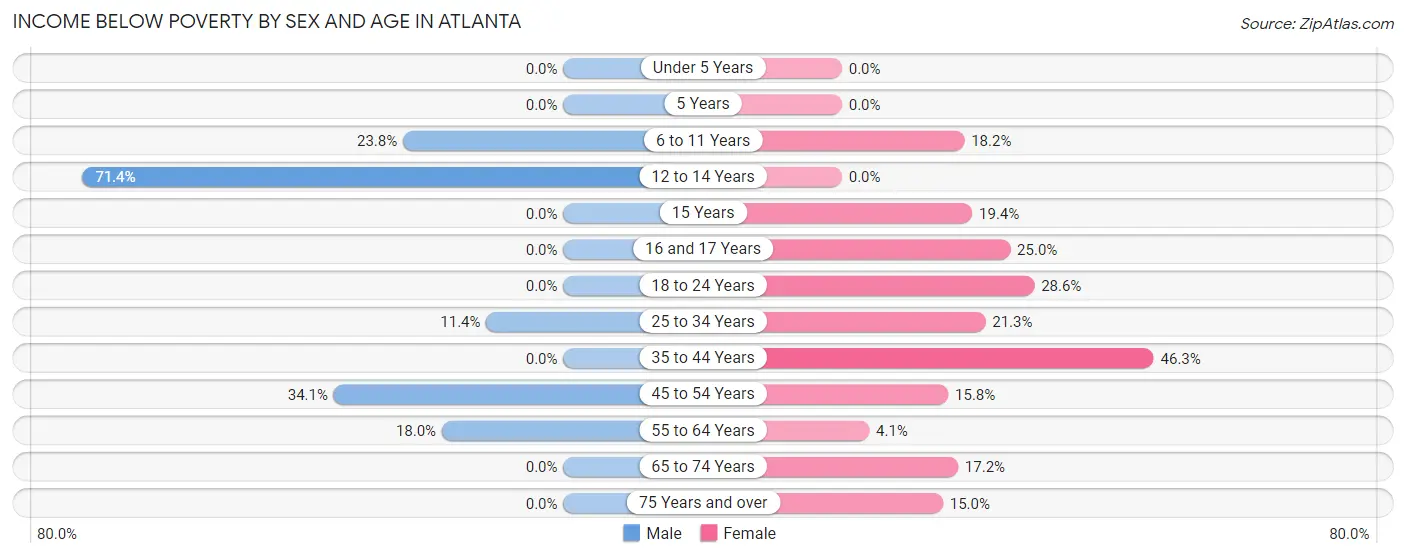
Income Below Poverty by Sex and Age in Atlanta
With 15.0% poverty level for males and 19.3% for females among the residents of Atlanta, 12 to 14 year old males and 35 to 44 year old females are the most vulnerable to poverty, with 10 males (71.4%) and 25 females (46.3%) in their respective age groups living below the poverty level.
| Age Bracket | Male | Female |
| Under 5 Years | 0 (0.0%) | 0 (0.0%) |
| 5 Years | 0 (0.0%) | 0 (0.0%) |
| 6 to 11 Years | 10 (23.8%) | 10 (18.2%) |
| 12 to 14 Years | 10 (71.4%) | 0 (0.0%) |
| 15 Years | 0 (0.0%) | 6 (19.4%) |
| 16 and 17 Years | 0 (0.0%) | 4 (25.0%) |
| 18 to 24 Years | 0 (0.0%) | 6 (28.6%) |
| 25 to 34 Years | 8 (11.4%) | 13 (21.3%) |
| 35 to 44 Years | 0 (0.0%) | 25 (46.3%) |
| 45 to 54 Years | 15 (34.1%) | 3 (15.8%) |
| 55 to 64 Years | 11 (18.0%) | 3 (4.1%) |
| 65 to 74 Years | 0 (0.0%) | 5 (17.2%) |
| 75 Years and over | 0 (0.0%) | 3 (15.0%) |
| Total | 54 (15.0%) | 78 (19.3%) |
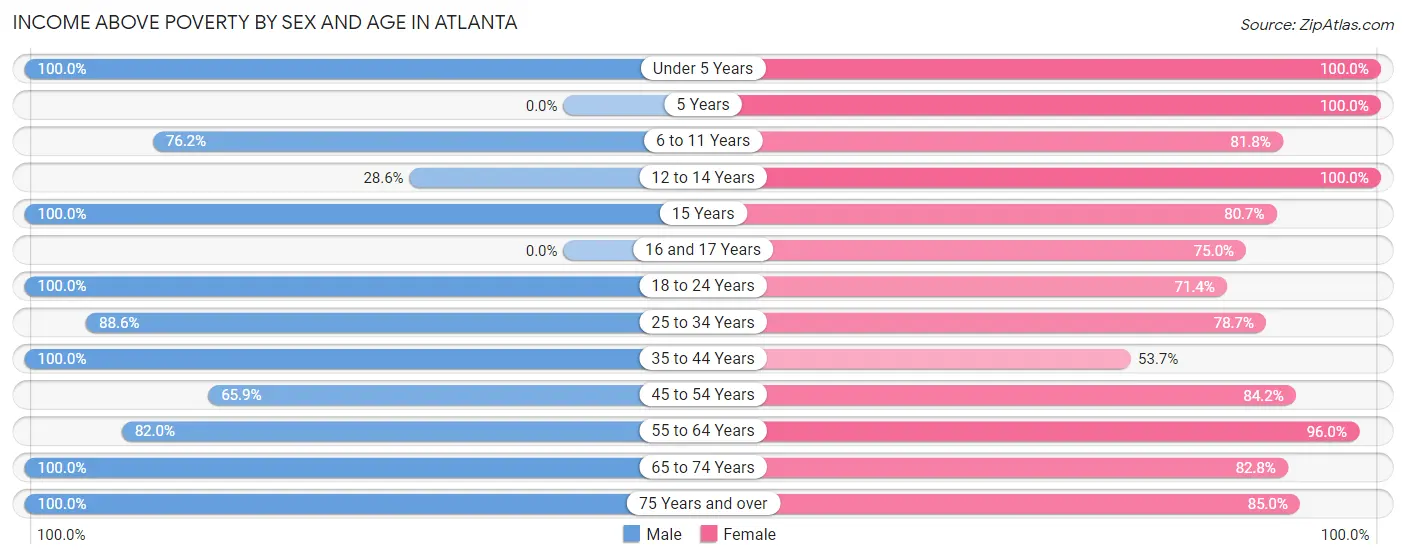
Income Above Poverty by Sex and Age in Atlanta
According to the poverty statistics in Atlanta, males aged under 5 years and females aged under 5 years are the age groups that are most secure financially, with 100.0% of males and 100.0% of females in these age groups living above the poverty line.
| Age Bracket | Male | Female |
| Under 5 Years | 14 (100.0%) | 12 (100.0%) |
| 5 Years | 0 (0.0%) | 2 (100.0%) |
| 6 to 11 Years | 32 (76.2%) | 45 (81.8%) |
| 12 to 14 Years | 4 (28.6%) | 11 (100.0%) |
| 15 Years | 2 (100.0%) | 25 (80.6%) |
| 16 and 17 Years | 0 (0.0%) | 12 (75.0%) |
| 18 to 24 Years | 23 (100.0%) | 15 (71.4%) |
| 25 to 34 Years | 62 (88.6%) | 48 (78.7%) |
| 35 to 44 Years | 34 (100.0%) | 29 (53.7%) |
| 45 to 54 Years | 29 (65.9%) | 16 (84.2%) |
| 55 to 64 Years | 50 (82.0%) | 71 (96.0%) |
| 65 to 74 Years | 35 (100.0%) | 24 (82.8%) |
| 75 Years and over | 20 (100.0%) | 17 (85.0%) |
| Total | 305 (85.0%) | 327 (80.7%) |
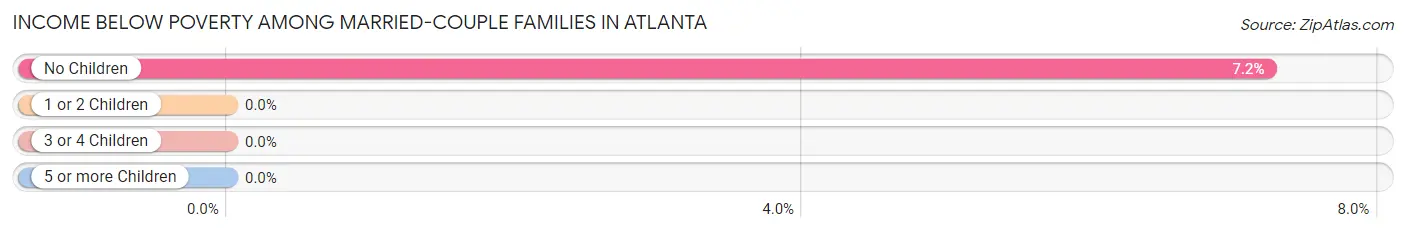
Income Below Poverty Among Married-Couple Families in Atlanta
The poverty statistics for married-couple families in Atlanta show that 4.4% or 6 of the total 136 families live below the poverty line. Families with no children have the highest poverty rate of 7.2%, comprising of 6 families. On the other hand, families with 1 or 2 children have the lowest poverty rate of 0.0%, which includes 0 families.
| Children | Above Poverty | Below Poverty |
| No Children | 77 (92.8%) | 6 (7.2%) |
| 1 or 2 Children | 38 (100.0%) | 0 (0.0%) |
| 3 or 4 Children | 15 (100.0%) | 0 (0.0%) |
| 5 or more Children | 0 (0.0%) | 0 (0.0%) |
| Total | 130 (95.6%) | 6 (4.4%) |
Income Below Poverty Among Single-Parent Households in Atlanta
According to the poverty data in Atlanta, 6.7% or 1 single-father households and 50.0% or 26 single-mother households are living below the poverty line. Among single-father households, those with no children have the highest poverty rate, with 1 households (33.3%) experiencing poverty. Likewise, among single-mother households, those with 1 or 2 children have the highest poverty rate, with 24 households (57.1%) falling below the poverty line.
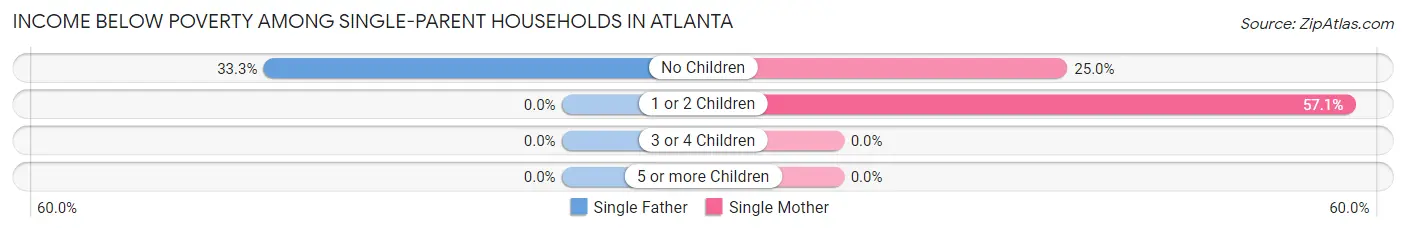
| Children | Single Father | Single Mother |
| No Children | 1 (33.3%) | 2 (25.0%) |
| 1 or 2 Children | 0 (0.0%) | 24 (57.1%) |
| 3 or 4 Children | 0 (0.0%) | 0 (0.0%) |
| 5 or more Children | 0 (0.0%) | 0 (0.0%) |
| Total | 1 (6.7%) | 26 (50.0%) |
Income Below Poverty Among Married-Couple vs Single-Parent Households in Atlanta
The poverty data for Atlanta shows that 6 of the married-couple family households (4.4%) and 27 of the single-parent households (40.3%) are living below the poverty level. Within the married-couple family households, those with no children have the highest poverty rate, with 6 households (7.2%) falling below the poverty line. Among the single-parent households, those with 1 or 2 children have the highest poverty rate, with 24 household (44.4%) living below poverty.
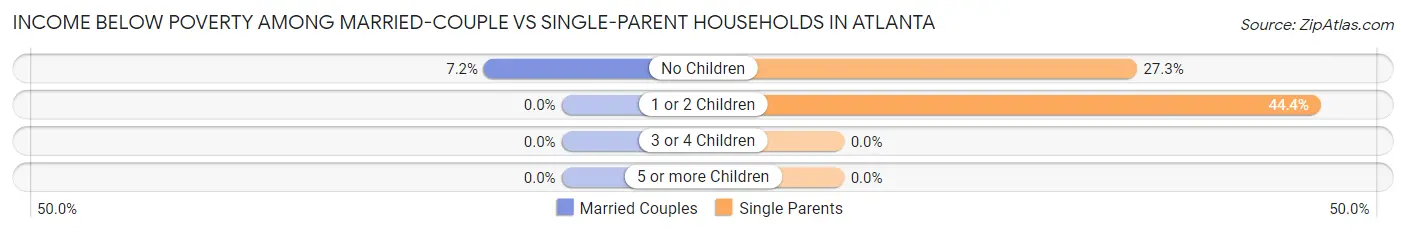
| Children | Married-Couple Families | Single-Parent Households |
| No Children | 6 (7.2%) | 3 (27.3%) |
| 1 or 2 Children | 0 (0.0%) | 24 (44.4%) |
| 3 or 4 Children | 0 (0.0%) | 0 (0.0%) |
| 5 or more Children | 0 (0.0%) | 0 (0.0%) |
| Total | 6 (4.4%) | 27 (40.3%) |
Race in Atlanta
The most populous races in Atlanta are White / Caucasian (734 | 95.0%), Hispanic or Latino (51 | 6.6%), and Two or more Races (28 | 3.6%).
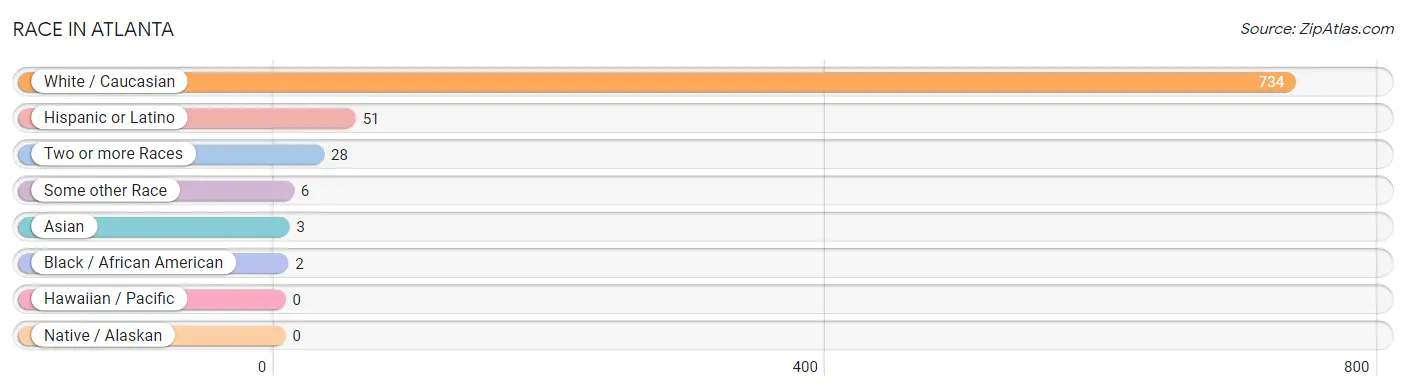
| Race | # Population | % Population |
| Asian | 3 | 0.4% |
| Black / African American | 2 | 0.3% |
| Hawaiian / Pacific | 0 | 0.0% |
| Hispanic or Latino | 51 | 6.6% |
| Native / Alaskan | 0 | 0.0% |
| White / Caucasian | 734 | 95.0% |
| Two or more Races | 28 | 3.6% |
| Some other Race | 6 | 0.8% |
| Total | 773 | 100.0% |
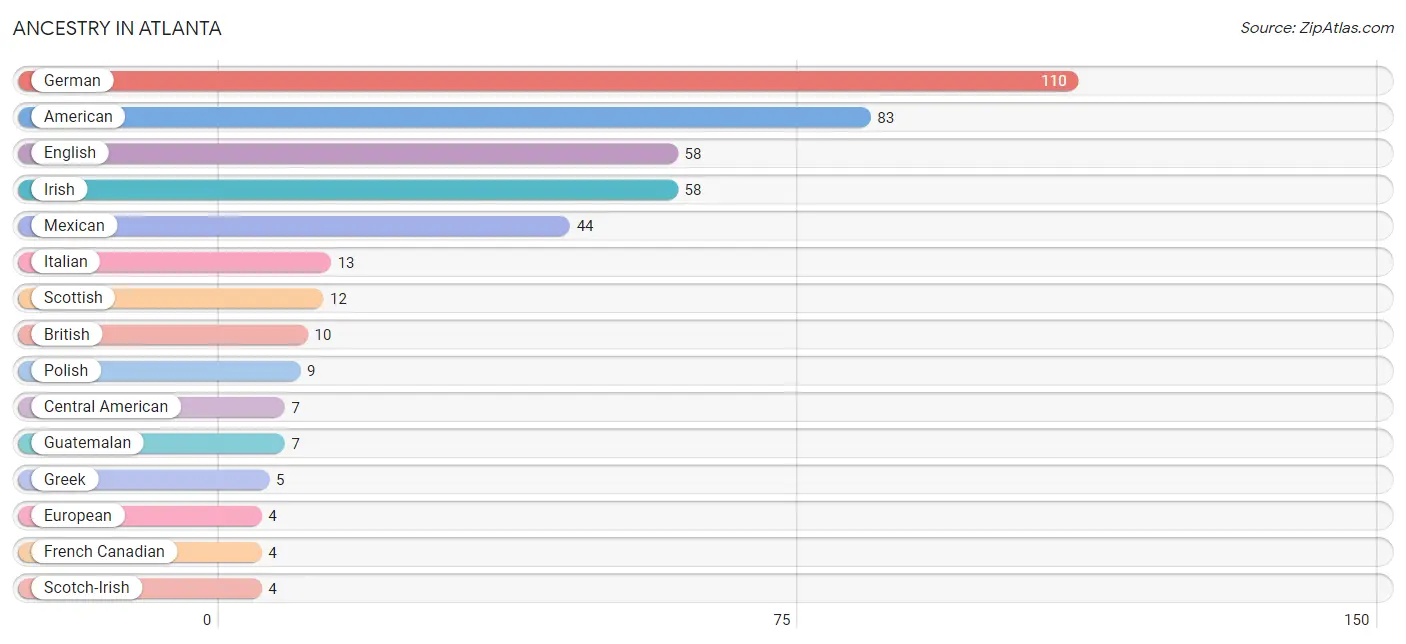
Ancestry in Atlanta
The most populous ancestries reported in Atlanta are German (110 | 14.2%), American (83 | 10.7%), English (58 | 7.5%), Irish (58 | 7.5%), and Mexican (44 | 5.7%), together accounting for 45.7% of all Atlanta residents.
| Ancestry | # Population | % Population |
| American | 83 | 10.7% |
| British | 10 | 1.3% |
| Central American | 7 | 0.9% |
| Dutch | 2 | 0.3% |
| English | 58 | 7.5% |
| European | 4 | 0.5% |
| French | 2 | 0.3% |
| French Canadian | 4 | 0.5% |
| German | 110 | 14.2% |
| Greek | 5 | 0.6% |
| Guatemalan | 7 | 0.9% |
| Irish | 58 | 7.5% |
| Italian | 13 | 1.7% |
| Korean | 1 | 0.1% |
| Mexican | 44 | 5.7% |
| Norwegian | 3 | 0.4% |
| Polish | 9 | 1.2% |
| Russian | 2 | 0.3% |
| Scandinavian | 2 | 0.3% |
| Scotch-Irish | 4 | 0.5% |
| Scottish | 12 | 1.5% |
| Swedish | 2 | 0.3% |
| Thai | 2 | 0.3% |
| Welsh | 4 | 0.5% |
| Yugoslavian | 1 | 0.1% | View All 25 Rows |
Immigrants in Atlanta
The most numerous immigrant groups reported in Atlanta came from Central America (28 | 3.6%), Latin America (28 | 3.6%), Mexico (21 | 2.7%), Guatemala (7 | 0.9%), and Asia (2 | 0.3%), together accounting for 11.1% of all Atlanta residents.
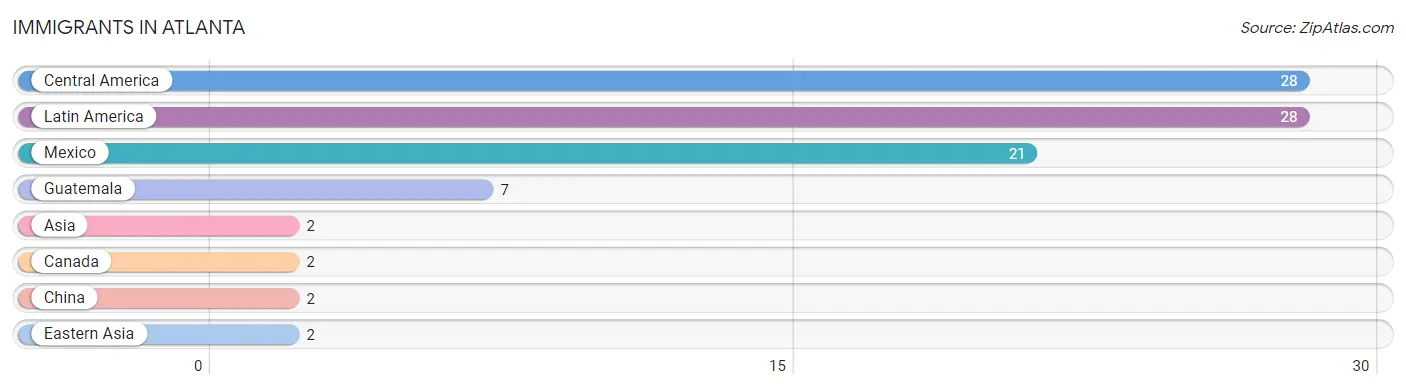
| Immigration Origin | # Population | % Population |
| Asia | 2 | 0.3% |
| Canada | 2 | 0.3% |
| Central America | 28 | 3.6% |
| China | 2 | 0.3% |
| Eastern Asia | 2 | 0.3% |
| Guatemala | 7 | 0.9% |
| Latin America | 28 | 3.6% |
| Mexico | 21 | 2.7% | View All 8 Rows |
Sex and Age in Atlanta
Sex and Age in Atlanta
The most populous age groups in Atlanta are 25 to 29 Years (50 | 13.6%) for men and 15 to 19 Years (59 | 14.6%) for women.
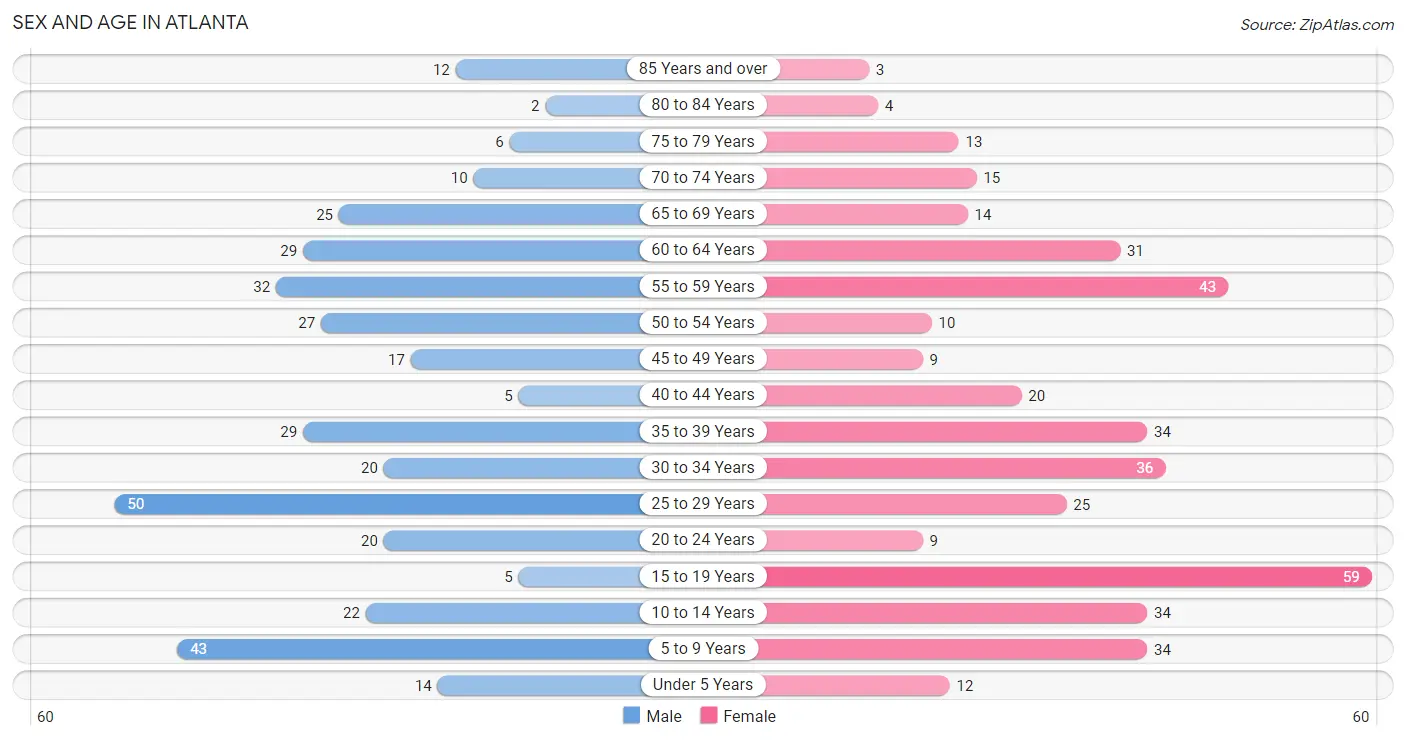
| Age Bracket | Male | Female |
| Under 5 Years | 14 (3.8%) | 12 (3.0%) |
| 5 to 9 Years | 43 (11.7%) | 34 (8.4%) |
| 10 to 14 Years | 22 (6.0%) | 34 (8.4%) |
| 15 to 19 Years | 5 (1.4%) | 59 (14.6%) |
| 20 to 24 Years | 20 (5.4%) | 9 (2.2%) |
| 25 to 29 Years | 50 (13.6%) | 25 (6.2%) |
| 30 to 34 Years | 20 (5.4%) | 36 (8.9%) |
| 35 to 39 Years | 29 (7.9%) | 34 (8.4%) |
| 40 to 44 Years | 5 (1.4%) | 20 (4.9%) |
| 45 to 49 Years | 17 (4.6%) | 9 (2.2%) |
| 50 to 54 Years | 27 (7.3%) | 10 (2.5%) |
| 55 to 59 Years | 32 (8.7%) | 43 (10.6%) |
| 60 to 64 Years | 29 (7.9%) | 31 (7.6%) |
| 65 to 69 Years | 25 (6.8%) | 14 (3.5%) |
| 70 to 74 Years | 10 (2.7%) | 15 (3.7%) |
| 75 to 79 Years | 6 (1.6%) | 13 (3.2%) |
| 80 to 84 Years | 2 (0.5%) | 4 (1.0%) |
| 85 Years and over | 12 (3.3%) | 3 (0.7%) |
| Total | 368 (100.0%) | 405 (100.0%) |
Families and Households in Atlanta
Median Family Size in Atlanta
The median family size in Atlanta is 3.02 persons per family, with married-couple families (136 | 67.0%) accounting for the largest median family size of 3.15 persons per family. On the other hand, single male/father families (15 | 7.4%) represent the smallest median family size with 2.73 persons per family.
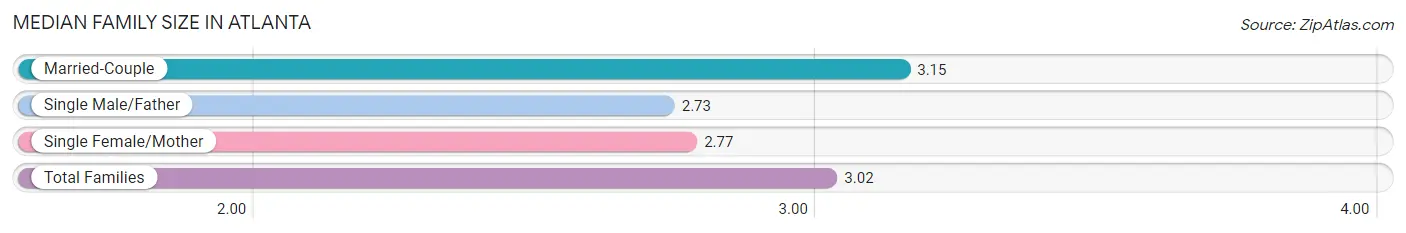
| Family Type | # Families | Family Size |
| Married-Couple | 136 (67.0%) | 3.15 |
| Single Male/Father | 15 (7.4%) | 2.73 |
| Single Female/Mother | 52 (25.6%) | 2.77 |
| Total Families | 203 (100.0%) | 3.02 |
Median Household Size in Atlanta
The median household size in Atlanta is 2.72 persons per household, with married-couple households (136 | 48.4%) accounting for the largest median household size of 3.21 persons per household. non-family households (78 | 27.8%) represent the smallest median household size with 1.53 persons per household.
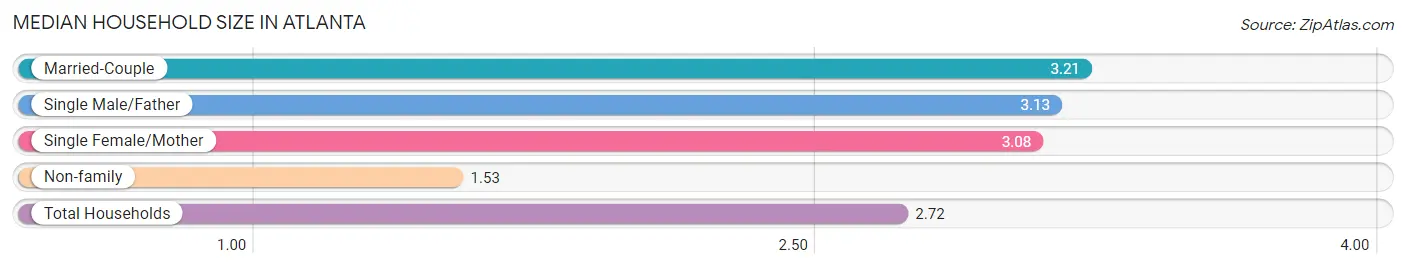
| Household Type | # Households | Household Size |
| Married-Couple | 136 (48.4%) | 3.21 |
| Single Male/Father | 15 (5.3%) | 3.13 |
| Single Female/Mother | 52 (18.5%) | 3.08 |
| Non-family | 78 (27.8%) | 1.53 |
| Total Households | 281 (100.0%) | 2.72 |
Household Size by Marriage Status in Atlanta
Out of a total of 281 households in Atlanta, 203 (72.2%) are family households, while 78 (27.8%) are nonfamily households. The most numerous type of family households are 2-person households, comprising 76, and the most common type of nonfamily households are 1-person households, comprising 51.
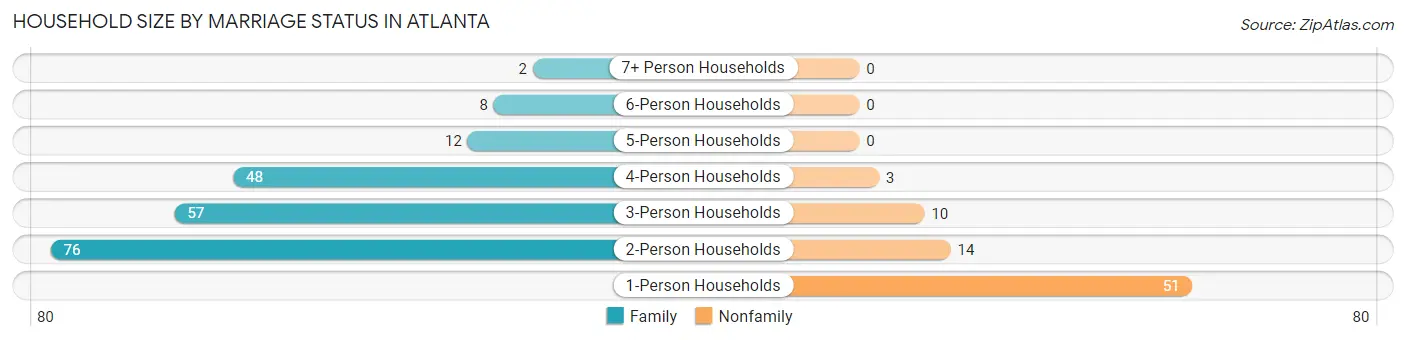
| Household Size | Family Households | Nonfamily Households |
| 1-Person Households | - | 51 (18.1%) |
| 2-Person Households | 76 (27.1%) | 14 (5.0%) |
| 3-Person Households | 57 (20.3%) | 10 (3.6%) |
| 4-Person Households | 48 (17.1%) | 3 (1.1%) |
| 5-Person Households | 12 (4.3%) | 0 (0.0%) |
| 6-Person Households | 8 (2.9%) | 0 (0.0%) |
| 7+ Person Households | 2 (0.7%) | 0 (0.0%) |
| Total | 203 (72.2%) | 78 (27.8%) |
Female Fertility in Atlanta
Fertility by Age in Atlanta
Average fertility rate in Atlanta is 21.0 births per 1,000 women. Women in the age bracket of 35 to 50 years have the highest fertility rate with 63.0 births per 1,000 women. Women in the age bracket of 35 to 50 years acount for 100.0% of all women with births.
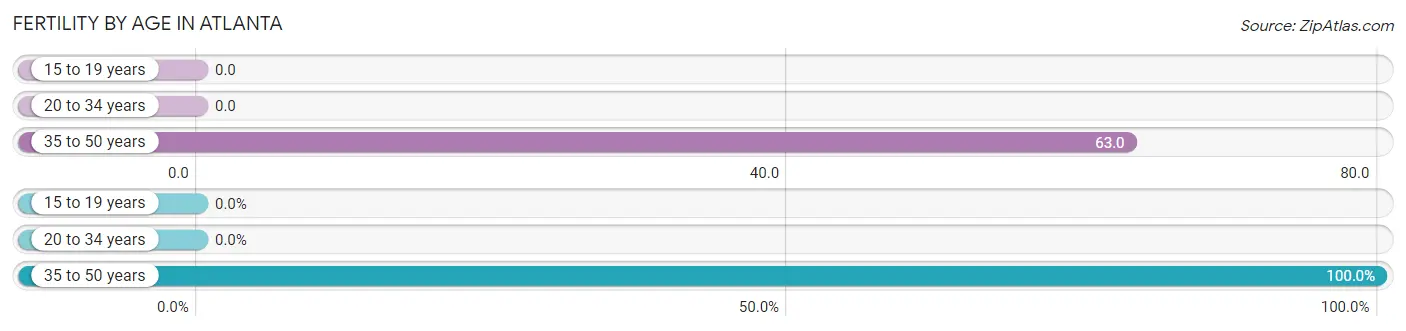
| Age Bracket | Women with Births | Births / 1,000 Women |
| 15 to 19 years | 0 (0.0%) | 0.0 |
| 20 to 34 years | 0 (0.0%) | 0.0 |
| 35 to 50 years | 4 (100.0%) | 63.0 |
| Total | 4 (100.0%) | 21.0 |
Fertility by Age by Marriage Status in Atlanta
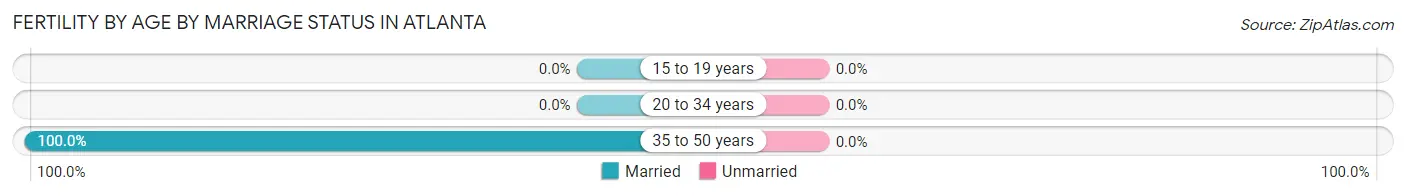
| Age Bracket | Married | Unmarried |
| 15 to 19 years | 0 (0.0%) | 0 (0.0%) |
| 20 to 34 years | 0 (0.0%) | 0 (0.0%) |
| 35 to 50 years | 4 (100.0%) | 0 (0.0%) |
| Total | 4 (100.0%) | 0 (0.0%) |
Fertility by Education in Atlanta
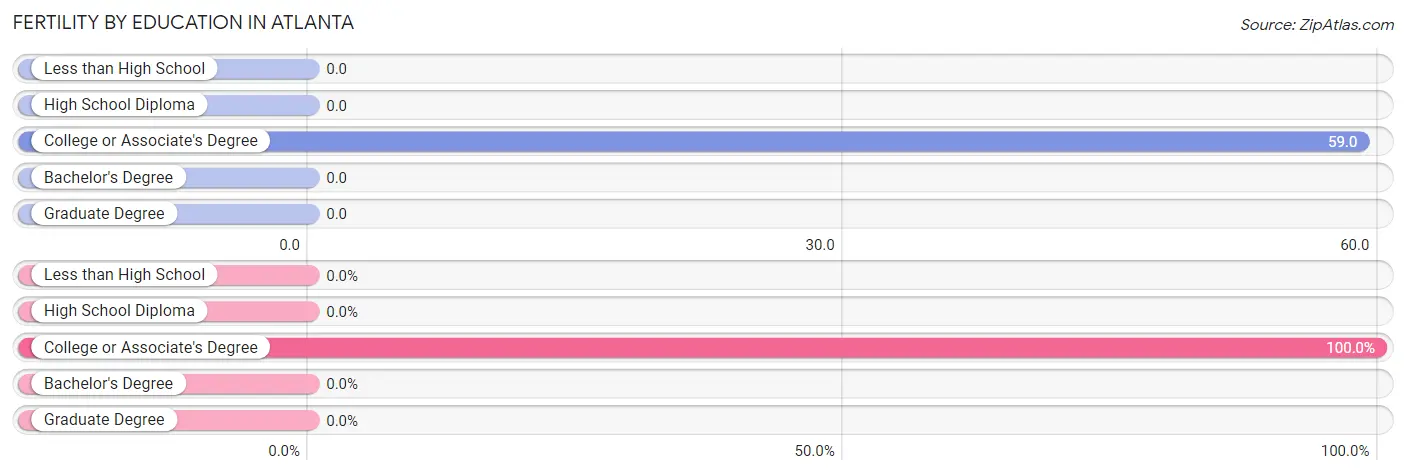
| Educational Attainment | Women with Births | Births / 1,000 Women |
| Less than High School | 0 (0.0%) | 0.0 |
| High School Diploma | 0 (0.0%) | 0.0 |
| College or Associate's Degree | 4 (100.0%) | 59.0 |
| Bachelor's Degree | 0 (0.0%) | 0.0 |
| Graduate Degree | 0 (0.0%) | 0.0 |
| Total | 4 (100.0%) | 21.0 |
Fertility by Education by Marriage Status in Atlanta
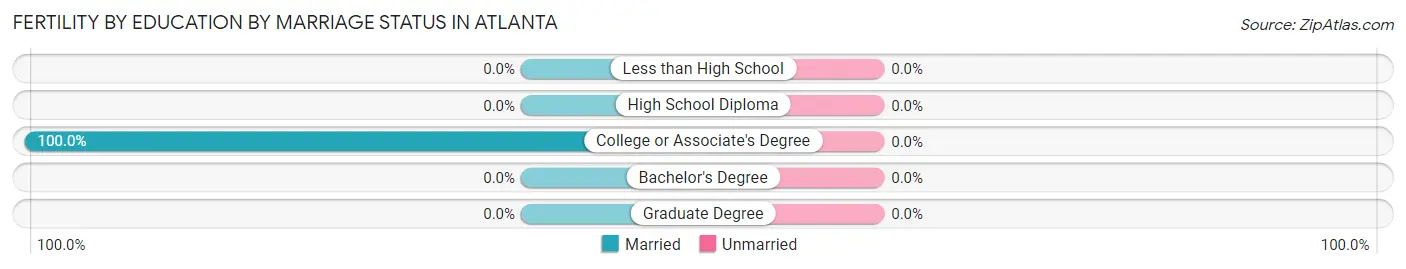
| Educational Attainment | Married | Unmarried |
| Less than High School | 0 (0.0%) | 0 (0.0%) |
| High School Diploma | 0 (0.0%) | 0 (0.0%) |
| College or Associate's Degree | 4 (100.0%) | 0 (0.0%) |
| Bachelor's Degree | 0 (0.0%) | 0 (0.0%) |
| Graduate Degree | 0 (0.0%) | 0 (0.0%) |
| Total | 4 (100.0%) | 0 (0.0%) |
Employment Characteristics in Atlanta
Employment by Class of Employer in Atlanta
Among the 315 employed individuals in Atlanta, private company employees (232 | 73.7%), local government employees (33 | 10.5%), and self-employed (not incorporated) (21 | 6.7%) make up the most common classes of employment.
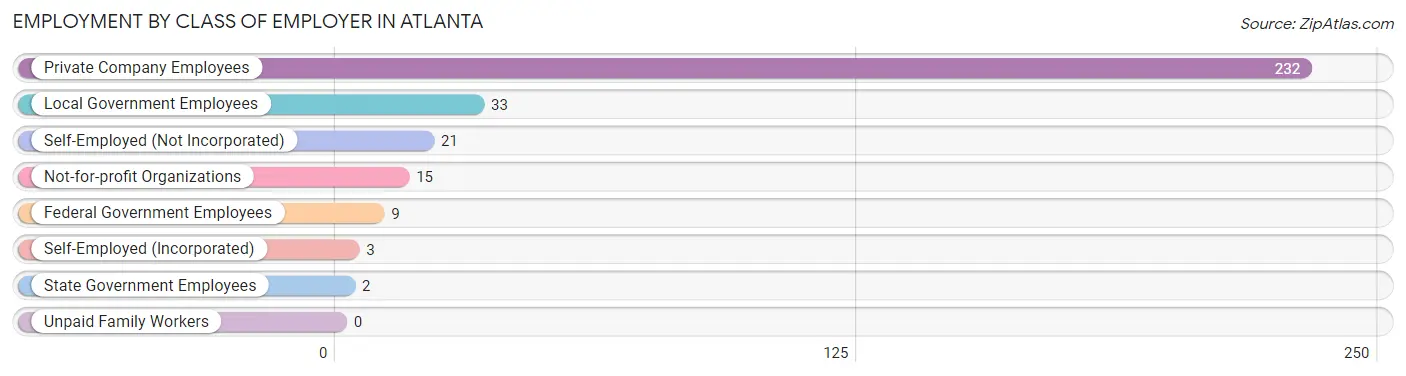
| Employer Class | # Employees | % Employees |
| Private Company Employees | 232 | 73.7% |
| Self-Employed (Incorporated) | 3 | 0.9% |
| Self-Employed (Not Incorporated) | 21 | 6.7% |
| Not-for-profit Organizations | 15 | 4.8% |
| Local Government Employees | 33 | 10.5% |
| State Government Employees | 2 | 0.6% |
| Federal Government Employees | 9 | 2.9% |
| Unpaid Family Workers | 0 | 0.0% |
| Total | 315 | 100.0% |
Employment Status by Age in Atlanta
According to the labor force statistics for Atlanta, out of the total population over 16 years of age (581), 60.6% or 352 individuals are in the labor force, with 10.6% or 37 of them unemployed. The age group with the highest labor force participation rate is 25 to 29 years, with 93.3% or 70 individuals in the labor force. Within the labor force, the 75 years and over age range has the highest percentage of unemployed individuals, with 60.0% or 3 of them being unemployed.
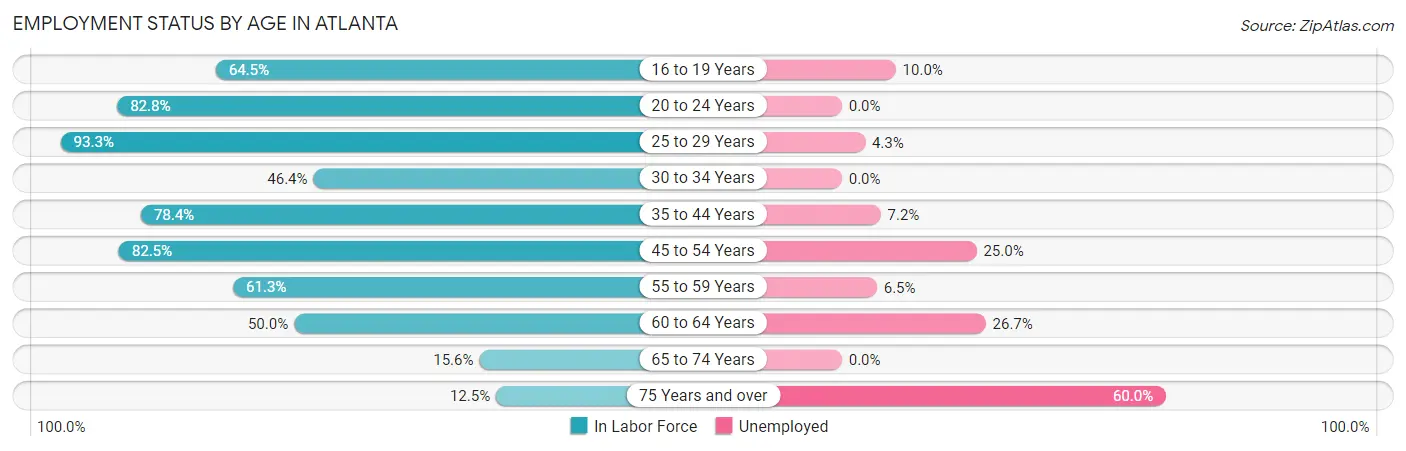
| Age Bracket | In Labor Force | Unemployed |
| 16 to 19 Years | 20 (64.5%) | 2 (10.0%) |
| 20 to 24 Years | 24 (82.8%) | 0 (0.0%) |
| 25 to 29 Years | 70 (93.3%) | 3 (4.3%) |
| 30 to 34 Years | 26 (46.4%) | 0 (0.0%) |
| 35 to 44 Years | 69 (78.4%) | 5 (7.2%) |
| 45 to 54 Years | 52 (82.5%) | 13 (25.0%) |
| 55 to 59 Years | 46 (61.3%) | 3 (6.5%) |
| 60 to 64 Years | 30 (50.0%) | 8 (26.7%) |
| 65 to 74 Years | 10 (15.6%) | 0 (0.0%) |
| 75 Years and over | 5 (12.5%) | 3 (60.0%) |
| Total | 352 (60.6%) | 37 (10.6%) |
Employment Status by Educational Attainment in Atlanta
According to labor force statistics for Atlanta, 70.3% of individuals (293) out of the total population between 25 and 64 years of age (417) are in the labor force, with 11.0% or 32 of them being unemployed. The group with the highest labor force participation rate are those with the educational attainment of college / associate degree, with 87.3% or 131 individuals in the labor force. Within the labor force, individuals with high school diploma education have the highest percentage of unemployment, with 14.8% or 16 of them being unemployed.
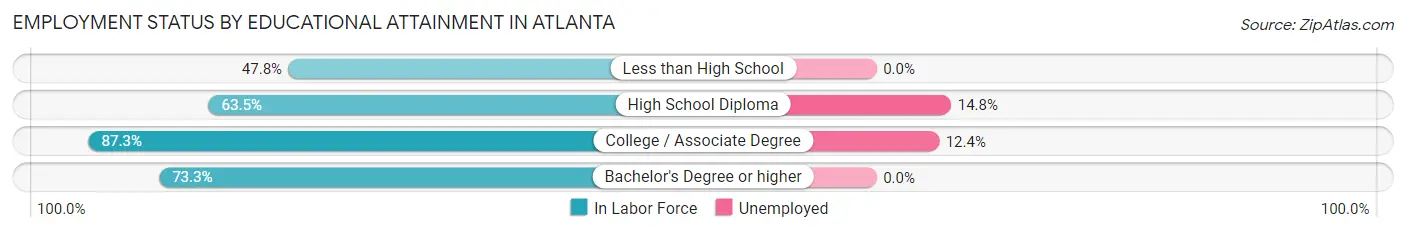
| Educational Attainment | In Labor Force | Unemployed |
| Less than High School | 32 (47.8%) | 0 (0.0%) |
| High School Diploma | 108 (63.5%) | 25 (14.8%) |
| College / Associate Degree | 131 (87.3%) | 19 (12.4%) |
| Bachelor's Degree or higher | 22 (73.3%) | 0 (0.0%) |
| Total | 293 (70.3%) | 46 (11.0%) |
Employment Occupations by Sex in Atlanta
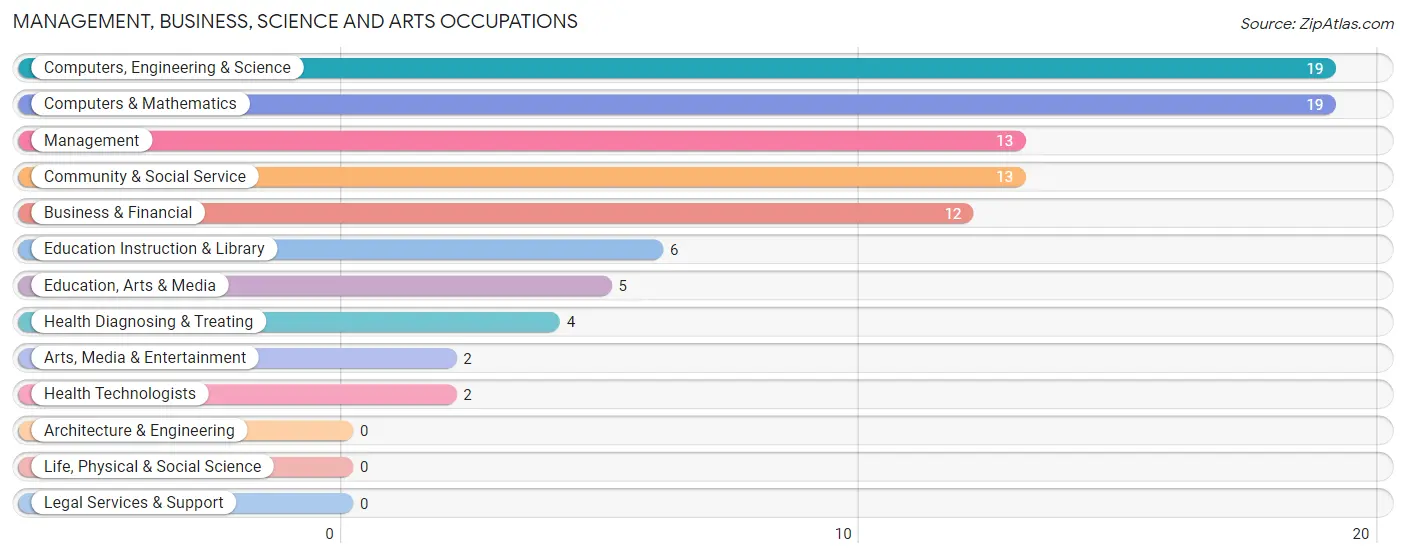
Management, Business, Science and Arts Occupations
The most common Management, Business, Science and Arts occupations in Atlanta are Computers, Engineering & Science (19 | 6.1%), Computers & Mathematics (19 | 6.1%), Management (13 | 4.2%), Community & Social Service (13 | 4.2%), and Business & Financial (12 | 3.8%).
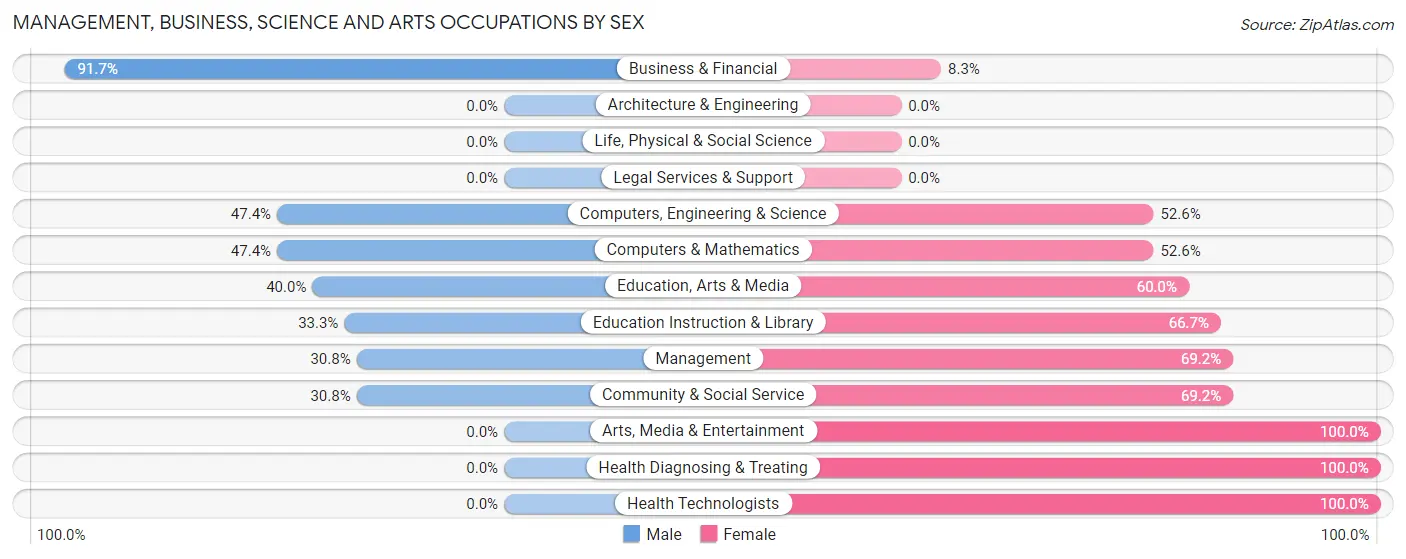
Management, Business, Science and Arts Occupations by Sex
Within the Management, Business, Science and Arts occupations in Atlanta, the most male-oriented occupations are Business & Financial (91.7%), Computers, Engineering & Science (47.4%), and Computers & Mathematics (47.4%), while the most female-oriented occupations are Arts, Media & Entertainment (100.0%), Health Diagnosing & Treating (100.0%), and Health Technologists (100.0%).
| Occupation | Male | Female |
| Management | 4 (30.8%) | 9 (69.2%) |
| Business & Financial | 11 (91.7%) | 1 (8.3%) |
| Computers, Engineering & Science | 9 (47.4%) | 10 (52.6%) |
| Computers & Mathematics | 9 (47.4%) | 10 (52.6%) |
| Architecture & Engineering | 0 (0.0%) | 0 (0.0%) |
| Life, Physical & Social Science | 0 (0.0%) | 0 (0.0%) |
| Community & Social Service | 4 (30.8%) | 9 (69.2%) |
| Education, Arts & Media | 2 (40.0%) | 3 (60.0%) |
| Legal Services & Support | 0 (0.0%) | 0 (0.0%) |
| Education Instruction & Library | 2 (33.3%) | 4 (66.7%) |
| Arts, Media & Entertainment | 0 (0.0%) | 2 (100.0%) |
| Health Diagnosing & Treating | 0 (0.0%) | 4 (100.0%) |
| Health Technologists | 0 (0.0%) | 2 (100.0%) |
| Total (Category) | 28 (45.9%) | 33 (54.1%) |
| Total (Overall) | 189 (60.4%) | 124 (39.6%) |
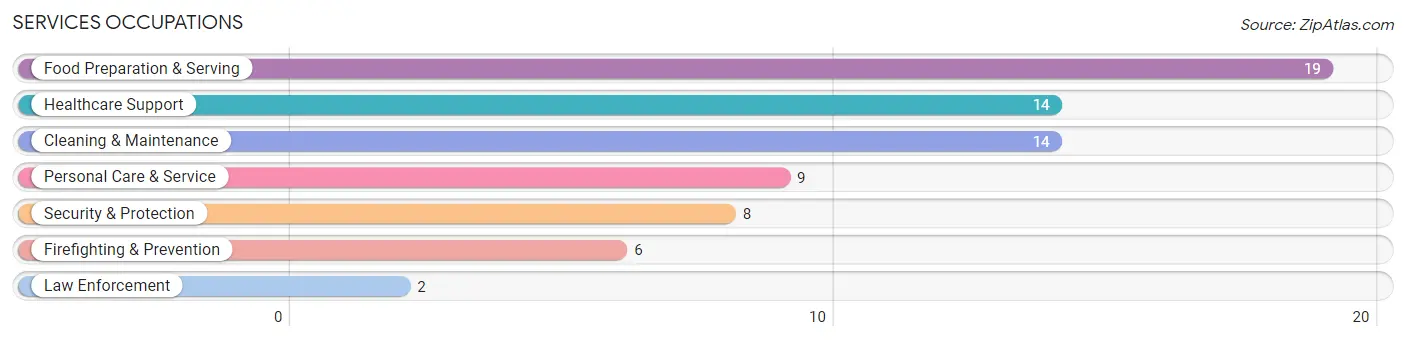
Services Occupations
The most common Services occupations in Atlanta are Food Preparation & Serving (19 | 6.1%), Healthcare Support (14 | 4.5%), Cleaning & Maintenance (14 | 4.5%), Personal Care & Service (9 | 2.9%), and Security & Protection (8 | 2.6%).
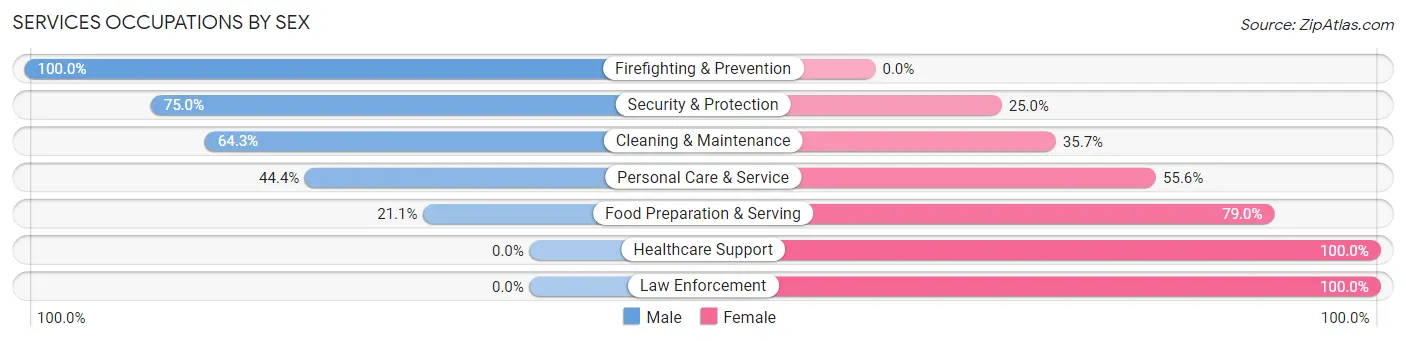
Services Occupations by Sex
Within the Services occupations in Atlanta, the most male-oriented occupations are Firefighting & Prevention (100.0%), Security & Protection (75.0%), and Cleaning & Maintenance (64.3%), while the most female-oriented occupations are Healthcare Support (100.0%), Law Enforcement (100.0%), and Food Preparation & Serving (78.9%).
| Occupation | Male | Female |
| Healthcare Support | 0 (0.0%) | 14 (100.0%) |
| Security & Protection | 6 (75.0%) | 2 (25.0%) |
| Firefighting & Prevention | 6 (100.0%) | 0 (0.0%) |
| Law Enforcement | 0 (0.0%) | 2 (100.0%) |
| Food Preparation & Serving | 4 (21.0%) | 15 (78.9%) |
| Cleaning & Maintenance | 9 (64.3%) | 5 (35.7%) |
| Personal Care & Service | 4 (44.4%) | 5 (55.6%) |
| Total (Category) | 23 (35.9%) | 41 (64.1%) |
| Total (Overall) | 189 (60.4%) | 124 (39.6%) |
Sales and Office Occupations
The most common Sales and Office occupations in Atlanta are Office & Administration (49 | 15.7%), and Sales & Related (18 | 5.8%).
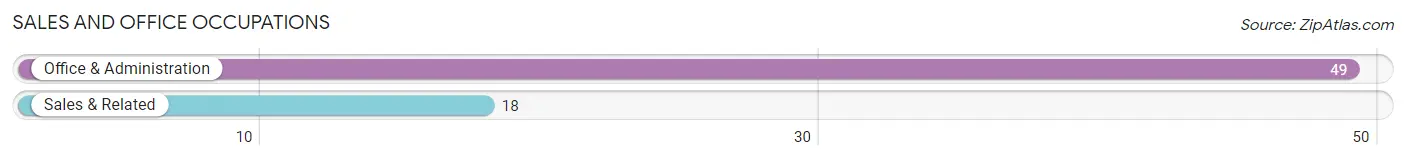
Sales and Office Occupations by Sex
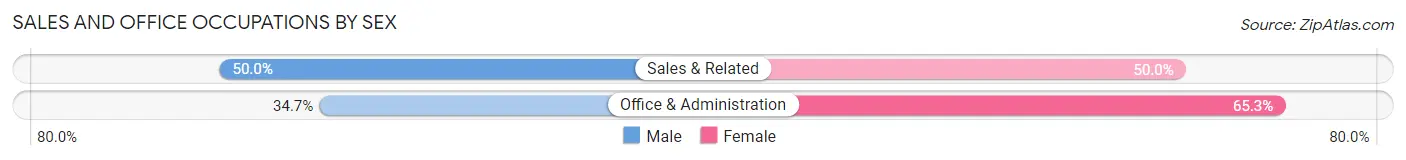
| Occupation | Male | Female |
| Sales & Related | 9 (50.0%) | 9 (50.0%) |
| Office & Administration | 17 (34.7%) | 32 (65.3%) |
| Total (Category) | 26 (38.8%) | 41 (61.2%) |
| Total (Overall) | 189 (60.4%) | 124 (39.6%) |
Natural Resources, Construction and Maintenance Occupations
The most common Natural Resources, Construction and Maintenance occupations in Atlanta are Construction & Extraction (45 | 14.4%), and Installation, Maintenance & Repair (21 | 6.7%).
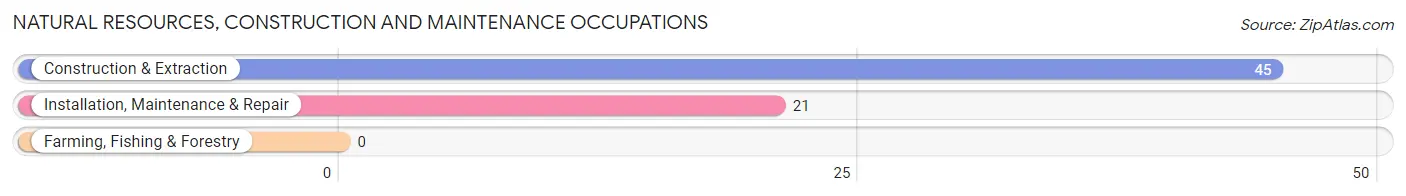
Natural Resources, Construction and Maintenance Occupations by Sex

| Occupation | Male | Female |
| Farming, Fishing & Forestry | 0 (0.0%) | 0 (0.0%) |
| Construction & Extraction | 45 (100.0%) | 0 (0.0%) |
| Installation, Maintenance & Repair | 21 (100.0%) | 0 (0.0%) |
| Total (Category) | 66 (100.0%) | 0 (0.0%) |
| Total (Overall) | 189 (60.4%) | 124 (39.6%) |
Production, Transportation and Moving Occupations
The most common Production, Transportation and Moving occupations in Atlanta are Production (31 | 9.9%), Material Moving (19 | 6.1%), and Transportation (5 | 1.6%).
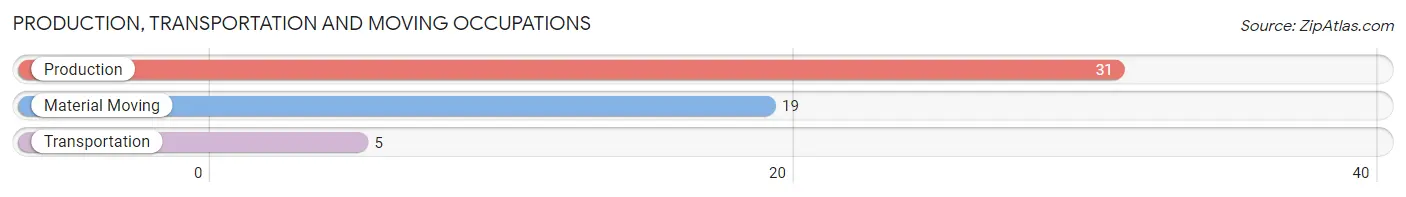
Production, Transportation and Moving Occupations by Sex
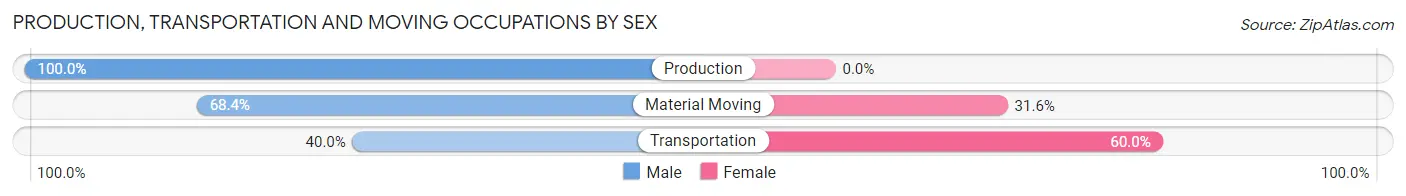
| Occupation | Male | Female |
| Production | 31 (100.0%) | 0 (0.0%) |
| Transportation | 2 (40.0%) | 3 (60.0%) |
| Material Moving | 13 (68.4%) | 6 (31.6%) |
| Total (Category) | 46 (83.6%) | 9 (16.4%) |
| Total (Overall) | 189 (60.4%) | 124 (39.6%) |
Employment Industries by Sex in Atlanta
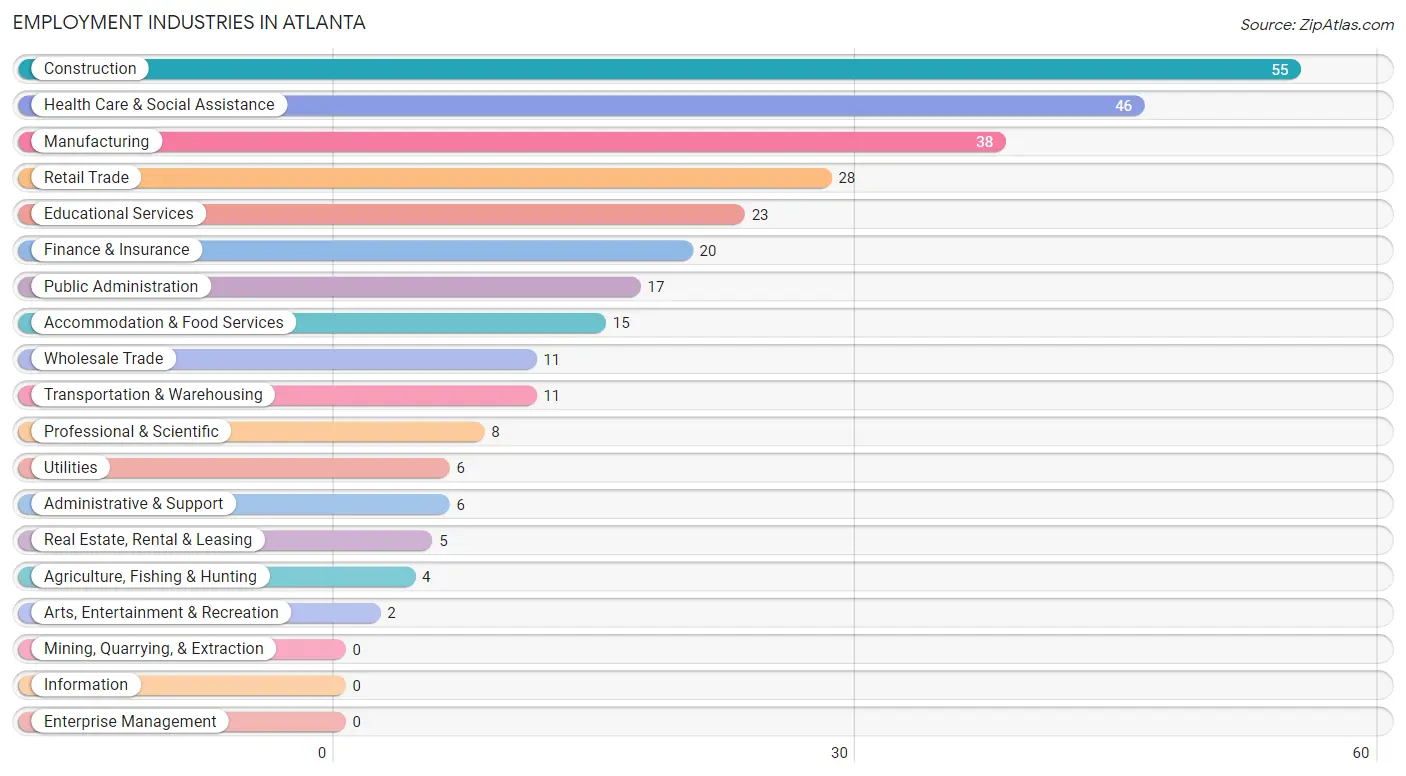
Employment Industries in Atlanta
The major employment industries in Atlanta include Construction (55 | 17.6%), Health Care & Social Assistance (46 | 14.7%), Manufacturing (38 | 12.1%), Retail Trade (28 | 8.9%), and Educational Services (23 | 7.3%).
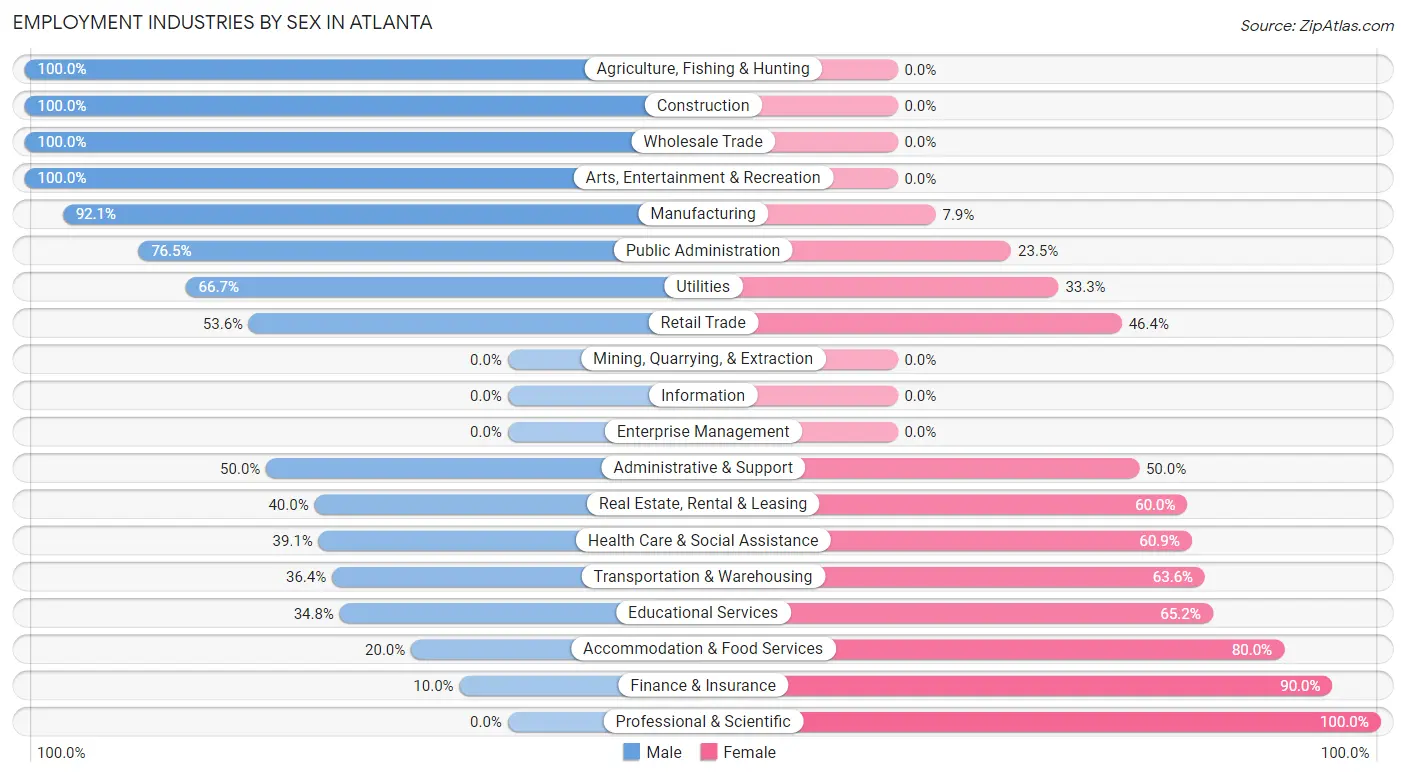
Employment Industries by Sex in Atlanta
The Atlanta industries that see more men than women are Agriculture, Fishing & Hunting (100.0%), Construction (100.0%), and Wholesale Trade (100.0%), whereas the industries that tend to have a higher number of women are Professional & Scientific (100.0%), Finance & Insurance (90.0%), and Accommodation & Food Services (80.0%).
| Industry | Male | Female |
| Agriculture, Fishing & Hunting | 4 (100.0%) | 0 (0.0%) |
| Mining, Quarrying, & Extraction | 0 (0.0%) | 0 (0.0%) |
| Construction | 55 (100.0%) | 0 (0.0%) |
| Manufacturing | 35 (92.1%) | 3 (7.9%) |
| Wholesale Trade | 11 (100.0%) | 0 (0.0%) |
| Retail Trade | 15 (53.6%) | 13 (46.4%) |
| Transportation & Warehousing | 4 (36.4%) | 7 (63.6%) |
| Utilities | 4 (66.7%) | 2 (33.3%) |
| Information | 0 (0.0%) | 0 (0.0%) |
| Finance & Insurance | 2 (10.0%) | 18 (90.0%) |
| Real Estate, Rental & Leasing | 2 (40.0%) | 3 (60.0%) |
| Professional & Scientific | 0 (0.0%) | 8 (100.0%) |
| Enterprise Management | 0 (0.0%) | 0 (0.0%) |
| Administrative & Support | 3 (50.0%) | 3 (50.0%) |
| Educational Services | 8 (34.8%) | 15 (65.2%) |
| Health Care & Social Assistance | 18 (39.1%) | 28 (60.9%) |
| Arts, Entertainment & Recreation | 2 (100.0%) | 0 (0.0%) |
| Accommodation & Food Services | 3 (20.0%) | 12 (80.0%) |
| Public Administration | 13 (76.5%) | 4 (23.5%) |
| Total | 189 (60.4%) | 124 (39.6%) |
Education in Atlanta
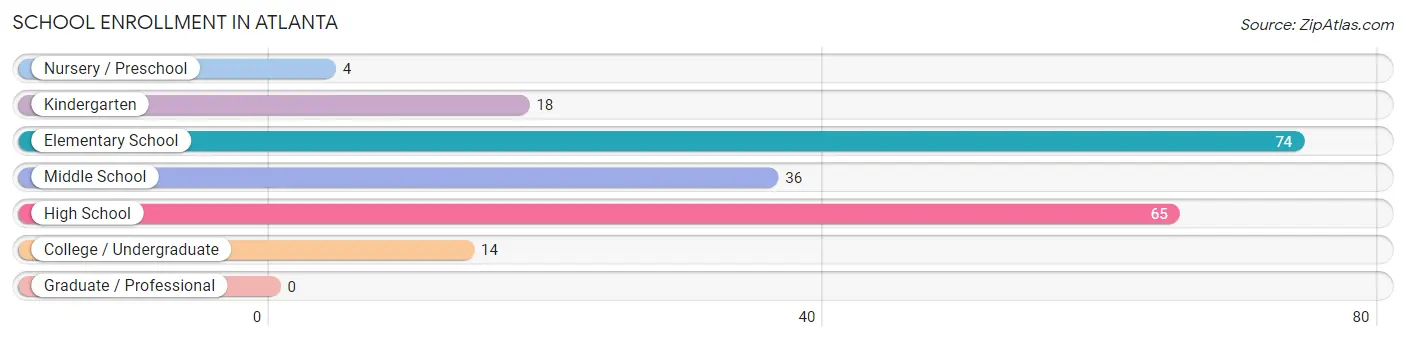
School Enrollment in Atlanta
The most common levels of schooling among the 211 students in Atlanta are elementary school (74 | 35.1%), high school (65 | 30.8%), and middle school (36 | 17.1%).
| School Level | # Students | % Students |
| Nursery / Preschool | 4 | 1.9% |
| Kindergarten | 18 | 8.5% |
| Elementary School | 74 | 35.1% |
| Middle School | 36 | 17.1% |
| High School | 65 | 30.8% |
| College / Undergraduate | 14 | 6.6% |
| Graduate / Professional | 0 | 0.0% |
| Total | 211 | 100.0% |
School Enrollment by Age by Funding Source in Atlanta
Out of a total of 211 students who are enrolled in schools in Atlanta, 22 (10.4%) attend a private institution, while the remaining 189 (89.6%) are enrolled in public schools. The age group of 10 to 14 year olds has the highest likelihood of being enrolled in private schools, with 9 (16.7% in the age bracket) enrolled. Conversely, the age group of 18 to 19 year olds has the lowest likelihood of being enrolled in a private school, with 13 (100.0% in the age bracket) attending a public institution.
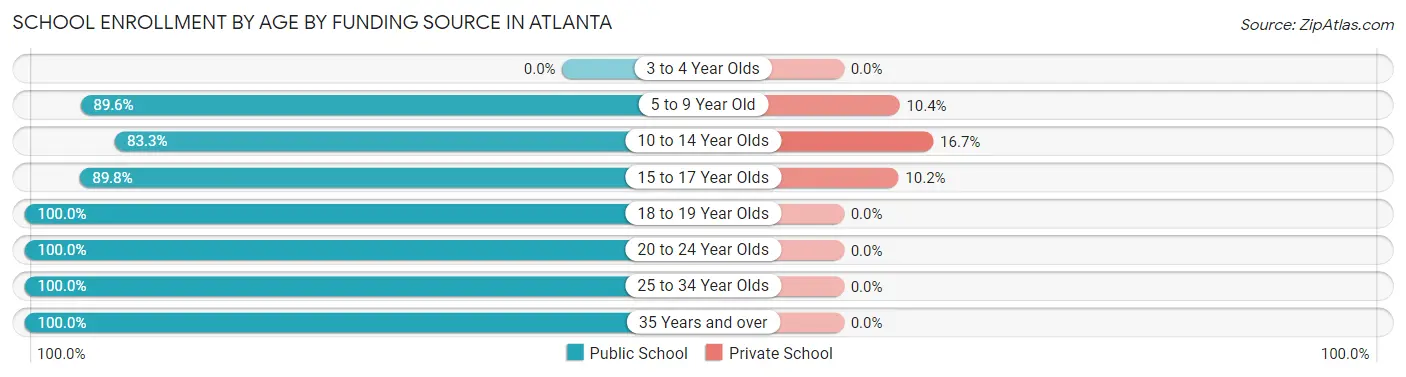
| Age Bracket | Public School | Private School |
| 3 to 4 Year Olds | 0 (0.0%) | 0 (0.0%) |
| 5 to 9 Year Old | 69 (89.6%) | 8 (10.4%) |
| 10 to 14 Year Olds | 45 (83.3%) | 9 (16.7%) |
| 15 to 17 Year Olds | 44 (89.8%) | 5 (10.2%) |
| 18 to 19 Year Olds | 13 (100.0%) | 0 (0.0%) |
| 20 to 24 Year Olds | 5 (100.0%) | 0 (0.0%) |
| 25 to 34 Year Olds | 6 (100.0%) | 0 (0.0%) |
| 35 Years and over | 7 (100.0%) | 0 (0.0%) |
| Total | 189 (89.6%) | 22 (10.4%) |
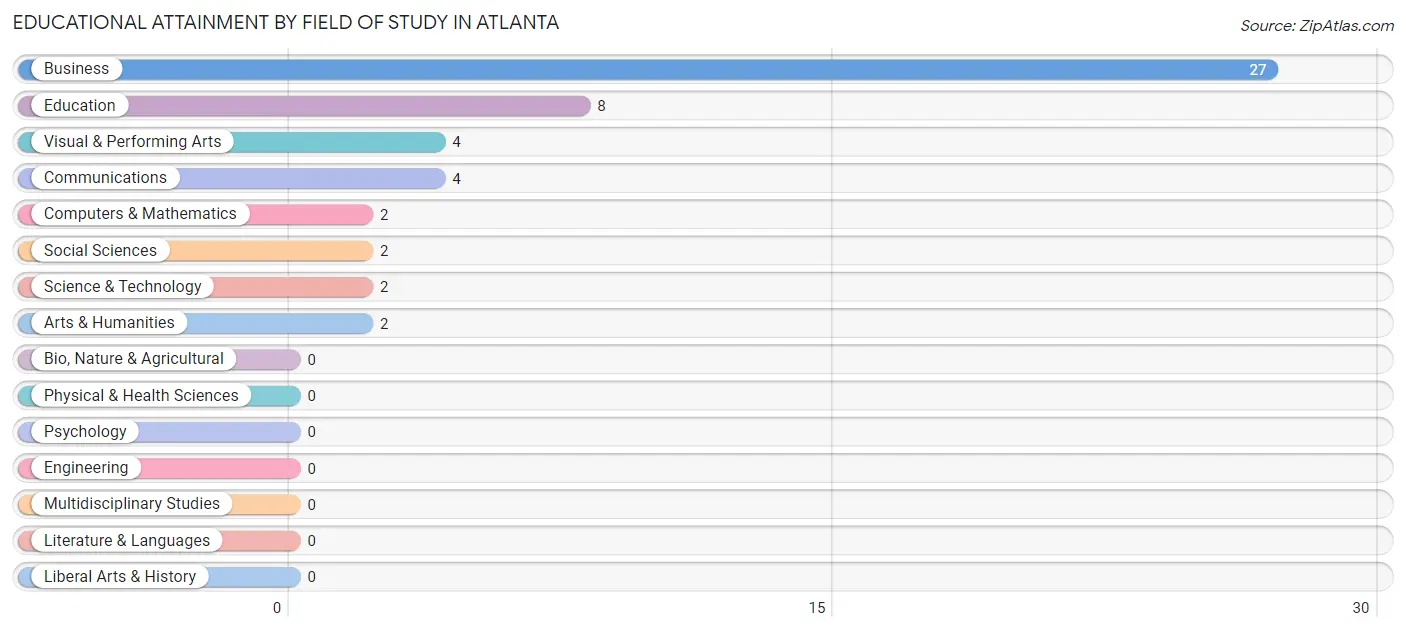
Educational Attainment by Field of Study in Atlanta
Business (27 | 52.9%), education (8 | 15.7%), visual & performing arts (4 | 7.8%), communications (4 | 7.8%), and computers & mathematics (2 | 3.9%) are the most common fields of study among 51 individuals in Atlanta who have obtained a bachelor's degree or higher.
| Field of Study | # Graduates | % Graduates |
| Computers & Mathematics | 2 | 3.9% |
| Bio, Nature & Agricultural | 0 | 0.0% |
| Physical & Health Sciences | 0 | 0.0% |
| Psychology | 0 | 0.0% |
| Social Sciences | 2 | 3.9% |
| Engineering | 0 | 0.0% |
| Multidisciplinary Studies | 0 | 0.0% |
| Science & Technology | 2 | 3.9% |
| Business | 27 | 52.9% |
| Education | 8 | 15.7% |
| Literature & Languages | 0 | 0.0% |
| Liberal Arts & History | 0 | 0.0% |
| Visual & Performing Arts | 4 | 7.8% |
| Communications | 4 | 7.8% |
| Arts & Humanities | 2 | 3.9% |
| Total | 51 | 100.0% |
Transportation & Commute in Atlanta
Vehicle Availability by Sex in Atlanta
The most prevalent vehicle ownership categories in Atlanta are males with 2 vehicles (73, accounting for 38.2%) and females with 2 vehicles (48, making up 58.9%).
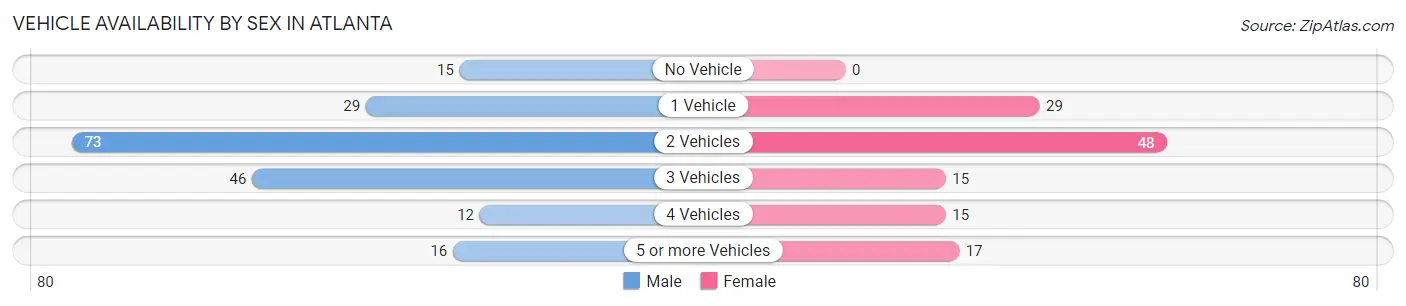
| Vehicles Available | Male | Female |
| No Vehicle | 15 (7.9%) | 0 (0.0%) |
| 1 Vehicle | 29 (15.2%) | 29 (23.4%) |
| 2 Vehicles | 73 (38.2%) | 48 (38.7%) |
| 3 Vehicles | 46 (24.1%) | 15 (12.1%) |
| 4 Vehicles | 12 (6.3%) | 15 (12.1%) |
| 5 or more Vehicles | 16 (8.4%) | 17 (13.7%) |
| Total | 191 (100.0%) | 124 (100.0%) |
Commute Time in Atlanta
The most frequently occuring commute durations in Atlanta are 30 to 34 minutes (71 commuters, 23.9%), 15 to 19 minutes (39 commuters, 13.1%), and 10 to 14 minutes (34 commuters, 11.5%).
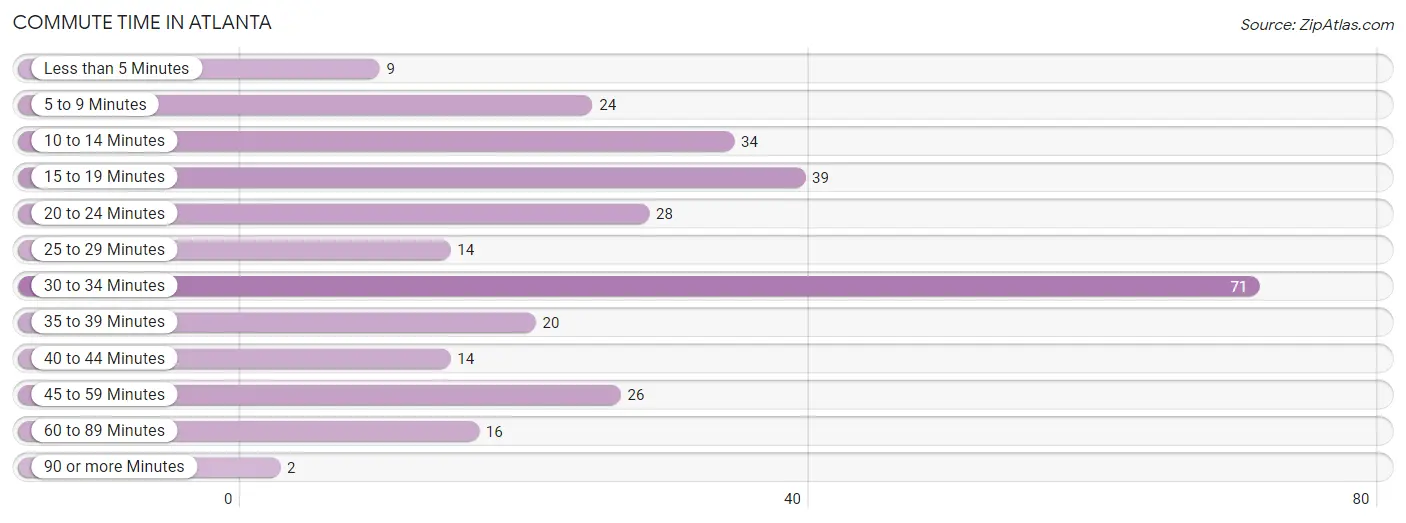
| Commute Time | # Commuters | % Commuters |
| Less than 5 Minutes | 9 | 3.0% |
| 5 to 9 Minutes | 24 | 8.1% |
| 10 to 14 Minutes | 34 | 11.5% |
| 15 to 19 Minutes | 39 | 13.1% |
| 20 to 24 Minutes | 28 | 9.4% |
| 25 to 29 Minutes | 14 | 4.7% |
| 30 to 34 Minutes | 71 | 23.9% |
| 35 to 39 Minutes | 20 | 6.7% |
| 40 to 44 Minutes | 14 | 4.7% |
| 45 to 59 Minutes | 26 | 8.7% |
| 60 to 89 Minutes | 16 | 5.4% |
| 90 or more Minutes | 2 | 0.7% |
Commute Time by Sex in Atlanta
The most common commute times in Atlanta are 30 to 34 minutes (44 commuters, 23.0%) for males and 30 to 34 minutes (27 commuters, 25.5%) for females.
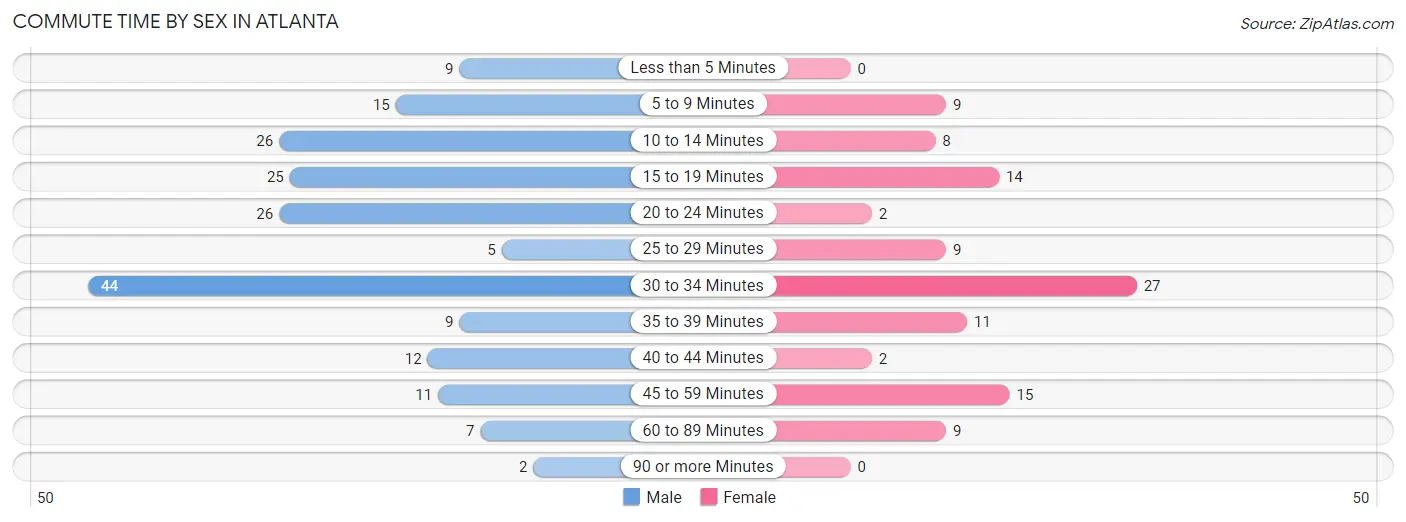
| Commute Time | Male | Female |
| Less than 5 Minutes | 9 (4.7%) | 0 (0.0%) |
| 5 to 9 Minutes | 15 (7.9%) | 9 (8.5%) |
| 10 to 14 Minutes | 26 (13.6%) | 8 (7.5%) |
| 15 to 19 Minutes | 25 (13.1%) | 14 (13.2%) |
| 20 to 24 Minutes | 26 (13.6%) | 2 (1.9%) |
| 25 to 29 Minutes | 5 (2.6%) | 9 (8.5%) |
| 30 to 34 Minutes | 44 (23.0%) | 27 (25.5%) |
| 35 to 39 Minutes | 9 (4.7%) | 11 (10.4%) |
| 40 to 44 Minutes | 12 (6.3%) | 2 (1.9%) |
| 45 to 59 Minutes | 11 (5.8%) | 15 (14.1%) |
| 60 to 89 Minutes | 7 (3.7%) | 9 (8.5%) |
| 90 or more Minutes | 2 (1.1%) | 0 (0.0%) |
Time of Departure to Work by Sex in Atlanta
The most frequent times of departure to work in Atlanta are 7:00 AM to 7:29 AM (55, 28.8%) for males and 7:00 AM to 7:29 AM (18, 17.0%) for females.
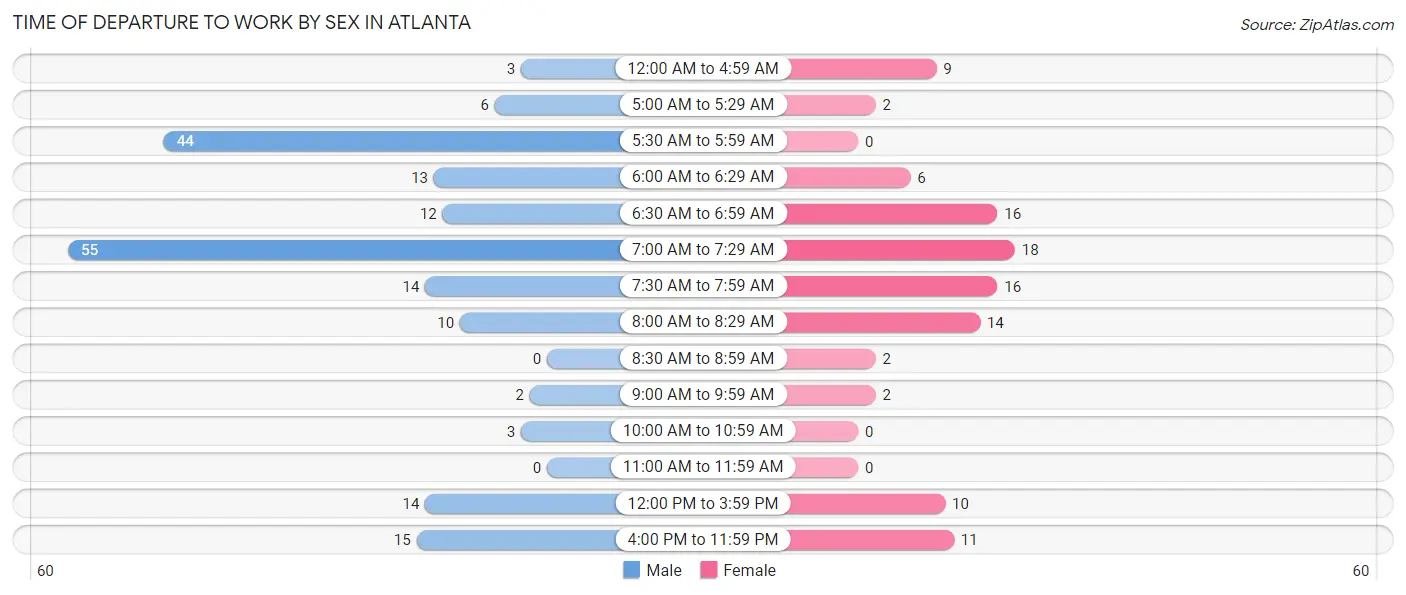
| Time of Departure | Male | Female |
| 12:00 AM to 4:59 AM | 3 (1.6%) | 9 (8.5%) |
| 5:00 AM to 5:29 AM | 6 (3.1%) | 2 (1.9%) |
| 5:30 AM to 5:59 AM | 44 (23.0%) | 0 (0.0%) |
| 6:00 AM to 6:29 AM | 13 (6.8%) | 6 (5.7%) |
| 6:30 AM to 6:59 AM | 12 (6.3%) | 16 (15.1%) |
| 7:00 AM to 7:29 AM | 55 (28.8%) | 18 (17.0%) |
| 7:30 AM to 7:59 AM | 14 (7.3%) | 16 (15.1%) |
| 8:00 AM to 8:29 AM | 10 (5.2%) | 14 (13.2%) |
| 8:30 AM to 8:59 AM | 0 (0.0%) | 2 (1.9%) |
| 9:00 AM to 9:59 AM | 2 (1.1%) | 2 (1.9%) |
| 10:00 AM to 10:59 AM | 3 (1.6%) | 0 (0.0%) |
| 11:00 AM to 11:59 AM | 0 (0.0%) | 0 (0.0%) |
| 12:00 PM to 3:59 PM | 14 (7.3%) | 10 (9.4%) |
| 4:00 PM to 11:59 PM | 15 (7.9%) | 11 (10.4%) |
| Total | 191 (100.0%) | 106 (100.0%) |
Housing Occupancy in Atlanta
Occupancy by Ownership in Atlanta
Of the total 281 dwellings in Atlanta, owner-occupied units account for 247 (87.9%), while renter-occupied units make up 34 (12.1%).
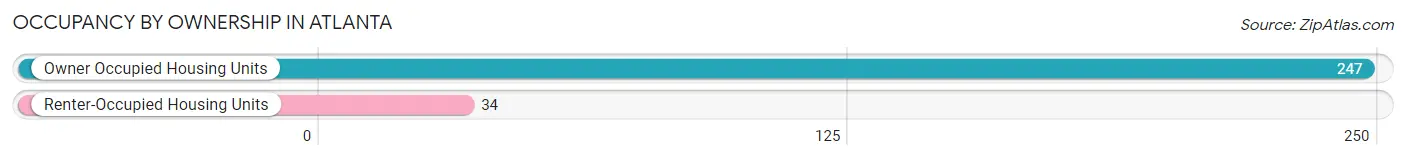
| Occupancy | # Housing Units | % Housing Units |
| Owner Occupied Housing Units | 247 | 87.9% |
| Renter-Occupied Housing Units | 34 | 12.1% |
| Total Occupied Housing Units | 281 | 100.0% |
Occupancy by Household Size in Atlanta
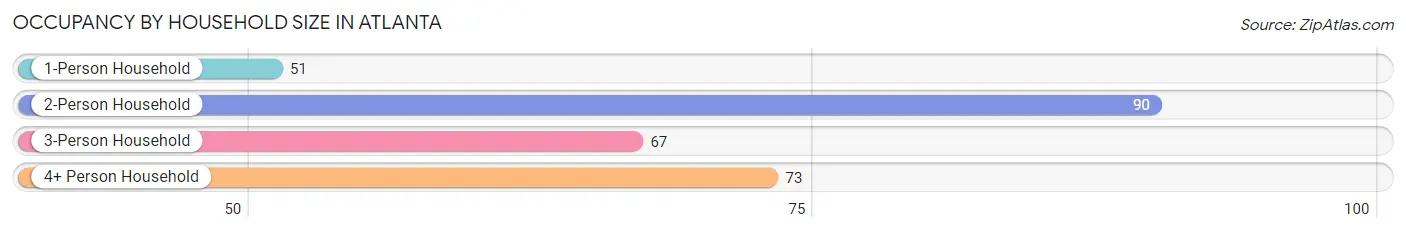
| Household Size | # Housing Units | % Housing Units |
| 1-Person Household | 51 | 18.1% |
| 2-Person Household | 90 | 32.0% |
| 3-Person Household | 67 | 23.8% |
| 4+ Person Household | 73 | 26.0% |
| Total Housing Units | 281 | 100.0% |
Occupancy by Ownership by Household Size in Atlanta
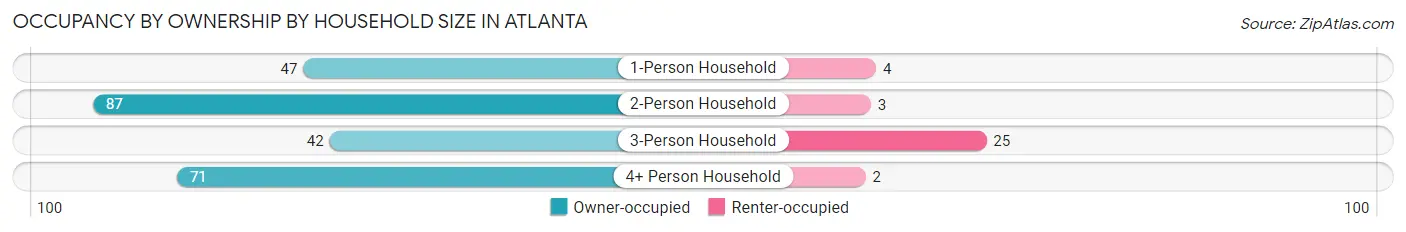
| Household Size | Owner-occupied | Renter-occupied |
| 1-Person Household | 47 (92.2%) | 4 (7.8%) |
| 2-Person Household | 87 (96.7%) | 3 (3.3%) |
| 3-Person Household | 42 (62.7%) | 25 (37.3%) |
| 4+ Person Household | 71 (97.3%) | 2 (2.7%) |
| Total Housing Units | 247 (87.9%) | 34 (12.1%) |
Occupancy by Educational Attainment in Atlanta
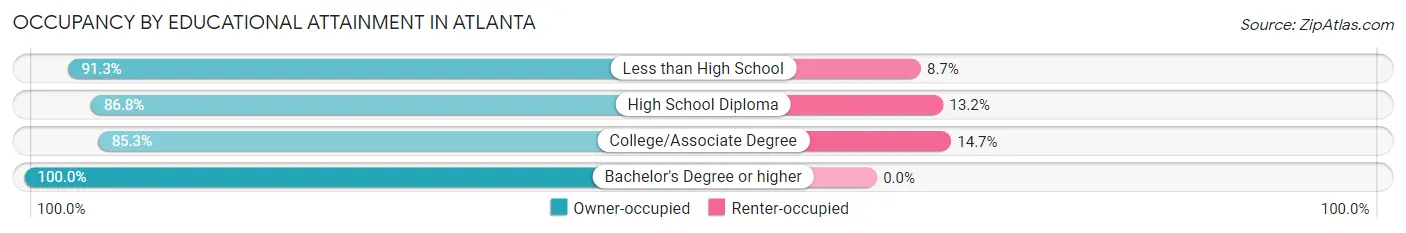
| Household Size | Owner-occupied | Renter-occupied |
| Less than High School | 42 (91.3%) | 4 (8.7%) |
| High School Diploma | 99 (86.8%) | 15 (13.2%) |
| College/Associate Degree | 87 (85.3%) | 15 (14.7%) |
| Bachelor's Degree or higher | 19 (100.0%) | 0 (0.0%) |
Occupancy by Age of Householder in Atlanta
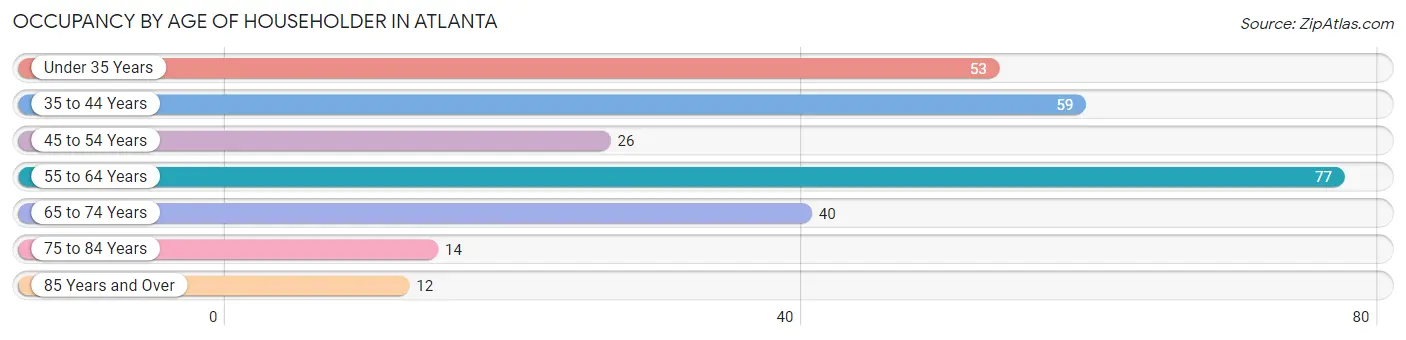
| Age Bracket | # Households | % Households |
| Under 35 Years | 53 | 18.9% |
| 35 to 44 Years | 59 | 21.0% |
| 45 to 54 Years | 26 | 9.2% |
| 55 to 64 Years | 77 | 27.4% |
| 65 to 74 Years | 40 | 14.2% |
| 75 to 84 Years | 14 | 5.0% |
| 85 Years and Over | 12 | 4.3% |
| Total | 281 | 100.0% |
Housing Finances in Atlanta
Median Income by Occupancy in Atlanta
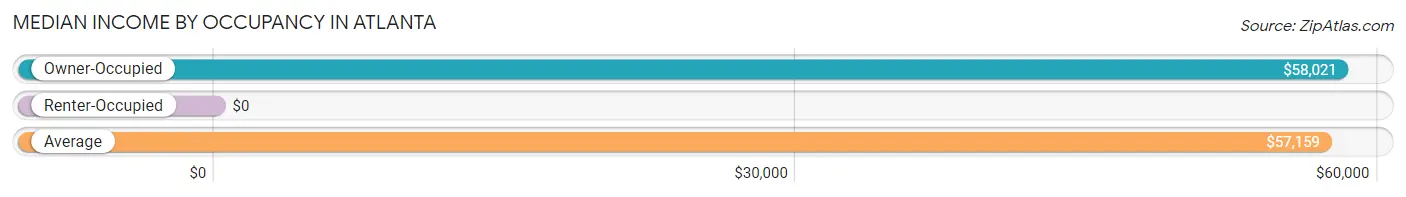
| Occupancy Type | # Households | Median Income |
| Owner-Occupied | 247 (87.9%) | $58,021 |
| Renter-Occupied | 34 (12.1%) | $0 |
| Average | 281 (100.0%) | $57,159 |
Occupancy by Householder Income Bracket in Atlanta
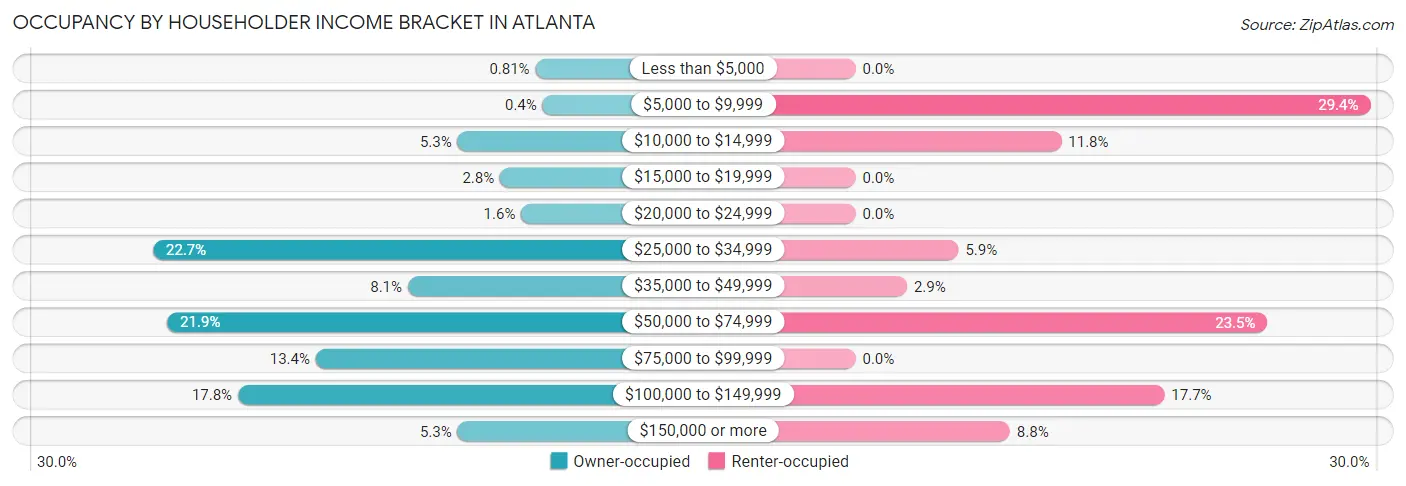
| Income Bracket | Owner-occupied | Renter-occupied |
| Less than $5,000 | 2 (0.8%) | 0 (0.0%) |
| $5,000 to $9,999 | 1 (0.4%) | 10 (29.4%) |
| $10,000 to $14,999 | 13 (5.3%) | 4 (11.8%) |
| $15,000 to $19,999 | 7 (2.8%) | 0 (0.0%) |
| $20,000 to $24,999 | 4 (1.6%) | 0 (0.0%) |
| $25,000 to $34,999 | 56 (22.7%) | 2 (5.9%) |
| $35,000 to $49,999 | 20 (8.1%) | 1 (2.9%) |
| $50,000 to $74,999 | 54 (21.9%) | 8 (23.5%) |
| $75,000 to $99,999 | 33 (13.4%) | 0 (0.0%) |
| $100,000 to $149,999 | 44 (17.8%) | 6 (17.6%) |
| $150,000 or more | 13 (5.3%) | 3 (8.8%) |
| Total | 247 (100.0%) | 34 (100.0%) |
Monthly Housing Cost Tiers in Atlanta
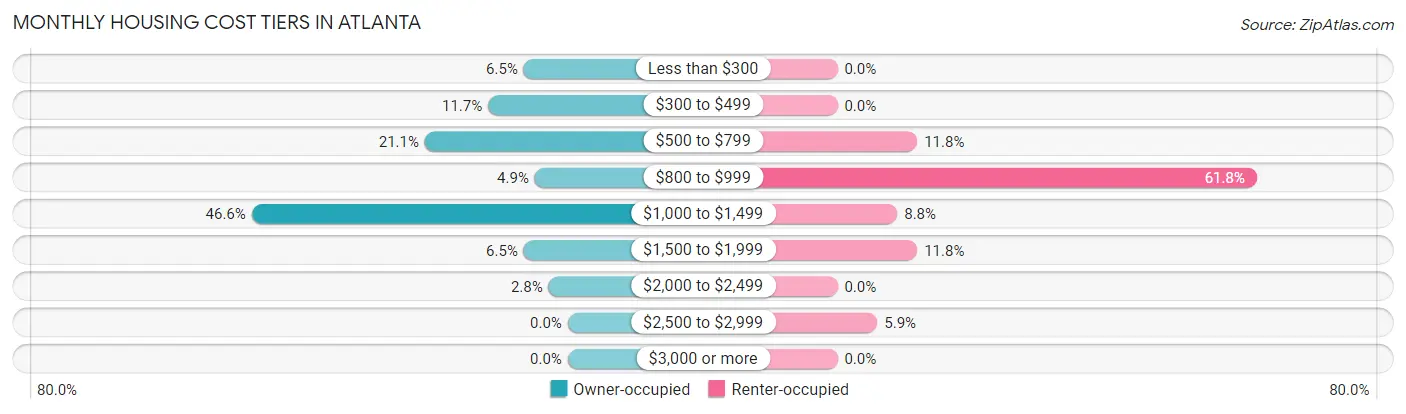
| Monthly Cost | Owner-occupied | Renter-occupied |
| Less than $300 | 16 (6.5%) | 0 (0.0%) |
| $300 to $499 | 29 (11.7%) | 0 (0.0%) |
| $500 to $799 | 52 (21.0%) | 4 (11.8%) |
| $800 to $999 | 12 (4.9%) | 21 (61.8%) |
| $1,000 to $1,499 | 115 (46.6%) | 3 (8.8%) |
| $1,500 to $1,999 | 16 (6.5%) | 4 (11.8%) |
| $2,000 to $2,499 | 7 (2.8%) | 0 (0.0%) |
| $2,500 to $2,999 | 0 (0.0%) | 2 (5.9%) |
| $3,000 or more | 0 (0.0%) | 0 (0.0%) |
| Total | 247 (100.0%) | 34 (100.0%) |
Physical Housing Characteristics in Atlanta
Housing Structures in Atlanta
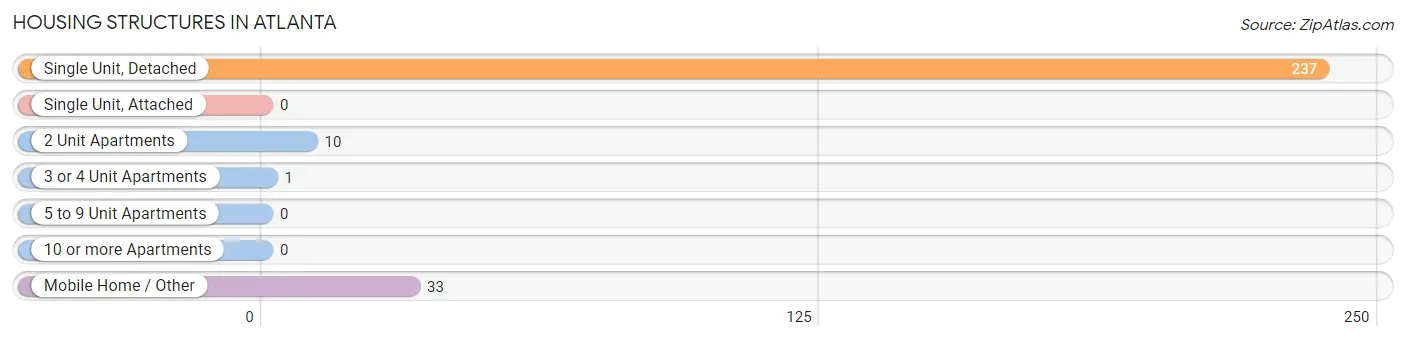
| Structure Type | # Housing Units | % Housing Units |
| Single Unit, Detached | 237 | 84.3% |
| Single Unit, Attached | 0 | 0.0% |
| 2 Unit Apartments | 10 | 3.6% |
| 3 or 4 Unit Apartments | 1 | 0.4% |
| 5 to 9 Unit Apartments | 0 | 0.0% |
| 10 or more Apartments | 0 | 0.0% |
| Mobile Home / Other | 33 | 11.7% |
| Total | 281 | 100.0% |
Housing Structures by Occupancy in Atlanta
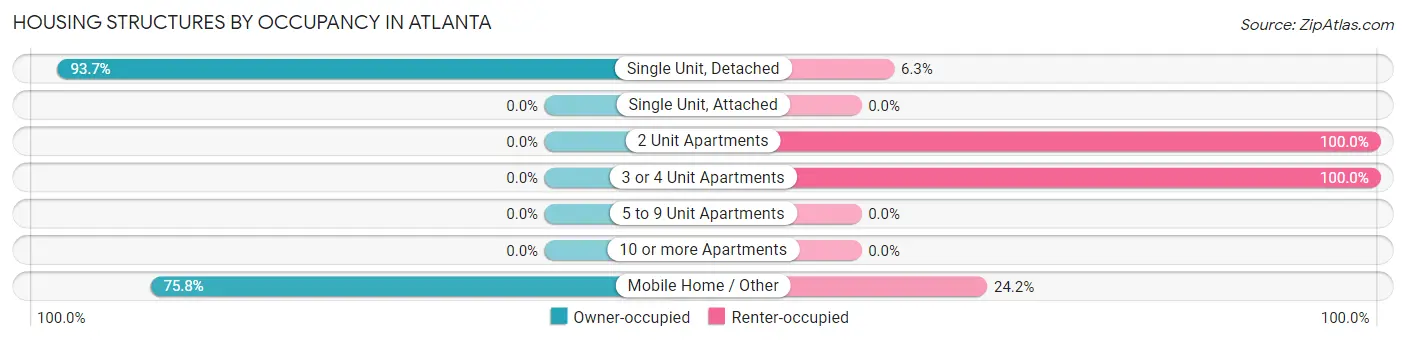
| Structure Type | Owner-occupied | Renter-occupied |
| Single Unit, Detached | 222 (93.7%) | 15 (6.3%) |
| Single Unit, Attached | 0 (0.0%) | 0 (0.0%) |
| 2 Unit Apartments | 0 (0.0%) | 10 (100.0%) |
| 3 or 4 Unit Apartments | 0 (0.0%) | 1 (100.0%) |
| 5 to 9 Unit Apartments | 0 (0.0%) | 0 (0.0%) |
| 10 or more Apartments | 0 (0.0%) | 0 (0.0%) |
| Mobile Home / Other | 25 (75.8%) | 8 (24.2%) |
| Total | 247 (87.9%) | 34 (12.1%) |
Housing Structures by Number of Rooms in Atlanta
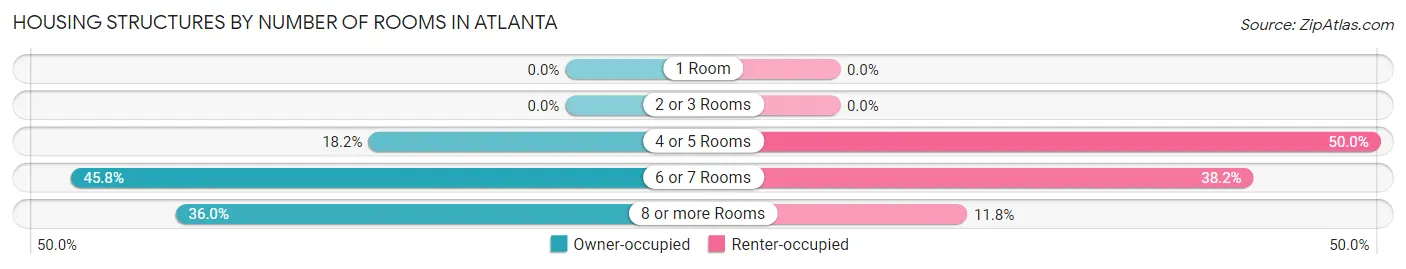
| Number of Rooms | Owner-occupied | Renter-occupied |
| 1 Room | 0 (0.0%) | 0 (0.0%) |
| 2 or 3 Rooms | 0 (0.0%) | 0 (0.0%) |
| 4 or 5 Rooms | 45 (18.2%) | 17 (50.0%) |
| 6 or 7 Rooms | 113 (45.8%) | 13 (38.2%) |
| 8 or more Rooms | 89 (36.0%) | 4 (11.8%) |
| Total | 247 (100.0%) | 34 (100.0%) |
Housing Structure by Heating Type in Atlanta
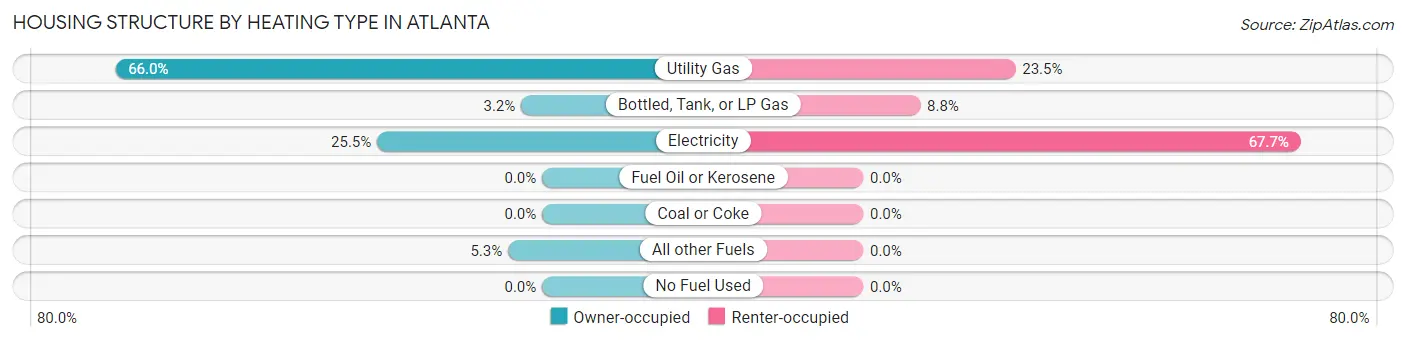
| Heating Type | Owner-occupied | Renter-occupied |
| Utility Gas | 163 (66.0%) | 8 (23.5%) |
| Bottled, Tank, or LP Gas | 8 (3.2%) | 3 (8.8%) |
| Electricity | 63 (25.5%) | 23 (67.6%) |
| Fuel Oil or Kerosene | 0 (0.0%) | 0 (0.0%) |
| Coal or Coke | 0 (0.0%) | 0 (0.0%) |
| All other Fuels | 13 (5.3%) | 0 (0.0%) |
| No Fuel Used | 0 (0.0%) | 0 (0.0%) |
| Total | 247 (100.0%) | 34 (100.0%) |
Household Vehicle Usage in Atlanta
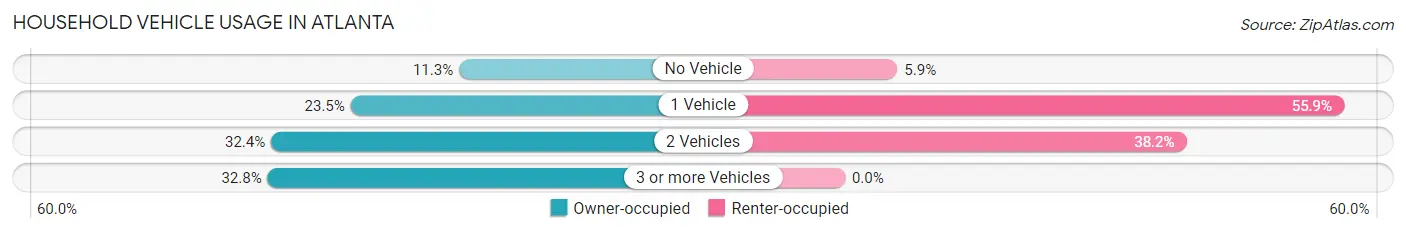
| Vehicles per Household | Owner-occupied | Renter-occupied |
| No Vehicle | 28 (11.3%) | 2 (5.9%) |
| 1 Vehicle | 58 (23.5%) | 19 (55.9%) |
| 2 Vehicles | 80 (32.4%) | 13 (38.2%) |
| 3 or more Vehicles | 81 (32.8%) | 0 (0.0%) |
| Total | 247 (100.0%) | 34 (100.0%) |
Real Estate & Mortgages in Atlanta
Real Estate and Mortgage Overview in Atlanta
| Characteristic | Without Mortgage | With Mortgage |
| Housing Units | 78 | 169 |
| Median Property Value | $86,200 | $120,900 |
| Median Household Income | $32,368 | $8 |
| Monthly Housing Costs | $478 | $0 |
| Real Estate Taxes | $558 | $2 |
Property Value by Mortgage Status in Atlanta
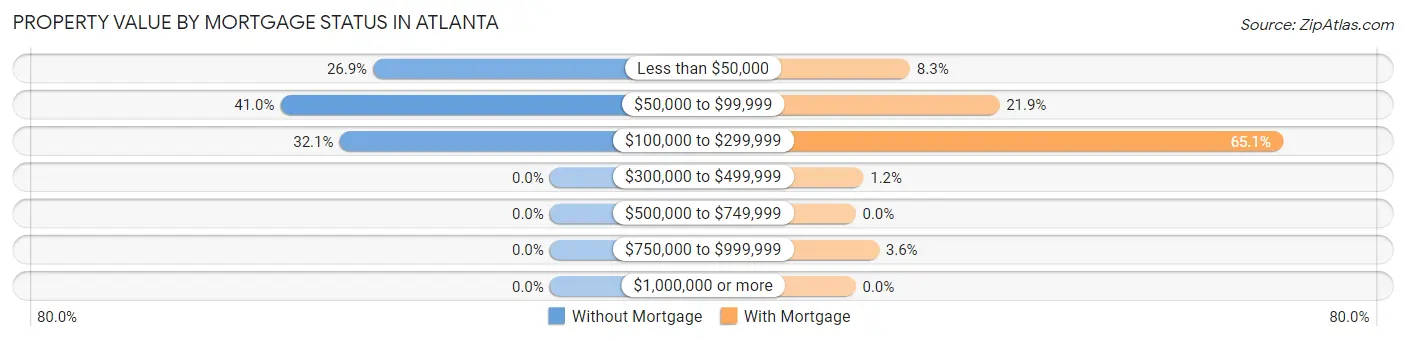
| Property Value | Without Mortgage | With Mortgage |
| Less than $50,000 | 21 (26.9%) | 14 (8.3%) |
| $50,000 to $99,999 | 32 (41.0%) | 37 (21.9%) |
| $100,000 to $299,999 | 25 (32.1%) | 110 (65.1%) |
| $300,000 to $499,999 | 0 (0.0%) | 2 (1.2%) |
| $500,000 to $749,999 | 0 (0.0%) | 0 (0.0%) |
| $750,000 to $999,999 | 0 (0.0%) | 6 (3.5%) |
| $1,000,000 or more | 0 (0.0%) | 0 (0.0%) |
| Total | 78 (100.0%) | 169 (100.0%) |
Household Income by Mortgage Status in Atlanta
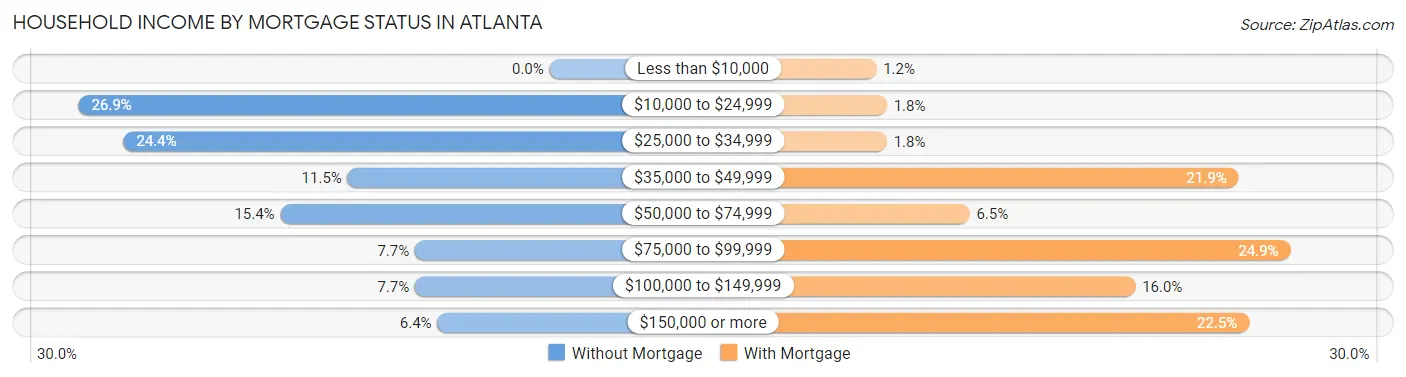
| Household Income | Without Mortgage | With Mortgage |
| Less than $10,000 | 0 (0.0%) | 2 (1.2%) |
| $10,000 to $24,999 | 21 (26.9%) | 3 (1.8%) |
| $25,000 to $34,999 | 19 (24.4%) | 3 (1.8%) |
| $35,000 to $49,999 | 9 (11.5%) | 37 (21.9%) |
| $50,000 to $74,999 | 12 (15.4%) | 11 (6.5%) |
| $75,000 to $99,999 | 6 (7.7%) | 42 (24.8%) |
| $100,000 to $149,999 | 6 (7.7%) | 27 (16.0%) |
| $150,000 or more | 5 (6.4%) | 38 (22.5%) |
| Total | 78 (100.0%) | 169 (100.0%) |
Property Value to Household Income Ratio in Atlanta
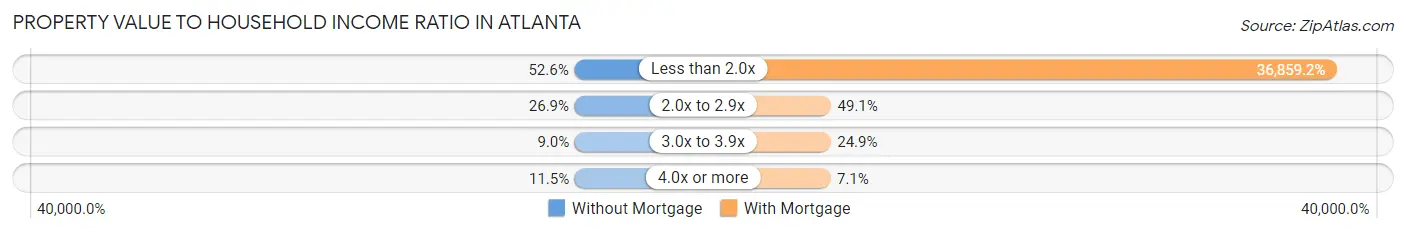
| Value-to-Income Ratio | Without Mortgage | With Mortgage |
| Less than 2.0x | 41 (52.6%) | 62,292 (36,859.2%) |
| 2.0x to 2.9x | 21 (26.9%) | 83 (49.1%) |
| 3.0x to 3.9x | 7 (9.0%) | 42 (24.8%) |
| 4.0x or more | 9 (11.5%) | 12 (7.1%) |
| Total | 78 (100.0%) | 169 (100.0%) |
Real Estate Taxes by Mortgage Status in Atlanta
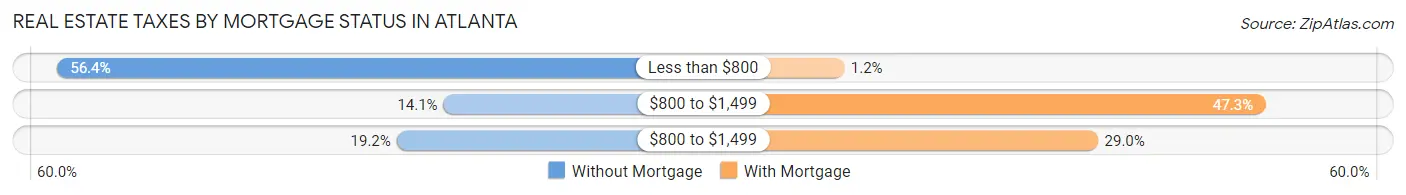
| Property Taxes | Without Mortgage | With Mortgage |
| Less than $800 | 44 (56.4%) | 2 (1.2%) |
| $800 to $1,499 | 11 (14.1%) | 80 (47.3%) |
| $800 to $1,499 | 15 (19.2%) | 49 (29.0%) |
| Total | 78 (100.0%) | 169 (100.0%) |
Health & Disability in Atlanta
Health Insurance Coverage by Age in Atlanta
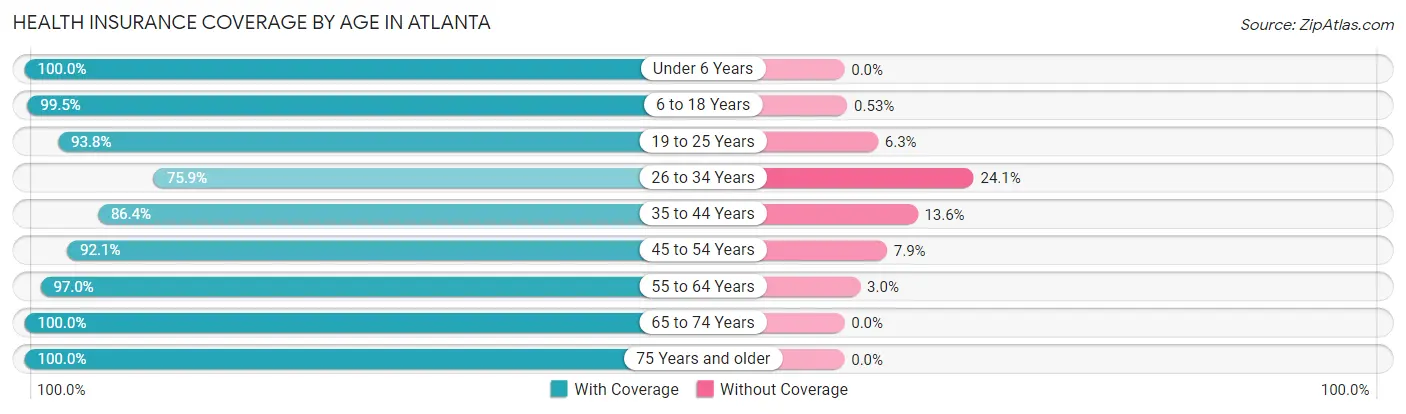
| Age Bracket | With Coverage | Without Coverage |
| Under 6 Years | 32 (100.0%) | 0 (0.0%) |
| 6 to 18 Years | 188 (99.5%) | 1 (0.5%) |
| 19 to 25 Years | 45 (93.8%) | 3 (6.2%) |
| 26 to 34 Years | 85 (75.9%) | 27 (24.1%) |
| 35 to 44 Years | 76 (86.4%) | 12 (13.6%) |
| 45 to 54 Years | 58 (92.1%) | 5 (7.9%) |
| 55 to 64 Years | 131 (97.0%) | 4 (3.0%) |
| 65 to 74 Years | 64 (100.0%) | 0 (0.0%) |
| 75 Years and older | 40 (100.0%) | 0 (0.0%) |
| Total | 719 (93.3%) | 52 (6.7%) |
Health Insurance Coverage by Citizenship Status in Atlanta

| Citizenship Status | With Coverage | Without Coverage |
| Native Born | 32 (100.0%) | 0 (0.0%) |
| Foreign Born, Citizen | 188 (99.5%) | 1 (0.5%) |
| Foreign Born, not a Citizen | 45 (93.8%) | 3 (6.2%) |
Health Insurance Coverage by Household Income in Atlanta
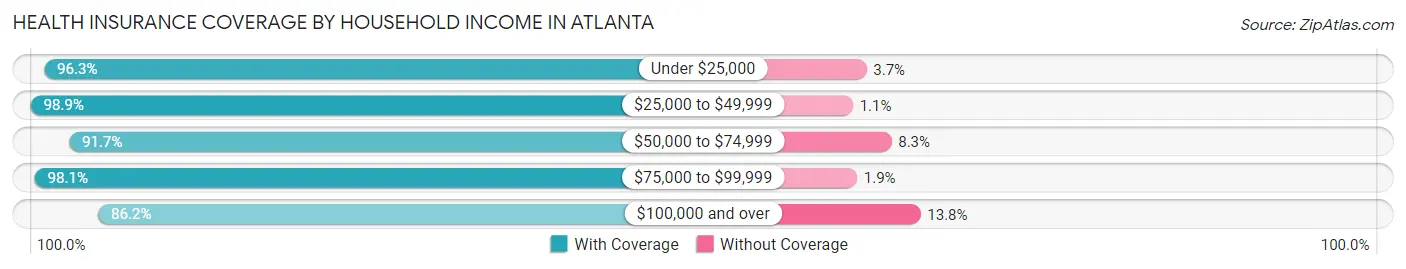
| Household Income | With Coverage | Without Coverage |
| Under $25,000 | 79 (96.3%) | 3 (3.7%) |
| $25,000 to $49,999 | 178 (98.9%) | 2 (1.1%) |
| $50,000 to $74,999 | 154 (91.7%) | 14 (8.3%) |
| $75,000 to $99,999 | 104 (98.1%) | 2 (1.9%) |
| $100,000 and over | 194 (86.2%) | 31 (13.8%) |
Public vs Private Health Insurance Coverage by Age in Atlanta
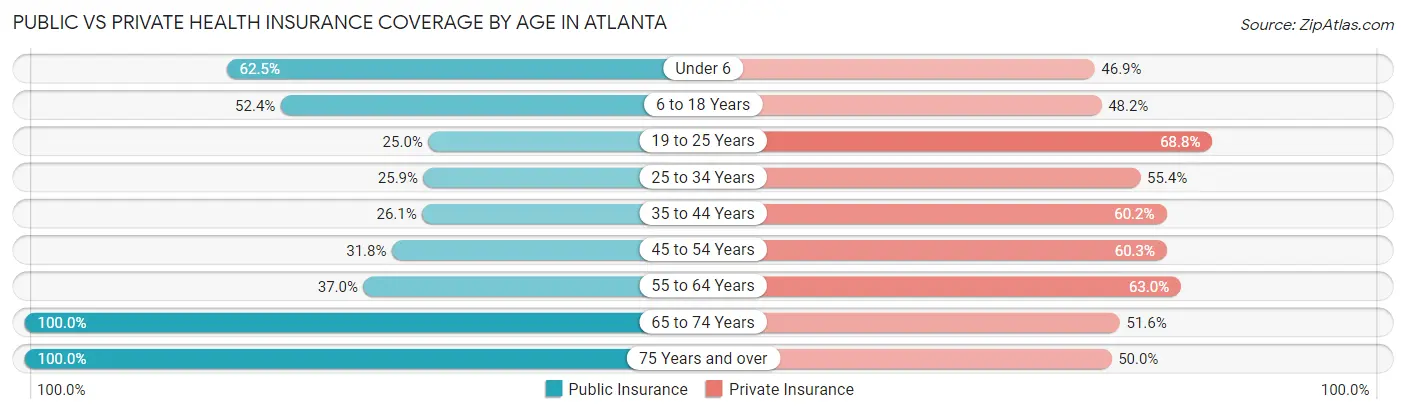
| Age Bracket | Public Insurance | Private Insurance |
| Under 6 | 20 (62.5%) | 15 (46.9%) |
| 6 to 18 Years | 99 (52.4%) | 91 (48.1%) |
| 19 to 25 Years | 12 (25.0%) | 33 (68.8%) |
| 25 to 34 Years | 29 (25.9%) | 62 (55.4%) |
| 35 to 44 Years | 23 (26.1%) | 53 (60.2%) |
| 45 to 54 Years | 20 (31.8%) | 38 (60.3%) |
| 55 to 64 Years | 50 (37.0%) | 85 (63.0%) |
| 65 to 74 Years | 64 (100.0%) | 33 (51.6%) |
| 75 Years and over | 40 (100.0%) | 20 (50.0%) |
| Total | 357 (46.3%) | 430 (55.8%) |
Disability Status by Sex by Age in Atlanta
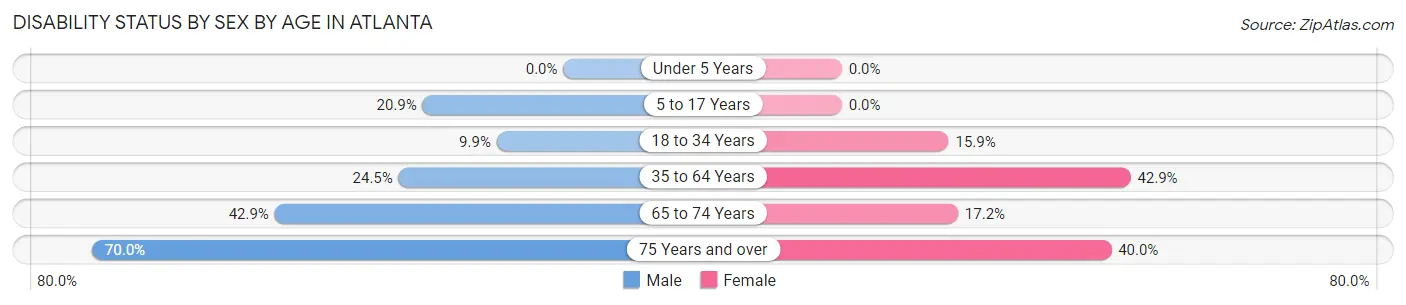
| Age Bracket | Male | Female |
| Under 5 Years | 0 (0.0%) | 0 (0.0%) |
| 5 to 17 Years | 14 (20.9%) | 0 (0.0%) |
| 18 to 34 Years | 9 (9.9%) | 13 (15.9%) |
| 35 to 64 Years | 34 (24.5%) | 63 (42.9%) |
| 65 to 74 Years | 15 (42.9%) | 5 (17.2%) |
| 75 Years and over | 14 (70.0%) | 8 (40.0%) |
Disability Class by Sex by Age in Atlanta
Disability Class: Hearing Difficulty
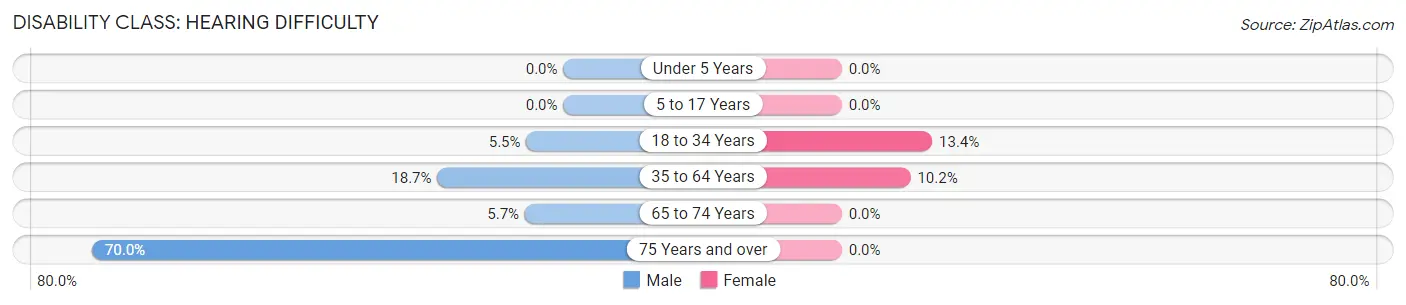
| Age Bracket | Male | Female |
| Under 5 Years | 0 (0.0%) | 0 (0.0%) |
| 5 to 17 Years | 0 (0.0%) | 0 (0.0%) |
| 18 to 34 Years | 5 (5.5%) | 11 (13.4%) |
| 35 to 64 Years | 26 (18.7%) | 15 (10.2%) |
| 65 to 74 Years | 2 (5.7%) | 0 (0.0%) |
| 75 Years and over | 14 (70.0%) | 0 (0.0%) |
Disability Class: Vision Difficulty
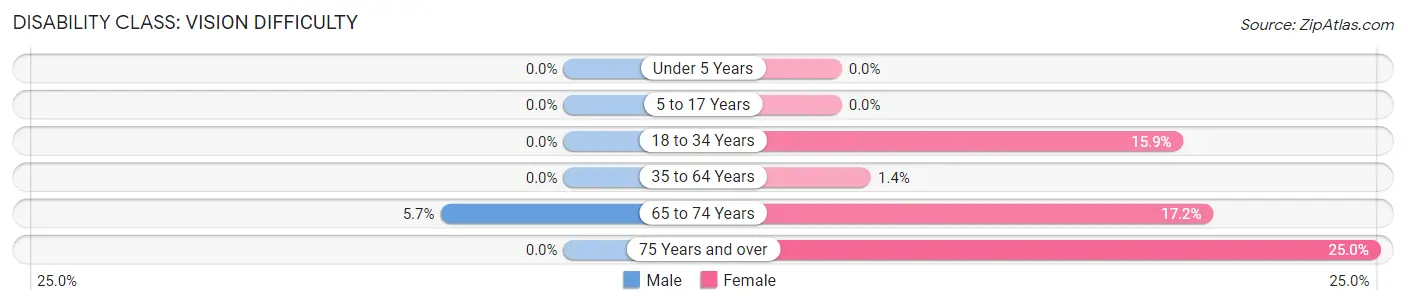
| Age Bracket | Male | Female |
| Under 5 Years | 0 (0.0%) | 0 (0.0%) |
| 5 to 17 Years | 0 (0.0%) | 0 (0.0%) |
| 18 to 34 Years | 0 (0.0%) | 13 (15.9%) |
| 35 to 64 Years | 0 (0.0%) | 2 (1.4%) |
| 65 to 74 Years | 2 (5.7%) | 5 (17.2%) |
| 75 Years and over | 0 (0.0%) | 5 (25.0%) |
Disability Class: Cognitive Difficulty
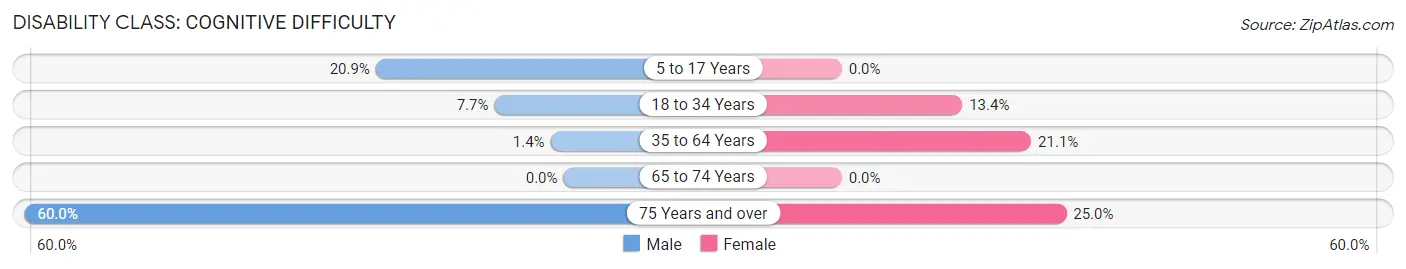
| Age Bracket | Male | Female |
| 5 to 17 Years | 14 (20.9%) | 0 (0.0%) |
| 18 to 34 Years | 7 (7.7%) | 11 (13.4%) |
| 35 to 64 Years | 2 (1.4%) | 31 (21.1%) |
| 65 to 74 Years | 0 (0.0%) | 0 (0.0%) |
| 75 Years and over | 12 (60.0%) | 5 (25.0%) |
Disability Class: Ambulatory Difficulty
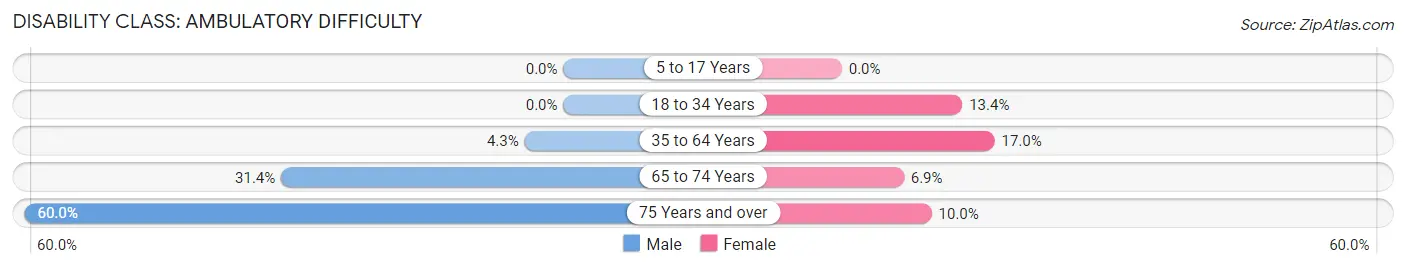
| Age Bracket | Male | Female |
| 5 to 17 Years | 0 (0.0%) | 0 (0.0%) |
| 18 to 34 Years | 0 (0.0%) | 11 (13.4%) |
| 35 to 64 Years | 6 (4.3%) | 25 (17.0%) |
| 65 to 74 Years | 11 (31.4%) | 2 (6.9%) |
| 75 Years and over | 12 (60.0%) | 2 (10.0%) |
Disability Class: Self-Care Difficulty
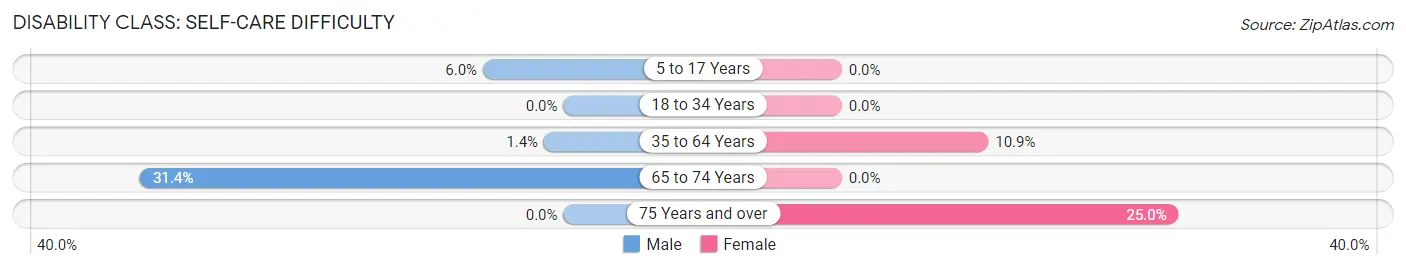
| Age Bracket | Male | Female |
| 5 to 17 Years | 4 (6.0%) | 0 (0.0%) |
| 18 to 34 Years | 0 (0.0%) | 0 (0.0%) |
| 35 to 64 Years | 2 (1.4%) | 16 (10.9%) |
| 65 to 74 Years | 11 (31.4%) | 0 (0.0%) |
| 75 Years and over | 0 (0.0%) | 5 (25.0%) |
Technology Access in Atlanta
Computing Device Access in Atlanta
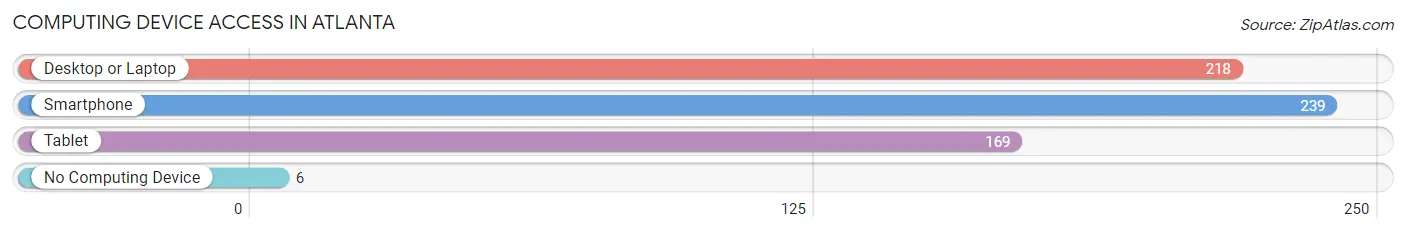
| Device Type | # Households | % Households |
| Desktop or Laptop | 218 | 77.6% |
| Smartphone | 239 | 85.1% |
| Tablet | 169 | 60.1% |
| No Computing Device | 6 | 2.1% |
| Total | 281 | 100.0% |
Internet Access in Atlanta
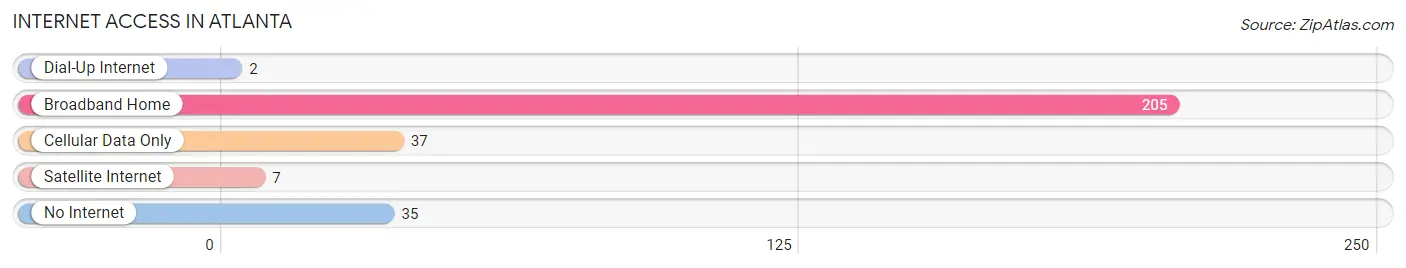
| Internet Type | # Households | % Households |
| Dial-Up Internet | 2 | 0.7% |
| Broadband Home | 205 | 73.0% |
| Cellular Data Only | 37 | 13.2% |
| Satellite Internet | 7 | 2.5% |
| No Internet | 35 | 12.5% |
| Total | 281 | 100.0% |
Atlanta Summary
Atlanta, Georgia is the capital and most populous city in the state of Georgia. It is the cultural and economic center of the Atlanta metropolitan area, home to more than 5.9 million people and the ninth-largest metropolitan area in the United States. Located in the foothills of the Appalachian Mountains, Atlanta is the county seat of Fulton County and a major transportation hub, with Hartsfield-Jackson Atlanta International Airport being the world's busiest airport by passenger traffic since 1998.
Geography
Atlanta is located in the northwestern part of the state of Georgia, at the southern end of the Appalachian Mountains. It is situated at the intersection of three major interstate highways: I-75, I-85, and I-20. The city is situated on a ridge between the Chattahoochee River to the northwest and the Piedmont Plateau to the southeast. The city is divided into two parts by the Chattahoochee River, with the northern part of the city located in the foothills of the Appalachian Mountains and the southern part located in the Piedmont Plateau.
The city has a total area of 134.0 square miles, of which 132.4 square miles is land and 1.6 square miles is water. The highest point in the city is 1,050 feet above sea level, located at the top of Kennesaw Mountain.
Economy
Atlanta is the economic and cultural center of the Atlanta metropolitan area, home to more than 5.9 million people and the ninth-largest metropolitan area in the United States. The city is a major transportation hub, with Hartsfield-Jackson Atlanta International Airport being the world's busiest airport by passenger traffic since 1998.
The city is home to several Fortune 500 companies, including The Home Depot, Delta Air Lines, UPS, and Coca-Cola. Atlanta is also a major center for finance, telecommunications, media, and transportation, with the world headquarters of CNN, Turner Broadcasting, and The Weather Channel located in the city.
Demographics
As of the 2010 census, Atlanta had a population of 420,003. The racial makeup of the city was 54.0% African American, 35.7% White, 3.1% Asian, 0.2% Native American, 0.1% Pacific Islander, 5.3% from other races, and 1.7% from two or more races. Hispanic or Latino of any race were 10.1% of the population.
The median income for a household in the city was $45,123, and the median income for a family was $54,841. The per capita income for the city was $30,836. About 17.4% of families and 21.2% of the population were below the poverty line, including 30.1% of those under age 18 and 16.2% of those age 65 or over.
The city is home to a diverse population, with a large African American population, a growing Hispanic population, and a significant Asian population. The city is also home to a large LGBT population, with the city being ranked as one of the most LGBT-friendly cities in the United States.
Common Questions
What is Per Capita Income in Atlanta?
Per Capita income in Atlanta is $24,988.
What is the Median Family Income in Atlanta?
Median Family Income in Atlanta is $51,250.
What is the Median Household income in Atlanta?
Median Household Income in Atlanta is $57,159.
What is Income or Wage Gap in Atlanta?
Income or Wage Gap in Atlanta is 24.9%.
Women in Atlanta earn 75.1 cents for every dollar earned by a man.
What is Inequality or Gini Index in Atlanta?
Inequality or Gini Index in Atlanta is 0.39.
What is the Total Population of Atlanta?
Total Population of Atlanta is 773.
What is the Total Male Population of Atlanta?
Total Male Population of Atlanta is 368.
What is the Total Female Population of Atlanta?
Total Female Population of Atlanta is 405.
What is the Ratio of Males per 100 Females in Atlanta?
There are 90.86 Males per 100 Females in Atlanta.
What is the Ratio of Females per 100 Males in Atlanta?
There are 110.05 Females per 100 Males in Atlanta.
What is the Median Population Age in Atlanta?
Median Population Age in Atlanta is 36.1 Years.
What is the Average Family Size in Atlanta
Average Family Size in Atlanta is 3.0 People.
What is the Average Household Size in Atlanta
Average Household Size in Atlanta is 2.7 People.
How Large is the Labor Force in Atlanta?
There are 352 People in the Labor Forcein in Atlanta.
What is the Percentage of People in the Labor Force in Atlanta?
60.6% of People are in the Labor Force in Atlanta.
What is the Unemployment Rate in Atlanta?
Unemployment Rate in Atlanta is 10.6%.