Monticello, IN Map & Demographics
Monticello Map
Monticello Overview
$28,847
PER CAPITA INCOME
$69,264
AVG FAMILY INCOME
$48,847
AVG HOUSEHOLD INCOME
35.8%
WAGE / INCOME GAP [ % ]
64.2¢/ $1
WAGE / INCOME GAP [ $ ]
0.41
INEQUALITY / GINI INDEX
5,488
TOTAL POPULATION
2,645
MALE POPULATION
2,843
FEMALE POPULATION
93.04
MALES / 100 FEMALES
107.49
FEMALES / 100 MALES
48.7
MEDIAN AGE
2.7
AVG FAMILY SIZE
2.0
AVG HOUSEHOLD SIZE
2,443
LABOR FORCE [ PEOPLE ]
52.2%
PERCENT IN LABOR FORCE
6.0%
UNEMPLOYMENT RATE
Monticello Zip Codes
Monticello Area Codes
Income in Monticello
Income Overview in Monticello
Per Capita Income in Monticello is $28,847, while median incomes of families and households are $69,264 and $48,847 respectively.
| Characteristic | Number | Measure |
| Per Capita Income | 5,488 | $28,847 |
| Median Family Income | 1,377 | $69,264 |
| Mean Family Income | 1,377 | $79,002 |
| Median Household Income | 2,601 | $48,847 |
| Mean Household Income | 2,601 | $59,227 |
| Income Deficit | 1,377 | $0 |
| Wage / Income Gap (%) | 5,488 | 35.83% |
| Wage / Income Gap ($) | 5,488 | 64.17¢ per $1 |
| Gini / Inequality Index | 5,488 | 0.41 |
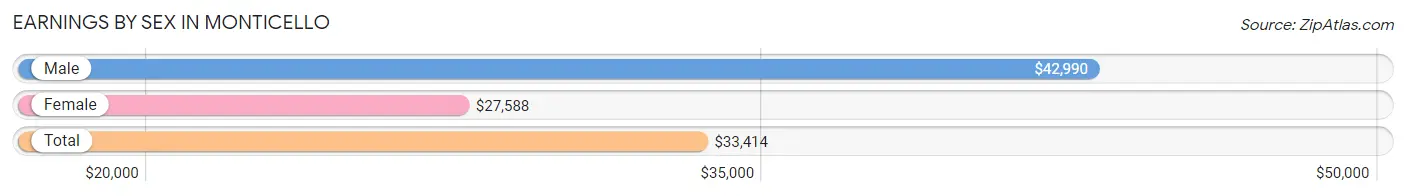
Earnings by Sex in Monticello
Average Earnings in Monticello are $33,414, $42,990 for men and $27,588 for women, a difference of 35.8%.
| Sex | Number | Average Earnings |
| Male | 1,304 (50.2%) | $42,990 |
| Female | 1,295 (49.8%) | $27,588 |
| Total | 2,599 (100.0%) | $33,414 |
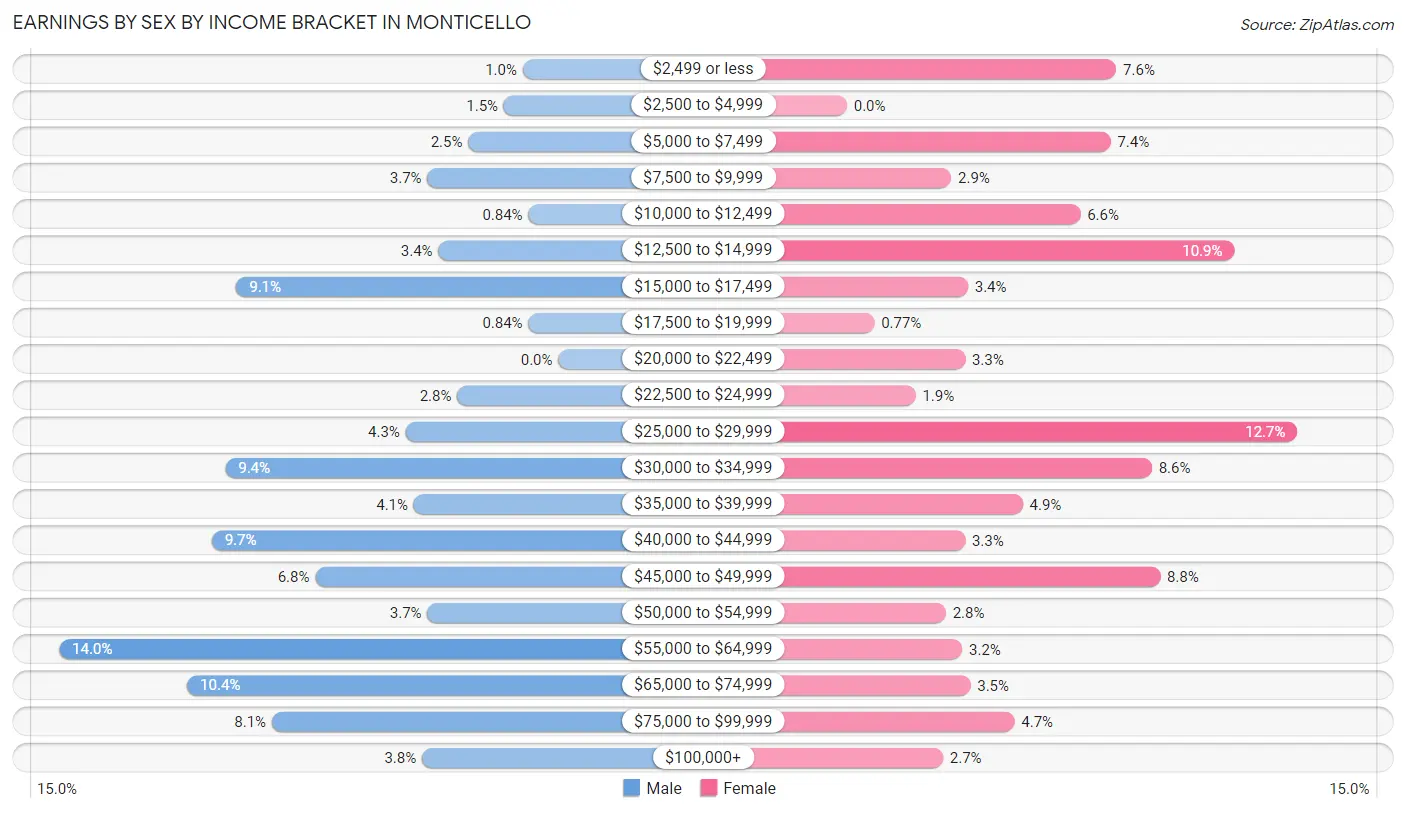
Earnings by Sex by Income Bracket in Monticello
The most common earnings brackets in Monticello are $55,000 to $64,999 for men (183 | 14.0%) and $25,000 to $29,999 for women (164 | 12.7%).
| Income | Male | Female |
| $2,499 or less | 13 (1.0%) | 98 (7.6%) |
| $2,500 to $4,999 | 20 (1.5%) | 0 (0.0%) |
| $5,000 to $7,499 | 33 (2.5%) | 96 (7.4%) |
| $7,500 to $9,999 | 48 (3.7%) | 38 (2.9%) |
| $10,000 to $12,499 | 11 (0.8%) | 85 (6.6%) |
| $12,500 to $14,999 | 44 (3.4%) | 141 (10.9%) |
| $15,000 to $17,499 | 118 (9.0%) | 44 (3.4%) |
| $17,500 to $19,999 | 11 (0.8%) | 10 (0.8%) |
| $20,000 to $22,499 | 0 (0.0%) | 43 (3.3%) |
| $22,500 to $24,999 | 37 (2.8%) | 25 (1.9%) |
| $25,000 to $29,999 | 56 (4.3%) | 164 (12.7%) |
| $30,000 to $34,999 | 122 (9.4%) | 111 (8.6%) |
| $35,000 to $39,999 | 53 (4.1%) | 64 (4.9%) |
| $40,000 to $44,999 | 127 (9.7%) | 43 (3.3%) |
| $45,000 to $49,999 | 89 (6.8%) | 114 (8.8%) |
| $50,000 to $54,999 | 48 (3.7%) | 36 (2.8%) |
| $55,000 to $64,999 | 183 (14.0%) | 42 (3.2%) |
| $65,000 to $74,999 | 136 (10.4%) | 45 (3.5%) |
| $75,000 to $99,999 | 105 (8.1%) | 61 (4.7%) |
| $100,000+ | 50 (3.8%) | 35 (2.7%) |
| Total | 1,304 (100.0%) | 1,295 (100.0%) |
Earnings by Sex by Educational Attainment in Monticello
Average earnings in Monticello are $45,980 for men and $30,984 for women, a difference of 32.6%. Men with an educational attainment of bachelor's degree enjoy the highest average annual earnings of $47,991, while those with less than high school education earn the least with $29,013. Women with an educational attainment of graduate degree earn the most with the average annual earnings of $56,971, while those with high school diploma education have the smallest earnings of $28,403.

| Educational Attainment | Male Income | Female Income |
| Less than High School | $29,013 | $0 |
| High School Diploma | $46,189 | $28,403 |
| College or Associate's Degree | $41,827 | $34,185 |
| Bachelor's Degree | $47,991 | $39,643 |
| Graduate Degree | - | - |
| Total | $45,980 | $30,984 |
Family Income in Monticello
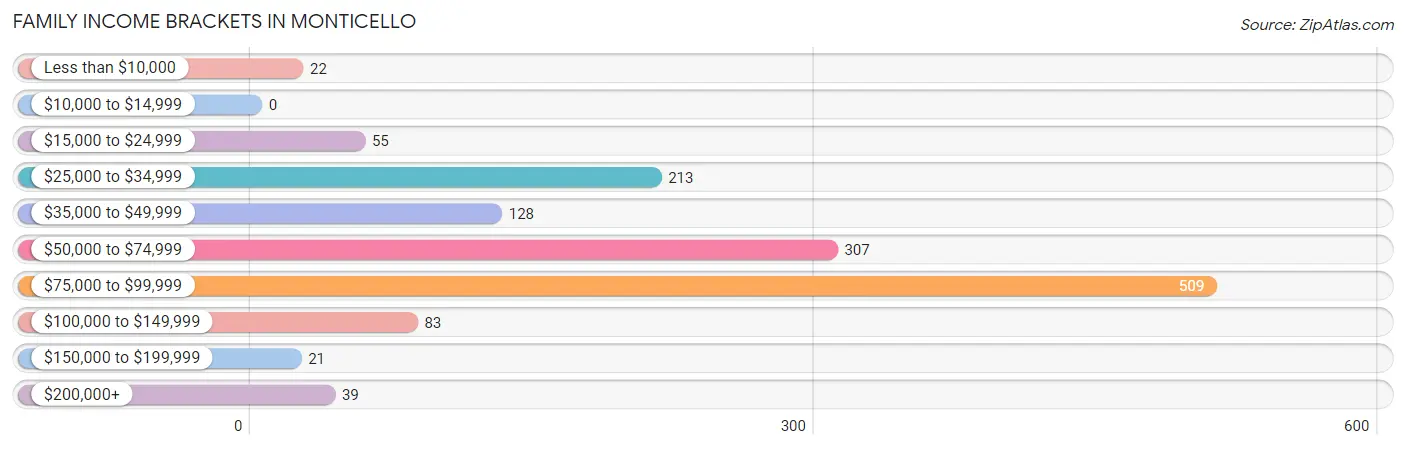
Family Income Brackets in Monticello
According to the Monticello family income data, there are 509 families falling into the $75,000 to $99,999 income range, which is the most common income bracket and makes up 37.0% of all families.
| Income Bracket | # Families | % Families |
| Less than $10,000 | 22 | 1.6% |
| $10,000 to $14,999 | 0 | 0.0% |
| $15,000 to $24,999 | 55 | 4.0% |
| $25,000 to $34,999 | 213 | 15.5% |
| $35,000 to $49,999 | 128 | 9.3% |
| $50,000 to $74,999 | 307 | 22.3% |
| $75,000 to $99,999 | 509 | 37.0% |
| $100,000 to $149,999 | 83 | 6.0% |
| $150,000 to $199,999 | 21 | 1.5% |
| $200,000+ | 39 | 2.8% |
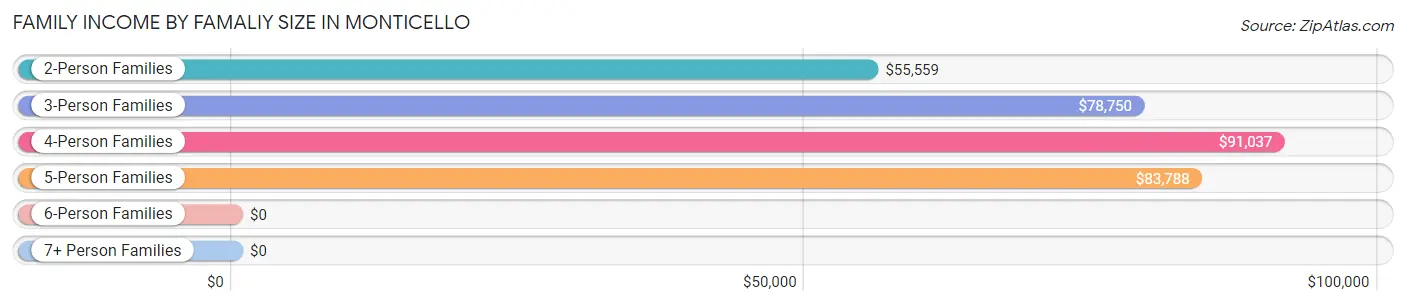
Family Income by Famaliy Size in Monticello
4-person families (224 | 16.3%) account for the highest median family income in Monticello with $91,037 per family, while 2-person families (892 | 64.8%) have the highest median income of $27,780 per family member.
| Income Bracket | # Families | Median Income |
| 2-Person Families | 892 (64.8%) | $55,559 |
| 3-Person Families | 182 (13.2%) | $78,750 |
| 4-Person Families | 224 (16.3%) | $91,037 |
| 5-Person Families | 48 (3.5%) | $83,788 |
| 6-Person Families | 29 (2.1%) | $0 |
| 7+ Person Families | 2 (0.2%) | $0 |
| Total | 1,377 (100.0%) | $69,264 |
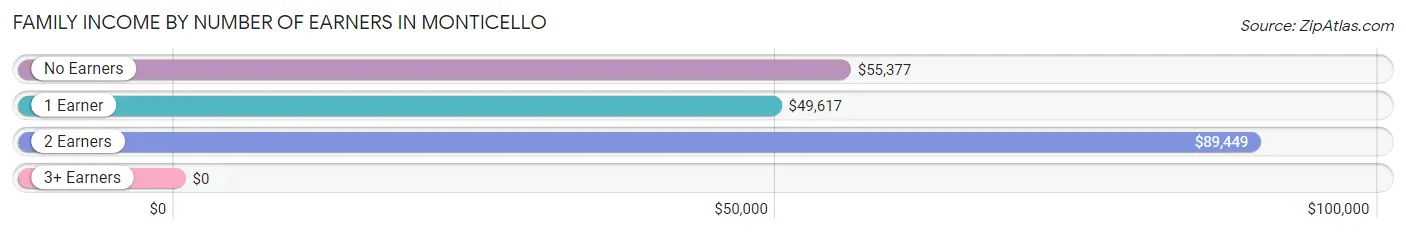
Family Income by Number of Earners in Monticello
| Number of Earners | # Families | Median Income |
| No Earners | 353 (25.6%) | $55,377 |
| 1 Earner | 429 (31.1%) | $49,617 |
| 2 Earners | 492 (35.7%) | $89,449 |
| 3+ Earners | 103 (7.5%) | $0 |
| Total | 1,377 (100.0%) | $69,264 |
Household Income in Monticello
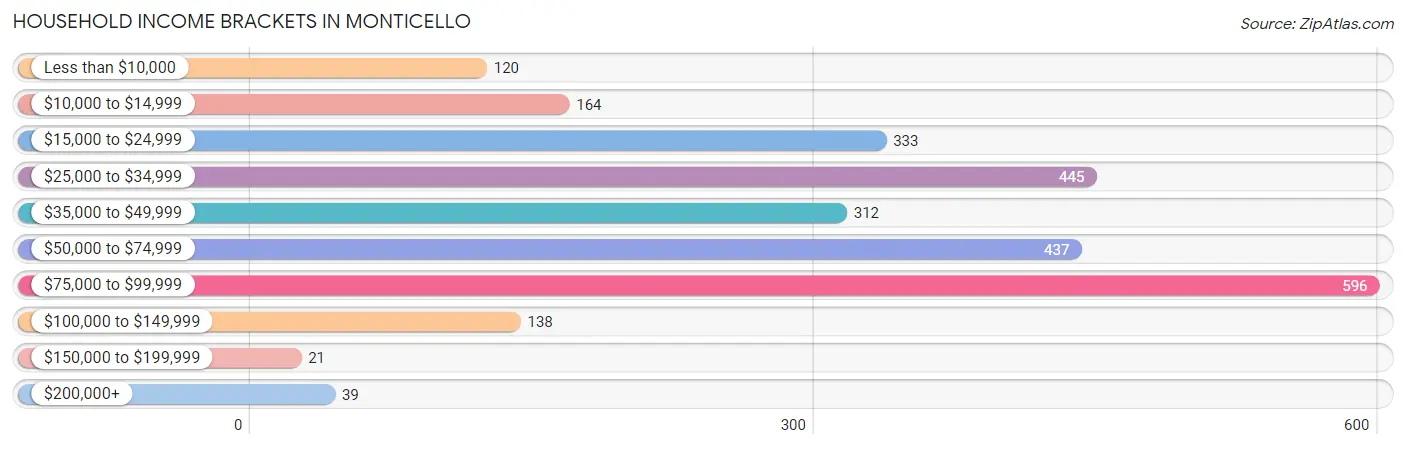
Household Income Brackets in Monticello
With 596 households falling in the category, the $75,000 to $99,999 income range is the most frequent in Monticello, accounting for 22.9% of all households. In contrast, only 21 households (0.8%) fall into the $150,000 to $199,999 income bracket, making it the least populous group.
| Income Bracket | # Households | % Households |
| Less than $10,000 | 120 | 4.6% |
| $10,000 to $14,999 | 164 | 6.3% |
| $15,000 to $24,999 | 333 | 12.8% |
| $25,000 to $34,999 | 445 | 17.1% |
| $35,000 to $49,999 | 312 | 12.0% |
| $50,000 to $74,999 | 437 | 16.8% |
| $75,000 to $99,999 | 596 | 22.9% |
| $100,000 to $149,999 | 138 | 5.3% |
| $150,000 to $199,999 | 21 | 0.8% |
| $200,000+ | 39 | 1.5% |
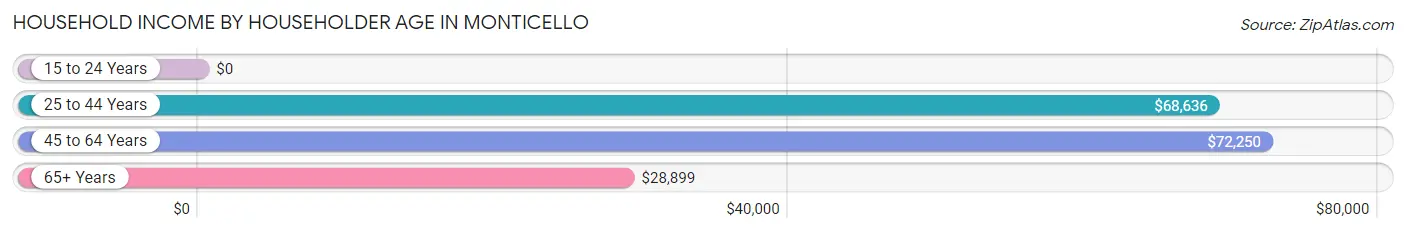
Household Income by Householder Age in Monticello
The median household income in Monticello is $48,847, with the highest median household income of $72,250 found in the 45 to 64 years age bracket for the primary householder. A total of 757 households (29.1%) fall into this category. Meanwhile, the 15 to 24 years age bracket for the primary householder has the lowest median household income of $0, with 153 households (5.9%) in this group.
| Income Bracket | # Households | Median Income |
| 15 to 24 Years | 153 (5.9%) | $0 |
| 25 to 44 Years | 624 (24.0%) | $68,636 |
| 45 to 64 Years | 757 (29.1%) | $72,250 |
| 65+ Years | 1,067 (41.0%) | $28,899 |
| Total | 2,601 (100.0%) | $48,847 |
Poverty in Monticello
Income Below Poverty by Sex and Age in Monticello
With 5.6% poverty level for males and 11.6% for females among the residents of Monticello, 18 to 24 year old males and 18 to 24 year old females are the most vulnerable to poverty, with 18 males (12.9%) and 124 females (36.7%) in their respective age groups living below the poverty level.
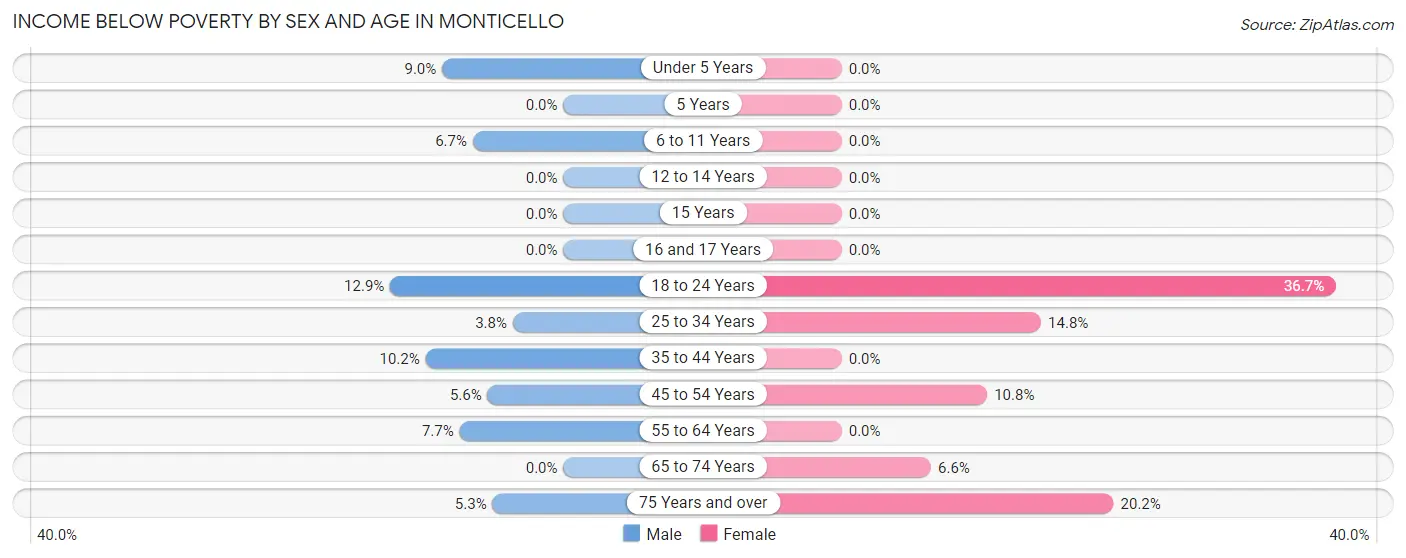
| Age Bracket | Male | Female |
| Under 5 Years | 9 (9.0%) | 0 (0.0%) |
| 5 Years | 0 (0.0%) | 0 (0.0%) |
| 6 to 11 Years | 9 (6.7%) | 0 (0.0%) |
| 12 to 14 Years | 0 (0.0%) | 0 (0.0%) |
| 15 Years | 0 (0.0%) | 0 (0.0%) |
| 16 and 17 Years | 0 (0.0%) | 0 (0.0%) |
| 18 to 24 Years | 18 (12.9%) | 124 (36.7%) |
| 25 to 34 Years | 11 (3.7%) | 37 (14.8%) |
| 35 to 44 Years | 27 (10.2%) | 0 (0.0%) |
| 45 to 54 Years | 17 (5.6%) | 38 (10.8%) |
| 55 to 64 Years | 32 (7.7%) | 0 (0.0%) |
| 65 to 74 Years | 0 (0.0%) | 23 (6.6%) |
| 75 Years and over | 18 (5.3%) | 92 (20.2%) |
| Total | 141 (5.6%) | 314 (11.6%) |
Income Above Poverty by Sex and Age in Monticello
According to the poverty statistics in Monticello, males aged 5 years and females aged under 5 years are the age groups that are most secure financially, with 100.0% of males and 100.0% of females in these age groups living above the poverty line.
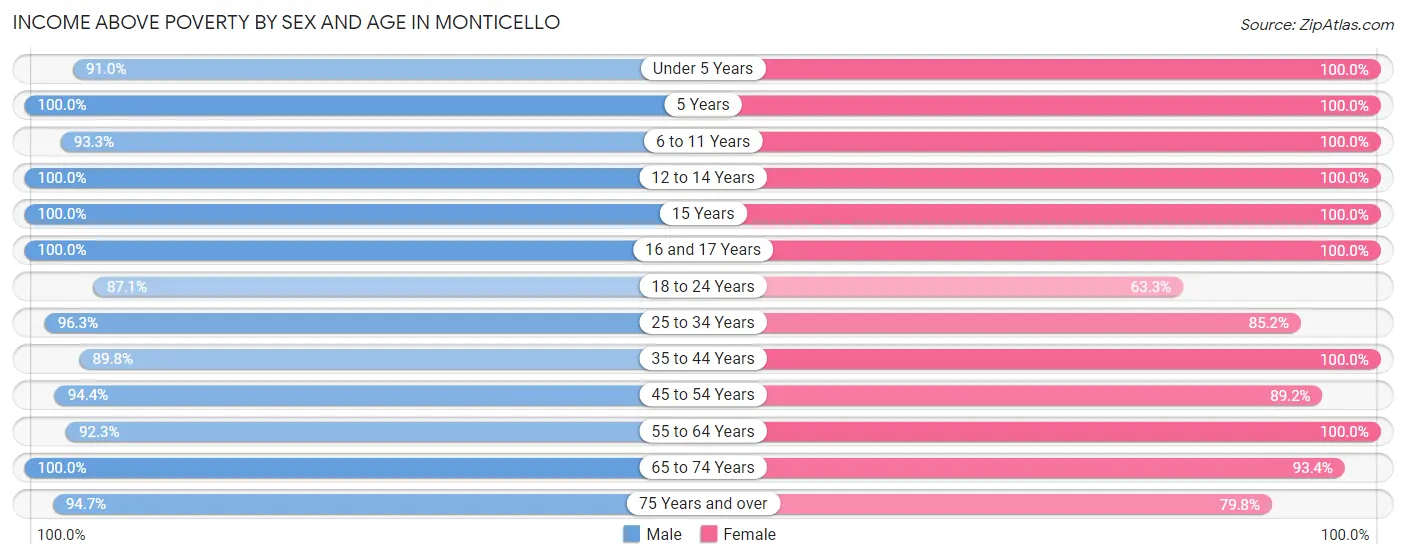
| Age Bracket | Male | Female |
| Under 5 Years | 91 (91.0%) | 51 (100.0%) |
| 5 Years | 7 (100.0%) | 8 (100.0%) |
| 6 to 11 Years | 125 (93.3%) | 180 (100.0%) |
| 12 to 14 Years | 95 (100.0%) | 45 (100.0%) |
| 15 Years | 109 (100.0%) | 13 (100.0%) |
| 16 and 17 Years | 11 (100.0%) | 47 (100.0%) |
| 18 to 24 Years | 122 (87.1%) | 214 (63.3%) |
| 25 to 34 Years | 282 (96.3%) | 213 (85.2%) |
| 35 to 44 Years | 237 (89.8%) | 217 (100.0%) |
| 45 to 54 Years | 285 (94.4%) | 314 (89.2%) |
| 55 to 64 Years | 383 (92.3%) | 394 (100.0%) |
| 65 to 74 Years | 287 (100.0%) | 324 (93.4%) |
| 75 Years and over | 324 (94.7%) | 364 (79.8%) |
| Total | 2,358 (94.4%) | 2,384 (88.4%) |
Income Below Poverty Among Married-Couple Families in Monticello
The poverty statistics for married-couple families in Monticello show that 2.0% or 18 of the total 920 families live below the poverty line. Families with no children have the highest poverty rate of 2.8%, comprising of 18 families. On the other hand, families with 1 or 2 children have the lowest poverty rate of 0.0%, which includes 0 families.
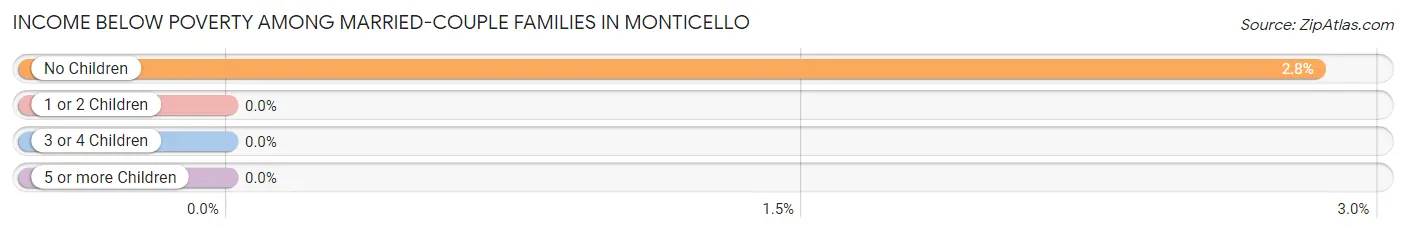
| Children | Above Poverty | Below Poverty |
| No Children | 616 (97.2%) | 18 (2.8%) |
| 1 or 2 Children | 269 (100.0%) | 0 (0.0%) |
| 3 or 4 Children | 15 (100.0%) | 0 (0.0%) |
| 5 or more Children | 2 (100.0%) | 0 (0.0%) |
| Total | 902 (98.0%) | 18 (2.0%) |
Income Below Poverty Among Single-Parent Households in Monticello
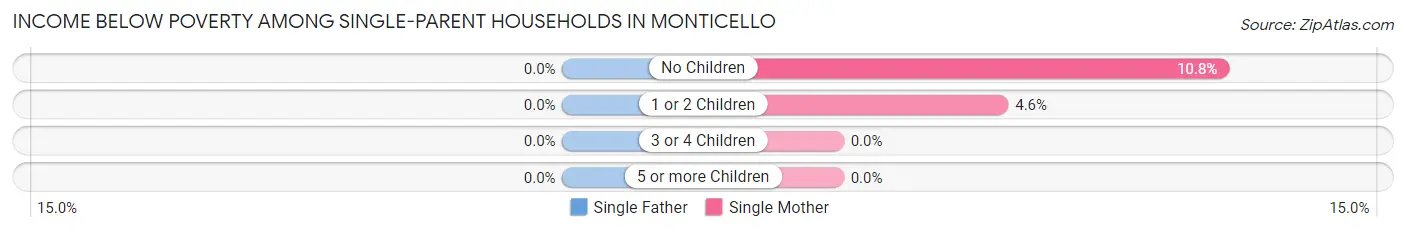
| Children | Single Father | Single Mother |
| No Children | 0 (0.0%) | 14 (10.8%) |
| 1 or 2 Children | 0 (0.0%) | 8 (4.6%) |
| 3 or 4 Children | 0 (0.0%) | 0 (0.0%) |
| 5 or more Children | 0 (0.0%) | 0 (0.0%) |
| Total | 0 (0.0%) | 22 (7.2%) |
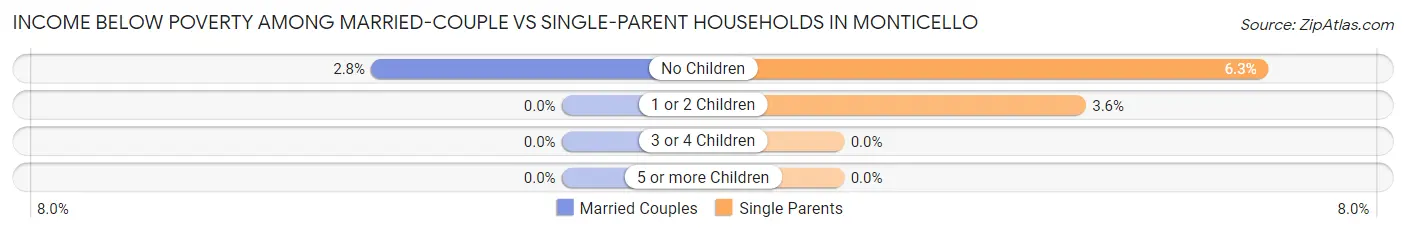
Income Below Poverty Among Married-Couple vs Single-Parent Households in Monticello
The poverty data for Monticello shows that 18 of the married-couple family households (2.0%) and 22 of the single-parent households (4.8%) are living below the poverty level. Within the married-couple family households, those with no children have the highest poverty rate, with 18 households (2.8%) falling below the poverty line. Among the single-parent households, those with no children have the highest poverty rate, with 14 household (6.3%) living below poverty.
| Children | Married-Couple Families | Single-Parent Households |
| No Children | 18 (2.8%) | 14 (6.3%) |
| 1 or 2 Children | 0 (0.0%) | 8 (3.6%) |
| 3 or 4 Children | 0 (0.0%) | 0 (0.0%) |
| 5 or more Children | 0 (0.0%) | 0 (0.0%) |
| Total | 18 (2.0%) | 22 (4.8%) |
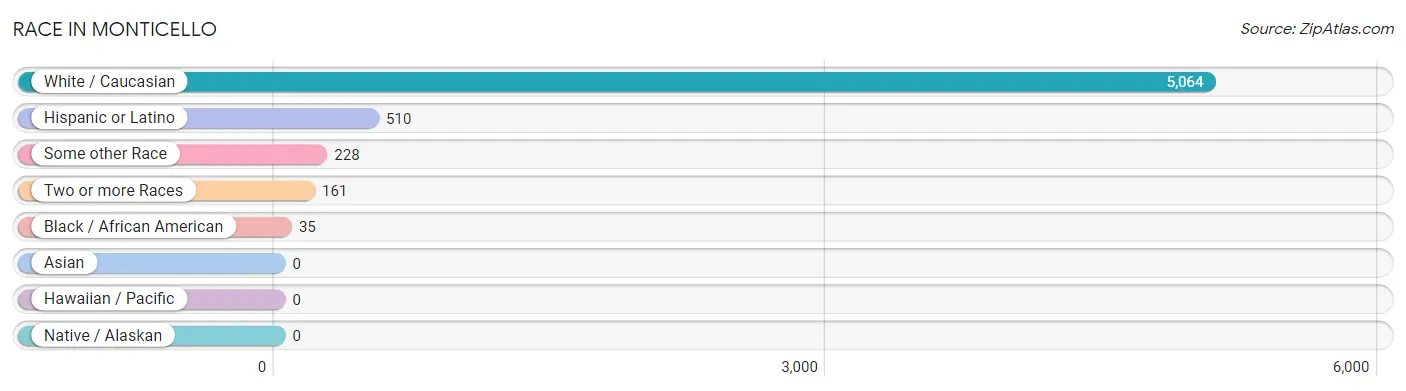
Race in Monticello
The most populous races in Monticello are White / Caucasian (5,064 | 92.3%), Hispanic or Latino (510 | 9.3%), and Some other Race (228 | 4.2%).
| Race | # Population | % Population |
| Asian | 0 | 0.0% |
| Black / African American | 35 | 0.6% |
| Hawaiian / Pacific | 0 | 0.0% |
| Hispanic or Latino | 510 | 9.3% |
| Native / Alaskan | 0 | 0.0% |
| White / Caucasian | 5,064 | 92.3% |
| Two or more Races | 161 | 2.9% |
| Some other Race | 228 | 4.2% |
| Total | 5,488 | 100.0% |
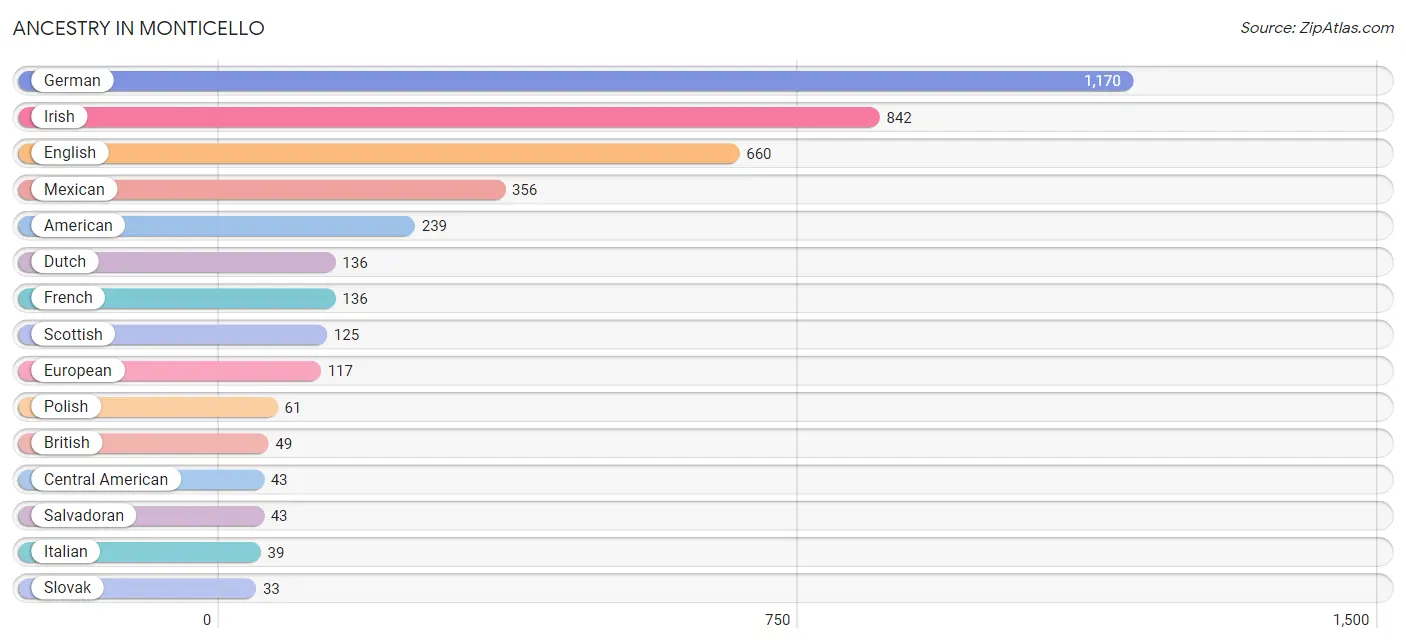
Ancestry in Monticello
The most populous ancestries reported in Monticello are German (1,170 | 21.3%), Irish (842 | 15.3%), English (660 | 12.0%), Mexican (356 | 6.5%), and American (239 | 4.3%), together accounting for 59.5% of all Monticello residents.
| Ancestry | # Population | % Population |
| American | 239 | 4.3% |
| Australian | 9 | 0.2% |
| British | 49 | 0.9% |
| Canadian | 16 | 0.3% |
| Central American | 43 | 0.8% |
| Cherokee | 25 | 0.5% |
| Dutch | 136 | 2.5% |
| Eastern European | 16 | 0.3% |
| English | 660 | 12.0% |
| European | 117 | 2.1% |
| French | 136 | 2.5% |
| German | 1,170 | 21.3% |
| Hungarian | 11 | 0.2% |
| Irish | 842 | 15.3% |
| Italian | 39 | 0.7% |
| Mexican | 356 | 6.5% |
| Northern European | 15 | 0.3% |
| Polish | 61 | 1.1% |
| Portuguese | 14 | 0.3% |
| Salvadoran | 43 | 0.8% |
| Scottish | 125 | 2.3% |
| Slovak | 33 | 0.6% |
| Welsh | 18 | 0.3% | View All 23 Rows |
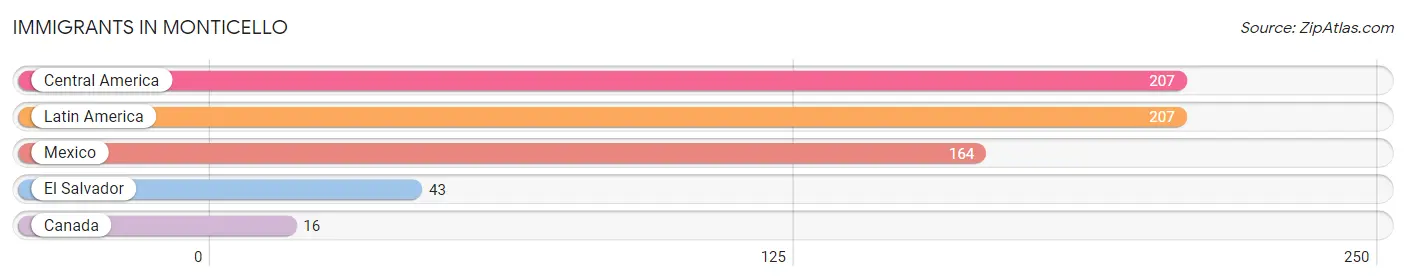
Immigrants in Monticello
The most numerous immigrant groups reported in Monticello came from Central America (207 | 3.8%), Latin America (207 | 3.8%), Mexico (164 | 3.0%), El Salvador (43 | 0.8%), and Canada (16 | 0.3%), together accounting for 11.6% of all Monticello residents.
| Immigration Origin | # Population | % Population |
| Canada | 16 | 0.3% |
| Central America | 207 | 3.8% |
| El Salvador | 43 | 0.8% |
| Latin America | 207 | 3.8% |
| Mexico | 164 | 3.0% | View All 5 Rows |
Sex and Age in Monticello
Sex and Age in Monticello
The most populous age groups in Monticello are 65 to 69 Years (244 | 9.2%) for men and 60 to 64 Years (327 | 11.5%) for women.
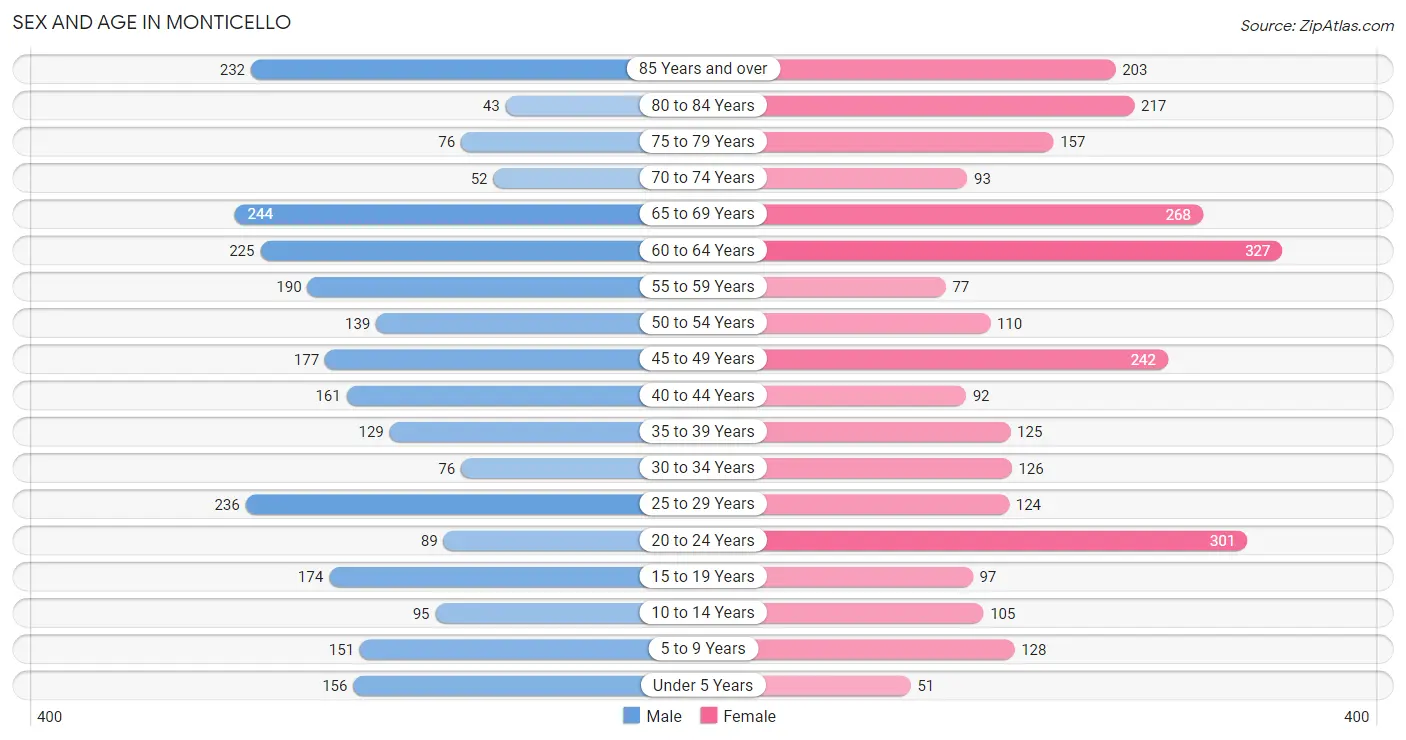
| Age Bracket | Male | Female |
| Under 5 Years | 156 (5.9%) | 51 (1.8%) |
| 5 to 9 Years | 151 (5.7%) | 128 (4.5%) |
| 10 to 14 Years | 95 (3.6%) | 105 (3.7%) |
| 15 to 19 Years | 174 (6.6%) | 97 (3.4%) |
| 20 to 24 Years | 89 (3.4%) | 301 (10.6%) |
| 25 to 29 Years | 236 (8.9%) | 124 (4.4%) |
| 30 to 34 Years | 76 (2.9%) | 126 (4.4%) |
| 35 to 39 Years | 129 (4.9%) | 125 (4.4%) |
| 40 to 44 Years | 161 (6.1%) | 92 (3.2%) |
| 45 to 49 Years | 177 (6.7%) | 242 (8.5%) |
| 50 to 54 Years | 139 (5.3%) | 110 (3.9%) |
| 55 to 59 Years | 190 (7.2%) | 77 (2.7%) |
| 60 to 64 Years | 225 (8.5%) | 327 (11.5%) |
| 65 to 69 Years | 244 (9.2%) | 268 (9.4%) |
| 70 to 74 Years | 52 (2.0%) | 93 (3.3%) |
| 75 to 79 Years | 76 (2.9%) | 157 (5.5%) |
| 80 to 84 Years | 43 (1.6%) | 217 (7.6%) |
| 85 Years and over | 232 (8.8%) | 203 (7.1%) |
| Total | 2,645 (100.0%) | 2,843 (100.0%) |
Families and Households in Monticello
Median Family Size in Monticello
The median family size in Monticello is 2.69 persons per family, with married-couple families (920 | 66.8%) accounting for the largest median family size of 2.78 persons per family. On the other hand, single female/mother families (304 | 22.1%) represent the smallest median family size with 2.48 persons per family.
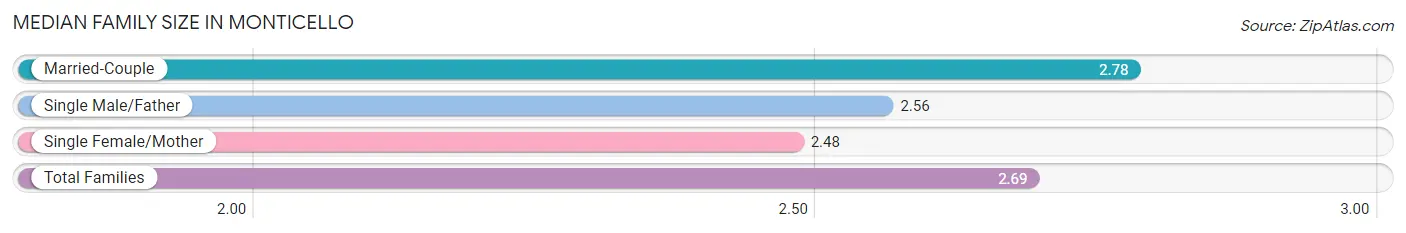
| Family Type | # Families | Family Size |
| Married-Couple | 920 (66.8%) | 2.78 |
| Single Male/Father | 153 (11.1%) | 2.56 |
| Single Female/Mother | 304 (22.1%) | 2.48 |
| Total Families | 1,377 (100.0%) | 2.69 |
Median Household Size in Monticello
The median household size in Monticello is 2.02 persons per household, with single male/father households (153 | 5.9%) accounting for the largest median household size of 2.89 persons per household. non-family households (1,224 | 47.1%) represent the smallest median household size with 1.17 persons per household.
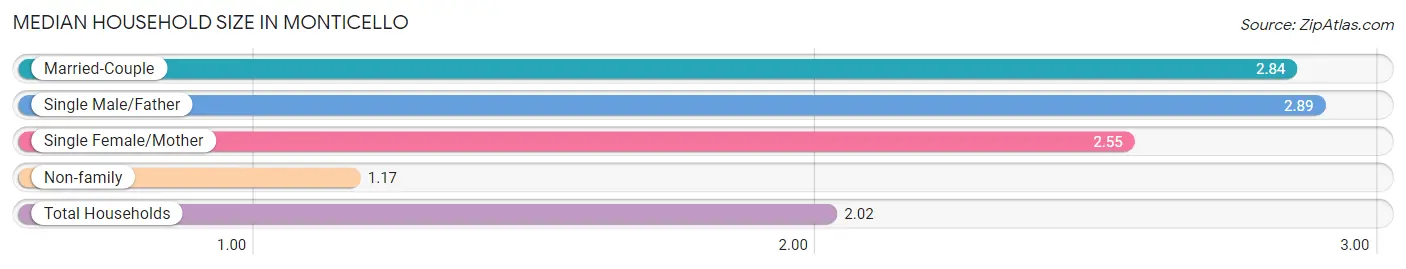
| Household Type | # Households | Household Size |
| Married-Couple | 920 (35.4%) | 2.84 |
| Single Male/Father | 153 (5.9%) | 2.89 |
| Single Female/Mother | 304 (11.7%) | 2.55 |
| Non-family | 1,224 (47.1%) | 1.17 |
| Total Households | 2,601 (100.0%) | 2.02 |
Household Size by Marriage Status in Monticello
Out of a total of 2,601 households in Monticello, 1,377 (52.9%) are family households, while 1,224 (47.1%) are nonfamily households. The most numerous type of family households are 2-person households, comprising 821, and the most common type of nonfamily households are 1-person households, comprising 1,076.
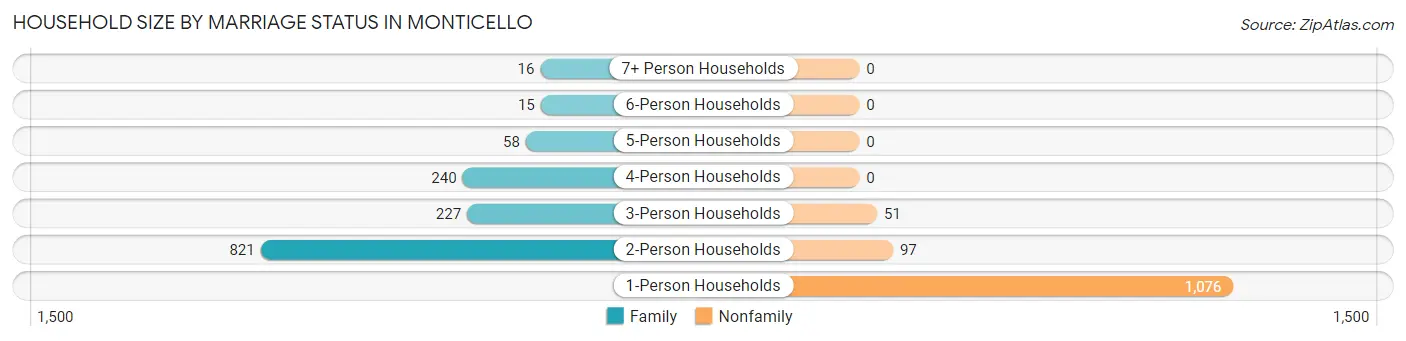
| Household Size | Family Households | Nonfamily Households |
| 1-Person Households | - | 1,076 (41.4%) |
| 2-Person Households | 821 (31.6%) | 97 (3.7%) |
| 3-Person Households | 227 (8.7%) | 51 (2.0%) |
| 4-Person Households | 240 (9.2%) | 0 (0.0%) |
| 5-Person Households | 58 (2.2%) | 0 (0.0%) |
| 6-Person Households | 15 (0.6%) | 0 (0.0%) |
| 7+ Person Households | 16 (0.6%) | 0 (0.0%) |
| Total | 1,377 (52.9%) | 1,224 (47.1%) |
Female Fertility in Monticello
Fertility by Age in Monticello
Average fertility rate in Monticello is 67.0 births per 1,000 women. Women in the age bracket of 20 to 34 years have the highest fertility rate with 136.0 births per 1,000 women. Women in the age bracket of 20 to 34 years acount for 98.7% of all women with births.
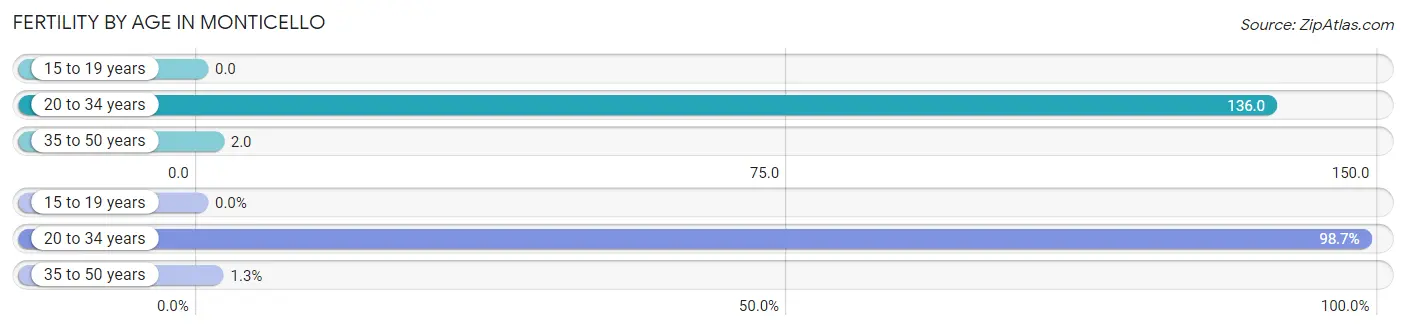
| Age Bracket | Women with Births | Births / 1,000 Women |
| 15 to 19 years | 0 (0.0%) | 0.0 |
| 20 to 34 years | 75 (98.7%) | 136.0 |
| 35 to 50 years | 1 (1.3%) | 2.0 |
| Total | 76 (100.0%) | 67.0 |
Fertility by Age by Marriage Status in Monticello
57.9% of women with births (76) in Monticello are married. The highest percentage of unmarried women with births falls into 20 to 34 years age bracket with 42.7% of them unmarried at the time of birth, while the lowest percentage of unmarried women with births belong to 35 to 50 years age bracket with 0.0% of them unmarried.
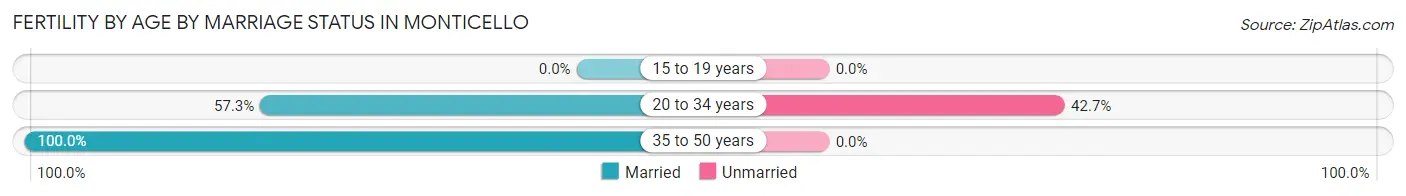
| Age Bracket | Married | Unmarried |
| 15 to 19 years | 0 (0.0%) | 0 (0.0%) |
| 20 to 34 years | 43 (57.3%) | 32 (42.7%) |
| 35 to 50 years | 1 (100.0%) | 0 (0.0%) |
| Total | 44 (57.9%) | 32 (42.1%) |
Fertility by Education in Monticello
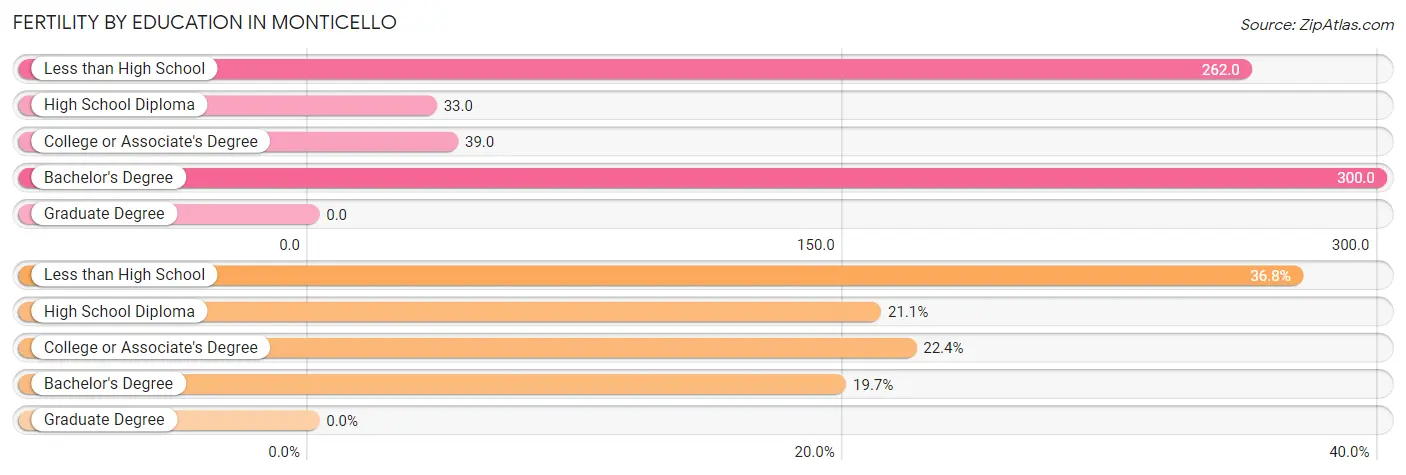
| Educational Attainment | Women with Births | Births / 1,000 Women |
| Less than High School | 28 (36.8%) | 262.0 |
| High School Diploma | 16 (21.0%) | 33.0 |
| College or Associate's Degree | 17 (22.4%) | 39.0 |
| Bachelor's Degree | 15 (19.7%) | 300.0 |
| Graduate Degree | 0 (0.0%) | 0.0 |
| Total | 76 (100.0%) | 67.0 |
Fertility by Education by Marriage Status in Monticello
42.1% of women with births in Monticello are unmarried. Women with the educational attainment of less than high school are most likely to be married with 100.0% of them married at childbirth, while women with the educational attainment of high school diploma are least likely to be married with 100.0% of them unmarried at childbirth.
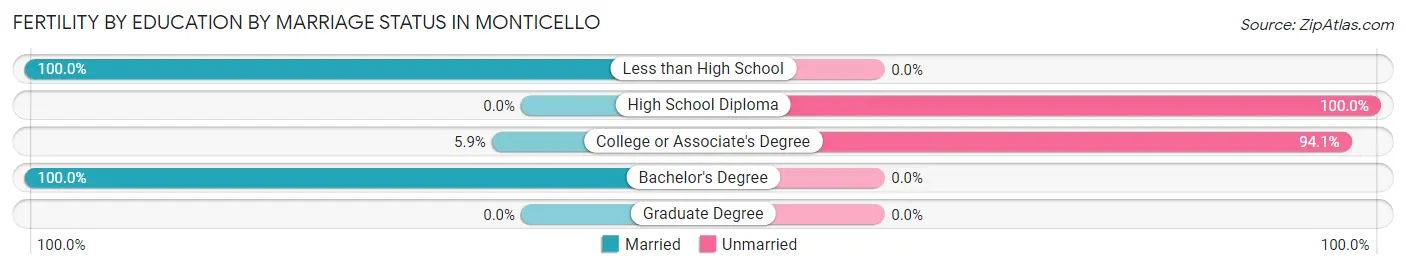
| Educational Attainment | Married | Unmarried |
| Less than High School | 28 (100.0%) | 0 (0.0%) |
| High School Diploma | 0 (0.0%) | 16 (100.0%) |
| College or Associate's Degree | 1 (5.9%) | 16 (94.1%) |
| Bachelor's Degree | 15 (100.0%) | 0 (0.0%) |
| Graduate Degree | 0 (0.0%) | 0 (0.0%) |
| Total | 44 (57.9%) | 32 (42.1%) |
Employment Characteristics in Monticello
Employment by Class of Employer in Monticello
Among the 2,296 employed individuals in Monticello, private company employees (1,715 | 74.7%), self-employed (not incorporated) (198 | 8.6%), and local government employees (155 | 6.8%) make up the most common classes of employment.
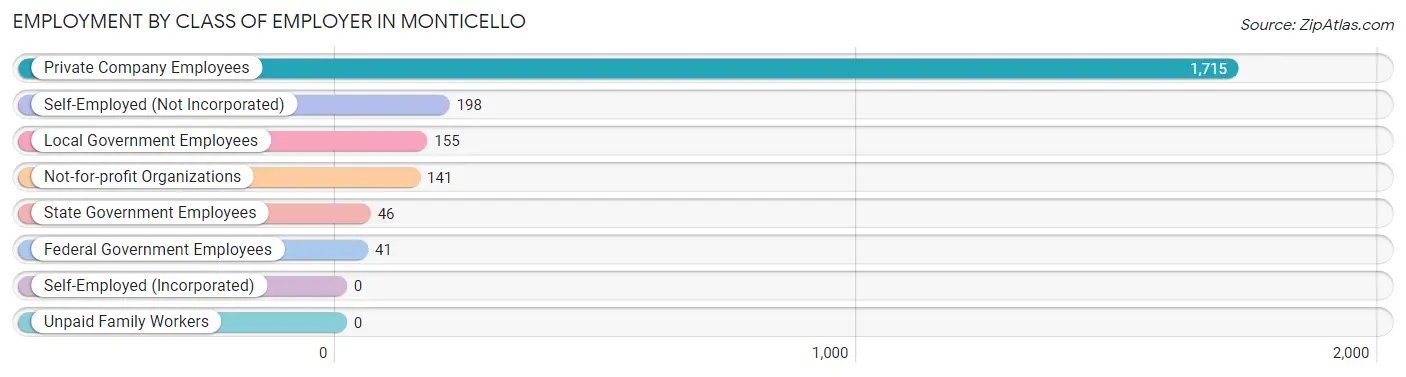
| Employer Class | # Employees | % Employees |
| Private Company Employees | 1,715 | 74.7% |
| Self-Employed (Incorporated) | 0 | 0.0% |
| Self-Employed (Not Incorporated) | 198 | 8.6% |
| Not-for-profit Organizations | 141 | 6.1% |
| Local Government Employees | 155 | 6.8% |
| State Government Employees | 46 | 2.0% |
| Federal Government Employees | 41 | 1.8% |
| Unpaid Family Workers | 0 | 0.0% |
| Total | 2,296 | 100.0% |
Employment Status by Age in Monticello
According to the labor force statistics for Monticello, out of the total population over 16 years of age (4,680), 52.2% or 2,443 individuals are in the labor force, with 6.0% or 147 of them unemployed. The age group with the highest labor force participation rate is 45 to 54 years, with 88.6% or 592 individuals in the labor force. Within the labor force, the 65 to 74 years age range has the highest percentage of unemployed individuals, with 22.4% or 19 of them being unemployed.
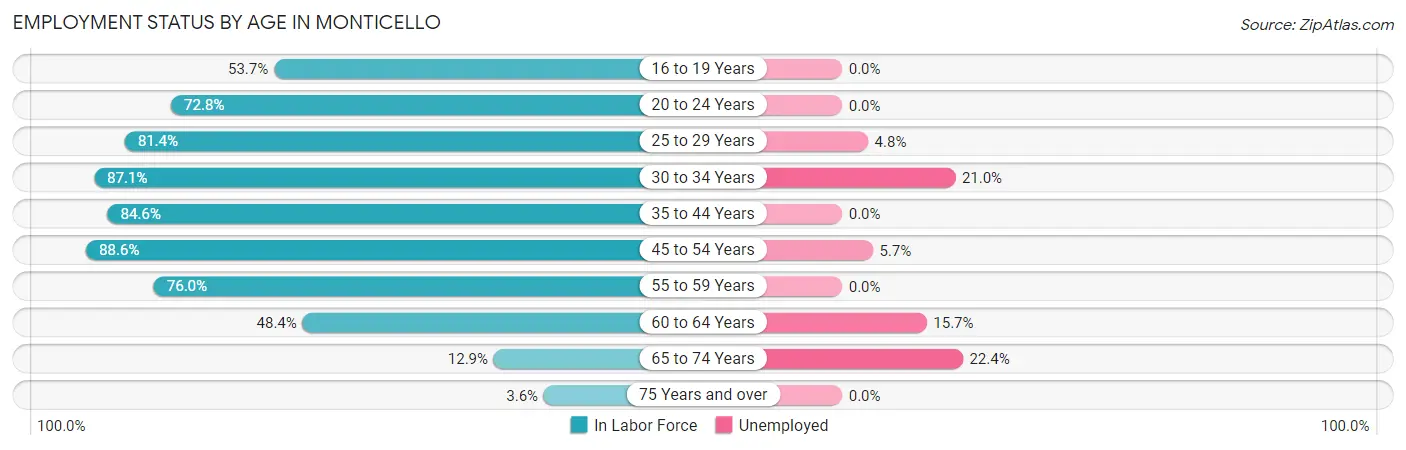
| Age Bracket | In Labor Force | Unemployed |
| 16 to 19 Years | 80 (53.7%) | 0 (0.0%) |
| 20 to 24 Years | 284 (72.8%) | 0 (0.0%) |
| 25 to 29 Years | 293 (81.4%) | 14 (4.8%) |
| 30 to 34 Years | 176 (87.1%) | 37 (21.0%) |
| 35 to 44 Years | 429 (84.6%) | 0 (0.0%) |
| 45 to 54 Years | 592 (88.6%) | 34 (5.7%) |
| 55 to 59 Years | 203 (76.0%) | 0 (0.0%) |
| 60 to 64 Years | 267 (48.4%) | 42 (15.7%) |
| 65 to 74 Years | 85 (12.9%) | 19 (22.4%) |
| 75 Years and over | 33 (3.6%) | 0 (0.0%) |
| Total | 2,443 (52.2%) | 147 (6.0%) |
Employment Status by Educational Attainment in Monticello
According to labor force statistics for Monticello, 76.7% of individuals (1,960) out of the total population between 25 and 64 years of age (2,556) are in the labor force, with 6.5% or 127 of them being unemployed. The group with the highest labor force participation rate are those with the educational attainment of high school diploma, with 84.0% or 853 individuals in the labor force. Within the labor force, individuals with high school diploma education have the highest percentage of unemployment, with 8.6% or 73 of them being unemployed.
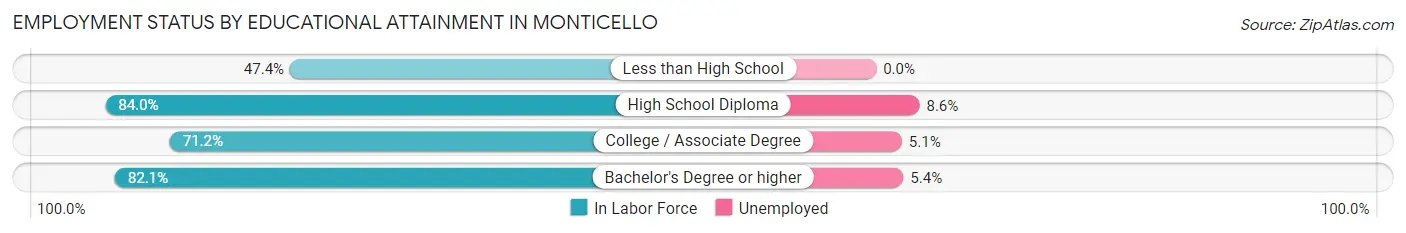
| Educational Attainment | In Labor Force | Unemployed |
| Less than High School | 63 (47.4%) | 0 (0.0%) |
| High School Diploma | 853 (84.0%) | 87 (8.6%) |
| College / Associate Degree | 728 (71.2%) | 52 (5.1%) |
| Bachelor's Degree or higher | 316 (82.1%) | 21 (5.4%) |
| Total | 1,960 (76.7%) | 166 (6.5%) |
Employment Occupations by Sex in Monticello
Management, Business, Science and Arts Occupations
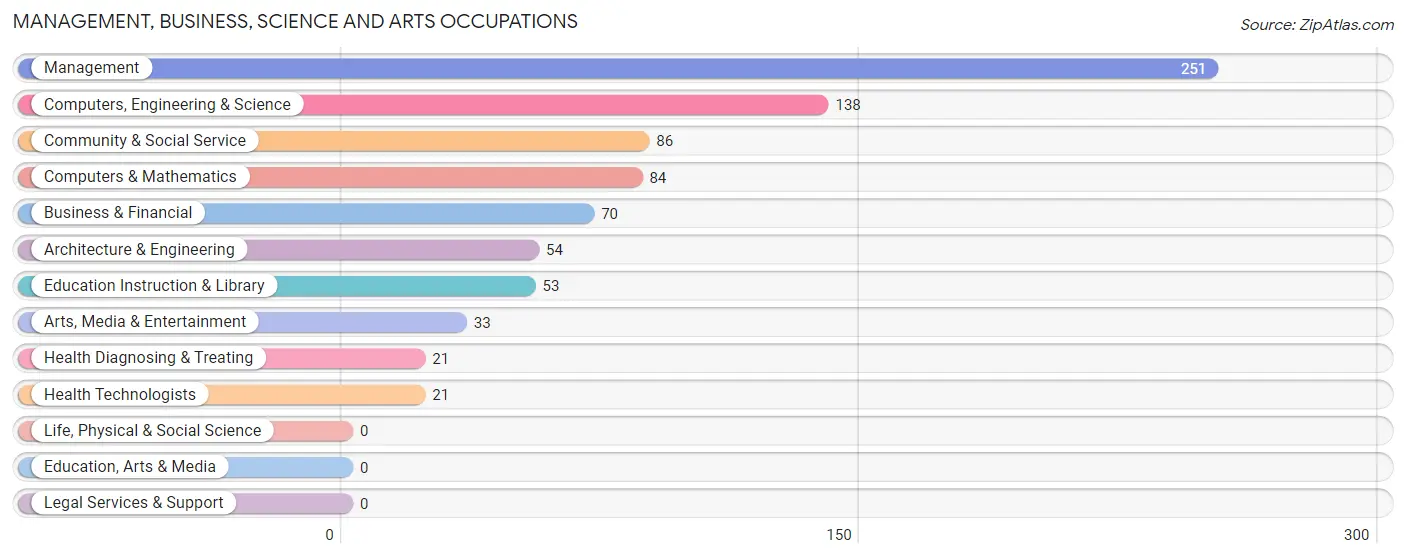
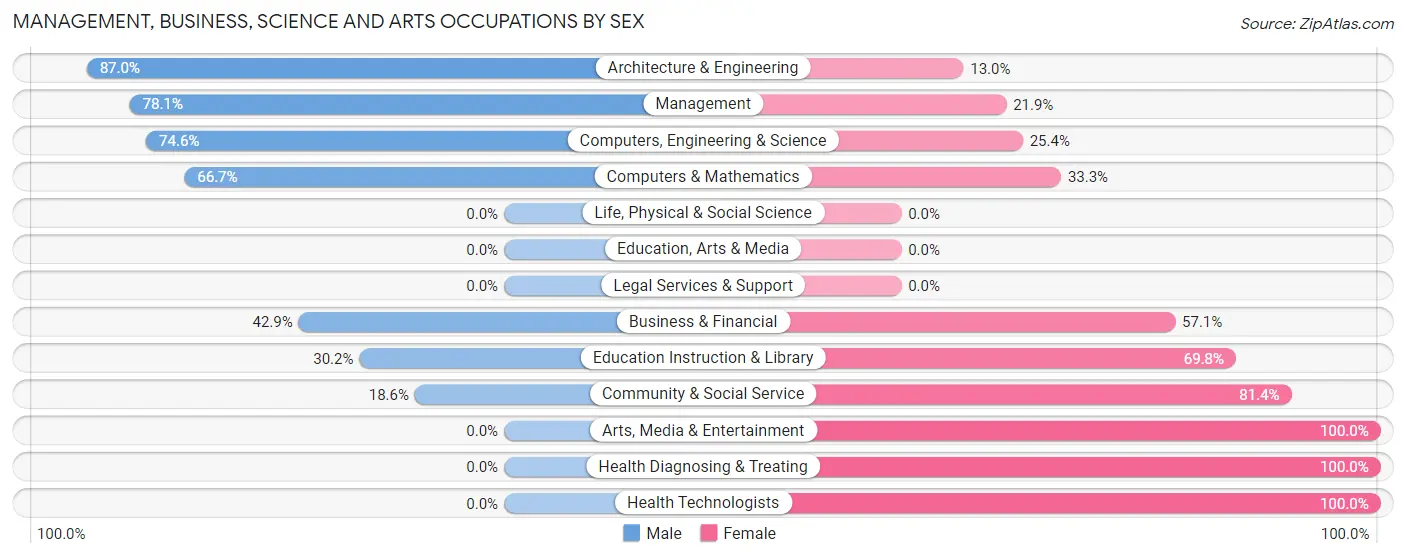
The most common Management, Business, Science and Arts occupations in Monticello are Management (251 | 10.9%), Computers, Engineering & Science (138 | 6.0%), Community & Social Service (86 | 3.7%), Computers & Mathematics (84 | 3.7%), and Business & Financial (70 | 3.0%).
Management, Business, Science and Arts Occupations by Sex
Within the Management, Business, Science and Arts occupations in Monticello, the most male-oriented occupations are Architecture & Engineering (87.0%), Management (78.1%), and Computers, Engineering & Science (74.6%), while the most female-oriented occupations are Arts, Media & Entertainment (100.0%), Health Diagnosing & Treating (100.0%), and Health Technologists (100.0%).
| Occupation | Male | Female |
| Management | 196 (78.1%) | 55 (21.9%) |
| Business & Financial | 30 (42.9%) | 40 (57.1%) |
| Computers, Engineering & Science | 103 (74.6%) | 35 (25.4%) |
| Computers & Mathematics | 56 (66.7%) | 28 (33.3%) |
| Architecture & Engineering | 47 (87.0%) | 7 (13.0%) |
| Life, Physical & Social Science | 0 (0.0%) | 0 (0.0%) |
| Community & Social Service | 16 (18.6%) | 70 (81.4%) |
| Education, Arts & Media | 0 (0.0%) | 0 (0.0%) |
| Legal Services & Support | 0 (0.0%) | 0 (0.0%) |
| Education Instruction & Library | 16 (30.2%) | 37 (69.8%) |
| Arts, Media & Entertainment | 0 (0.0%) | 33 (100.0%) |
| Health Diagnosing & Treating | 0 (0.0%) | 21 (100.0%) |
| Health Technologists | 0 (0.0%) | 21 (100.0%) |
| Total (Category) | 345 (61.0%) | 221 (39.1%) |
| Total (Overall) | 1,195 (52.0%) | 1,101 (47.9%) |
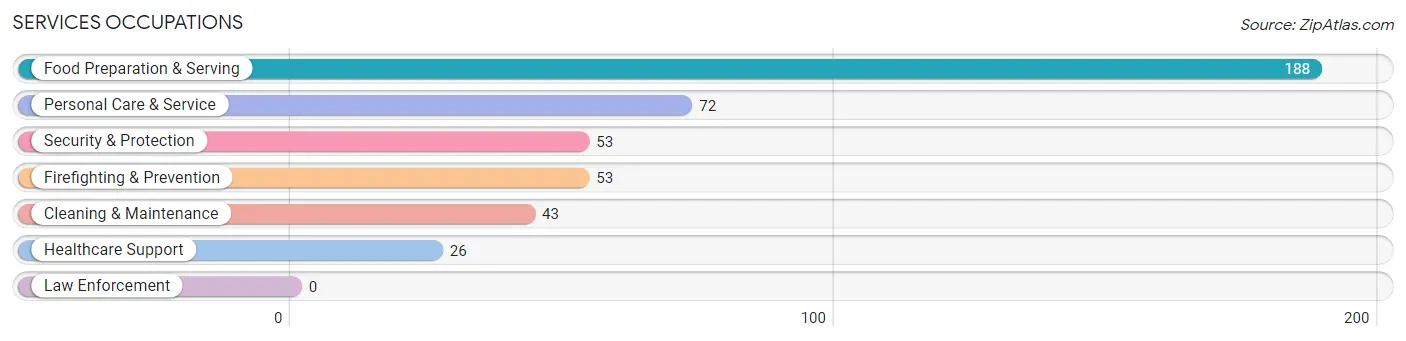
Services Occupations
The most common Services occupations in Monticello are Food Preparation & Serving (188 | 8.2%), Personal Care & Service (72 | 3.1%), Security & Protection (53 | 2.3%), Firefighting & Prevention (53 | 2.3%), and Cleaning & Maintenance (43 | 1.9%).
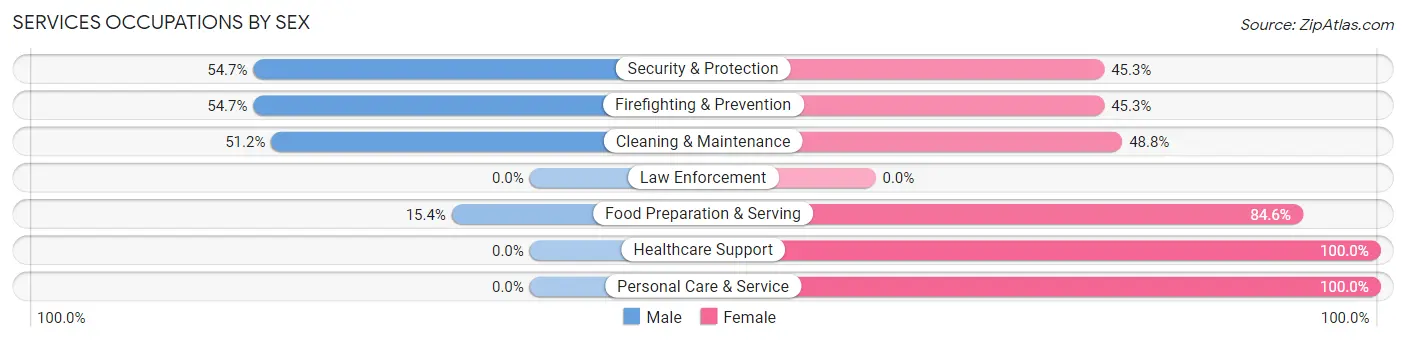
Services Occupations by Sex
Within the Services occupations in Monticello, the most male-oriented occupations are Security & Protection (54.7%), Firefighting & Prevention (54.7%), and Cleaning & Maintenance (51.2%), while the most female-oriented occupations are Healthcare Support (100.0%), Personal Care & Service (100.0%), and Food Preparation & Serving (84.6%).
| Occupation | Male | Female |
| Healthcare Support | 0 (0.0%) | 26 (100.0%) |
| Security & Protection | 29 (54.7%) | 24 (45.3%) |
| Firefighting & Prevention | 29 (54.7%) | 24 (45.3%) |
| Law Enforcement | 0 (0.0%) | 0 (0.0%) |
| Food Preparation & Serving | 29 (15.4%) | 159 (84.6%) |
| Cleaning & Maintenance | 22 (51.2%) | 21 (48.8%) |
| Personal Care & Service | 0 (0.0%) | 72 (100.0%) |
| Total (Category) | 80 (20.9%) | 302 (79.1%) |
| Total (Overall) | 1,195 (52.0%) | 1,101 (47.9%) |
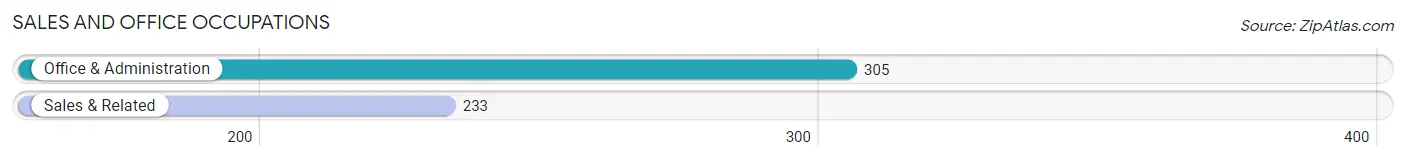
Sales and Office Occupations
The most common Sales and Office occupations in Monticello are Office & Administration (305 | 13.3%), and Sales & Related (233 | 10.2%).
Sales and Office Occupations by Sex
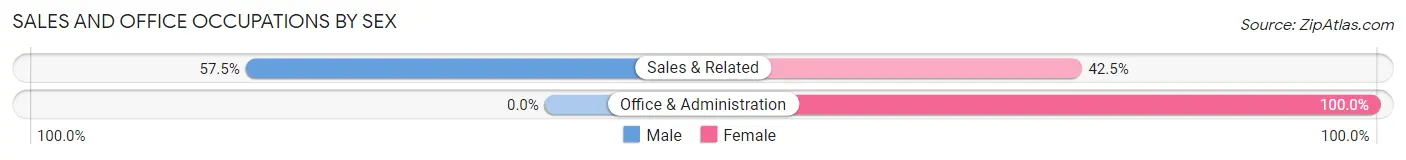
| Occupation | Male | Female |
| Sales & Related | 134 (57.5%) | 99 (42.5%) |
| Office & Administration | 0 (0.0%) | 305 (100.0%) |
| Total (Category) | 134 (24.9%) | 404 (75.1%) |
| Total (Overall) | 1,195 (52.0%) | 1,101 (47.9%) |
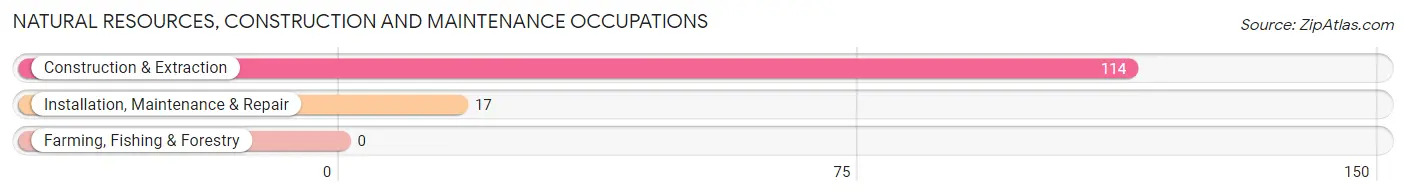
Natural Resources, Construction and Maintenance Occupations
The most common Natural Resources, Construction and Maintenance occupations in Monticello are Construction & Extraction (114 | 5.0%), and Installation, Maintenance & Repair (17 | 0.7%).
Natural Resources, Construction and Maintenance Occupations by Sex
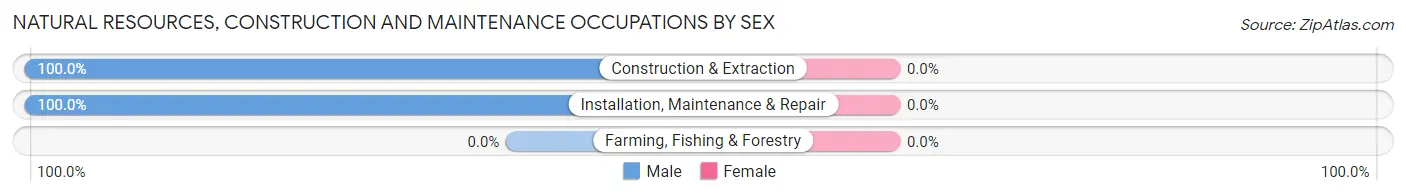
| Occupation | Male | Female |
| Farming, Fishing & Forestry | 0 (0.0%) | 0 (0.0%) |
| Construction & Extraction | 114 (100.0%) | 0 (0.0%) |
| Installation, Maintenance & Repair | 17 (100.0%) | 0 (0.0%) |
| Total (Category) | 131 (100.0%) | 0 (0.0%) |
| Total (Overall) | 1,195 (52.0%) | 1,101 (47.9%) |
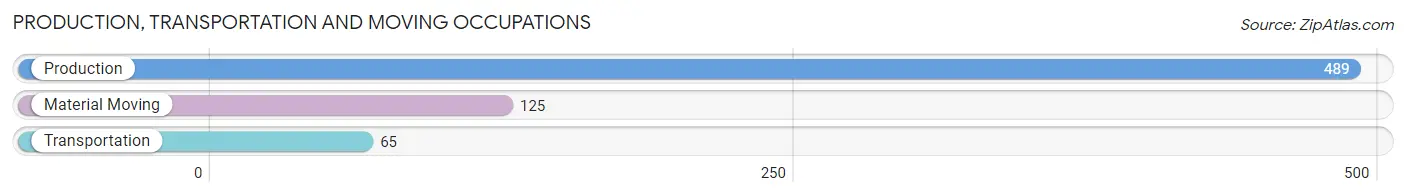
Production, Transportation and Moving Occupations
The most common Production, Transportation and Moving occupations in Monticello are Production (489 | 21.3%), Material Moving (125 | 5.4%), and Transportation (65 | 2.8%).
Production, Transportation and Moving Occupations by Sex
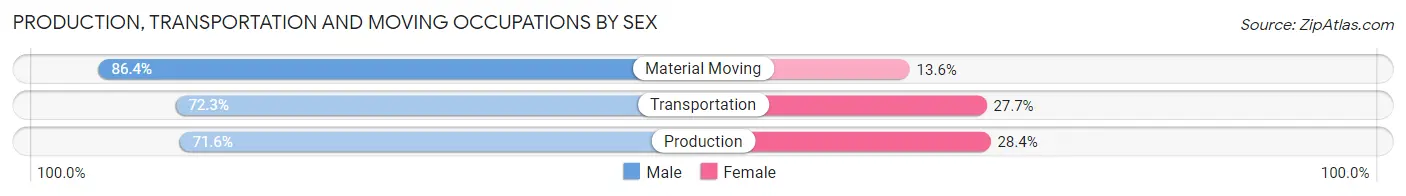
| Occupation | Male | Female |
| Production | 350 (71.6%) | 139 (28.4%) |
| Transportation | 47 (72.3%) | 18 (27.7%) |
| Material Moving | 108 (86.4%) | 17 (13.6%) |
| Total (Category) | 505 (74.4%) | 174 (25.6%) |
| Total (Overall) | 1,195 (52.0%) | 1,101 (47.9%) |
Employment Industries by Sex in Monticello
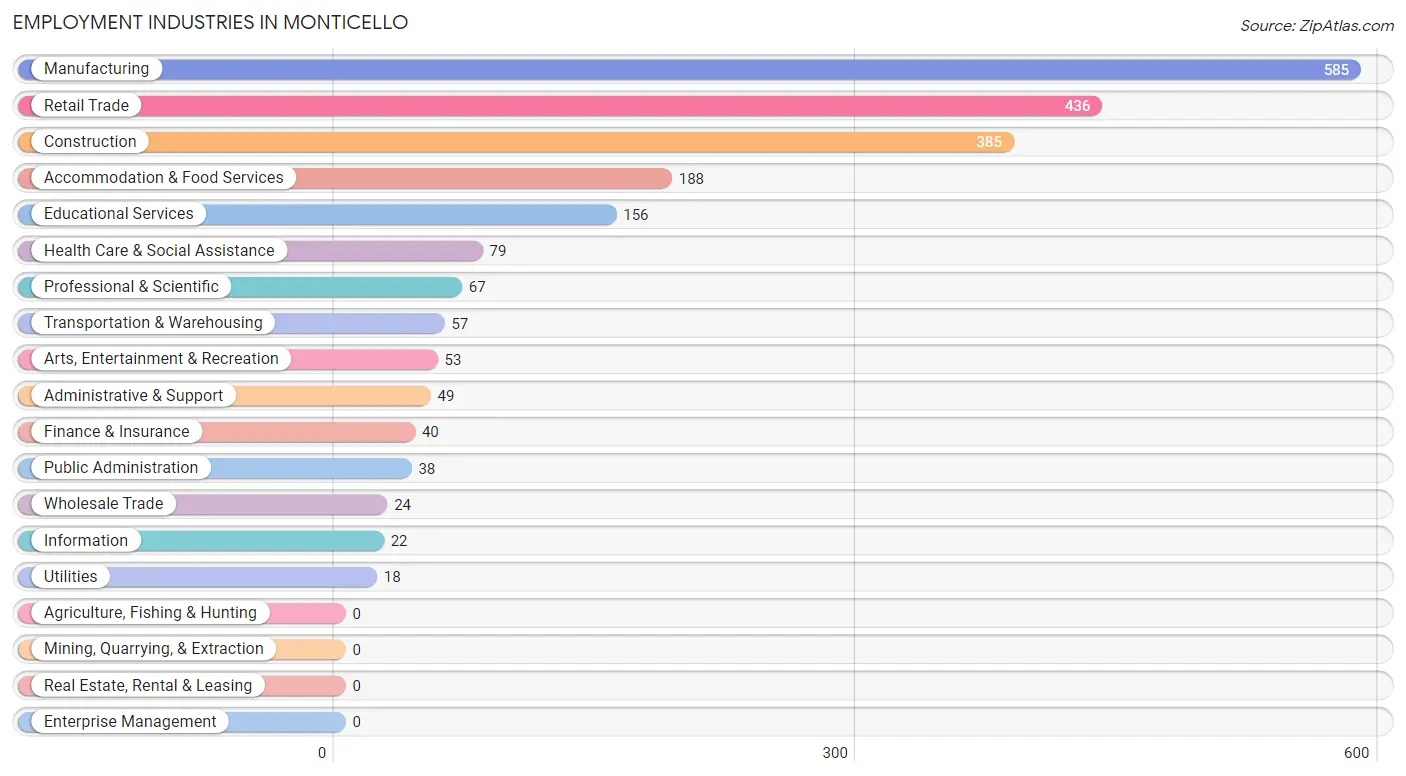
Employment Industries in Monticello
The major employment industries in Monticello include Manufacturing (585 | 25.5%), Retail Trade (436 | 19.0%), Construction (385 | 16.8%), Accommodation & Food Services (188 | 8.2%), and Educational Services (156 | 6.8%).
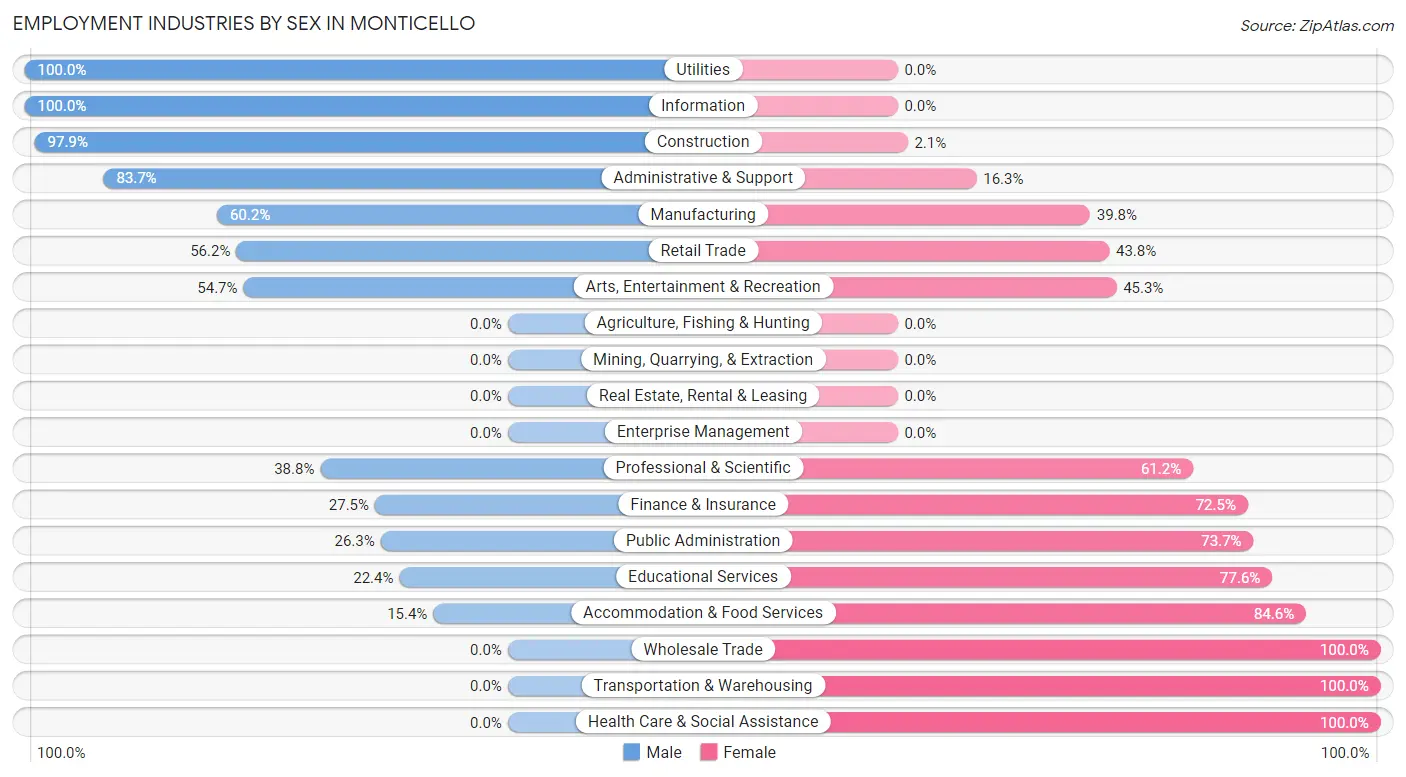
Employment Industries by Sex in Monticello
The Monticello industries that see more men than women are Utilities (100.0%), Information (100.0%), and Construction (97.9%), whereas the industries that tend to have a higher number of women are Wholesale Trade (100.0%), Transportation & Warehousing (100.0%), and Health Care & Social Assistance (100.0%).
| Industry | Male | Female |
| Agriculture, Fishing & Hunting | 0 (0.0%) | 0 (0.0%) |
| Mining, Quarrying, & Extraction | 0 (0.0%) | 0 (0.0%) |
| Construction | 377 (97.9%) | 8 (2.1%) |
| Manufacturing | 352 (60.2%) | 233 (39.8%) |
| Wholesale Trade | 0 (0.0%) | 24 (100.0%) |
| Retail Trade | 245 (56.2%) | 191 (43.8%) |
| Transportation & Warehousing | 0 (0.0%) | 57 (100.0%) |
| Utilities | 18 (100.0%) | 0 (0.0%) |
| Information | 22 (100.0%) | 0 (0.0%) |
| Finance & Insurance | 11 (27.5%) | 29 (72.5%) |
| Real Estate, Rental & Leasing | 0 (0.0%) | 0 (0.0%) |
| Professional & Scientific | 26 (38.8%) | 41 (61.2%) |
| Enterprise Management | 0 (0.0%) | 0 (0.0%) |
| Administrative & Support | 41 (83.7%) | 8 (16.3%) |
| Educational Services | 35 (22.4%) | 121 (77.6%) |
| Health Care & Social Assistance | 0 (0.0%) | 79 (100.0%) |
| Arts, Entertainment & Recreation | 29 (54.7%) | 24 (45.3%) |
| Accommodation & Food Services | 29 (15.4%) | 159 (84.6%) |
| Public Administration | 10 (26.3%) | 28 (73.7%) |
| Total | 1,195 (52.0%) | 1,101 (47.9%) |
Education in Monticello
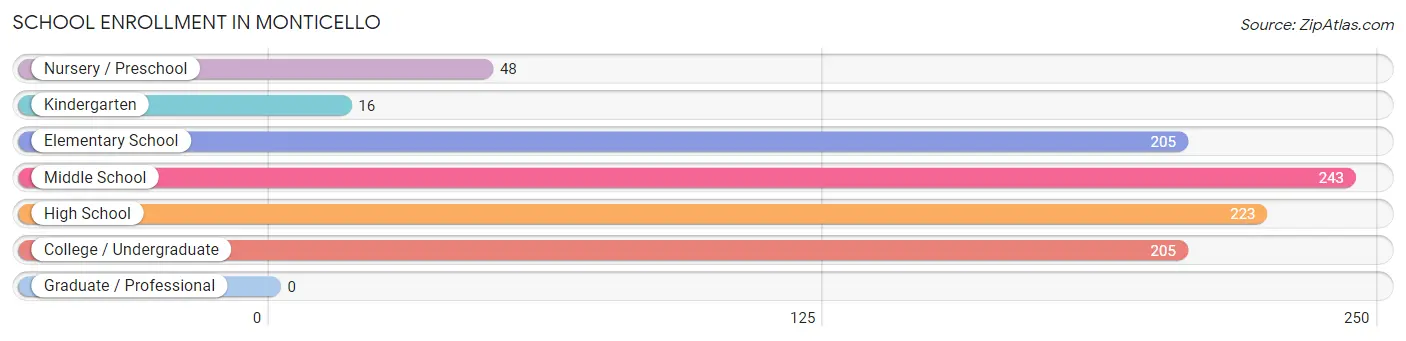
School Enrollment in Monticello
The most common levels of schooling among the 940 students in Monticello are middle school (243 | 25.9%), high school (223 | 23.7%), and elementary school (205 | 21.8%).
| School Level | # Students | % Students |
| Nursery / Preschool | 48 | 5.1% |
| Kindergarten | 16 | 1.7% |
| Elementary School | 205 | 21.8% |
| Middle School | 243 | 25.9% |
| High School | 223 | 23.7% |
| College / Undergraduate | 205 | 21.8% |
| Graduate / Professional | 0 | 0.0% |
| Total | 940 | 100.0% |
School Enrollment by Age by Funding Source in Monticello
Out of a total of 940 students who are enrolled in schools in Monticello, 186 (19.8%) attend a private institution, while the remaining 754 (80.2%) are enrolled in public schools. The age group of 35 years and over has the highest likelihood of being enrolled in private schools, with 17 (42.5% in the age bracket) enrolled. Conversely, the age group of 3 to 4 year olds has the lowest likelihood of being enrolled in a private school, with 40 (100.0% in the age bracket) attending a public institution.
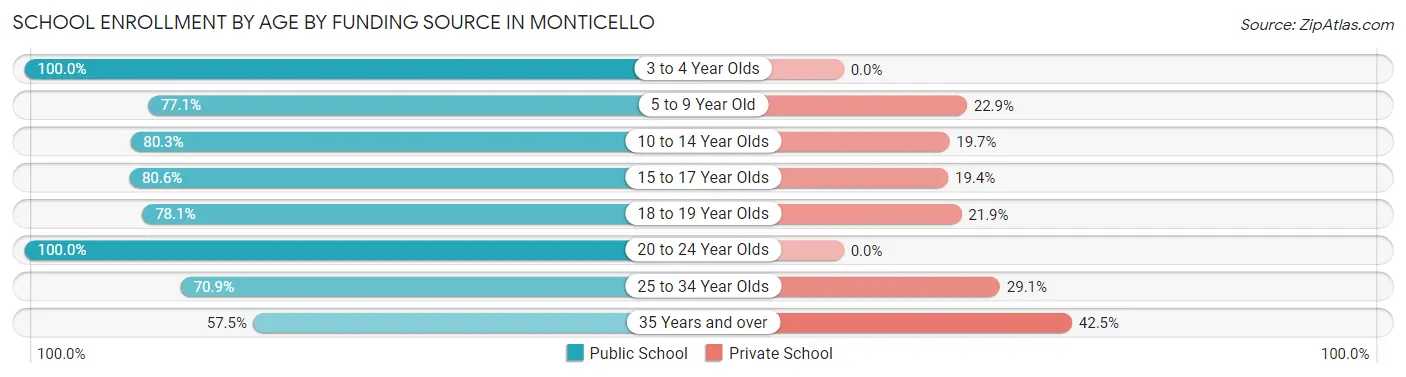
| Age Bracket | Public School | Private School |
| 3 to 4 Year Olds | 40 (100.0%) | 0 (0.0%) |
| 5 to 9 Year Old | 215 (77.1%) | 64 (22.9%) |
| 10 to 14 Year Olds | 155 (80.3%) | 38 (19.7%) |
| 15 to 17 Year Olds | 145 (80.6%) | 35 (19.4%) |
| 18 to 19 Year Olds | 57 (78.1%) | 16 (21.9%) |
| 20 to 24 Year Olds | 80 (100.0%) | 0 (0.0%) |
| 25 to 34 Year Olds | 39 (70.9%) | 16 (29.1%) |
| 35 Years and over | 23 (57.5%) | 17 (42.5%) |
| Total | 754 (80.2%) | 186 (19.8%) |
Educational Attainment by Field of Study in Monticello
Education (125 | 21.9%), communications (119 | 20.9%), business (95 | 16.7%), science & technology (79 | 13.9%), and physical & health sciences (59 | 10.3%) are the most common fields of study among 570 individuals in Monticello who have obtained a bachelor's degree or higher.
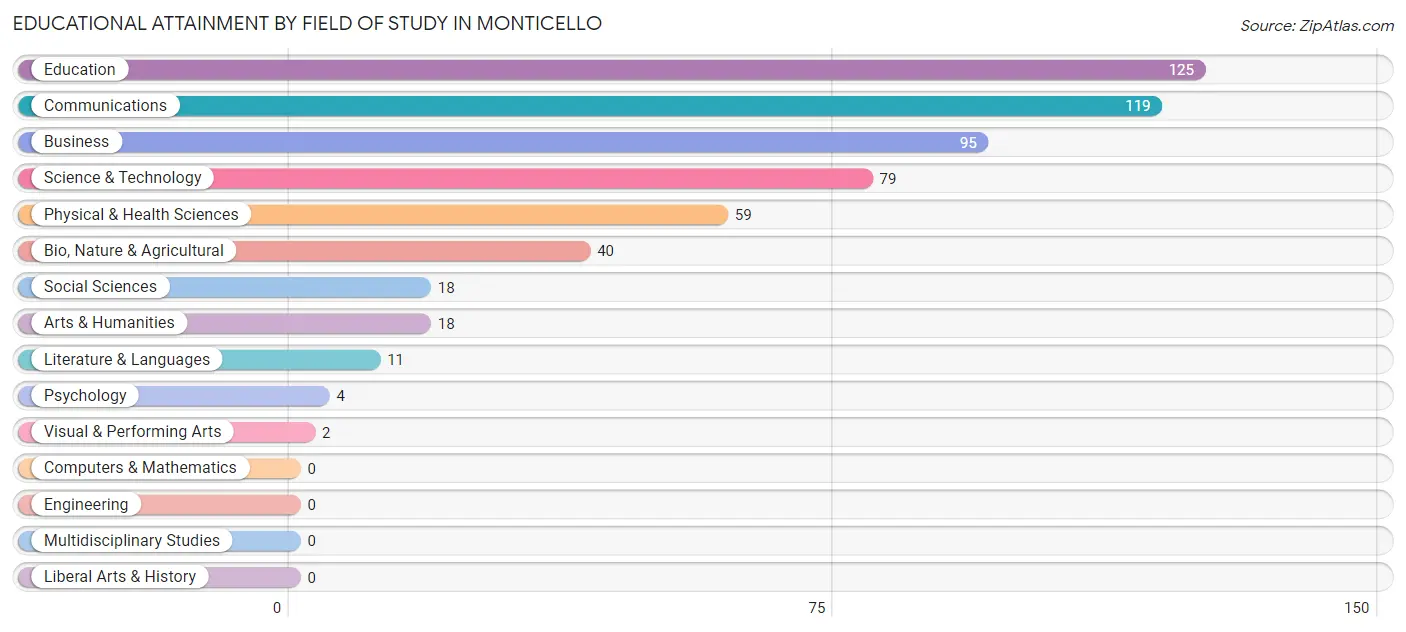
| Field of Study | # Graduates | % Graduates |
| Computers & Mathematics | 0 | 0.0% |
| Bio, Nature & Agricultural | 40 | 7.0% |
| Physical & Health Sciences | 59 | 10.3% |
| Psychology | 4 | 0.7% |
| Social Sciences | 18 | 3.2% |
| Engineering | 0 | 0.0% |
| Multidisciplinary Studies | 0 | 0.0% |
| Science & Technology | 79 | 13.9% |
| Business | 95 | 16.7% |
| Education | 125 | 21.9% |
| Literature & Languages | 11 | 1.9% |
| Liberal Arts & History | 0 | 0.0% |
| Visual & Performing Arts | 2 | 0.4% |
| Communications | 119 | 20.9% |
| Arts & Humanities | 18 | 3.2% |
| Total | 570 | 100.0% |
Transportation & Commute in Monticello
Vehicle Availability by Sex in Monticello
The most prevalent vehicle ownership categories in Monticello are males with 2 vehicles (644, accounting for 53.9%) and females with 2 vehicles (490, making up 58.5%).
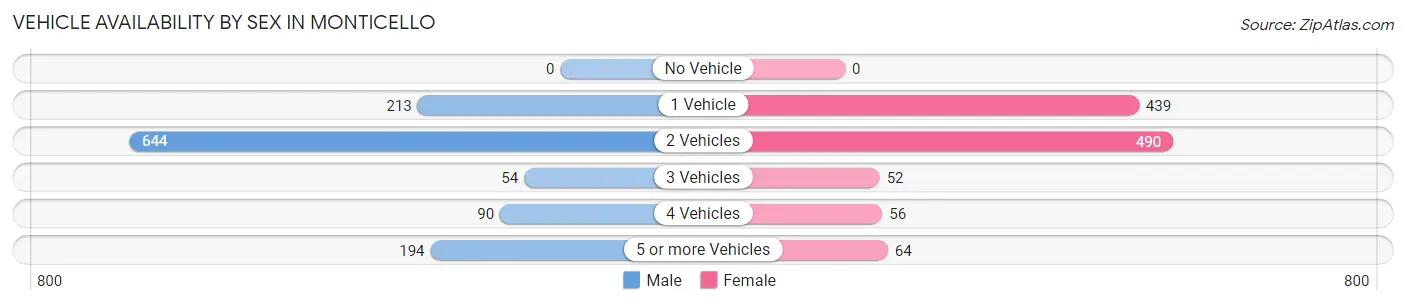
| Vehicles Available | Male | Female |
| No Vehicle | 0 (0.0%) | 0 (0.0%) |
| 1 Vehicle | 213 (17.8%) | 439 (39.9%) |
| 2 Vehicles | 644 (53.9%) | 490 (44.5%) |
| 3 Vehicles | 54 (4.5%) | 52 (4.7%) |
| 4 Vehicles | 90 (7.5%) | 56 (5.1%) |
| 5 or more Vehicles | 194 (16.2%) | 64 (5.8%) |
| Total | 1,195 (100.0%) | 1,101 (100.0%) |
Commute Time in Monticello
The most frequently occuring commute durations in Monticello are 5 to 9 minutes (667 commuters, 29.9%), 10 to 14 minutes (271 commuters, 12.1%), and 20 to 24 minutes (260 commuters, 11.6%).
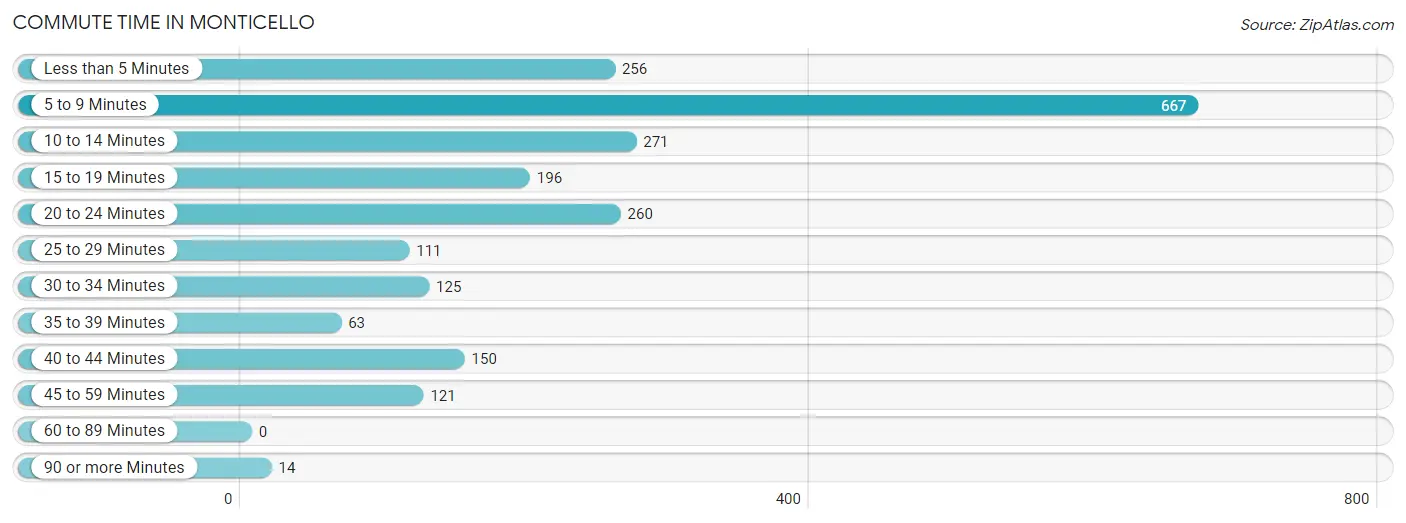
| Commute Time | # Commuters | % Commuters |
| Less than 5 Minutes | 256 | 11.5% |
| 5 to 9 Minutes | 667 | 29.9% |
| 10 to 14 Minutes | 271 | 12.1% |
| 15 to 19 Minutes | 196 | 8.8% |
| 20 to 24 Minutes | 260 | 11.6% |
| 25 to 29 Minutes | 111 | 5.0% |
| 30 to 34 Minutes | 125 | 5.6% |
| 35 to 39 Minutes | 63 | 2.8% |
| 40 to 44 Minutes | 150 | 6.7% |
| 45 to 59 Minutes | 121 | 5.4% |
| 60 to 89 Minutes | 0 | 0.0% |
| 90 or more Minutes | 14 | 0.6% |
Commute Time by Sex in Monticello
The most common commute times in Monticello are 5 to 9 minutes (245 commuters, 20.9%) for males and 5 to 9 minutes (422 commuters, 39.8%) for females.
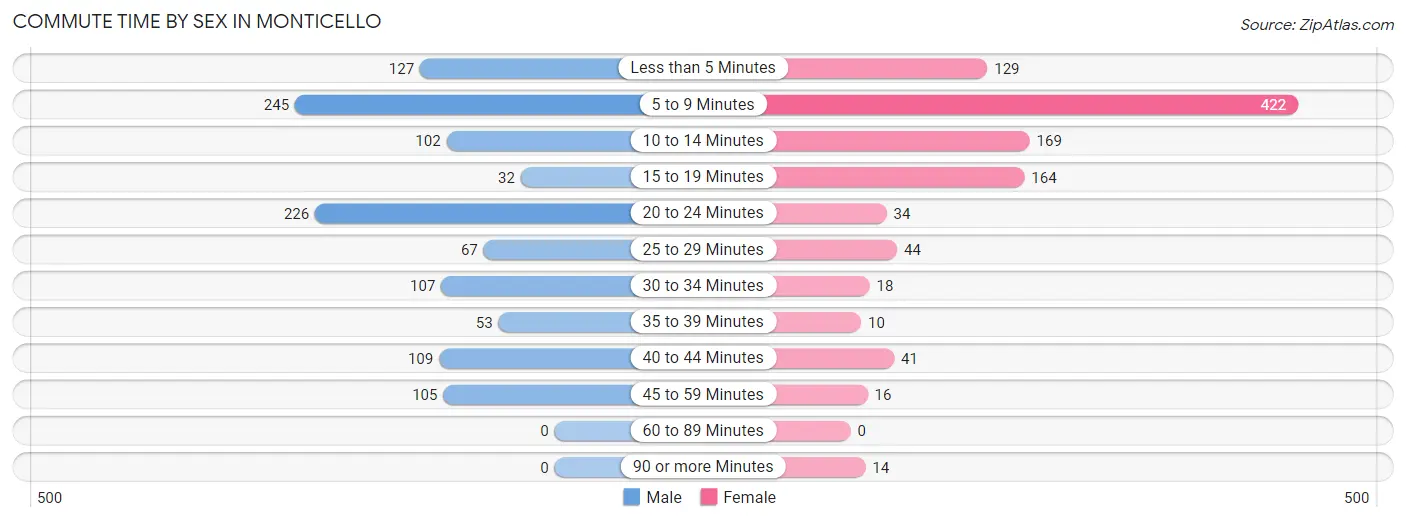
| Commute Time | Male | Female |
| Less than 5 Minutes | 127 (10.8%) | 129 (12.2%) |
| 5 to 9 Minutes | 245 (20.9%) | 422 (39.8%) |
| 10 to 14 Minutes | 102 (8.7%) | 169 (15.9%) |
| 15 to 19 Minutes | 32 (2.7%) | 164 (15.5%) |
| 20 to 24 Minutes | 226 (19.3%) | 34 (3.2%) |
| 25 to 29 Minutes | 67 (5.7%) | 44 (4.2%) |
| 30 to 34 Minutes | 107 (9.1%) | 18 (1.7%) |
| 35 to 39 Minutes | 53 (4.5%) | 10 (0.9%) |
| 40 to 44 Minutes | 109 (9.3%) | 41 (3.9%) |
| 45 to 59 Minutes | 105 (8.9%) | 16 (1.5%) |
| 60 to 89 Minutes | 0 (0.0%) | 0 (0.0%) |
| 90 or more Minutes | 0 (0.0%) | 14 (1.3%) |
Time of Departure to Work by Sex in Monticello
The most frequent times of departure to work in Monticello are 7:30 AM to 7:59 AM (293, 25.0%) for males and 7:00 AM to 7:29 AM (222, 20.9%) for females.
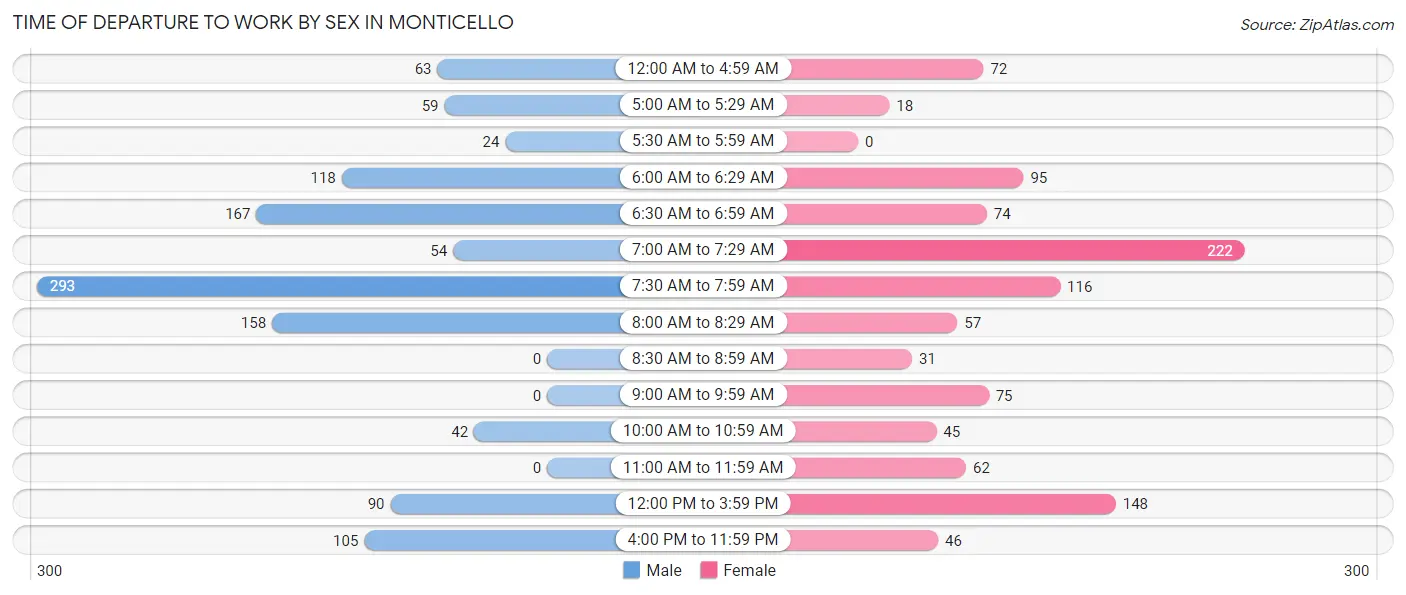
| Time of Departure | Male | Female |
| 12:00 AM to 4:59 AM | 63 (5.4%) | 72 (6.8%) |
| 5:00 AM to 5:29 AM | 59 (5.0%) | 18 (1.7%) |
| 5:30 AM to 5:59 AM | 24 (2.1%) | 0 (0.0%) |
| 6:00 AM to 6:29 AM | 118 (10.1%) | 95 (8.9%) |
| 6:30 AM to 6:59 AM | 167 (14.2%) | 74 (7.0%) |
| 7:00 AM to 7:29 AM | 54 (4.6%) | 222 (20.9%) |
| 7:30 AM to 7:59 AM | 293 (25.0%) | 116 (10.9%) |
| 8:00 AM to 8:29 AM | 158 (13.5%) | 57 (5.4%) |
| 8:30 AM to 8:59 AM | 0 (0.0%) | 31 (2.9%) |
| 9:00 AM to 9:59 AM | 0 (0.0%) | 75 (7.1%) |
| 10:00 AM to 10:59 AM | 42 (3.6%) | 45 (4.2%) |
| 11:00 AM to 11:59 AM | 0 (0.0%) | 62 (5.8%) |
| 12:00 PM to 3:59 PM | 90 (7.7%) | 148 (14.0%) |
| 4:00 PM to 11:59 PM | 105 (8.9%) | 46 (4.3%) |
| Total | 1,173 (100.0%) | 1,061 (100.0%) |
Housing Occupancy in Monticello
Occupancy by Ownership in Monticello
Of the total 2,601 dwellings in Monticello, owner-occupied units account for 1,622 (62.4%), while renter-occupied units make up 979 (37.6%).
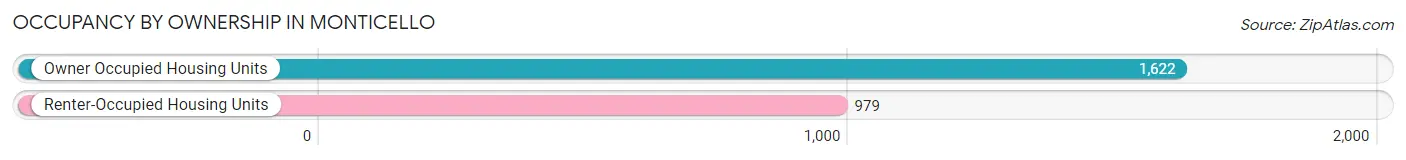
| Occupancy | # Housing Units | % Housing Units |
| Owner Occupied Housing Units | 1,622 | 62.4% |
| Renter-Occupied Housing Units | 979 | 37.6% |
| Total Occupied Housing Units | 2,601 | 100.0% |
Occupancy by Household Size in Monticello
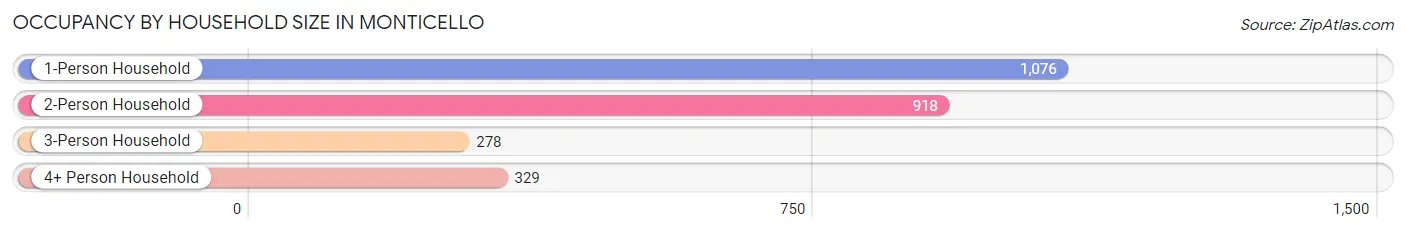
| Household Size | # Housing Units | % Housing Units |
| 1-Person Household | 1,076 | 41.4% |
| 2-Person Household | 918 | 35.3% |
| 3-Person Household | 278 | 10.7% |
| 4+ Person Household | 329 | 12.7% |
| Total Housing Units | 2,601 | 100.0% |
Occupancy by Ownership by Household Size in Monticello
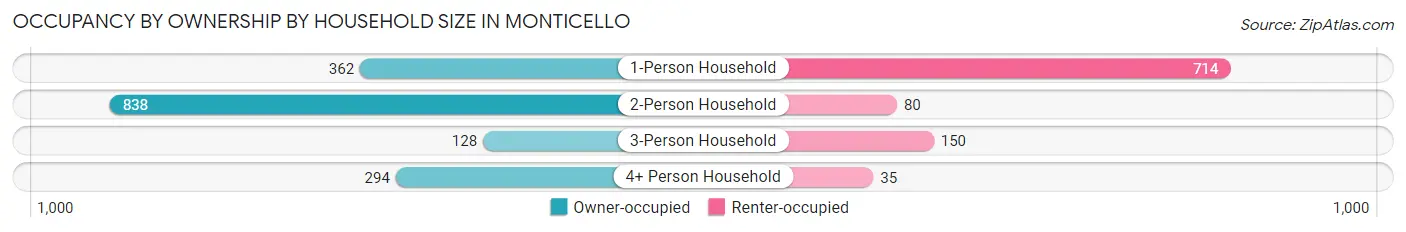
| Household Size | Owner-occupied | Renter-occupied |
| 1-Person Household | 362 (33.6%) | 714 (66.4%) |
| 2-Person Household | 838 (91.3%) | 80 (8.7%) |
| 3-Person Household | 128 (46.0%) | 150 (54.0%) |
| 4+ Person Household | 294 (89.4%) | 35 (10.6%) |
| Total Housing Units | 1,622 (62.4%) | 979 (37.6%) |
Occupancy by Educational Attainment in Monticello
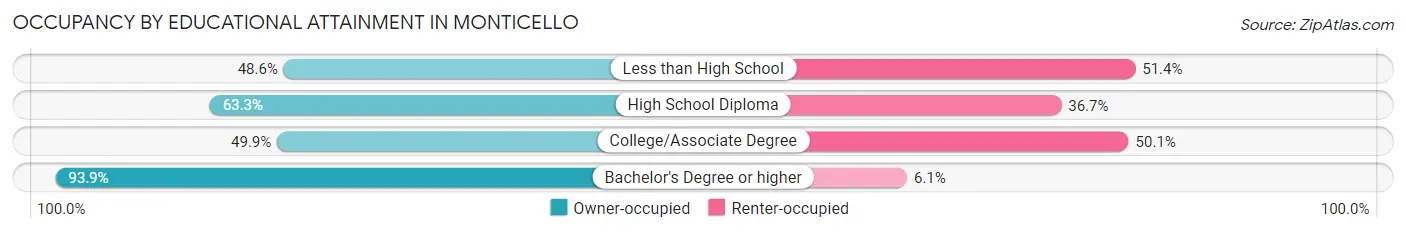
| Household Size | Owner-occupied | Renter-occupied |
| Less than High School | 53 (48.6%) | 56 (51.4%) |
| High School Diploma | 788 (63.3%) | 457 (36.7%) |
| College/Associate Degree | 443 (49.9%) | 444 (50.1%) |
| Bachelor's Degree or higher | 338 (93.9%) | 22 (6.1%) |
Occupancy by Age of Householder in Monticello
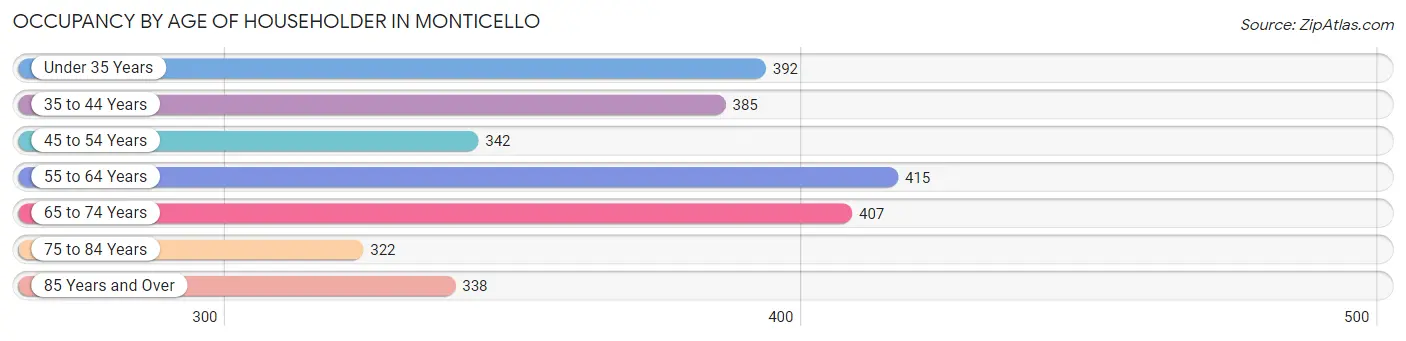
| Age Bracket | # Households | % Households |
| Under 35 Years | 392 | 15.1% |
| 35 to 44 Years | 385 | 14.8% |
| 45 to 54 Years | 342 | 13.2% |
| 55 to 64 Years | 415 | 16.0% |
| 65 to 74 Years | 407 | 15.7% |
| 75 to 84 Years | 322 | 12.4% |
| 85 Years and Over | 338 | 13.0% |
| Total | 2,601 | 100.0% |
Housing Finances in Monticello
Median Income by Occupancy in Monticello
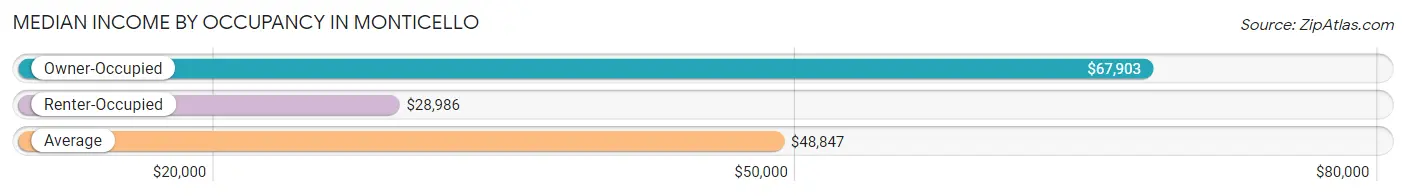
| Occupancy Type | # Households | Median Income |
| Owner-Occupied | 1,622 (62.4%) | $67,903 |
| Renter-Occupied | 979 (37.6%) | $28,986 |
| Average | 2,601 (100.0%) | $48,847 |
Occupancy by Householder Income Bracket in Monticello
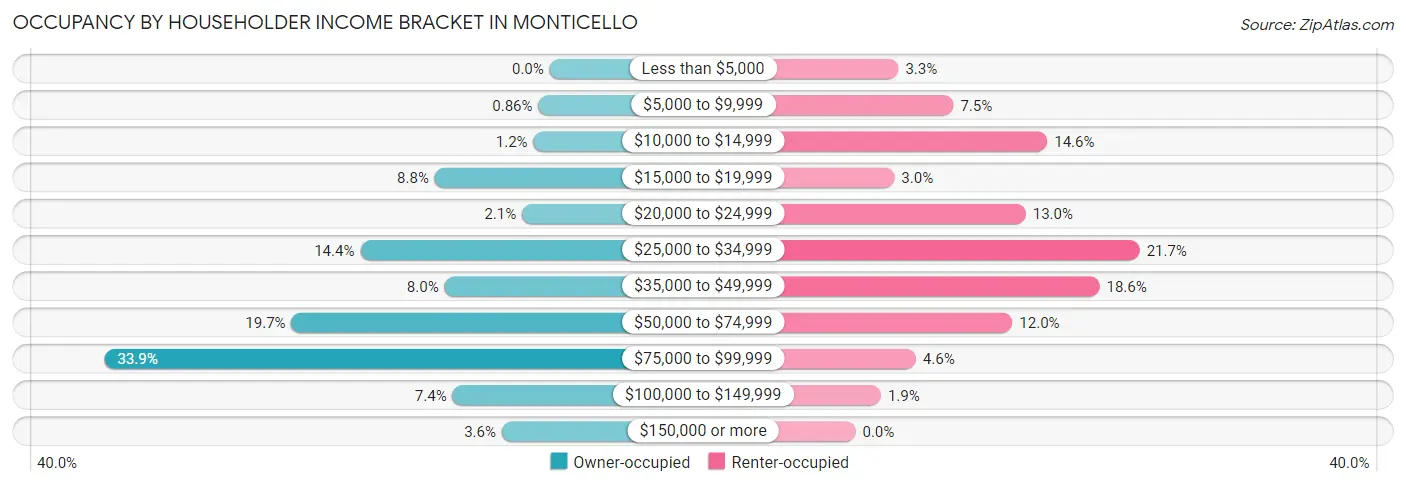
| Income Bracket | Owner-occupied | Renter-occupied |
| Less than $5,000 | 0 (0.0%) | 32 (3.3%) |
| $5,000 to $9,999 | 14 (0.9%) | 73 (7.5%) |
| $10,000 to $14,999 | 20 (1.2%) | 143 (14.6%) |
| $15,000 to $19,999 | 142 (8.7%) | 29 (3.0%) |
| $20,000 to $24,999 | 34 (2.1%) | 127 (13.0%) |
| $25,000 to $34,999 | 234 (14.4%) | 212 (21.6%) |
| $35,000 to $49,999 | 130 (8.0%) | 182 (18.6%) |
| $50,000 to $74,999 | 319 (19.7%) | 117 (11.9%) |
| $75,000 to $99,999 | 550 (33.9%) | 45 (4.6%) |
| $100,000 to $149,999 | 120 (7.4%) | 19 (1.9%) |
| $150,000 or more | 59 (3.6%) | 0 (0.0%) |
| Total | 1,622 (100.0%) | 979 (100.0%) |
Monthly Housing Cost Tiers in Monticello
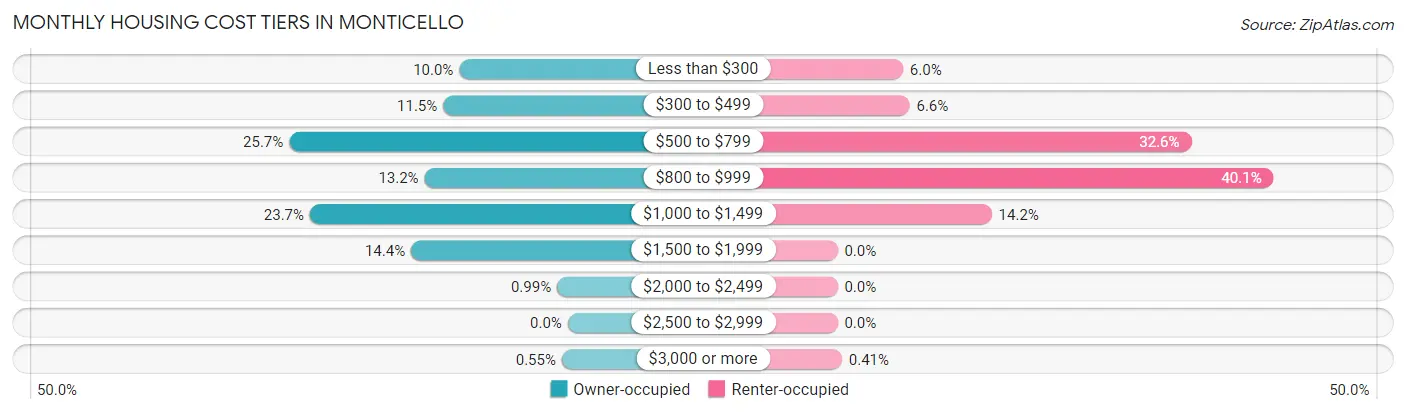
| Monthly Cost | Owner-occupied | Renter-occupied |
| Less than $300 | 162 (10.0%) | 59 (6.0%) |
| $300 to $499 | 186 (11.5%) | 65 (6.6%) |
| $500 to $799 | 416 (25.7%) | 319 (32.6%) |
| $800 to $999 | 214 (13.2%) | 393 (40.1%) |
| $1,000 to $1,499 | 385 (23.7%) | 139 (14.2%) |
| $1,500 to $1,999 | 234 (14.4%) | 0 (0.0%) |
| $2,000 to $2,499 | 16 (1.0%) | 0 (0.0%) |
| $2,500 to $2,999 | 0 (0.0%) | 0 (0.0%) |
| $3,000 or more | 9 (0.5%) | 4 (0.4%) |
| Total | 1,622 (100.0%) | 979 (100.0%) |
Physical Housing Characteristics in Monticello
Housing Structures in Monticello
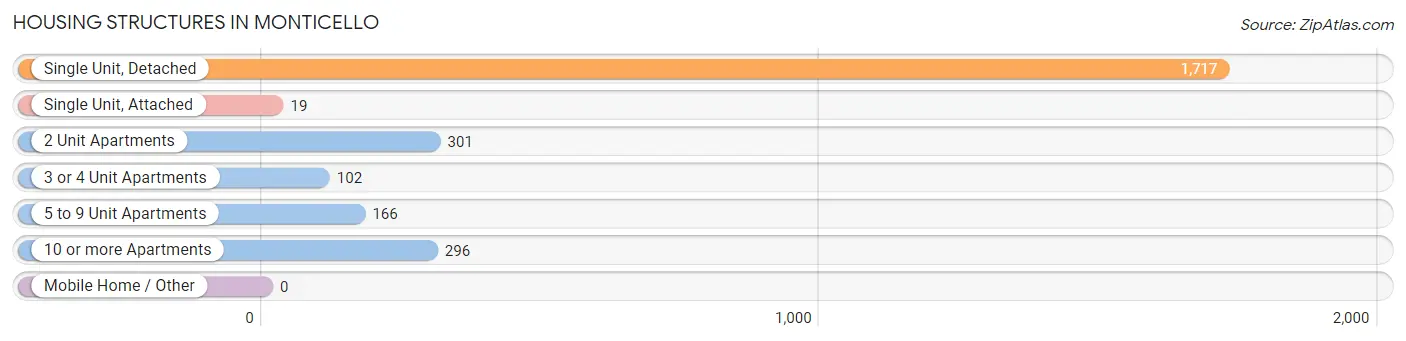
| Structure Type | # Housing Units | % Housing Units |
| Single Unit, Detached | 1,717 | 66.0% |
| Single Unit, Attached | 19 | 0.7% |
| 2 Unit Apartments | 301 | 11.6% |
| 3 or 4 Unit Apartments | 102 | 3.9% |
| 5 to 9 Unit Apartments | 166 | 6.4% |
| 10 or more Apartments | 296 | 11.4% |
| Mobile Home / Other | 0 | 0.0% |
| Total | 2,601 | 100.0% |
Housing Structures by Occupancy in Monticello
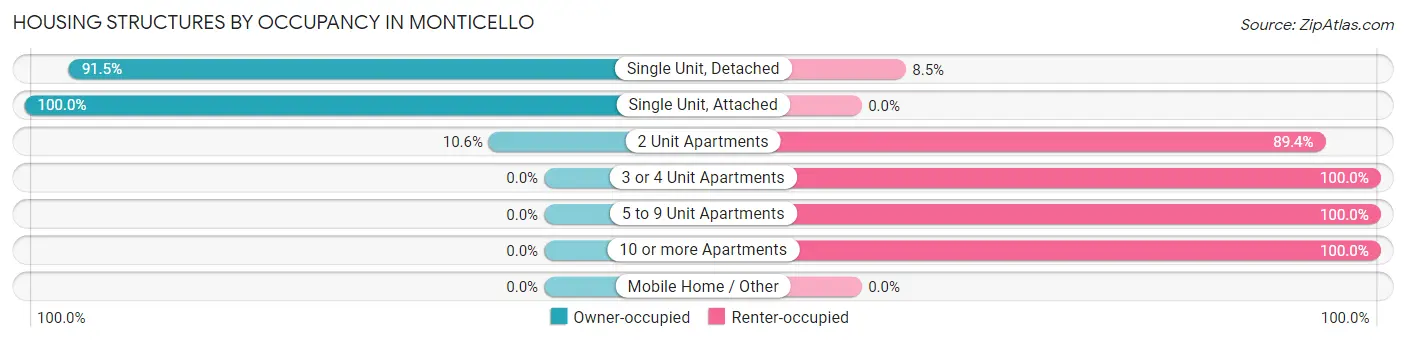
| Structure Type | Owner-occupied | Renter-occupied |
| Single Unit, Detached | 1,571 (91.5%) | 146 (8.5%) |
| Single Unit, Attached | 19 (100.0%) | 0 (0.0%) |
| 2 Unit Apartments | 32 (10.6%) | 269 (89.4%) |
| 3 or 4 Unit Apartments | 0 (0.0%) | 102 (100.0%) |
| 5 to 9 Unit Apartments | 0 (0.0%) | 166 (100.0%) |
| 10 or more Apartments | 0 (0.0%) | 296 (100.0%) |
| Mobile Home / Other | 0 (0.0%) | 0 (0.0%) |
| Total | 1,622 (62.4%) | 979 (37.6%) |
Housing Structures by Number of Rooms in Monticello
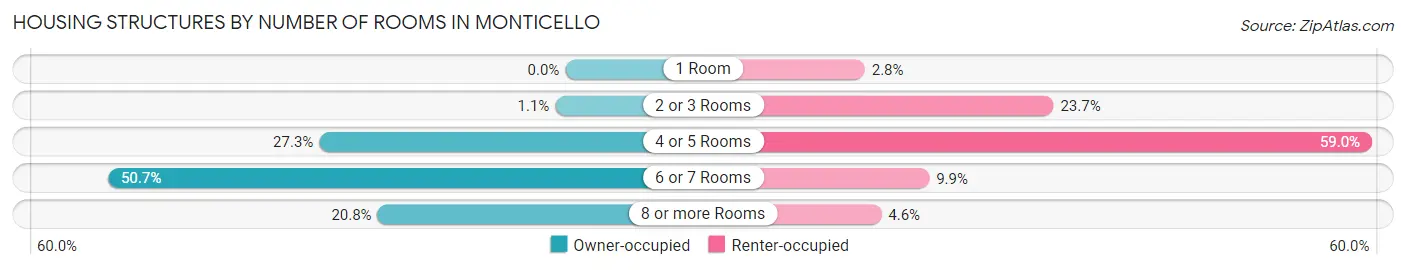
| Number of Rooms | Owner-occupied | Renter-occupied |
| 1 Room | 0 (0.0%) | 27 (2.8%) |
| 2 or 3 Rooms | 18 (1.1%) | 232 (23.7%) |
| 4 or 5 Rooms | 443 (27.3%) | 578 (59.0%) |
| 6 or 7 Rooms | 823 (50.7%) | 97 (9.9%) |
| 8 or more Rooms | 338 (20.8%) | 45 (4.6%) |
| Total | 1,622 (100.0%) | 979 (100.0%) |
Housing Structure by Heating Type in Monticello
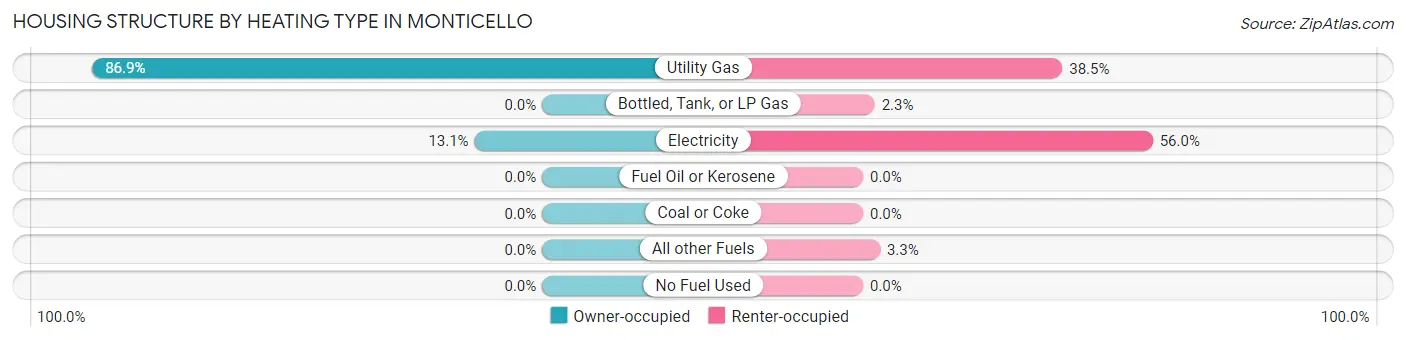
| Heating Type | Owner-occupied | Renter-occupied |
| Utility Gas | 1,410 (86.9%) | 377 (38.5%) |
| Bottled, Tank, or LP Gas | 0 (0.0%) | 22 (2.2%) |
| Electricity | 212 (13.1%) | 548 (56.0%) |
| Fuel Oil or Kerosene | 0 (0.0%) | 0 (0.0%) |
| Coal or Coke | 0 (0.0%) | 0 (0.0%) |
| All other Fuels | 0 (0.0%) | 32 (3.3%) |
| No Fuel Used | 0 (0.0%) | 0 (0.0%) |
| Total | 1,622 (100.0%) | 979 (100.0%) |
Household Vehicle Usage in Monticello
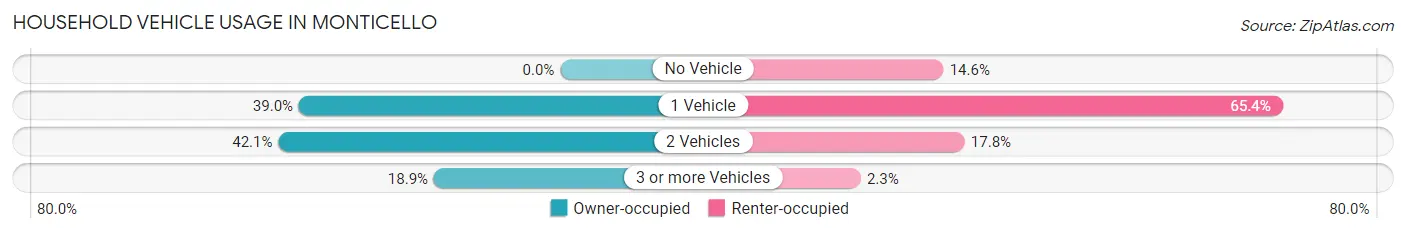
| Vehicles per Household | Owner-occupied | Renter-occupied |
| No Vehicle | 0 (0.0%) | 143 (14.6%) |
| 1 Vehicle | 633 (39.0%) | 640 (65.4%) |
| 2 Vehicles | 683 (42.1%) | 174 (17.8%) |
| 3 or more Vehicles | 306 (18.9%) | 22 (2.2%) |
| Total | 1,622 (100.0%) | 979 (100.0%) |
Real Estate & Mortgages in Monticello
Real Estate and Mortgage Overview in Monticello
| Characteristic | Without Mortgage | With Mortgage |
| Housing Units | 597 | 1,025 |
| Median Property Value | $129,900 | $116,900 |
| Median Household Income | $31,745 | $54 |
| Monthly Housing Costs | $461 | $9 |
| Real Estate Taxes | $940 | $0 |
Property Value by Mortgage Status in Monticello
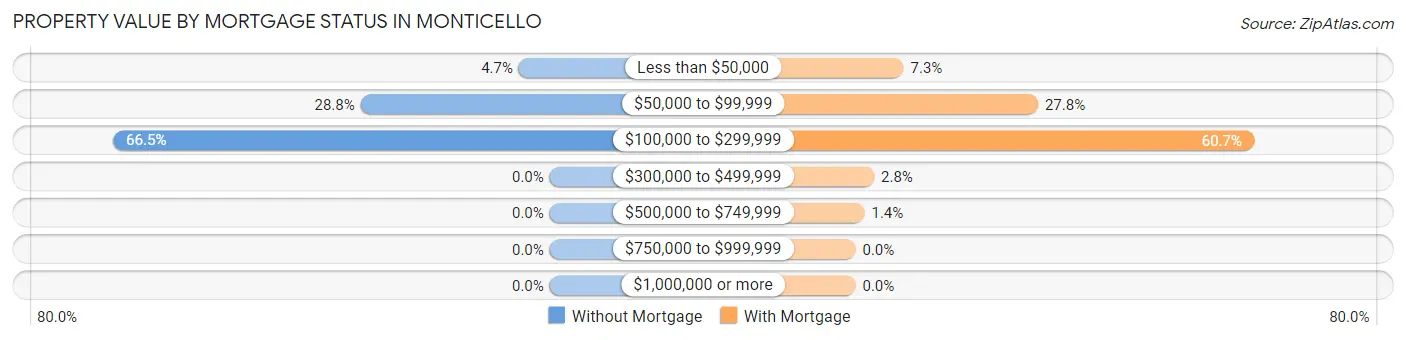
| Property Value | Without Mortgage | With Mortgage |
| Less than $50,000 | 28 (4.7%) | 75 (7.3%) |
| $50,000 to $99,999 | 172 (28.8%) | 285 (27.8%) |
| $100,000 to $299,999 | 397 (66.5%) | 622 (60.7%) |
| $300,000 to $499,999 | 0 (0.0%) | 29 (2.8%) |
| $500,000 to $749,999 | 0 (0.0%) | 14 (1.4%) |
| $750,000 to $999,999 | 0 (0.0%) | 0 (0.0%) |
| $1,000,000 or more | 0 (0.0%) | 0 (0.0%) |
| Total | 597 (100.0%) | 1,025 (100.0%) |
Household Income by Mortgage Status in Monticello
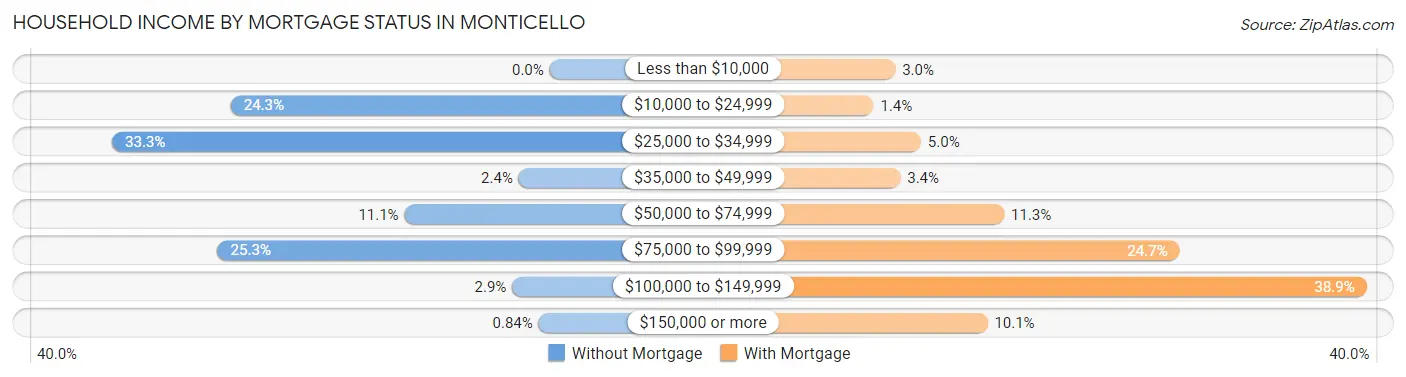
| Household Income | Without Mortgage | With Mortgage |
| Less than $10,000 | 0 (0.0%) | 31 (3.0%) |
| $10,000 to $24,999 | 145 (24.3%) | 14 (1.4%) |
| $25,000 to $34,999 | 199 (33.3%) | 51 (5.0%) |
| $35,000 to $49,999 | 14 (2.4%) | 35 (3.4%) |
| $50,000 to $74,999 | 66 (11.1%) | 116 (11.3%) |
| $75,000 to $99,999 | 151 (25.3%) | 253 (24.7%) |
| $100,000 to $149,999 | 17 (2.9%) | 399 (38.9%) |
| $150,000 or more | 5 (0.8%) | 103 (10.1%) |
| Total | 597 (100.0%) | 1,025 (100.0%) |
Property Value to Household Income Ratio in Monticello
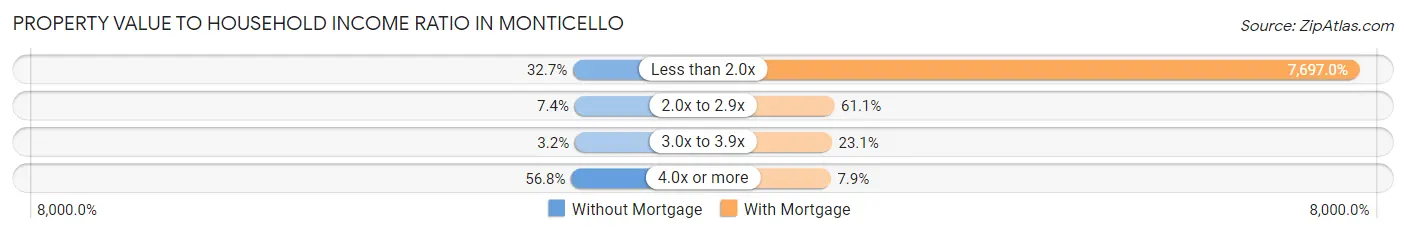
| Value-to-Income Ratio | Without Mortgage | With Mortgage |
| Less than 2.0x | 195 (32.7%) | 78,894 (7,697.0%) |
| 2.0x to 2.9x | 44 (7.4%) | 626 (61.1%) |
| 3.0x to 3.9x | 19 (3.2%) | 237 (23.1%) |
| 4.0x or more | 339 (56.8%) | 81 (7.9%) |
| Total | 597 (100.0%) | 1,025 (100.0%) |
Real Estate Taxes by Mortgage Status in Monticello
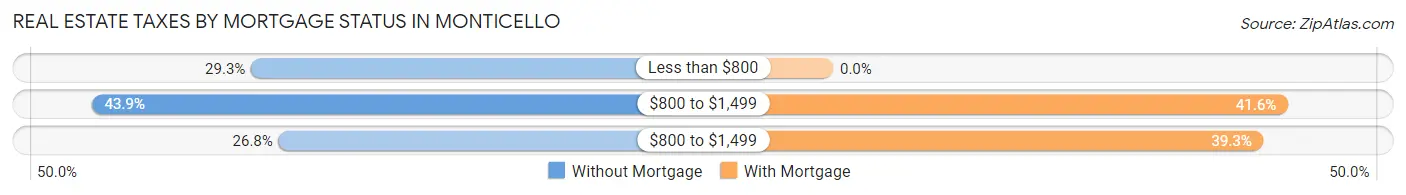
| Property Taxes | Without Mortgage | With Mortgage |
| Less than $800 | 175 (29.3%) | 0 (0.0%) |
| $800 to $1,499 | 262 (43.9%) | 426 (41.6%) |
| $800 to $1,499 | 160 (26.8%) | 403 (39.3%) |
| Total | 597 (100.0%) | 1,025 (100.0%) |
Health & Disability in Monticello
Health Insurance Coverage by Age in Monticello
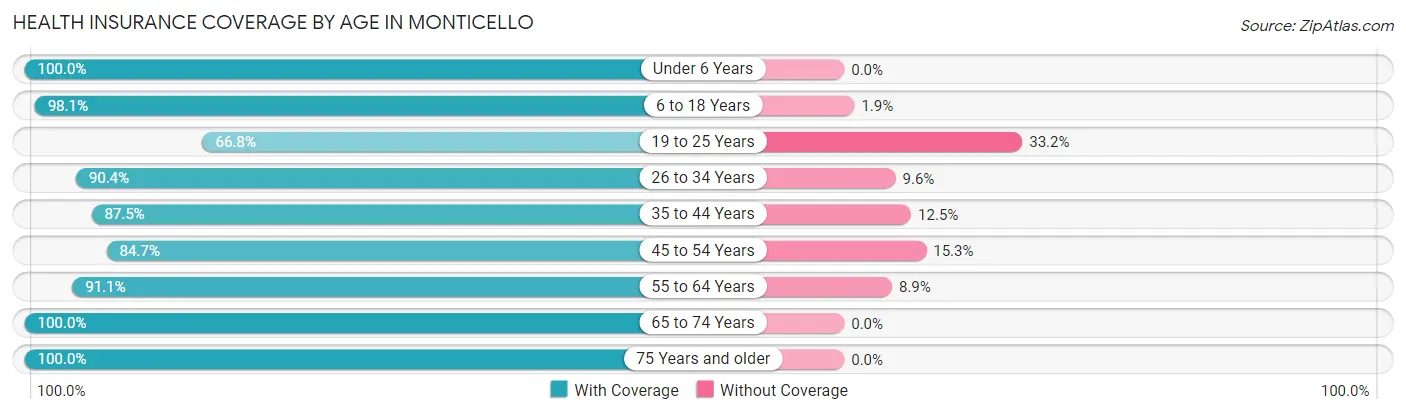
| Age Bracket | With Coverage | Without Coverage |
| Under 6 Years | 222 (100.0%) | 0 (0.0%) |
| 6 to 18 Years | 670 (98.1%) | 13 (1.9%) |
| 19 to 25 Years | 314 (66.8%) | 156 (33.2%) |
| 26 to 34 Years | 463 (90.4%) | 49 (9.6%) |
| 35 to 44 Years | 421 (87.5%) | 60 (12.5%) |
| 45 to 54 Years | 554 (84.7%) | 100 (15.3%) |
| 55 to 64 Years | 737 (91.1%) | 72 (8.9%) |
| 65 to 74 Years | 634 (100.0%) | 0 (0.0%) |
| 75 Years and older | 798 (100.0%) | 0 (0.0%) |
| Total | 4,813 (91.4%) | 450 (8.6%) |
Health Insurance Coverage by Citizenship Status in Monticello
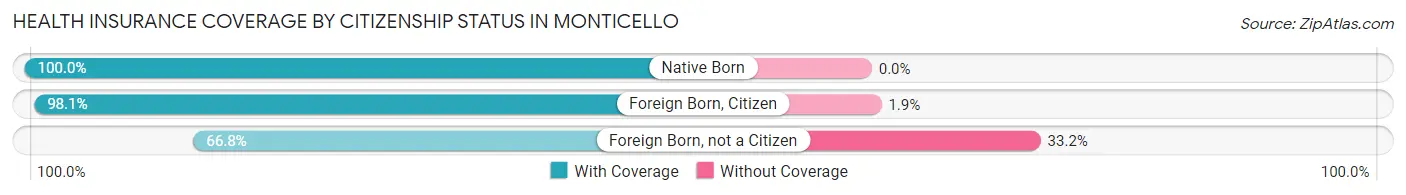
| Citizenship Status | With Coverage | Without Coverage |
| Native Born | 222 (100.0%) | 0 (0.0%) |
| Foreign Born, Citizen | 670 (98.1%) | 13 (1.9%) |
| Foreign Born, not a Citizen | 314 (66.8%) | 156 (33.2%) |
Health Insurance Coverage by Household Income in Monticello
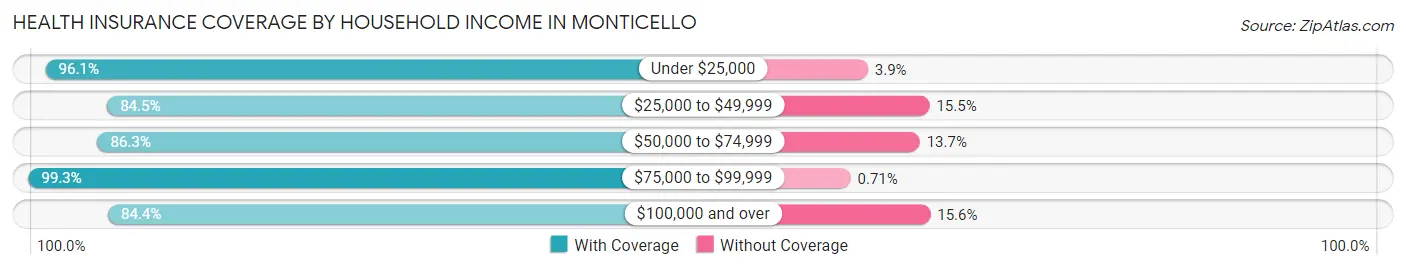
| Household Income | With Coverage | Without Coverage |
| Under $25,000 | 658 (96.1%) | 27 (3.9%) |
| $25,000 to $49,999 | 1,124 (84.5%) | 206 (15.5%) |
| $50,000 to $74,999 | 746 (86.3%) | 118 (13.7%) |
| $75,000 to $99,999 | 1,811 (99.3%) | 13 (0.7%) |
| $100,000 and over | 464 (84.4%) | 86 (15.6%) |
Public vs Private Health Insurance Coverage by Age in Monticello
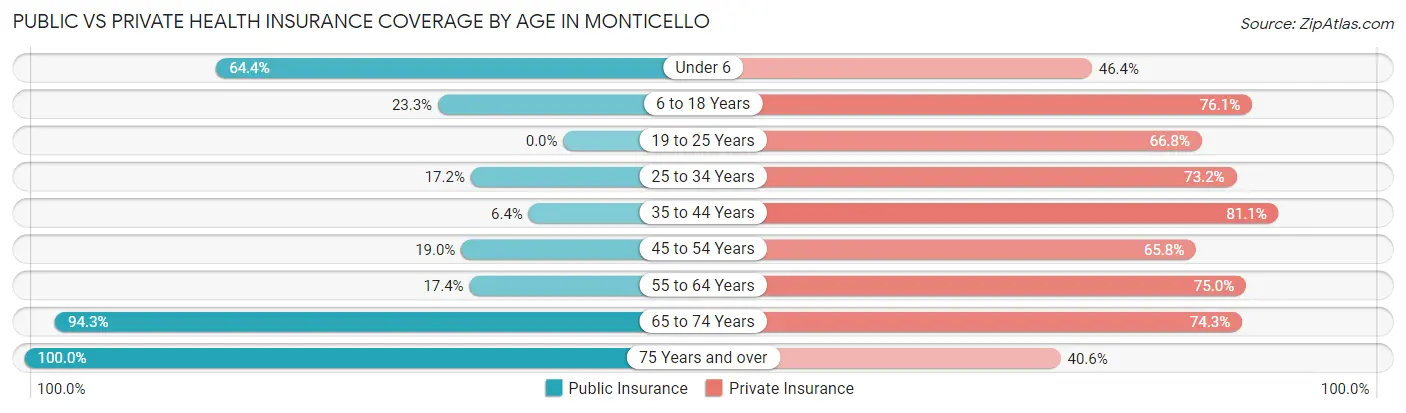
| Age Bracket | Public Insurance | Private Insurance |
| Under 6 | 143 (64.4%) | 103 (46.4%) |
| 6 to 18 Years | 159 (23.3%) | 520 (76.1%) |
| 19 to 25 Years | 0 (0.0%) | 314 (66.8%) |
| 25 to 34 Years | 88 (17.2%) | 375 (73.2%) |
| 35 to 44 Years | 31 (6.4%) | 390 (81.1%) |
| 45 to 54 Years | 124 (19.0%) | 430 (65.7%) |
| 55 to 64 Years | 141 (17.4%) | 607 (75.0%) |
| 65 to 74 Years | 598 (94.3%) | 471 (74.3%) |
| 75 Years and over | 798 (100.0%) | 324 (40.6%) |
| Total | 2,082 (39.6%) | 3,534 (67.1%) |
Disability Status by Sex by Age in Monticello
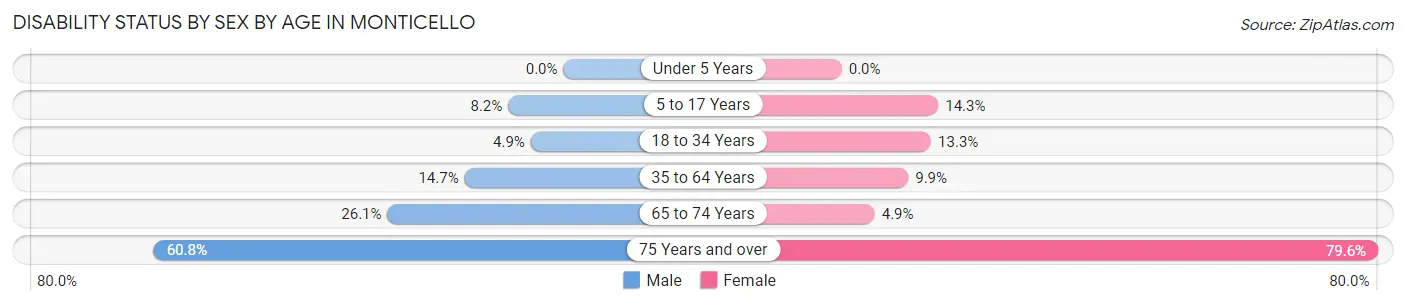
| Age Bracket | Male | Female |
| Under 5 Years | 0 (0.0%) | 0 (0.0%) |
| 5 to 17 Years | 30 (8.2%) | 42 (14.3%) |
| 18 to 34 Years | 21 (4.9%) | 78 (13.3%) |
| 35 to 64 Years | 144 (14.7%) | 95 (9.9%) |
| 65 to 74 Years | 75 (26.1%) | 17 (4.9%) |
| 75 Years and over | 208 (60.8%) | 363 (79.6%) |
Disability Class by Sex by Age in Monticello
Disability Class: Hearing Difficulty
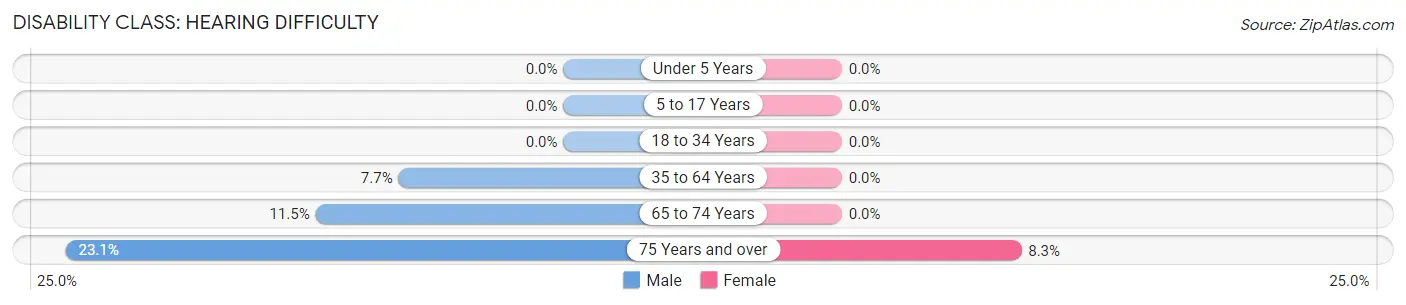
| Age Bracket | Male | Female |
| Under 5 Years | 0 (0.0%) | 0 (0.0%) |
| 5 to 17 Years | 0 (0.0%) | 0 (0.0%) |
| 18 to 34 Years | 0 (0.0%) | 0 (0.0%) |
| 35 to 64 Years | 75 (7.6%) | 0 (0.0%) |
| 65 to 74 Years | 33 (11.5%) | 0 (0.0%) |
| 75 Years and over | 79 (23.1%) | 38 (8.3%) |
Disability Class: Vision Difficulty
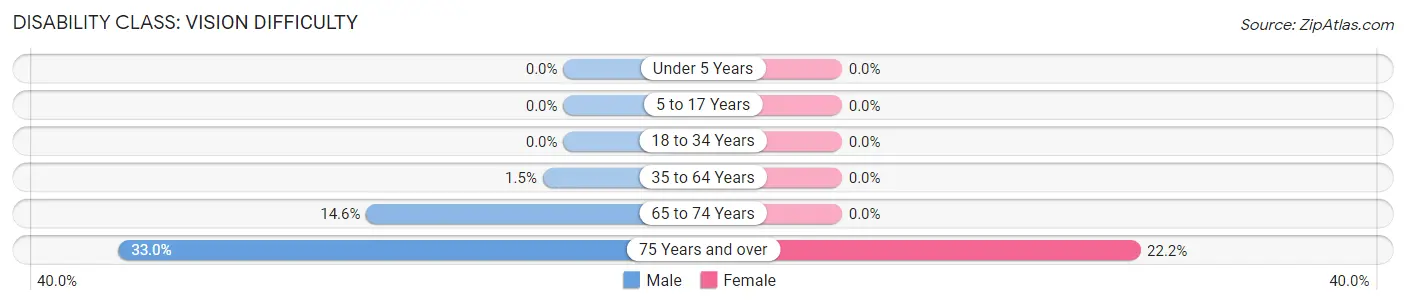
| Age Bracket | Male | Female |
| Under 5 Years | 0 (0.0%) | 0 (0.0%) |
| 5 to 17 Years | 0 (0.0%) | 0 (0.0%) |
| 18 to 34 Years | 0 (0.0%) | 0 (0.0%) |
| 35 to 64 Years | 15 (1.5%) | 0 (0.0%) |
| 65 to 74 Years | 42 (14.6%) | 0 (0.0%) |
| 75 Years and over | 113 (33.0%) | 101 (22.2%) |
Disability Class: Cognitive Difficulty
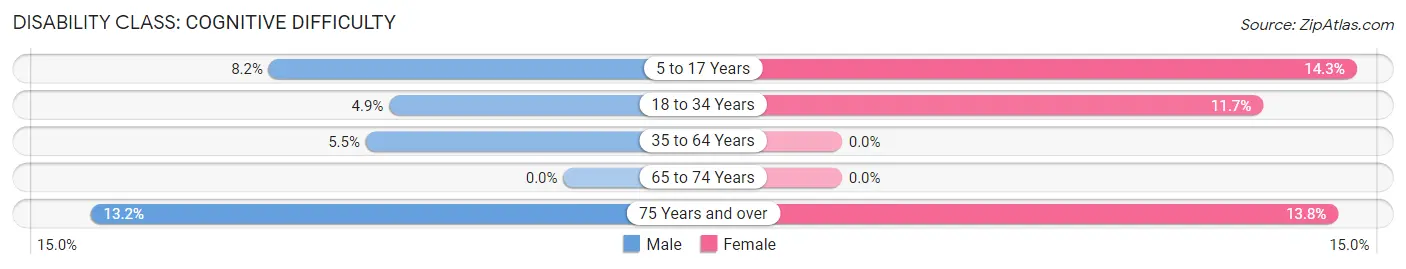
| Age Bracket | Male | Female |
| 5 to 17 Years | 30 (8.2%) | 42 (14.3%) |
| 18 to 34 Years | 21 (4.9%) | 69 (11.7%) |
| 35 to 64 Years | 54 (5.5%) | 0 (0.0%) |
| 65 to 74 Years | 0 (0.0%) | 0 (0.0%) |
| 75 Years and over | 45 (13.2%) | 63 (13.8%) |
Disability Class: Ambulatory Difficulty
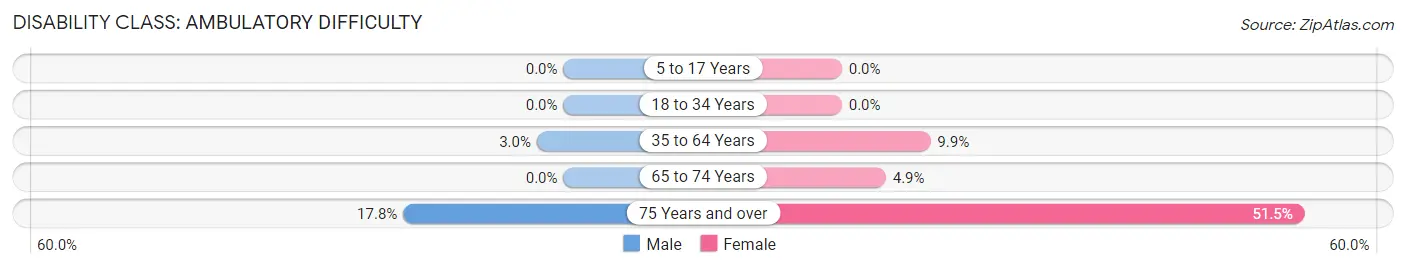
| Age Bracket | Male | Female |
| 5 to 17 Years | 0 (0.0%) | 0 (0.0%) |
| 18 to 34 Years | 0 (0.0%) | 0 (0.0%) |
| 35 to 64 Years | 29 (3.0%) | 95 (9.9%) |
| 65 to 74 Years | 0 (0.0%) | 17 (4.9%) |
| 75 Years and over | 61 (17.8%) | 235 (51.5%) |
Disability Class: Self-Care Difficulty
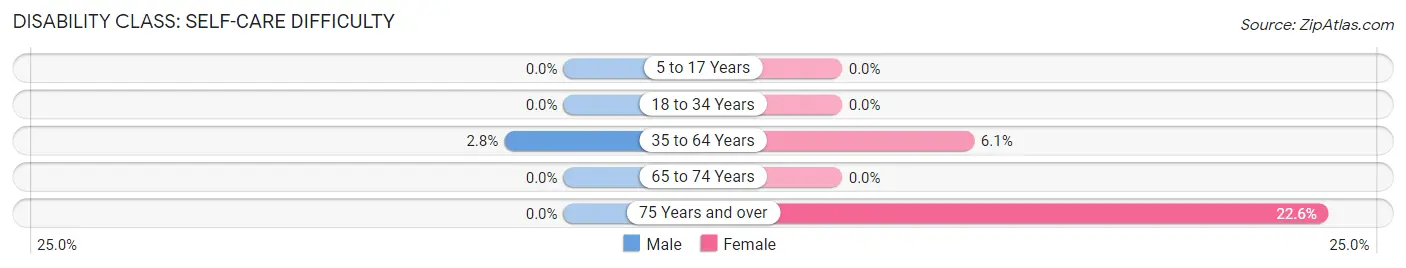
| Age Bracket | Male | Female |
| 5 to 17 Years | 0 (0.0%) | 0 (0.0%) |
| 18 to 34 Years | 0 (0.0%) | 0 (0.0%) |
| 35 to 64 Years | 27 (2.8%) | 59 (6.1%) |
| 65 to 74 Years | 0 (0.0%) | 0 (0.0%) |
| 75 Years and over | 0 (0.0%) | 103 (22.6%) |
Technology Access in Monticello
Computing Device Access in Monticello
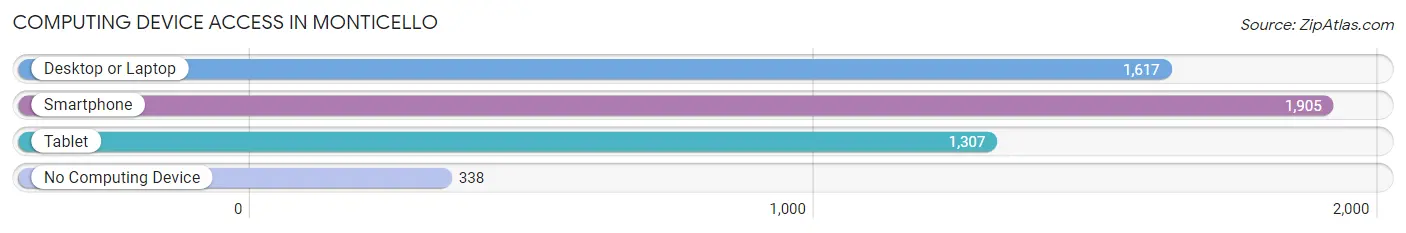
| Device Type | # Households | % Households |
| Desktop or Laptop | 1,617 | 62.2% |
| Smartphone | 1,905 | 73.2% |
| Tablet | 1,307 | 50.2% |
| No Computing Device | 338 | 13.0% |
| Total | 2,601 | 100.0% |
Internet Access in Monticello
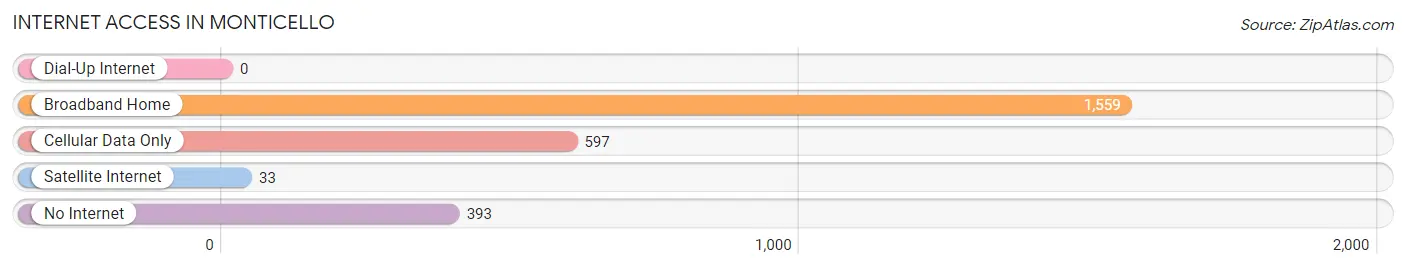
| Internet Type | # Households | % Households |
| Dial-Up Internet | 0 | 0.0% |
| Broadband Home | 1,559 | 59.9% |
| Cellular Data Only | 597 | 23.0% |
| Satellite Internet | 33 | 1.3% |
| No Internet | 393 | 15.1% |
| Total | 2,601 | 100.0% |
Monticello Summary
Monticello, Indiana is a small town located in White County, Indiana. It is situated in the Tippecanoe River Valley, approximately 40 miles northwest of Lafayette. The town was founded in 1834 and is the county seat of White County. The population of Monticello was 5,717 at the 2010 census.
History
Monticello was founded in 1834 by a group of settlers from Ohio and Kentucky. The town was named after Thomas Jefferson's estate in Virginia. The first post office was established in 1835 and the first courthouse was built in 1836. The town was incorporated in 1837.
Monticello was an important stop on the Wabash and Erie Canal, which opened in 1843. The canal provided a transportation route for goods and people between the Great Lakes and the Ohio River. The canal was a major factor in the growth of the town.
In the late 19th century, Monticello was a center of industry. The town had several factories, including a flour mill, a sawmill, a furniture factory, and a brickyard. The town also had a railroad line that connected it to other towns in the area.
Geography
Monticello is located at 40°45'N 86°48'W (40.75, -86.8). The town is situated in the Tippecanoe River Valley, approximately 40 miles northwest of Lafayette. The town is surrounded by rolling hills and farmland.
The climate in Monticello is humid continental, with hot summers and cold winters. The average annual temperature is 52°F (11°C). The average annual precipitation is 40 inches (101 cm).
Economy
The economy of Monticello is largely based on agriculture and manufacturing. The town is home to several factories, including a furniture factory, a sawmill, and a brickyard. The town also has a number of small businesses, including restaurants, shops, and service providers.
The town is also home to a number of tourist attractions, including the Tippecanoe River State Park, the White County Historical Museum, and the Monticello Opera House.
Demographics
As of the 2010 census, the population of Monticello was 5,717. The racial makeup of the town was 95.3% White, 0.7% African American, 0.3% Native American, 0.7% Asian, 0.1% Pacific Islander, 1.2% from other races, and 1.7% from two or more races. Hispanic or Latino of any race were 3.2% of the population.
The median household income in Monticello was $41,944, and the median family income was $50,919. The per capita income was $20,945. About 11.2% of families and 14.2% of the population were below the poverty line, including 19.2% of those under age 18 and 8.2% of those age 65 or over.
Common Questions
What is Per Capita Income in Monticello?
Per Capita income in Monticello is $28,847.
What is the Median Family Income in Monticello?
Median Family Income in Monticello is $69,264.
What is the Median Household income in Monticello?
Median Household Income in Monticello is $48,847.
What is Income or Wage Gap in Monticello?
Income or Wage Gap in Monticello is 35.8%.
Women in Monticello earn 64.2 cents for every dollar earned by a man.
What is Inequality or Gini Index in Monticello?
Inequality or Gini Index in Monticello is 0.41.
What is the Total Population of Monticello?
Total Population of Monticello is 5,488.
What is the Total Male Population of Monticello?
Total Male Population of Monticello is 2,645.
What is the Total Female Population of Monticello?
Total Female Population of Monticello is 2,843.
What is the Ratio of Males per 100 Females in Monticello?
There are 93.04 Males per 100 Females in Monticello.
What is the Ratio of Females per 100 Males in Monticello?
There are 107.49 Females per 100 Males in Monticello.
What is the Median Population Age in Monticello?
Median Population Age in Monticello is 48.7 Years.
What is the Average Family Size in Monticello
Average Family Size in Monticello is 2.7 People.
What is the Average Household Size in Monticello
Average Household Size in Monticello is 2.0 People.
How Large is the Labor Force in Monticello?
There are 2,443 People in the Labor Forcein in Monticello.
What is the Percentage of People in the Labor Force in Monticello?
52.2% of People are in the Labor Force in Monticello.
What is the Unemployment Rate in Monticello?
Unemployment Rate in Monticello is 6.0%.