Nashville, IN Map & Demographics
Nashville Map
Nashville Overview
$39,428
PER CAPITA INCOME
$86,875
AVG FAMILY INCOME
$51,042
AVG HOUSEHOLD INCOME
37.7%
WAGE / INCOME GAP [ % ]
62.3¢/ $1
WAGE / INCOME GAP [ $ ]
0.48
INEQUALITY / GINI INDEX
1,528
TOTAL POPULATION
632
MALE POPULATION
896
FEMALE POPULATION
70.54
MALES / 100 FEMALES
141.77
FEMALES / 100 MALES
63.3
MEDIAN AGE
2.3
AVG FAMILY SIZE
1.8
AVG HOUSEHOLD SIZE
687
LABOR FORCE [ PEOPLE ]
48.0%
PERCENT IN LABOR FORCE
4.4%
UNEMPLOYMENT RATE
Nashville Zip Codes
Nashville Area Codes
Income in Nashville
Income Overview in Nashville
Per Capita Income in Nashville is $39,428, while median incomes of families and households are $86,875 and $51,042 respectively.
| Characteristic | Number | Measure |
| Per Capita Income | 1,528 | $39,428 |
| Median Family Income | 446 | $86,875 |
| Mean Family Income | 446 | $96,771 |
| Median Household Income | 781 | $51,042 |
| Mean Household Income | 781 | $78,616 |
| Income Deficit | 446 | $0 |
| Wage / Income Gap (%) | 1,528 | 37.72% |
| Wage / Income Gap ($) | 1,528 | 62.28¢ per $1 |
| Gini / Inequality Index | 1,528 | 0.48 |
Earnings by Sex in Nashville
Average Earnings in Nashville are $39,524, $47,024 for men and $29,286 for women, a difference of 37.7%.
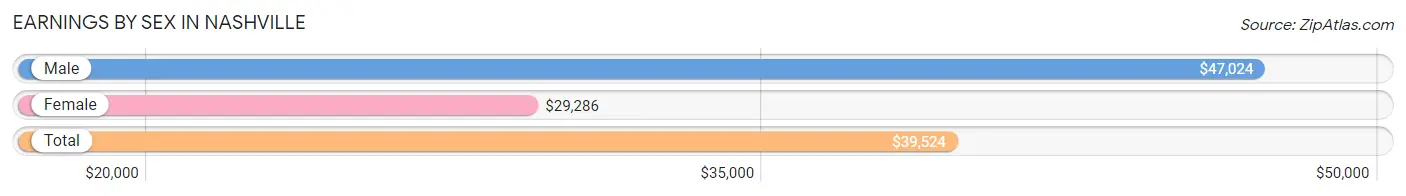
| Sex | Number | Average Earnings |
| Male | 400 (53.3%) | $47,024 |
| Female | 350 (46.7%) | $29,286 |
| Total | 750 (100.0%) | $39,524 |
Earnings by Sex by Income Bracket in Nashville
The most common earnings brackets in Nashville are $75,000 to $99,999 for men (106 | 26.5%) and $45,000 to $49,999 for women (45 | 12.9%).
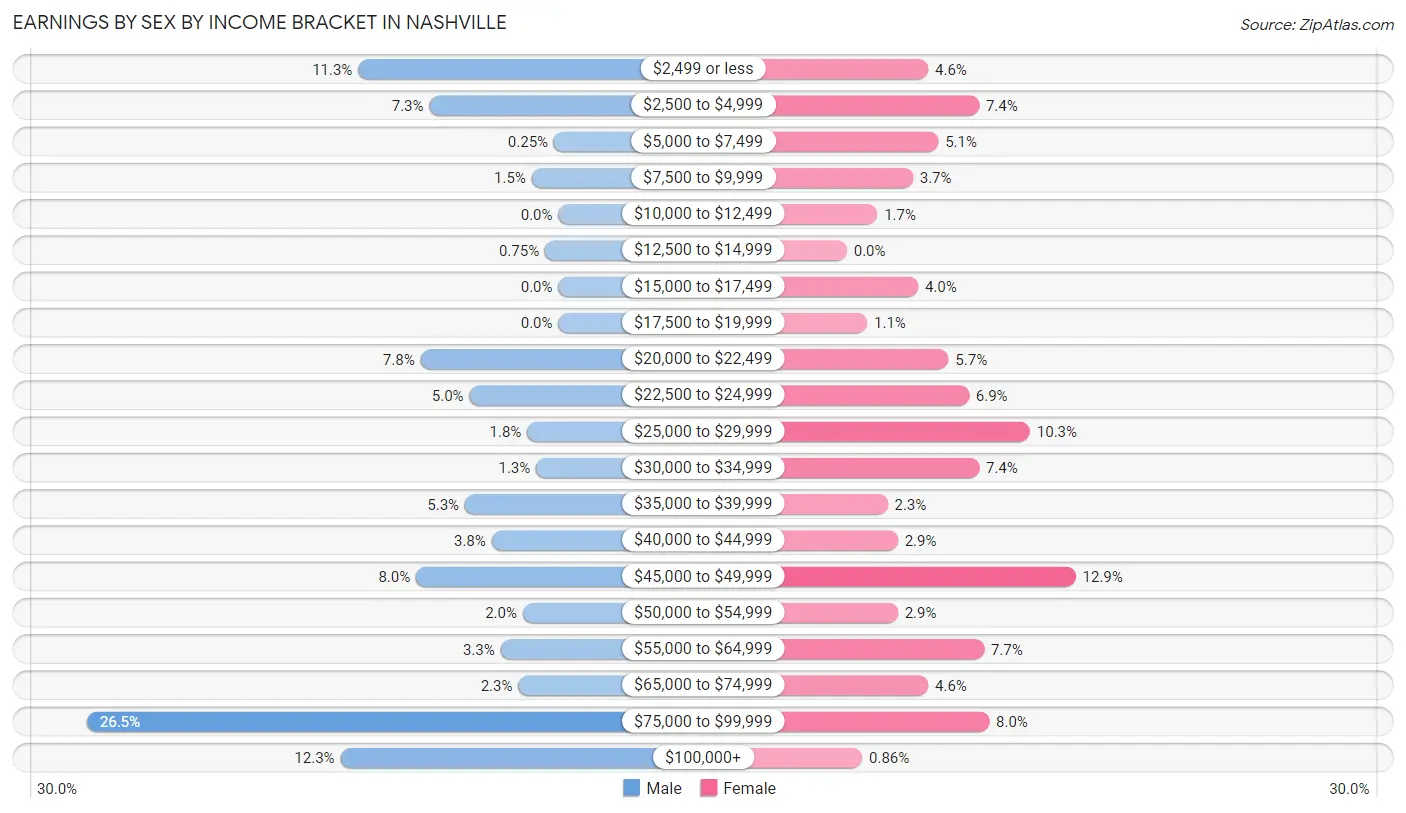
| Income | Male | Female |
| $2,499 or less | 45 (11.3%) | 16 (4.6%) |
| $2,500 to $4,999 | 29 (7.2%) | 26 (7.4%) |
| $5,000 to $7,499 | 1 (0.3%) | 18 (5.1%) |
| $7,500 to $9,999 | 6 (1.5%) | 13 (3.7%) |
| $10,000 to $12,499 | 0 (0.0%) | 6 (1.7%) |
| $12,500 to $14,999 | 3 (0.7%) | 0 (0.0%) |
| $15,000 to $17,499 | 0 (0.0%) | 14 (4.0%) |
| $17,500 to $19,999 | 0 (0.0%) | 4 (1.1%) |
| $20,000 to $22,499 | 31 (7.7%) | 20 (5.7%) |
| $22,500 to $24,999 | 20 (5.0%) | 24 (6.9%) |
| $25,000 to $29,999 | 7 (1.8%) | 36 (10.3%) |
| $30,000 to $34,999 | 5 (1.3%) | 26 (7.4%) |
| $35,000 to $39,999 | 21 (5.2%) | 8 (2.3%) |
| $40,000 to $44,999 | 15 (3.7%) | 10 (2.9%) |
| $45,000 to $49,999 | 32 (8.0%) | 45 (12.9%) |
| $50,000 to $54,999 | 8 (2.0%) | 10 (2.9%) |
| $55,000 to $64,999 | 13 (3.3%) | 27 (7.7%) |
| $65,000 to $74,999 | 9 (2.2%) | 16 (4.6%) |
| $75,000 to $99,999 | 106 (26.5%) | 28 (8.0%) |
| $100,000+ | 49 (12.2%) | 3 (0.9%) |
| Total | 400 (100.0%) | 350 (100.0%) |
Earnings by Sex by Educational Attainment in Nashville
Average earnings in Nashville are $51,250 for men and $32,000 for women, a difference of 37.6%. Men with an educational attainment of graduate degree enjoy the highest average annual earnings of $89,167, while those with bachelor's degree education earn the least with $77,813. Women with an educational attainment of college or associate's degree earn the most with the average annual earnings of $45,347, while those with bachelor's degree education have the smallest earnings of $26,940.
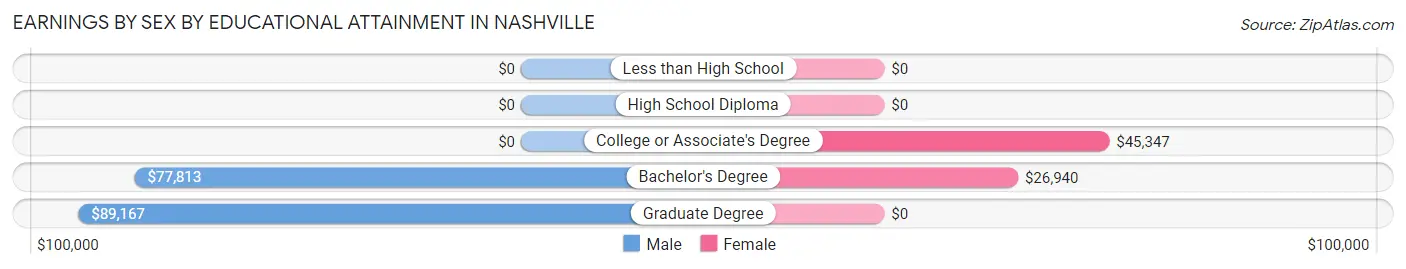
| Educational Attainment | Male Income | Female Income |
| Less than High School | - | - |
| High School Diploma | - | - |
| College or Associate's Degree | - | - |
| Bachelor's Degree | $77,813 | $26,940 |
| Graduate Degree | $89,167 | $0 |
| Total | $51,250 | $32,000 |
Family Income in Nashville
Family Income Brackets in Nashville
According to the Nashville family income data, there are 113 families falling into the $100,000 to $149,999 income range, which is the most common income bracket and makes up 25.3% of all families. Conversely, the $15,000 to $24,999 income bracket is the least frequent group with only 12 families (2.7%) belonging to this category.
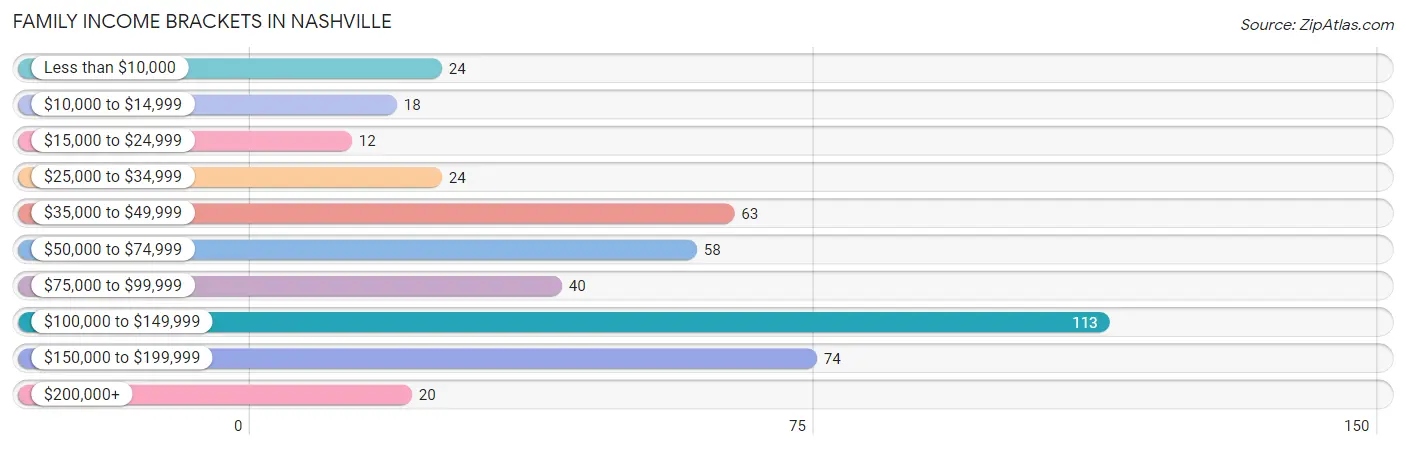
| Income Bracket | # Families | % Families |
| Less than $10,000 | 24 | 5.4% |
| $10,000 to $14,999 | 18 | 4.0% |
| $15,000 to $24,999 | 12 | 2.7% |
| $25,000 to $34,999 | 24 | 5.4% |
| $35,000 to $49,999 | 63 | 14.1% |
| $50,000 to $74,999 | 58 | 13.0% |
| $75,000 to $99,999 | 40 | 9.0% |
| $100,000 to $149,999 | 113 | 25.3% |
| $150,000 to $199,999 | 74 | 16.6% |
| $200,000+ | 20 | 4.5% |
Family Income by Famaliy Size in Nashville
4-person families (74 | 16.6%) account for the highest median family income in Nashville with $148,750 per family, while 4-person families (74 | 16.6%) have the highest median income of $37,188 per family member.
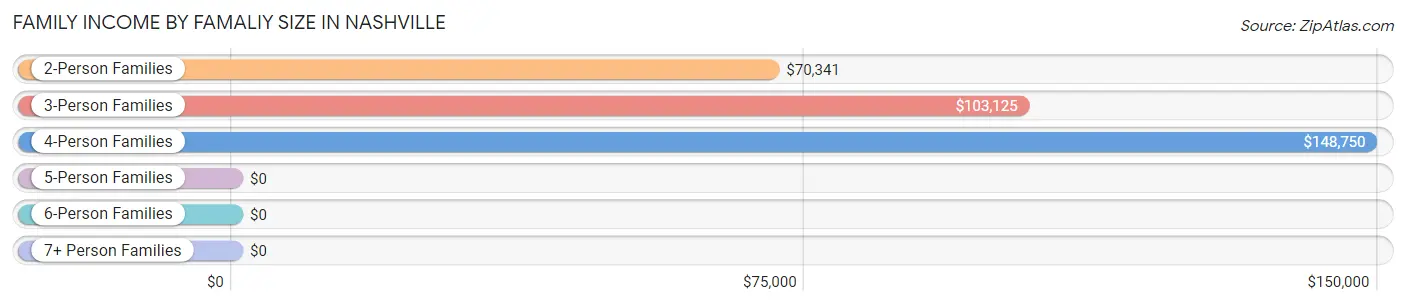
| Income Bracket | # Families | Median Income |
| 2-Person Families | 335 (75.1%) | $70,341 |
| 3-Person Families | 33 (7.4%) | $103,125 |
| 4-Person Families | 74 (16.6%) | $148,750 |
| 5-Person Families | 4 (0.9%) | $0 |
| 6-Person Families | 0 (0.0%) | $0 |
| 7+ Person Families | 0 (0.0%) | $0 |
| Total | 446 (100.0%) | $86,875 |
Family Income by Number of Earners in Nashville
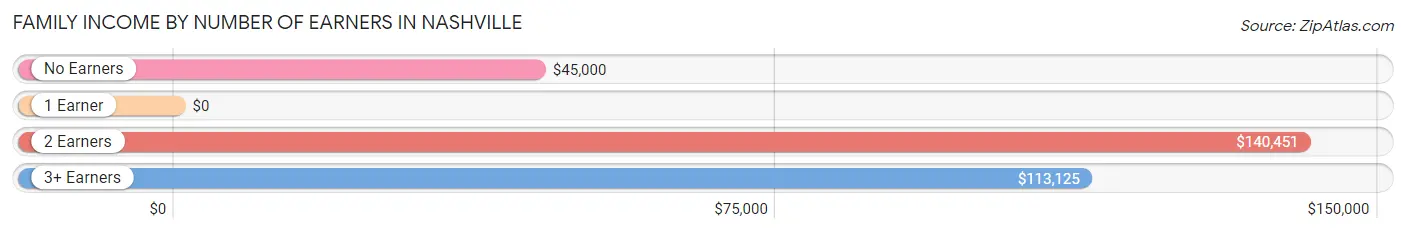
| Number of Earners | # Families | Median Income |
| No Earners | 90 (20.2%) | $45,000 |
| 1 Earner | 133 (29.8%) | $0 |
| 2 Earners | 197 (44.2%) | $140,451 |
| 3+ Earners | 26 (5.8%) | $113,125 |
| Total | 446 (100.0%) | $86,875 |
Household Income in Nashville
Household Income Brackets in Nashville
With 143 households falling in the category, the $100,000 to $149,999 income range is the most frequent in Nashville, accounting for 18.3% of all households. In contrast, only 32 households (4.1%) fall into the $200,000+ income bracket, making it the least populous group.
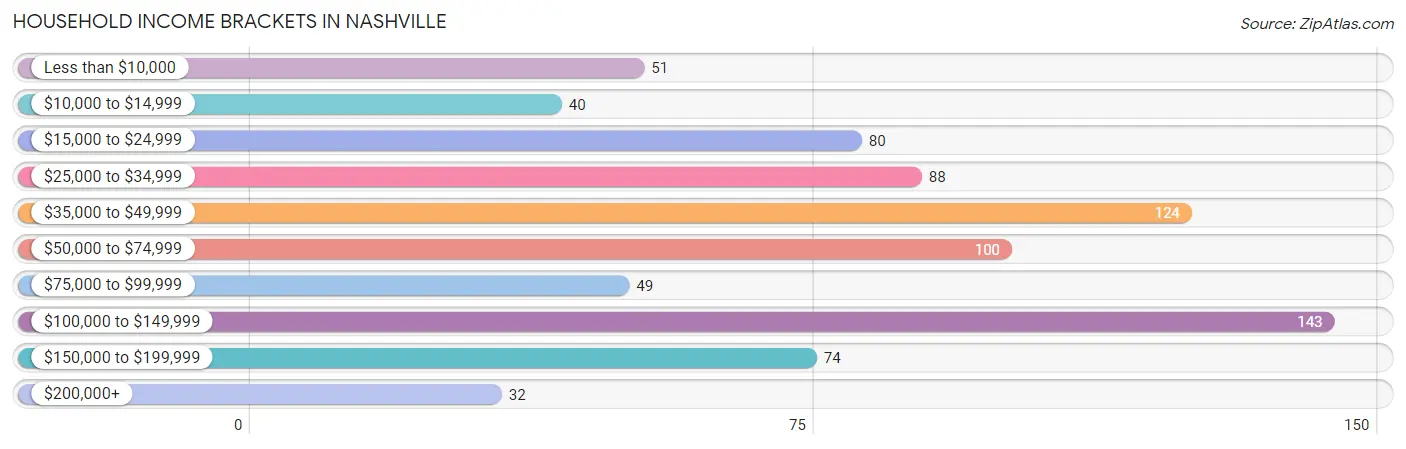
| Income Bracket | # Households | % Households |
| Less than $10,000 | 51 | 6.5% |
| $10,000 to $14,999 | 40 | 5.1% |
| $15,000 to $24,999 | 80 | 10.2% |
| $25,000 to $34,999 | 88 | 11.3% |
| $35,000 to $49,999 | 124 | 15.9% |
| $50,000 to $74,999 | 100 | 12.8% |
| $75,000 to $99,999 | 49 | 6.3% |
| $100,000 to $149,999 | 143 | 18.3% |
| $150,000 to $199,999 | 74 | 9.5% |
| $200,000+ | 32 | 4.1% |
Household Income by Householder Age in Nashville
The median household income in Nashville is $51,042, with the highest median household income of $102,750 found in the 15 to 24 years age bracket for the primary householder. A total of 27 households (3.5%) fall into this category. Meanwhile, the 65+ years age bracket for the primary householder has the lowest median household income of $45,179, with 383 households (49.0%) in this group.
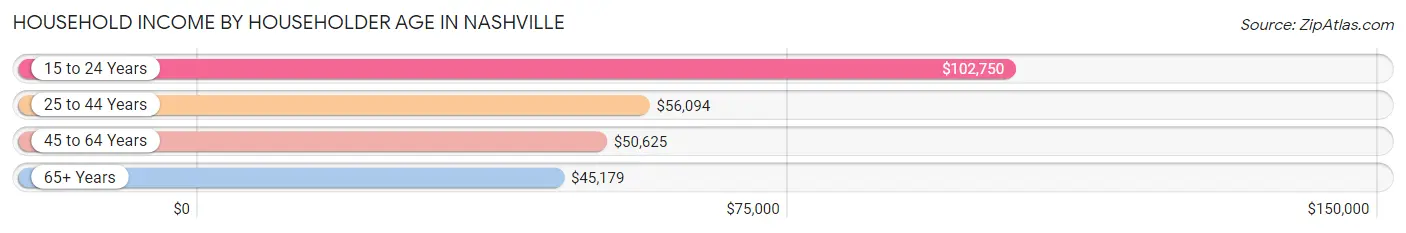
| Income Bracket | # Households | Median Income |
| 15 to 24 Years | 27 (3.5%) | $102,750 |
| 25 to 44 Years | 98 (12.6%) | $56,094 |
| 45 to 64 Years | 273 (35.0%) | $50,625 |
| 65+ Years | 383 (49.0%) | $45,179 |
| Total | 781 (100.0%) | $51,042 |
Poverty in Nashville
Income Below Poverty by Sex and Age in Nashville
With 9.4% poverty level for males and 12.1% for females among the residents of Nashville, 55 to 64 year old males and 18 to 24 year old females are the most vulnerable to poverty, with 17 males (27.4%) and 27 females (52.9%) in their respective age groups living below the poverty level.
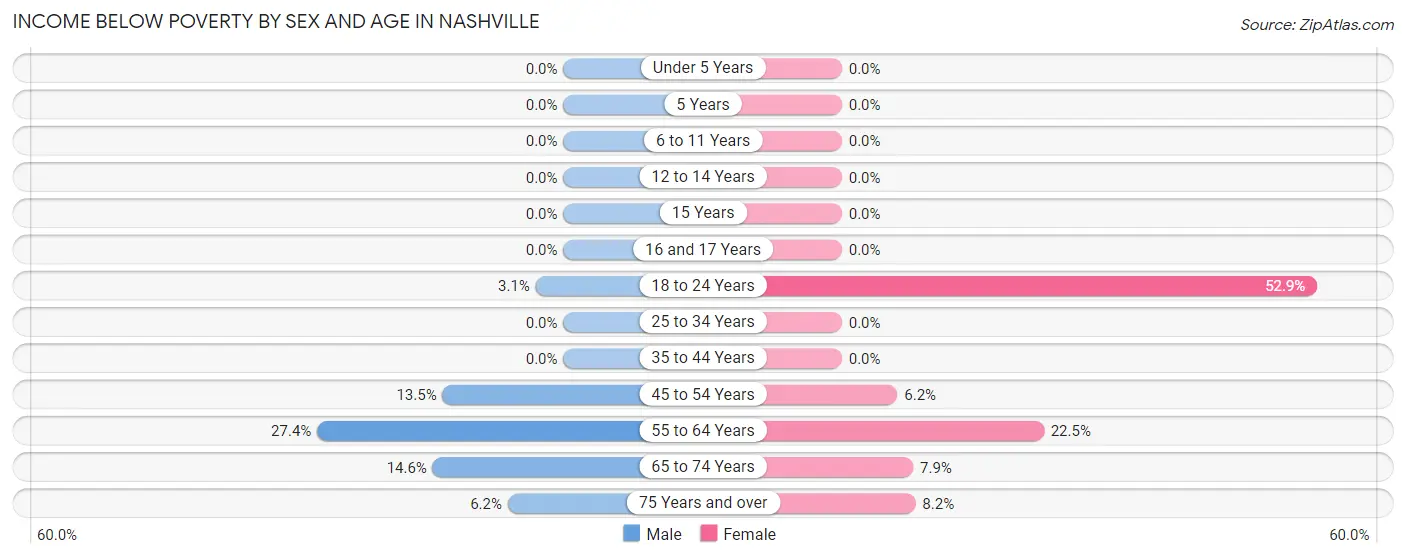
| Age Bracket | Male | Female |
| Under 5 Years | 0 (0.0%) | 0 (0.0%) |
| 5 Years | 0 (0.0%) | 0 (0.0%) |
| 6 to 11 Years | 0 (0.0%) | 0 (0.0%) |
| 12 to 14 Years | 0 (0.0%) | 0 (0.0%) |
| 15 Years | 0 (0.0%) | 0 (0.0%) |
| 16 and 17 Years | 0 (0.0%) | 0 (0.0%) |
| 18 to 24 Years | 2 (3.1%) | 27 (52.9%) |
| 25 to 34 Years | 0 (0.0%) | 0 (0.0%) |
| 35 to 44 Years | 0 (0.0%) | 0 (0.0%) |
| 45 to 54 Years | 14 (13.5%) | 7 (6.2%) |
| 55 to 64 Years | 17 (27.4%) | 38 (22.5%) |
| 65 to 74 Years | 16 (14.5%) | 10 (7.9%) |
| 75 Years and over | 7 (6.2%) | 15 (8.2%) |
| Total | 56 (9.4%) | 97 (12.1%) |
Income Above Poverty by Sex and Age in Nashville
According to the poverty statistics in Nashville, males aged under 5 years and females aged under 5 years are the age groups that are most secure financially, with 100.0% of males and 100.0% of females in these age groups living above the poverty line.
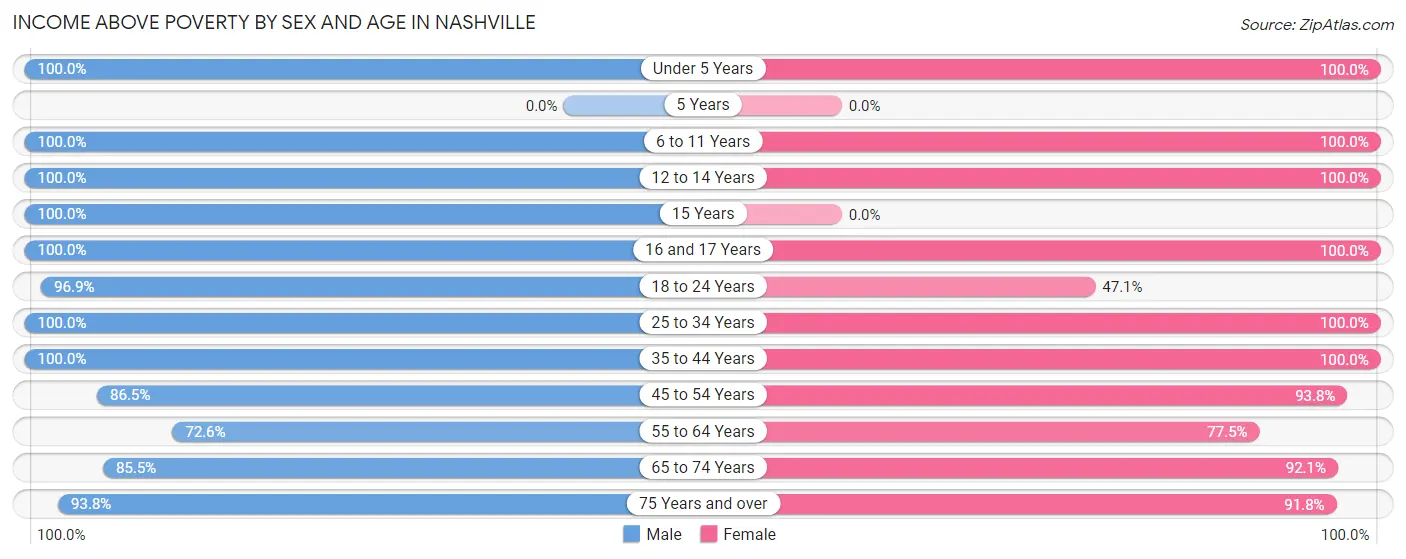
| Age Bracket | Male | Female |
| Under 5 Years | 11 (100.0%) | 50 (100.0%) |
| 5 Years | 0 (0.0%) | 0 (0.0%) |
| 6 to 11 Years | 8 (100.0%) | 13 (100.0%) |
| 12 to 14 Years | 4 (100.0%) | 7 (100.0%) |
| 15 Years | 1 (100.0%) | 0 (0.0%) |
| 16 and 17 Years | 13 (100.0%) | 8 (100.0%) |
| 18 to 24 Years | 63 (96.9%) | 24 (47.1%) |
| 25 to 34 Years | 63 (100.0%) | 49 (100.0%) |
| 35 to 44 Years | 41 (100.0%) | 30 (100.0%) |
| 45 to 54 Years | 90 (86.5%) | 106 (93.8%) |
| 55 to 64 Years | 45 (72.6%) | 131 (77.5%) |
| 65 to 74 Years | 94 (85.5%) | 116 (92.1%) |
| 75 Years and over | 106 (93.8%) | 168 (91.8%) |
| Total | 539 (90.6%) | 702 (87.9%) |
Income Below Poverty Among Married-Couple Families in Nashville
The poverty statistics for married-couple families in Nashville show that 9.7% or 35 of the total 360 families live below the poverty line. Families with no children have the highest poverty rate of 11.9%, comprising of 35 families. On the other hand, families with 1 or 2 children have the lowest poverty rate of 0.0%, which includes 0 families.
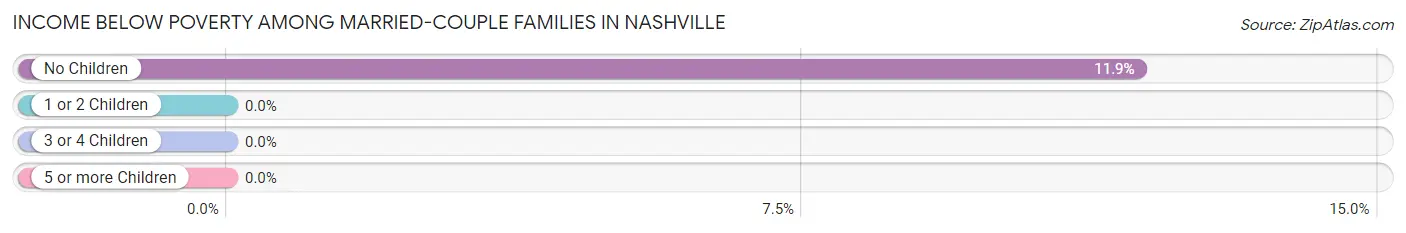
| Children | Above Poverty | Below Poverty |
| No Children | 260 (88.1%) | 35 (11.9%) |
| 1 or 2 Children | 63 (100.0%) | 0 (0.0%) |
| 3 or 4 Children | 2 (100.0%) | 0 (0.0%) |
| 5 or more Children | 0 (0.0%) | 0 (0.0%) |
| Total | 325 (90.3%) | 35 (9.7%) |
Income Below Poverty Among Single-Parent Households in Nashville
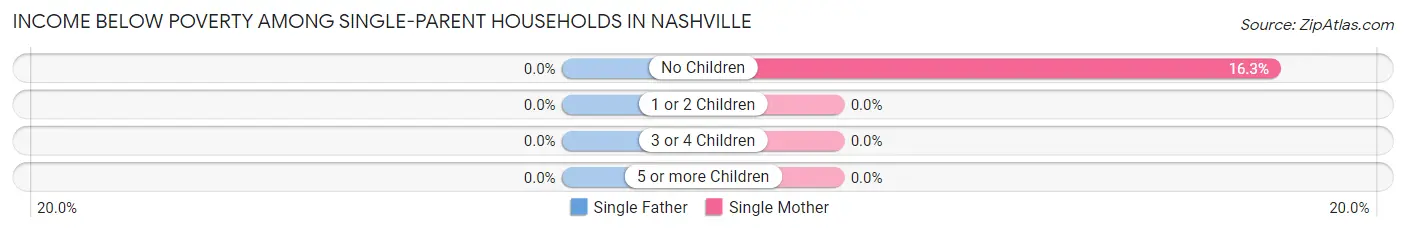
| Children | Single Father | Single Mother |
| No Children | 0 (0.0%) | 7 (16.3%) |
| 1 or 2 Children | 0 (0.0%) | 0 (0.0%) |
| 3 or 4 Children | 0 (0.0%) | 0 (0.0%) |
| 5 or more Children | 0 (0.0%) | 0 (0.0%) |
| Total | 0 (0.0%) | 7 (10.1%) |
Income Below Poverty Among Married-Couple vs Single-Parent Households in Nashville
The poverty data for Nashville shows that 35 of the married-couple family households (9.7%) and 7 of the single-parent households (8.1%) are living below the poverty level. Within the married-couple family households, those with no children have the highest poverty rate, with 35 households (11.9%) falling below the poverty line. Among the single-parent households, those with no children have the highest poverty rate, with 7 household (16.3%) living below poverty.
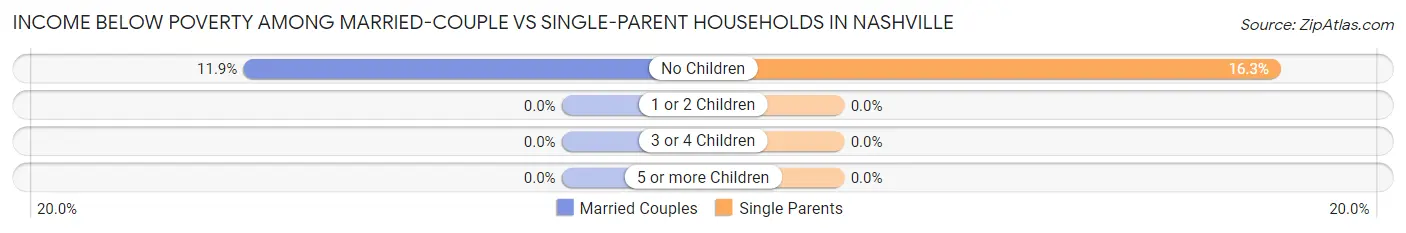
| Children | Married-Couple Families | Single-Parent Households |
| No Children | 35 (11.9%) | 7 (16.3%) |
| 1 or 2 Children | 0 (0.0%) | 0 (0.0%) |
| 3 or 4 Children | 0 (0.0%) | 0 (0.0%) |
| 5 or more Children | 0 (0.0%) | 0 (0.0%) |
| Total | 35 (9.7%) | 7 (8.1%) |
Race in Nashville
The most populous races in Nashville are White / Caucasian (1,487 | 97.3%), Two or more Races (15 | 1.0%), and Native / Alaskan (13 | 0.9%).
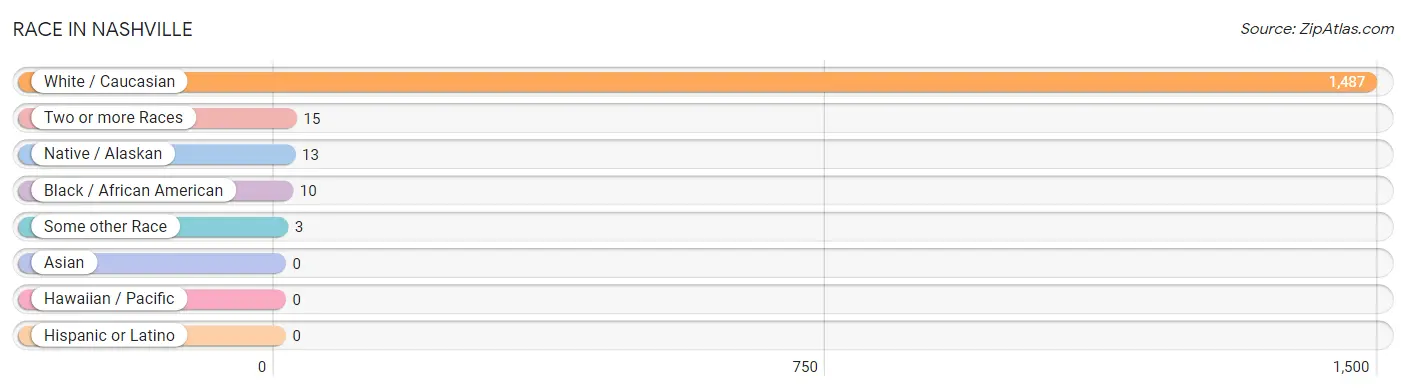
| Race | # Population | % Population |
| Asian | 0 | 0.0% |
| Black / African American | 10 | 0.6% |
| Hawaiian / Pacific | 0 | 0.0% |
| Hispanic or Latino | 0 | 0.0% |
| Native / Alaskan | 13 | 0.9% |
| White / Caucasian | 1,487 | 97.3% |
| Two or more Races | 15 | 1.0% |
| Some other Race | 3 | 0.2% |
| Total | 1,528 | 100.0% |
Ancestry in Nashville
The most populous ancestries reported in Nashville are English (340 | 22.3%), Irish (327 | 21.4%), German (247 | 16.2%), Scottish (78 | 5.1%), and American (72 | 4.7%), together accounting for 69.6% of all Nashville residents.
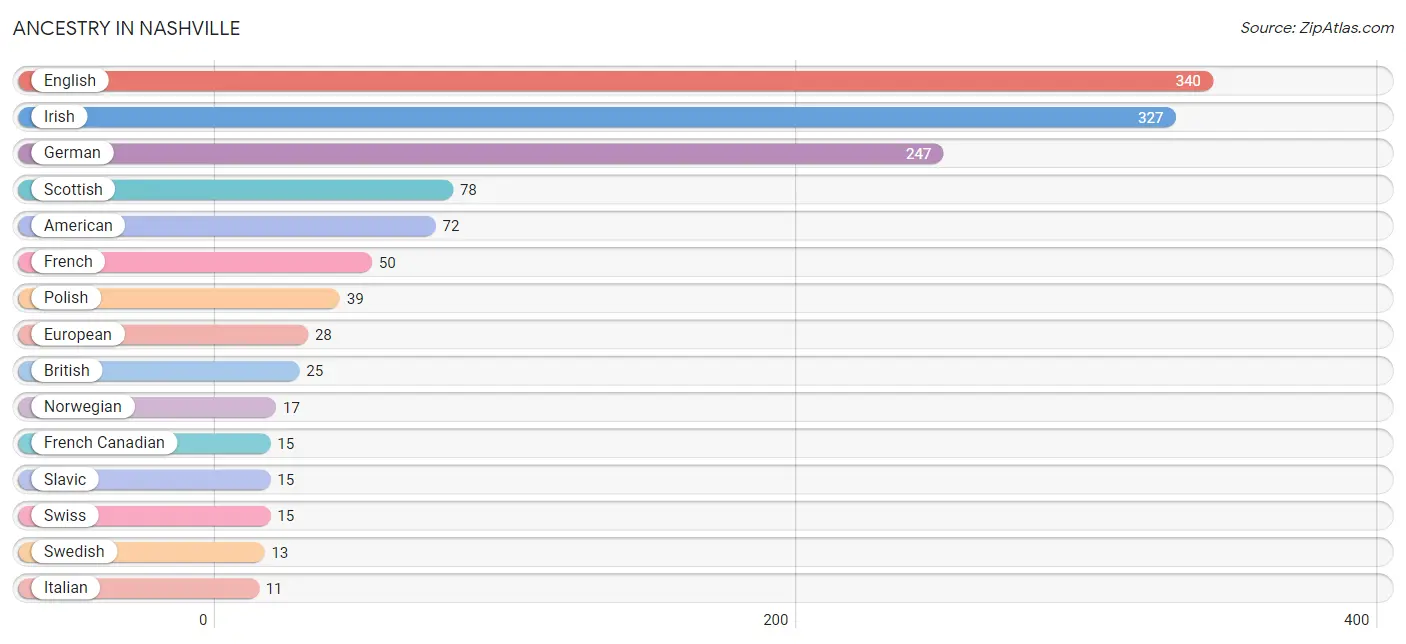
| Ancestry | # Population | % Population |
| American | 72 | 4.7% |
| Belgian | 3 | 0.2% |
| British | 25 | 1.6% |
| Danish | 4 | 0.3% |
| Dutch | 8 | 0.5% |
| English | 340 | 22.3% |
| European | 28 | 1.8% |
| French | 50 | 3.3% |
| French Canadian | 15 | 1.0% |
| German | 247 | 16.2% |
| Hungarian | 6 | 0.4% |
| Irish | 327 | 21.4% |
| Italian | 11 | 0.7% |
| Lithuanian | 3 | 0.2% |
| Norwegian | 17 | 1.1% |
| Polish | 39 | 2.5% |
| Romanian | 7 | 0.5% |
| Russian | 11 | 0.7% |
| Scandinavian | 4 | 0.3% |
| Scotch-Irish | 3 | 0.2% |
| Scottish | 78 | 5.1% |
| Slavic | 15 | 1.0% |
| Swedish | 13 | 0.9% |
| Swiss | 15 | 1.0% |
| Welsh | 5 | 0.3% | View All 25 Rows |
Immigrants in Nashville
The most numerous immigrant groups reported in Nashville came from Europe (33 | 2.2%), Northern Europe (23 | 1.5%), Scotland (20 | 1.3%), Germany (10 | 0.6%), and Western Europe (10 | 0.6%), together accounting for 6.3% of all Nashville residents.
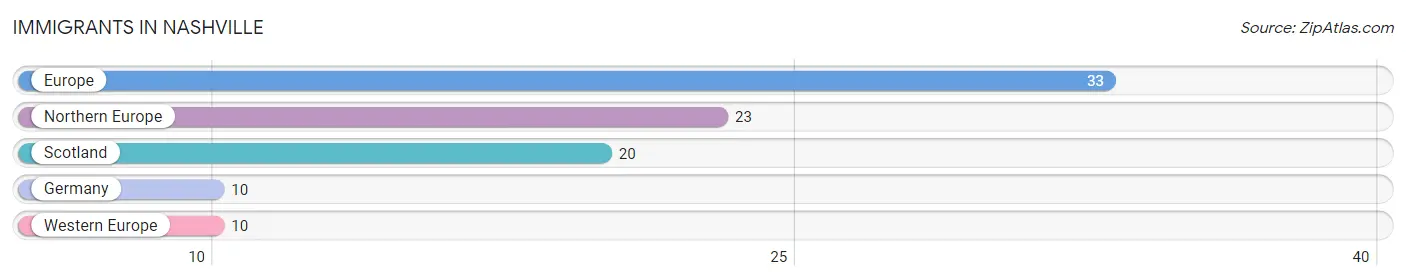
| Immigration Origin | # Population | % Population |
| Europe | 33 | 2.2% |
| Germany | 10 | 0.6% |
| Northern Europe | 23 | 1.5% |
| Scotland | 20 | 1.3% |
| Western Europe | 10 | 0.6% | View All 5 Rows |
Sex and Age in Nashville
Sex and Age in Nashville
The most populous age groups in Nashville are 50 to 54 Years (79 | 12.5%) for men and 60 to 64 Years (125 | 14.0%) for women.
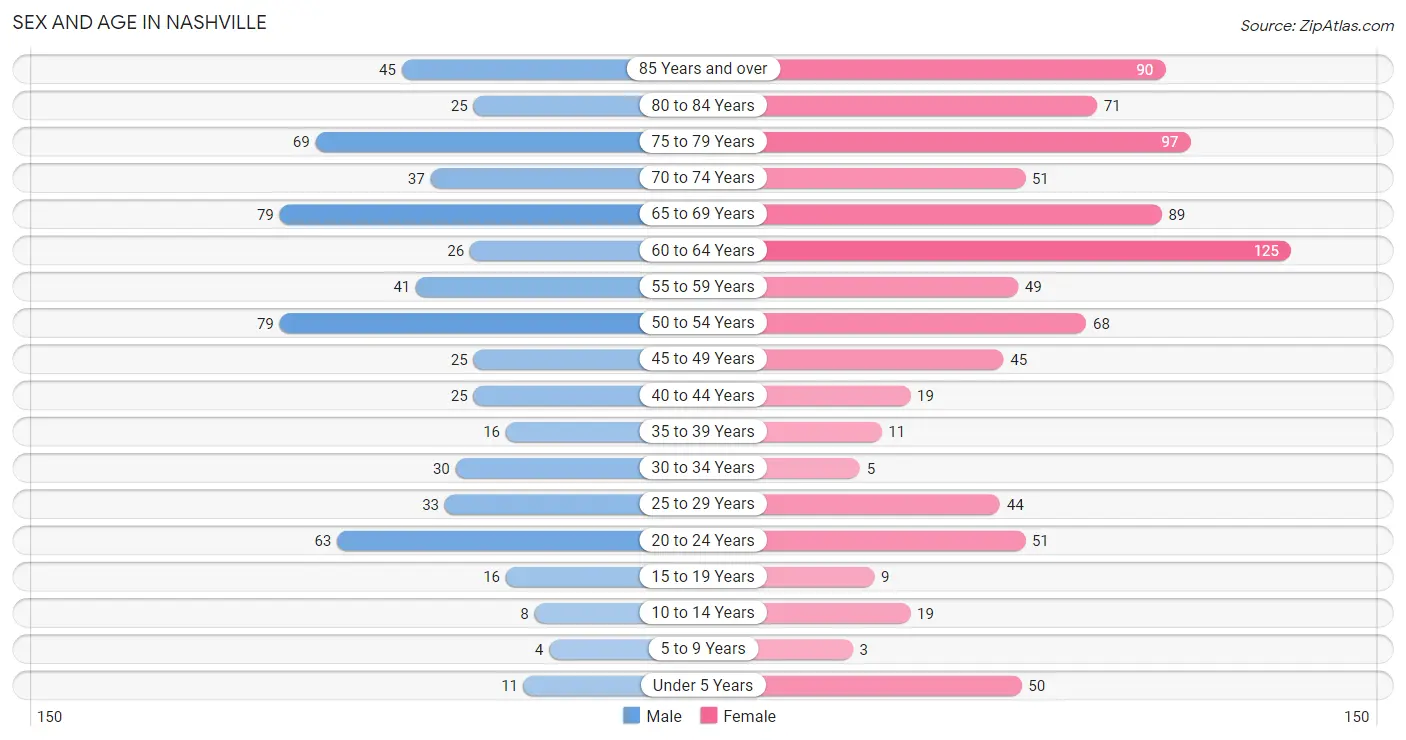
| Age Bracket | Male | Female |
| Under 5 Years | 11 (1.7%) | 50 (5.6%) |
| 5 to 9 Years | 4 (0.6%) | 3 (0.3%) |
| 10 to 14 Years | 8 (1.3%) | 19 (2.1%) |
| 15 to 19 Years | 16 (2.5%) | 9 (1.0%) |
| 20 to 24 Years | 63 (10.0%) | 51 (5.7%) |
| 25 to 29 Years | 33 (5.2%) | 44 (4.9%) |
| 30 to 34 Years | 30 (4.8%) | 5 (0.6%) |
| 35 to 39 Years | 16 (2.5%) | 11 (1.2%) |
| 40 to 44 Years | 25 (4.0%) | 19 (2.1%) |
| 45 to 49 Years | 25 (4.0%) | 45 (5.0%) |
| 50 to 54 Years | 79 (12.5%) | 68 (7.6%) |
| 55 to 59 Years | 41 (6.5%) | 49 (5.5%) |
| 60 to 64 Years | 26 (4.1%) | 125 (14.0%) |
| 65 to 69 Years | 79 (12.5%) | 89 (9.9%) |
| 70 to 74 Years | 37 (5.9%) | 51 (5.7%) |
| 75 to 79 Years | 69 (10.9%) | 97 (10.8%) |
| 80 to 84 Years | 25 (4.0%) | 71 (7.9%) |
| 85 Years and over | 45 (7.1%) | 90 (10.0%) |
| Total | 632 (100.0%) | 896 (100.0%) |
Families and Households in Nashville
Median Family Size in Nashville
The median family size in Nashville is 2.29 persons per family, with single male/father families (17 | 3.8%) accounting for the largest median family size of 2.65 persons per family. On the other hand, married-couple families (360 | 80.7%) represent the smallest median family size with 2.28 persons per family.
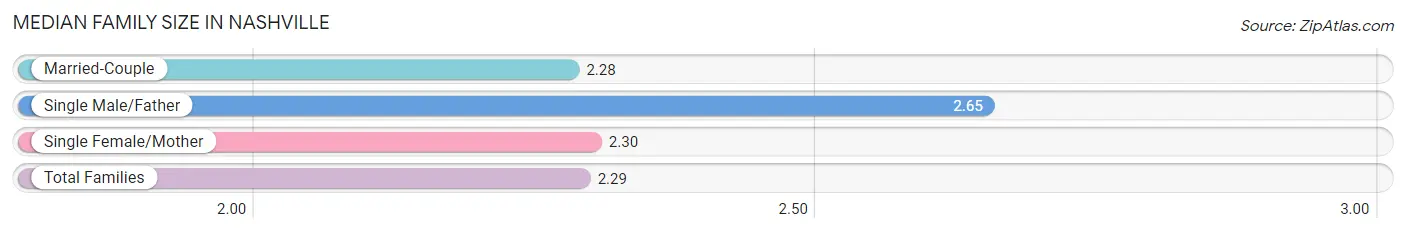
| Family Type | # Families | Family Size |
| Married-Couple | 360 (80.7%) | 2.28 |
| Single Male/Father | 17 (3.8%) | 2.65 |
| Single Female/Mother | 69 (15.5%) | 2.30 |
| Total Families | 446 (100.0%) | 2.29 |
Median Household Size in Nashville
The median household size in Nashville is 1.78 persons per household, with single male/father households (17 | 2.2%) accounting for the largest median household size of 3.41 persons per household. non-family households (335 | 42.9%) represent the smallest median household size with 1.07 persons per household.
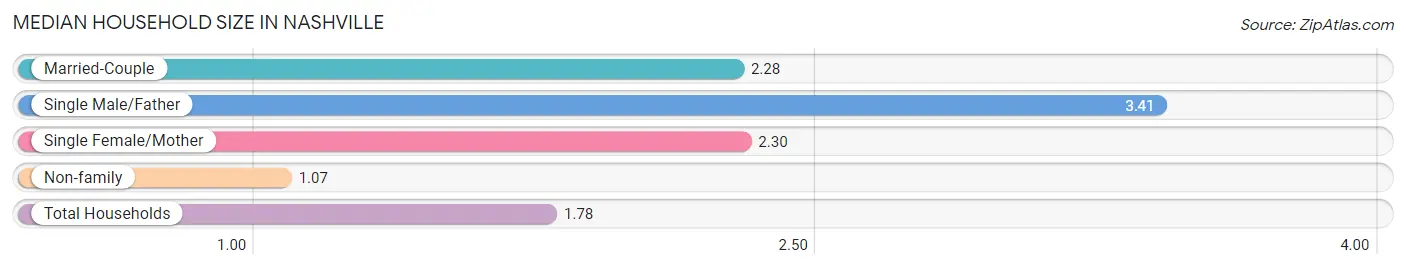
| Household Type | # Households | Household Size |
| Married-Couple | 360 (46.1%) | 2.28 |
| Single Male/Father | 17 (2.2%) | 3.41 |
| Single Female/Mother | 69 (8.8%) | 2.30 |
| Non-family | 335 (42.9%) | 1.07 |
| Total Households | 781 (100.0%) | 1.78 |
Household Size by Marriage Status in Nashville
Out of a total of 781 households in Nashville, 446 (57.1%) are family households, while 335 (42.9%) are nonfamily households. The most numerous type of family households are 2-person households, comprising 329, and the most common type of nonfamily households are 1-person households, comprising 313.
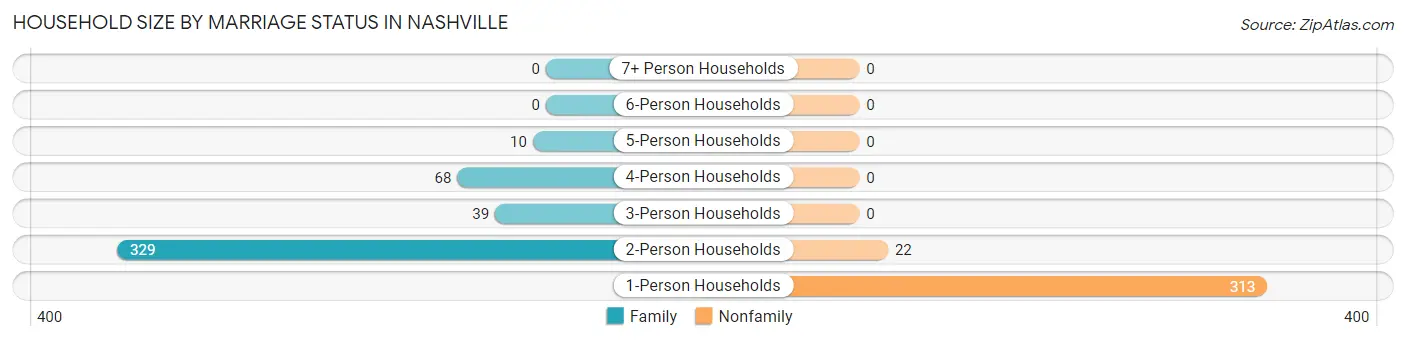
| Household Size | Family Households | Nonfamily Households |
| 1-Person Households | - | 313 (40.1%) |
| 2-Person Households | 329 (42.1%) | 22 (2.8%) |
| 3-Person Households | 39 (5.0%) | 0 (0.0%) |
| 4-Person Households | 68 (8.7%) | 0 (0.0%) |
| 5-Person Households | 10 (1.3%) | 0 (0.0%) |
| 6-Person Households | 0 (0.0%) | 0 (0.0%) |
| 7+ Person Households | 0 (0.0%) | 0 (0.0%) |
| Total | 446 (57.1%) | 335 (42.9%) |
Female Fertility in Nashville
Fertility by Age in Nashville
Average fertility rate in Nashville is 120.0 births per 1,000 women. Women in the age bracket of 20 to 34 years have the highest fertility rate with 270.0 births per 1,000 women. Women in the age bracket of 20 to 34 years acount for 100.0% of all women with births.
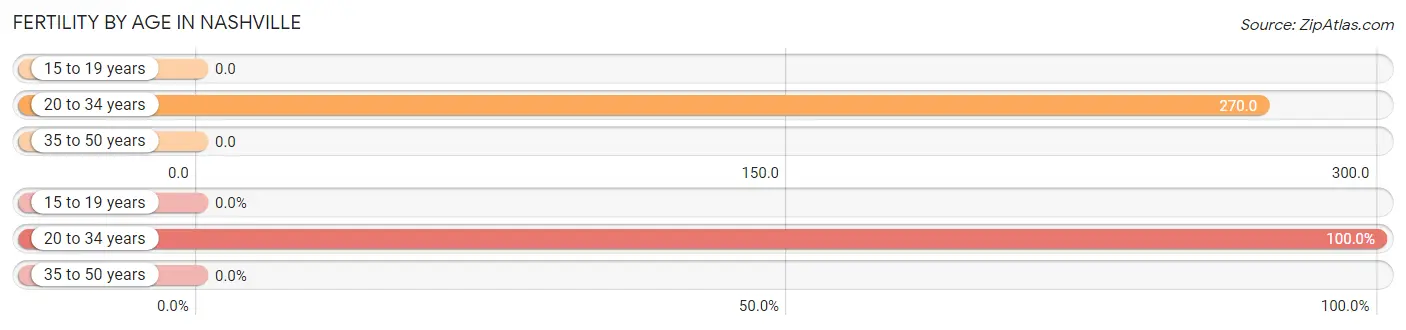
| Age Bracket | Women with Births | Births / 1,000 Women |
| 15 to 19 years | 0 (0.0%) | 0.0 |
| 20 to 34 years | 27 (100.0%) | 270.0 |
| 35 to 50 years | 0 (0.0%) | 0.0 |
| Total | 27 (100.0%) | 120.0 |
Fertility by Age by Marriage Status in Nashville
66.7% of women with births (27) in Nashville are married. The highest percentage of unmarried women with births falls into 20 to 34 years age bracket with 33.3% of them unmarried at the time of birth, while the lowest percentage of unmarried women with births belong to 20 to 34 years age bracket with 33.3% of them unmarried.
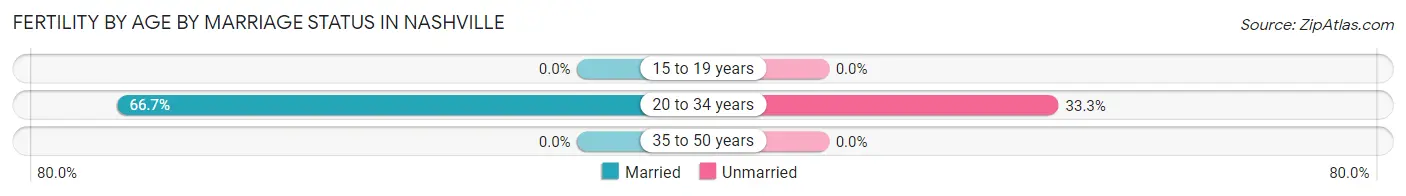
| Age Bracket | Married | Unmarried |
| 15 to 19 years | 0 (0.0%) | 0 (0.0%) |
| 20 to 34 years | 18 (66.7%) | 9 (33.3%) |
| 35 to 50 years | 0 (0.0%) | 0 (0.0%) |
| Total | 18 (66.7%) | 9 (33.3%) |
Fertility by Education in Nashville
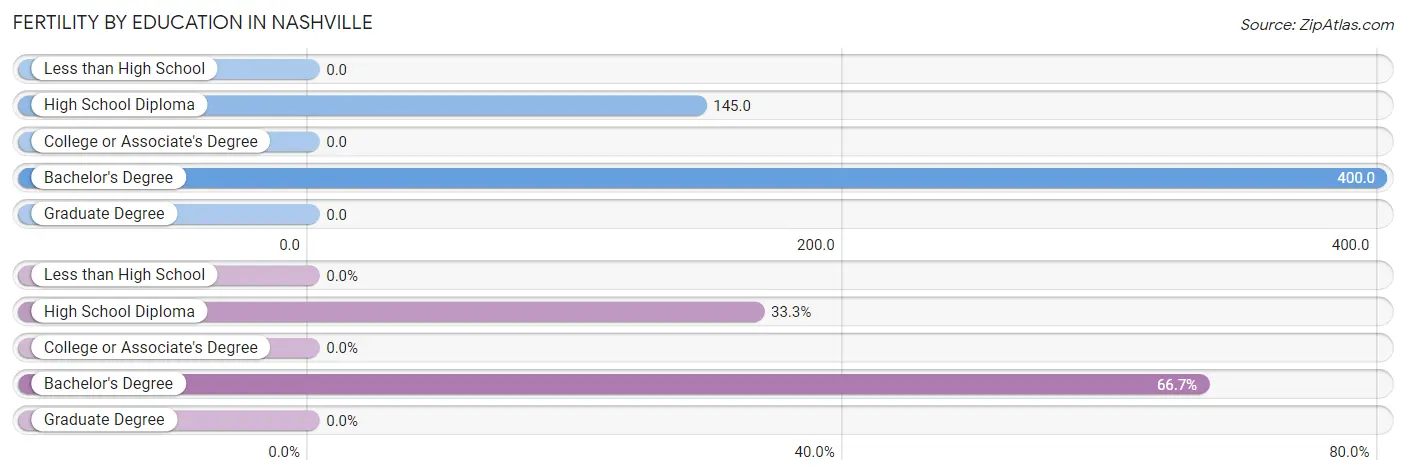
| Educational Attainment | Women with Births | Births / 1,000 Women |
| Less than High School | 0 (0.0%) | 0.0 |
| High School Diploma | 9 (33.3%) | 145.0 |
| College or Associate's Degree | 0 (0.0%) | 0.0 |
| Bachelor's Degree | 18 (66.7%) | 400.0 |
| Graduate Degree | 0 (0.0%) | 0.0 |
| Total | 27 (100.0%) | 120.0 |
Fertility by Education by Marriage Status in Nashville
33.3% of women with births in Nashville are unmarried. Women with the educational attainment of bachelor's degree are most likely to be married with 100.0% of them married at childbirth, while women with the educational attainment of high school diploma are least likely to be married with 100.0% of them unmarried at childbirth.
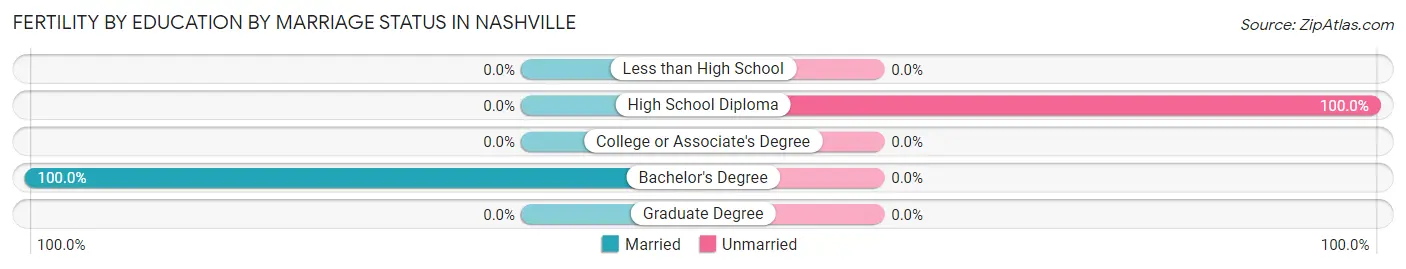
| Educational Attainment | Married | Unmarried |
| Less than High School | 0 (0.0%) | 0 (0.0%) |
| High School Diploma | 0 (0.0%) | 9 (100.0%) |
| College or Associate's Degree | 0 (0.0%) | 0 (0.0%) |
| Bachelor's Degree | 18 (100.0%) | 0 (0.0%) |
| Graduate Degree | 0 (0.0%) | 0 (0.0%) |
| Total | 18 (66.7%) | 9 (33.3%) |
Employment Characteristics in Nashville
Employment by Class of Employer in Nashville
Among the 564 employed individuals in Nashville, private company employees (325 | 57.6%), not-for-profit organizations (72 | 12.8%), and self-employed (not incorporated) (70 | 12.4%) make up the most common classes of employment.
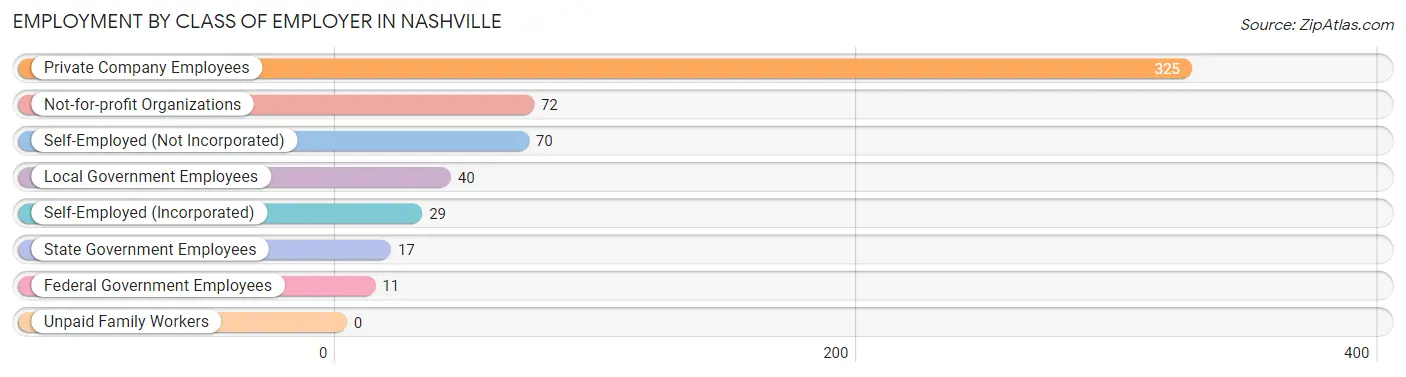
| Employer Class | # Employees | % Employees |
| Private Company Employees | 325 | 57.6% |
| Self-Employed (Incorporated) | 29 | 5.1% |
| Self-Employed (Not Incorporated) | 70 | 12.4% |
| Not-for-profit Organizations | 72 | 12.8% |
| Local Government Employees | 40 | 7.1% |
| State Government Employees | 17 | 3.0% |
| Federal Government Employees | 11 | 1.9% |
| Unpaid Family Workers | 0 | 0.0% |
| Total | 564 | 100.0% |
Employment Status by Age in Nashville
According to the labor force statistics for Nashville, out of the total population over 16 years of age (1,432), 48.0% or 687 individuals are in the labor force, with 4.4% or 30 of them unemployed. The age group with the highest labor force participation rate is 35 to 44 years, with 97.2% or 69 individuals in the labor force. Within the labor force, the 16 to 19 years age range has the highest percentage of unemployed individuals, with 20.0% or 1 of them being unemployed.
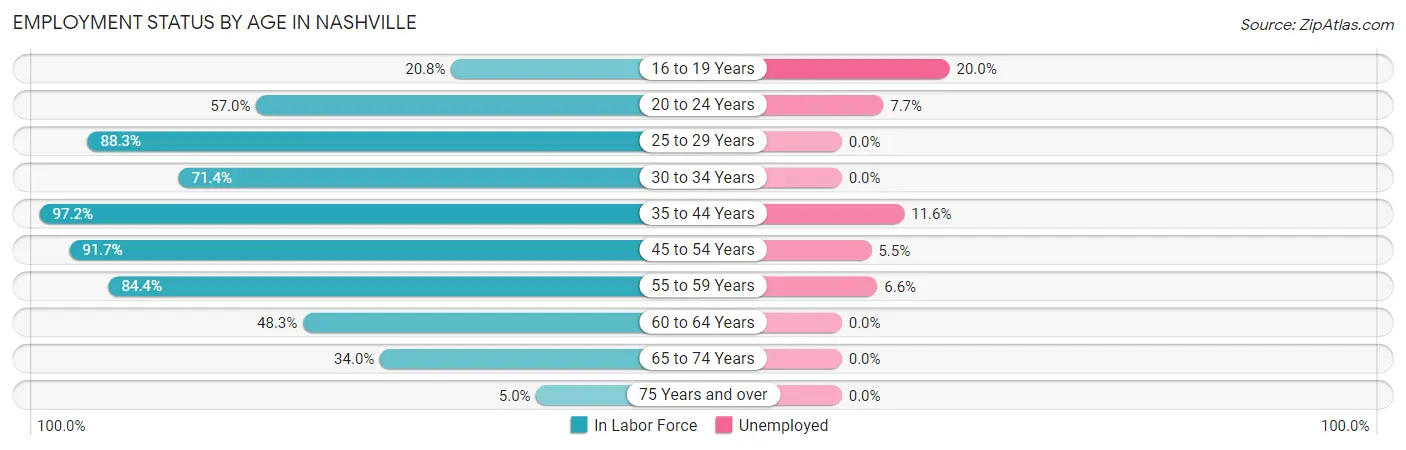
| Age Bracket | In Labor Force | Unemployed |
| 16 to 19 Years | 5 (20.8%) | 1 (20.0%) |
| 20 to 24 Years | 65 (57.0%) | 5 (7.7%) |
| 25 to 29 Years | 68 (88.3%) | 0 (0.0%) |
| 30 to 34 Years | 25 (71.4%) | 0 (0.0%) |
| 35 to 44 Years | 69 (97.2%) | 8 (11.6%) |
| 45 to 54 Years | 199 (91.7%) | 11 (5.5%) |
| 55 to 59 Years | 76 (84.4%) | 5 (6.6%) |
| 60 to 64 Years | 73 (48.3%) | 0 (0.0%) |
| 65 to 74 Years | 87 (34.0%) | 0 (0.0%) |
| 75 Years and over | 20 (5.0%) | 0 (0.0%) |
| Total | 687 (48.0%) | 30 (4.4%) |
Employment Status by Educational Attainment in Nashville
According to labor force statistics for Nashville, 79.6% of individuals (510) out of the total population between 25 and 64 years of age (641) are in the labor force, with 4.7% or 24 of them being unemployed. The group with the highest labor force participation rate are those with the educational attainment of bachelor's degree or higher, with 88.1% or 155 individuals in the labor force. Within the labor force, individuals with high school diploma education have the highest percentage of unemployment, with 11.6% or 16 of them being unemployed.
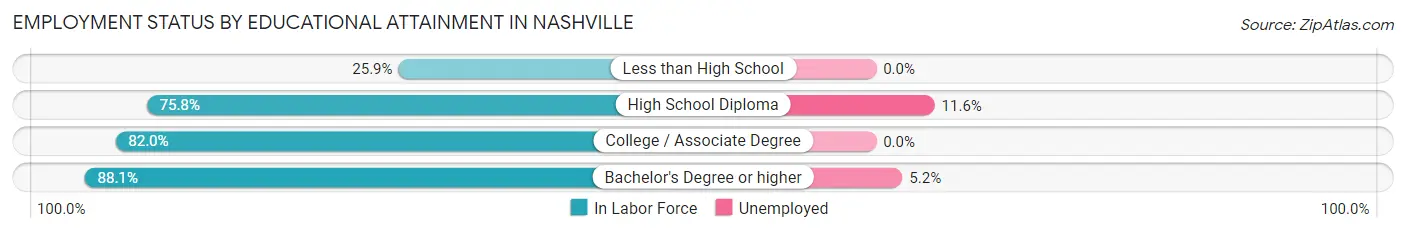
| Educational Attainment | In Labor Force | Unemployed |
| Less than High School | 7 (25.9%) | 0 (0.0%) |
| High School Diploma | 138 (75.8%) | 21 (11.6%) |
| College / Associate Degree | 210 (82.0%) | 0 (0.0%) |
| Bachelor's Degree or higher | 155 (88.1%) | 9 (5.2%) |
| Total | 510 (79.6%) | 30 (4.7%) |
Employment Occupations by Sex in Nashville
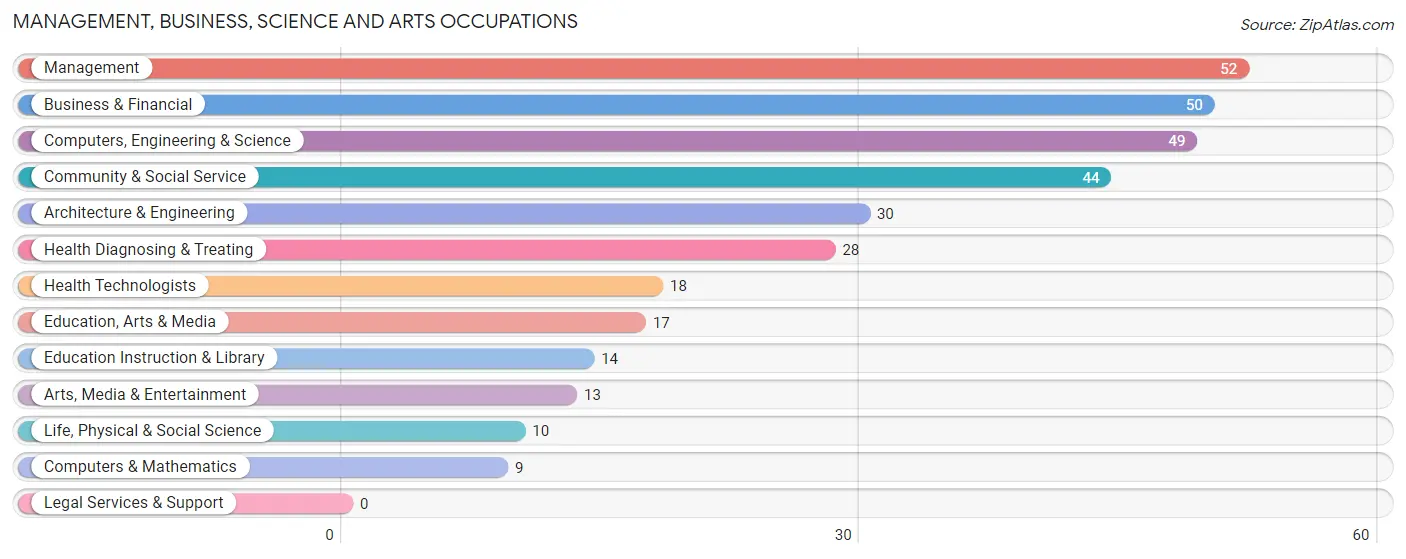
Management, Business, Science and Arts Occupations
The most common Management, Business, Science and Arts occupations in Nashville are Management (52 | 7.9%), Business & Financial (50 | 7.6%), Computers, Engineering & Science (49 | 7.5%), Community & Social Service (44 | 6.7%), and Architecture & Engineering (30 | 4.6%).
Management, Business, Science and Arts Occupations by Sex
Within the Management, Business, Science and Arts occupations in Nashville, the most male-oriented occupations are Architecture & Engineering (100.0%), Life, Physical & Social Science (100.0%), and Management (96.2%), while the most female-oriented occupations are Education Instruction & Library (100.0%), Health Diagnosing & Treating (85.7%), and Health Technologists (77.8%).
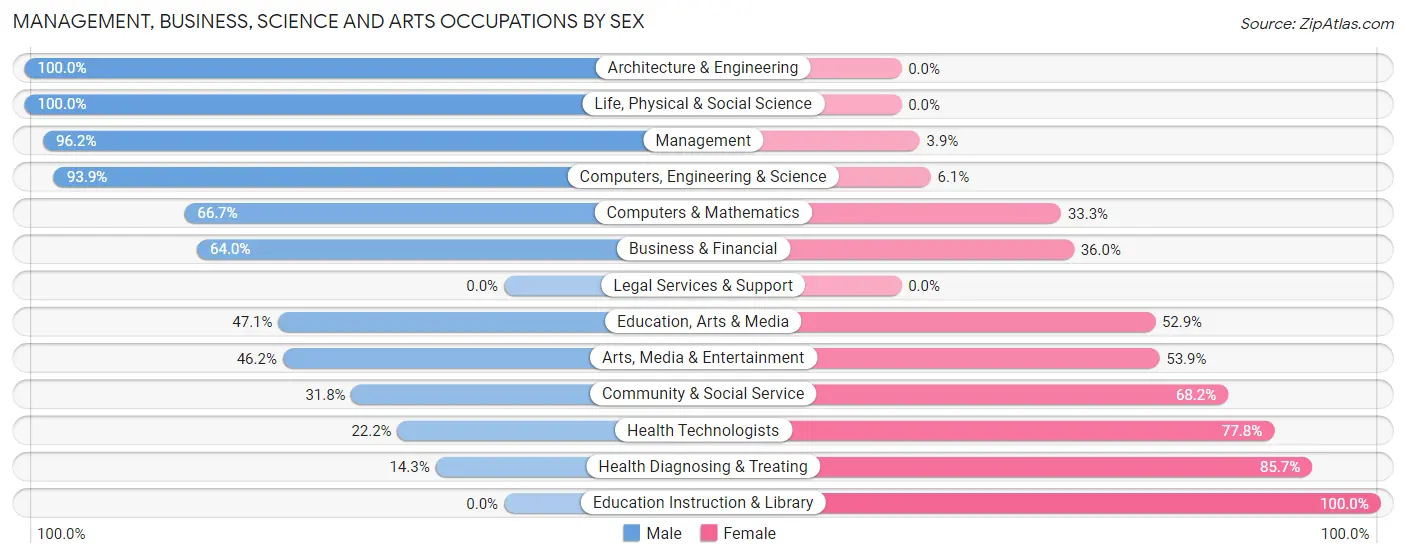
| Occupation | Male | Female |
| Management | 50 (96.2%) | 2 (3.8%) |
| Business & Financial | 32 (64.0%) | 18 (36.0%) |
| Computers, Engineering & Science | 46 (93.9%) | 3 (6.1%) |
| Computers & Mathematics | 6 (66.7%) | 3 (33.3%) |
| Architecture & Engineering | 30 (100.0%) | 0 (0.0%) |
| Life, Physical & Social Science | 10 (100.0%) | 0 (0.0%) |
| Community & Social Service | 14 (31.8%) | 30 (68.2%) |
| Education, Arts & Media | 8 (47.1%) | 9 (52.9%) |
| Legal Services & Support | 0 (0.0%) | 0 (0.0%) |
| Education Instruction & Library | 0 (0.0%) | 14 (100.0%) |
| Arts, Media & Entertainment | 6 (46.2%) | 7 (53.8%) |
| Health Diagnosing & Treating | 4 (14.3%) | 24 (85.7%) |
| Health Technologists | 4 (22.2%) | 14 (77.8%) |
| Total (Category) | 146 (65.5%) | 77 (34.5%) |
| Total (Overall) | 344 (52.4%) | 313 (47.6%) |
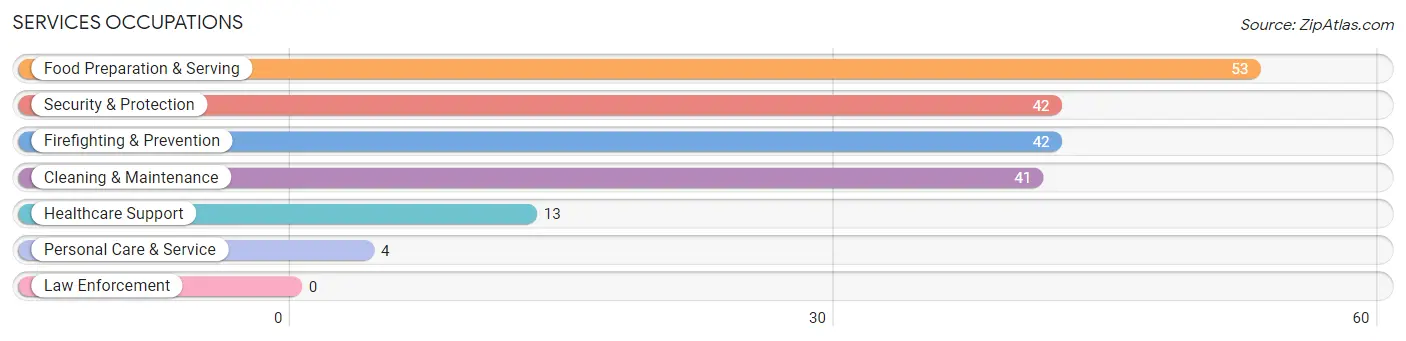
Services Occupations
The most common Services occupations in Nashville are Food Preparation & Serving (53 | 8.1%), Security & Protection (42 | 6.4%), Firefighting & Prevention (42 | 6.4%), Cleaning & Maintenance (41 | 6.2%), and Healthcare Support (13 | 2.0%).
Services Occupations by Sex
Within the Services occupations in Nashville, the most male-oriented occupations are Security & Protection (100.0%), Firefighting & Prevention (100.0%), and Food Preparation & Serving (56.6%), while the most female-oriented occupations are Healthcare Support (100.0%), Personal Care & Service (100.0%), and Cleaning & Maintenance (65.8%).
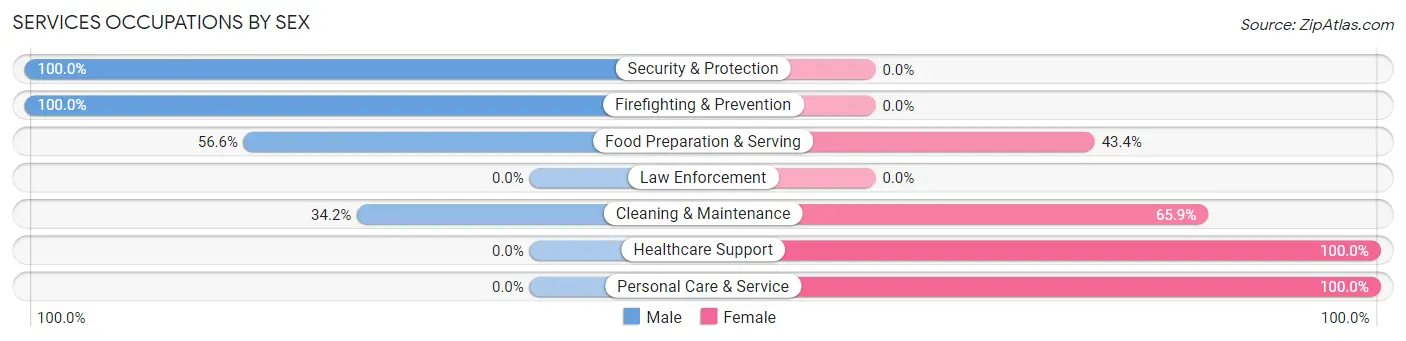
| Occupation | Male | Female |
| Healthcare Support | 0 (0.0%) | 13 (100.0%) |
| Security & Protection | 42 (100.0%) | 0 (0.0%) |
| Firefighting & Prevention | 42 (100.0%) | 0 (0.0%) |
| Law Enforcement | 0 (0.0%) | 0 (0.0%) |
| Food Preparation & Serving | 30 (56.6%) | 23 (43.4%) |
| Cleaning & Maintenance | 14 (34.2%) | 27 (65.8%) |
| Personal Care & Service | 0 (0.0%) | 4 (100.0%) |
| Total (Category) | 86 (56.2%) | 67 (43.8%) |
| Total (Overall) | 344 (52.4%) | 313 (47.6%) |
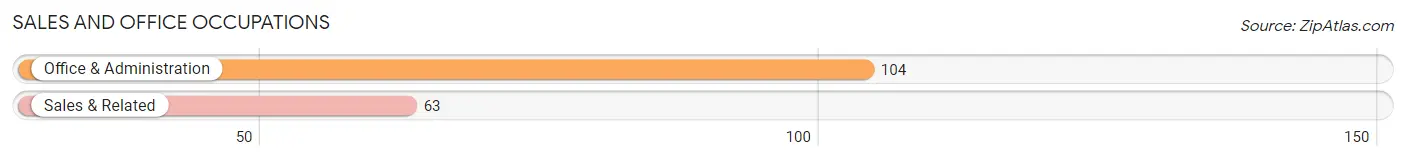
Sales and Office Occupations
The most common Sales and Office occupations in Nashville are Office & Administration (104 | 15.8%), and Sales & Related (63 | 9.6%).
Sales and Office Occupations by Sex
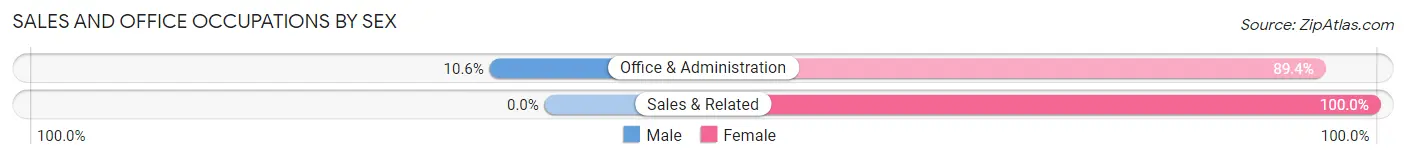
| Occupation | Male | Female |
| Sales & Related | 0 (0.0%) | 63 (100.0%) |
| Office & Administration | 11 (10.6%) | 93 (89.4%) |
| Total (Category) | 11 (6.6%) | 156 (93.4%) |
| Total (Overall) | 344 (52.4%) | 313 (47.6%) |
Natural Resources, Construction and Maintenance Occupations
The most common Natural Resources, Construction and Maintenance occupations in Nashville are Construction & Extraction (41 | 6.2%), and Installation, Maintenance & Repair (15 | 2.3%).

Natural Resources, Construction and Maintenance Occupations by Sex
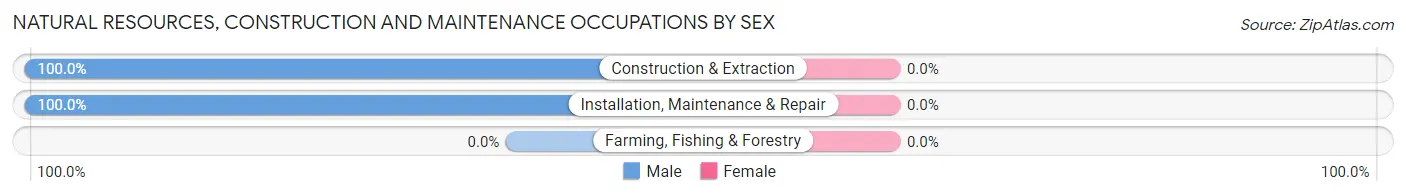
| Occupation | Male | Female |
| Farming, Fishing & Forestry | 0 (0.0%) | 0 (0.0%) |
| Construction & Extraction | 41 (100.0%) | 0 (0.0%) |
| Installation, Maintenance & Repair | 15 (100.0%) | 0 (0.0%) |
| Total (Category) | 56 (100.0%) | 0 (0.0%) |
| Total (Overall) | 344 (52.4%) | 313 (47.6%) |
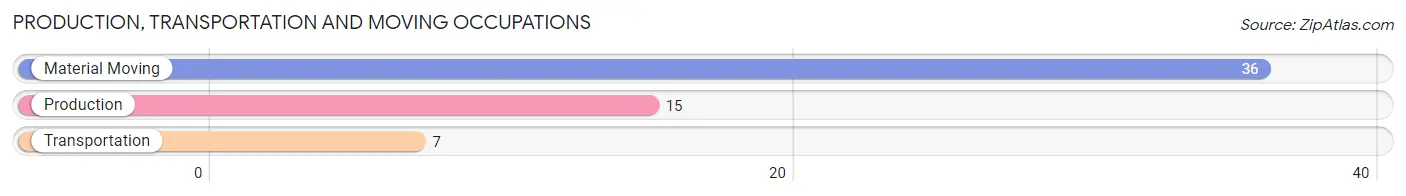
Production, Transportation and Moving Occupations
The most common Production, Transportation and Moving occupations in Nashville are Material Moving (36 | 5.5%), Production (15 | 2.3%), and Transportation (7 | 1.1%).
Production, Transportation and Moving Occupations by Sex
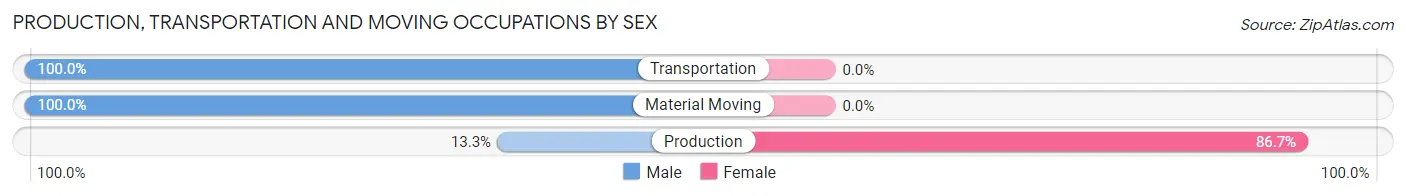
| Occupation | Male | Female |
| Production | 2 (13.3%) | 13 (86.7%) |
| Transportation | 7 (100.0%) | 0 (0.0%) |
| Material Moving | 36 (100.0%) | 0 (0.0%) |
| Total (Category) | 45 (77.6%) | 13 (22.4%) |
| Total (Overall) | 344 (52.4%) | 313 (47.6%) |
Employment Industries by Sex in Nashville
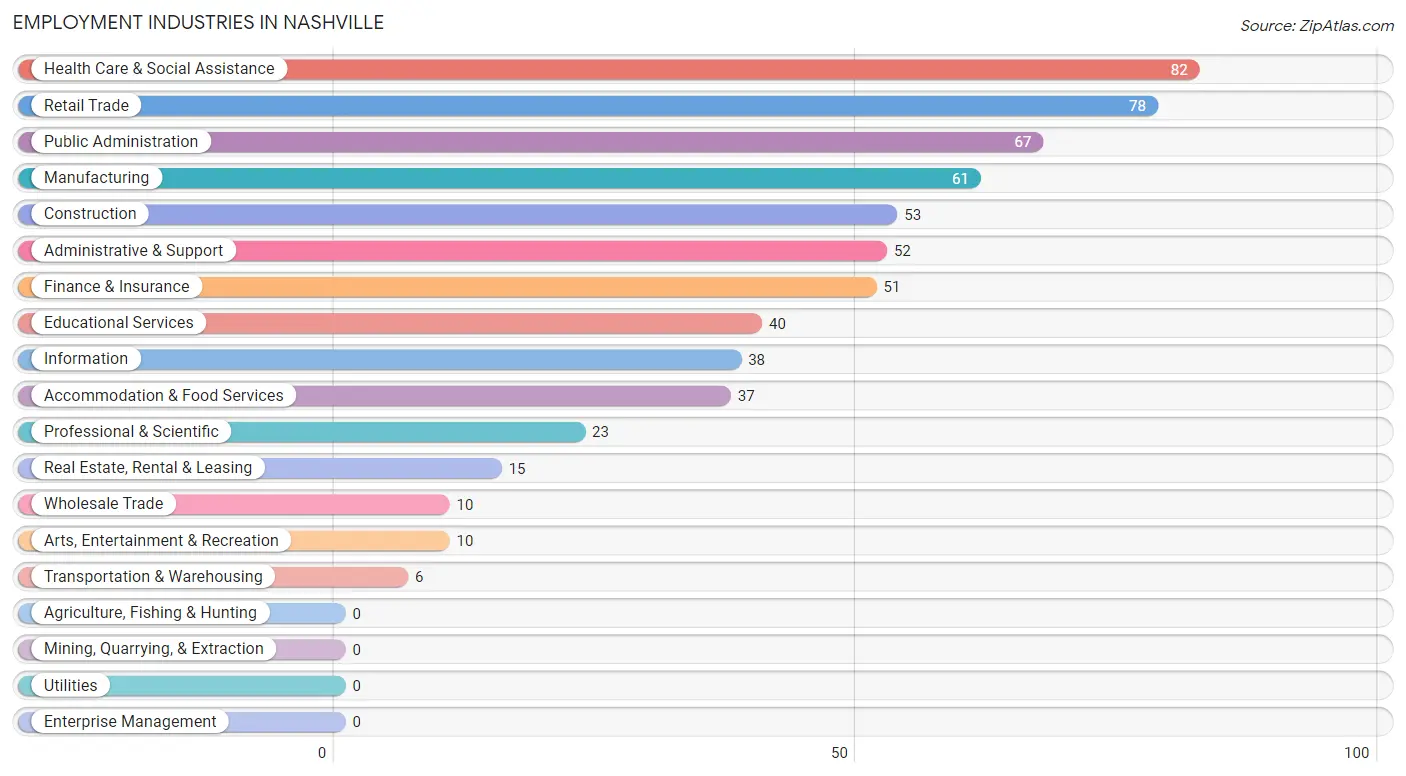
Employment Industries in Nashville
The major employment industries in Nashville include Health Care & Social Assistance (82 | 12.5%), Retail Trade (78 | 11.9%), Public Administration (67 | 10.2%), Manufacturing (61 | 9.3%), and Construction (53 | 8.1%).
Employment Industries by Sex in Nashville
The Nashville industries that see more men than women are Construction (100.0%), Transportation & Warehousing (100.0%), and Professional & Scientific (91.3%), whereas the industries that tend to have a higher number of women are Retail Trade (84.6%), Finance & Insurance (76.5%), and Accommodation & Food Services (75.7%).
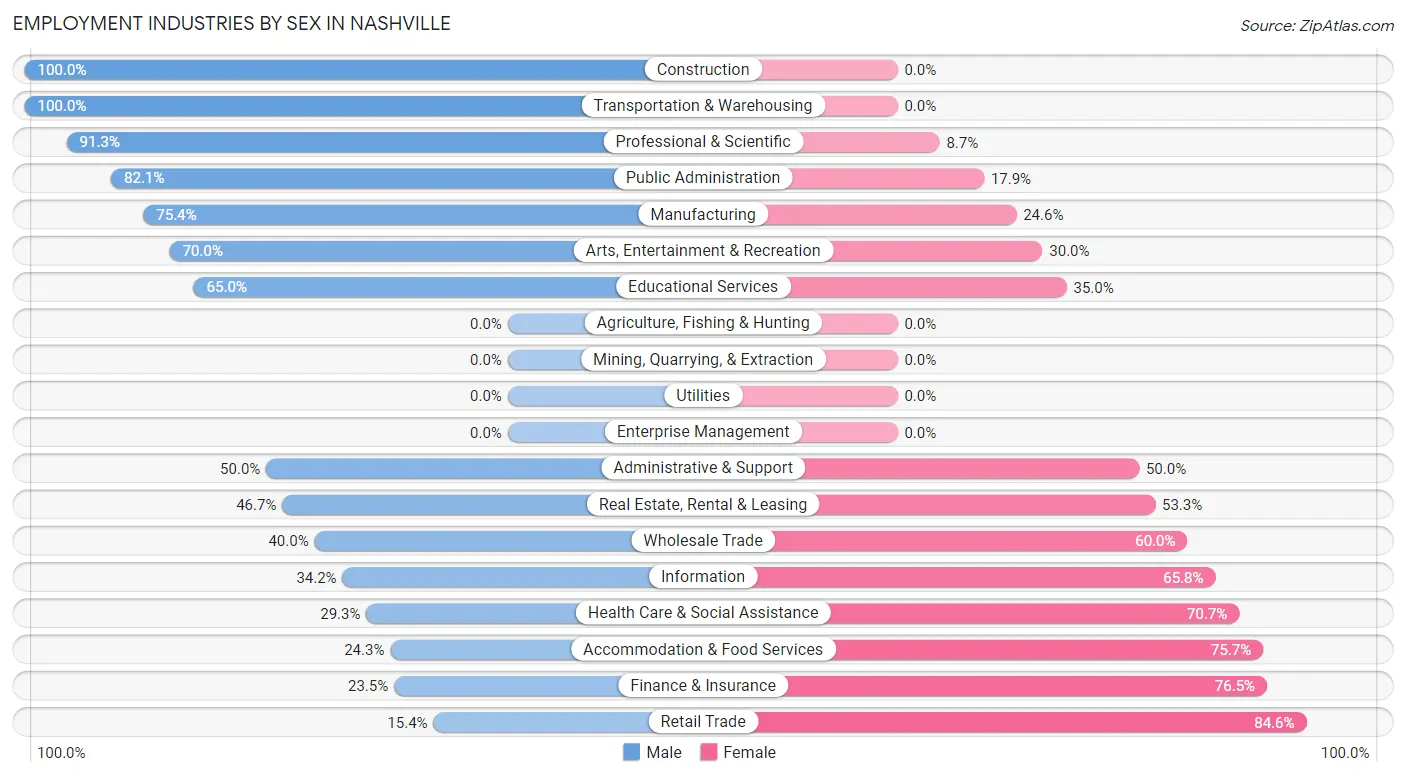
| Industry | Male | Female |
| Agriculture, Fishing & Hunting | 0 (0.0%) | 0 (0.0%) |
| Mining, Quarrying, & Extraction | 0 (0.0%) | 0 (0.0%) |
| Construction | 53 (100.0%) | 0 (0.0%) |
| Manufacturing | 46 (75.4%) | 15 (24.6%) |
| Wholesale Trade | 4 (40.0%) | 6 (60.0%) |
| Retail Trade | 12 (15.4%) | 66 (84.6%) |
| Transportation & Warehousing | 6 (100.0%) | 0 (0.0%) |
| Utilities | 0 (0.0%) | 0 (0.0%) |
| Information | 13 (34.2%) | 25 (65.8%) |
| Finance & Insurance | 12 (23.5%) | 39 (76.5%) |
| Real Estate, Rental & Leasing | 7 (46.7%) | 8 (53.3%) |
| Professional & Scientific | 21 (91.3%) | 2 (8.7%) |
| Enterprise Management | 0 (0.0%) | 0 (0.0%) |
| Administrative & Support | 26 (50.0%) | 26 (50.0%) |
| Educational Services | 26 (65.0%) | 14 (35.0%) |
| Health Care & Social Assistance | 24 (29.3%) | 58 (70.7%) |
| Arts, Entertainment & Recreation | 7 (70.0%) | 3 (30.0%) |
| Accommodation & Food Services | 9 (24.3%) | 28 (75.7%) |
| Public Administration | 55 (82.1%) | 12 (17.9%) |
| Total | 344 (52.4%) | 313 (47.6%) |
Education in Nashville
School Enrollment in Nashville
The most common levels of schooling among the 131 students in Nashville are college / undergraduate (62 | 47.3%), high school (33 | 25.2%), and elementary school (17 | 13.0%).
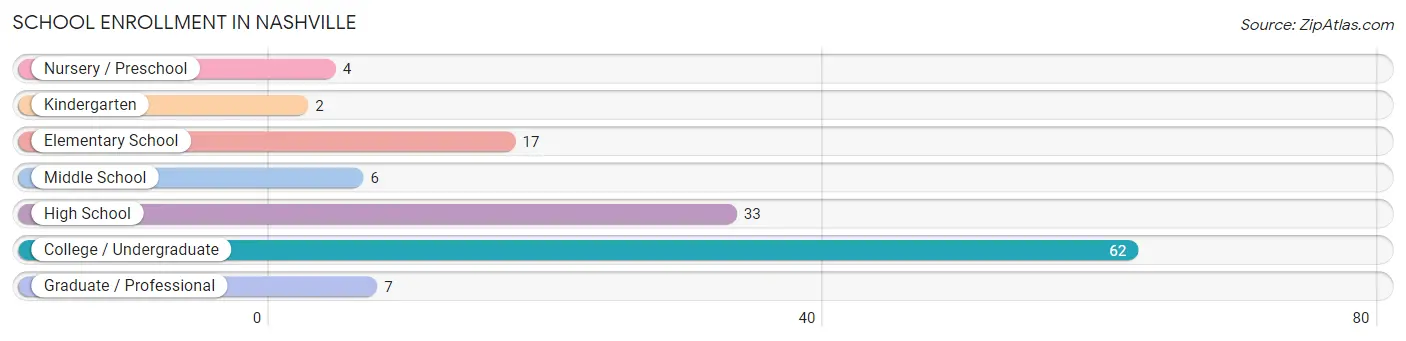
| School Level | # Students | % Students |
| Nursery / Preschool | 4 | 3.0% |
| Kindergarten | 2 | 1.5% |
| Elementary School | 17 | 13.0% |
| Middle School | 6 | 4.6% |
| High School | 33 | 25.2% |
| College / Undergraduate | 62 | 47.3% |
| Graduate / Professional | 7 | 5.3% |
| Total | 131 | 100.0% |
School Enrollment by Age by Funding Source in Nashville
Out of a total of 131 students who are enrolled in schools in Nashville, 27 (20.6%) attend a private institution, while the remaining 104 (79.4%) are enrolled in public schools. The age group of 3 to 4 year olds has the highest likelihood of being enrolled in private schools, with 4 (100.0% in the age bracket) enrolled. Conversely, the age group of 5 to 9 year old has the lowest likelihood of being enrolled in a private school, with 7 (100.0% in the age bracket) attending a public institution.
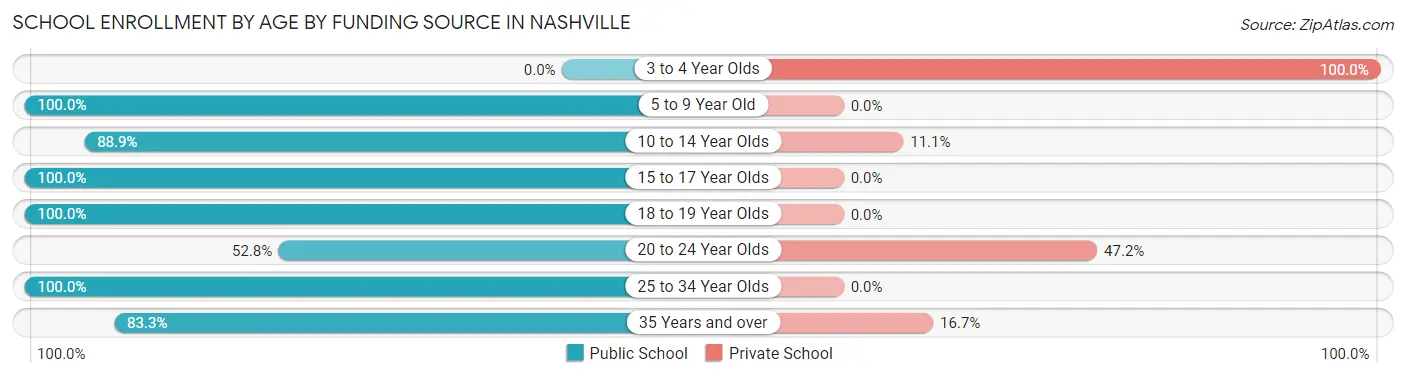
| Age Bracket | Public School | Private School |
| 3 to 4 Year Olds | 0 (0.0%) | 4 (100.0%) |
| 5 to 9 Year Old | 7 (100.0%) | 0 (0.0%) |
| 10 to 14 Year Olds | 24 (88.9%) | 3 (11.1%) |
| 15 to 17 Year Olds | 23 (100.0%) | 0 (0.0%) |
| 18 to 19 Year Olds | 2 (100.0%) | 0 (0.0%) |
| 20 to 24 Year Olds | 19 (52.8%) | 17 (47.2%) |
| 25 to 34 Year Olds | 14 (100.0%) | 0 (0.0%) |
| 35 Years and over | 15 (83.3%) | 3 (16.7%) |
| Total | 104 (79.4%) | 27 (20.6%) |
Educational Attainment by Field of Study in Nashville
Education (137 | 26.6%), literature & languages (74 | 14.4%), engineering (63 | 12.2%), business (49 | 9.5%), and science & technology (33 | 6.4%) are the most common fields of study among 515 individuals in Nashville who have obtained a bachelor's degree or higher.
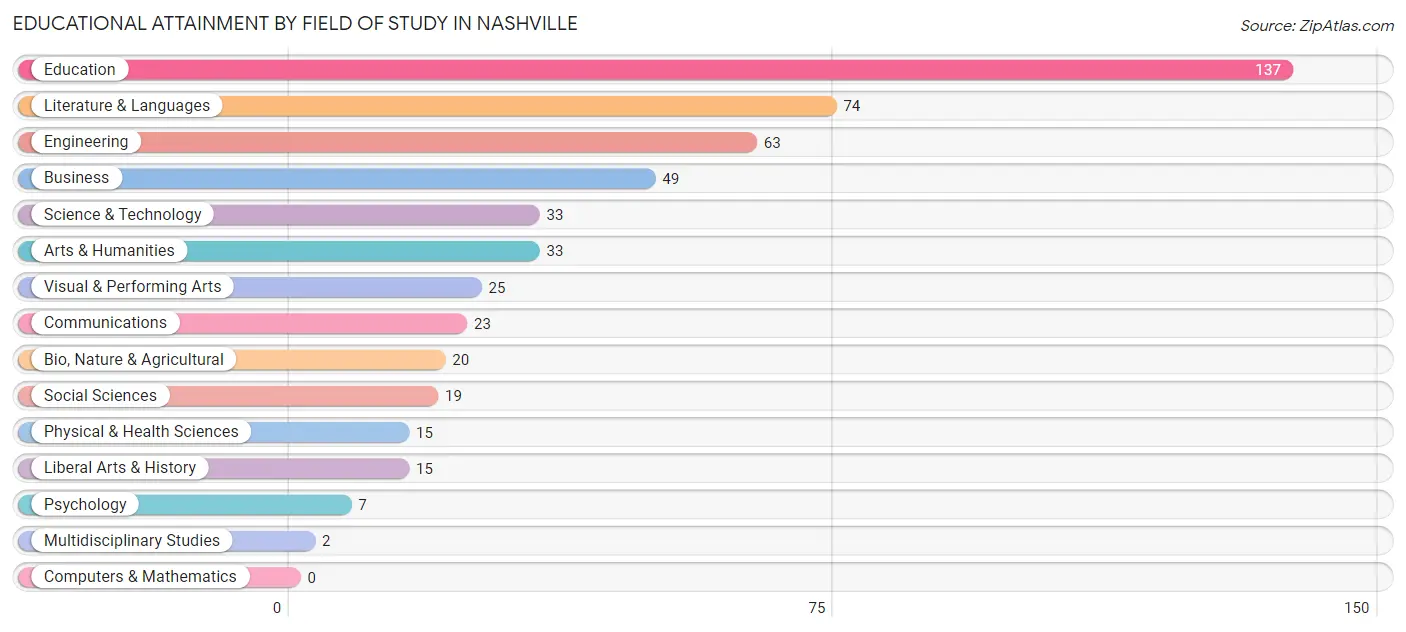
| Field of Study | # Graduates | % Graduates |
| Computers & Mathematics | 0 | 0.0% |
| Bio, Nature & Agricultural | 20 | 3.9% |
| Physical & Health Sciences | 15 | 2.9% |
| Psychology | 7 | 1.4% |
| Social Sciences | 19 | 3.7% |
| Engineering | 63 | 12.2% |
| Multidisciplinary Studies | 2 | 0.4% |
| Science & Technology | 33 | 6.4% |
| Business | 49 | 9.5% |
| Education | 137 | 26.6% |
| Literature & Languages | 74 | 14.4% |
| Liberal Arts & History | 15 | 2.9% |
| Visual & Performing Arts | 25 | 4.9% |
| Communications | 23 | 4.5% |
| Arts & Humanities | 33 | 6.4% |
| Total | 515 | 100.0% |
Transportation & Commute in Nashville
Vehicle Availability by Sex in Nashville
The most prevalent vehicle ownership categories in Nashville are males with 2 vehicles (152, accounting for 53.0%) and females with 2 vehicles (92, making up 54.9%).
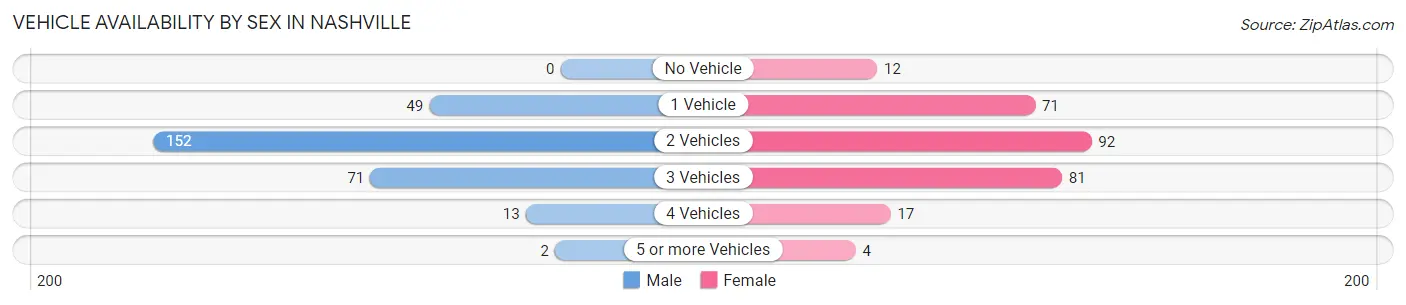
| Vehicles Available | Male | Female |
| No Vehicle | 0 (0.0%) | 12 (4.3%) |
| 1 Vehicle | 49 (17.1%) | 71 (25.6%) |
| 2 Vehicles | 152 (53.0%) | 92 (33.2%) |
| 3 Vehicles | 71 (24.7%) | 81 (29.2%) |
| 4 Vehicles | 13 (4.5%) | 17 (6.1%) |
| 5 or more Vehicles | 2 (0.7%) | 4 (1.4%) |
| Total | 287 (100.0%) | 277 (100.0%) |
Commute Time in Nashville
The most frequently occuring commute durations in Nashville are 5 to 9 minutes (112 commuters, 21.4%), 30 to 34 minutes (80 commuters, 15.3%), and less than 5 minutes (71 commuters, 13.6%).
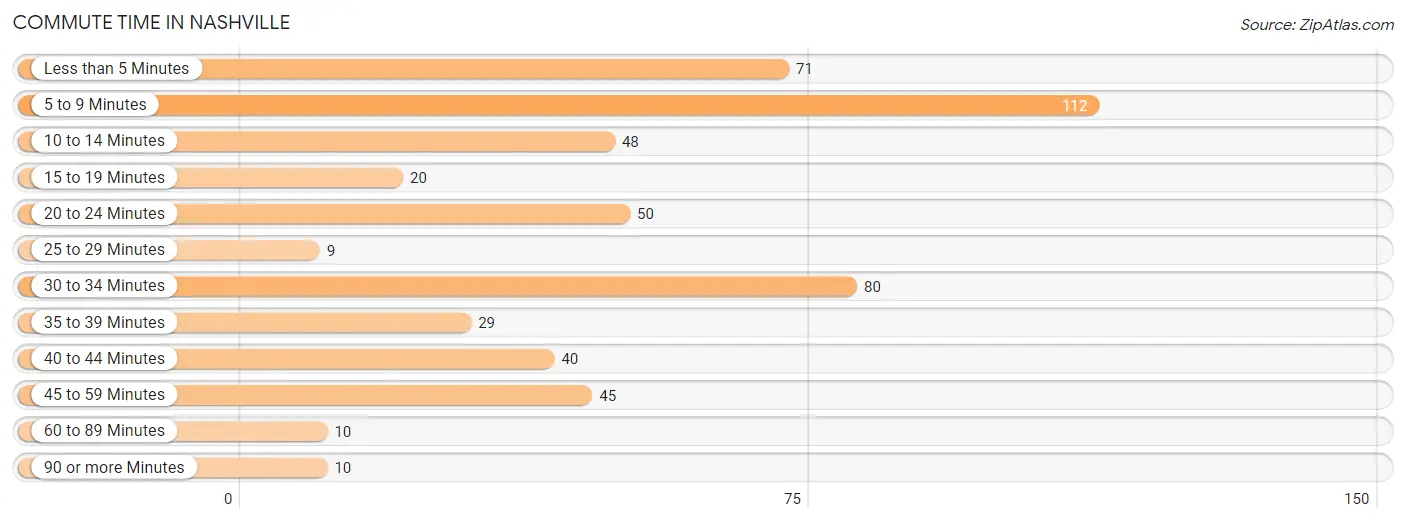
| Commute Time | # Commuters | % Commuters |
| Less than 5 Minutes | 71 | 13.6% |
| 5 to 9 Minutes | 112 | 21.4% |
| 10 to 14 Minutes | 48 | 9.2% |
| 15 to 19 Minutes | 20 | 3.8% |
| 20 to 24 Minutes | 50 | 9.5% |
| 25 to 29 Minutes | 9 | 1.7% |
| 30 to 34 Minutes | 80 | 15.3% |
| 35 to 39 Minutes | 29 | 5.5% |
| 40 to 44 Minutes | 40 | 7.6% |
| 45 to 59 Minutes | 45 | 8.6% |
| 60 to 89 Minutes | 10 | 1.9% |
| 90 or more Minutes | 10 | 1.9% |
Commute Time by Sex in Nashville
The most common commute times in Nashville are 30 to 34 minutes (59 commuters, 22.8%) for males and 5 to 9 minutes (65 commuters, 24.5%) for females.
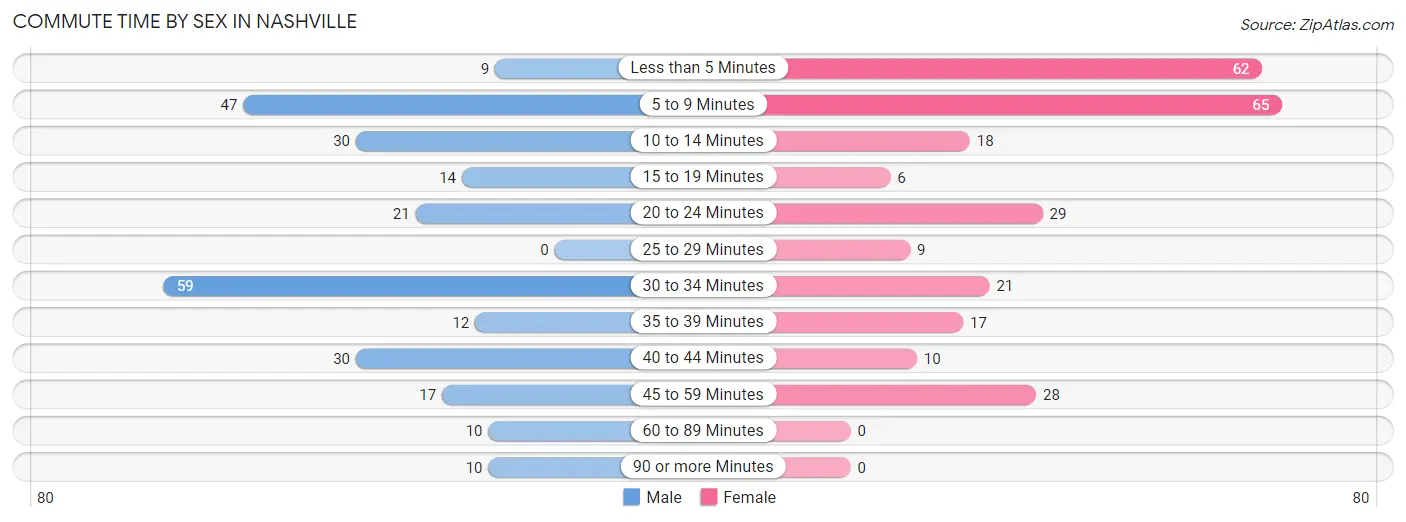
| Commute Time | Male | Female |
| Less than 5 Minutes | 9 (3.5%) | 62 (23.4%) |
| 5 to 9 Minutes | 47 (18.1%) | 65 (24.5%) |
| 10 to 14 Minutes | 30 (11.6%) | 18 (6.8%) |
| 15 to 19 Minutes | 14 (5.4%) | 6 (2.3%) |
| 20 to 24 Minutes | 21 (8.1%) | 29 (10.9%) |
| 25 to 29 Minutes | 0 (0.0%) | 9 (3.4%) |
| 30 to 34 Minutes | 59 (22.8%) | 21 (7.9%) |
| 35 to 39 Minutes | 12 (4.6%) | 17 (6.4%) |
| 40 to 44 Minutes | 30 (11.6%) | 10 (3.8%) |
| 45 to 59 Minutes | 17 (6.6%) | 28 (10.6%) |
| 60 to 89 Minutes | 10 (3.9%) | 0 (0.0%) |
| 90 or more Minutes | 10 (3.9%) | 0 (0.0%) |
Time of Departure to Work by Sex in Nashville
The most frequent times of departure to work in Nashville are 8:00 AM to 8:29 AM (48, 18.5%) for males and 7:30 AM to 7:59 AM (54, 20.4%) for females.
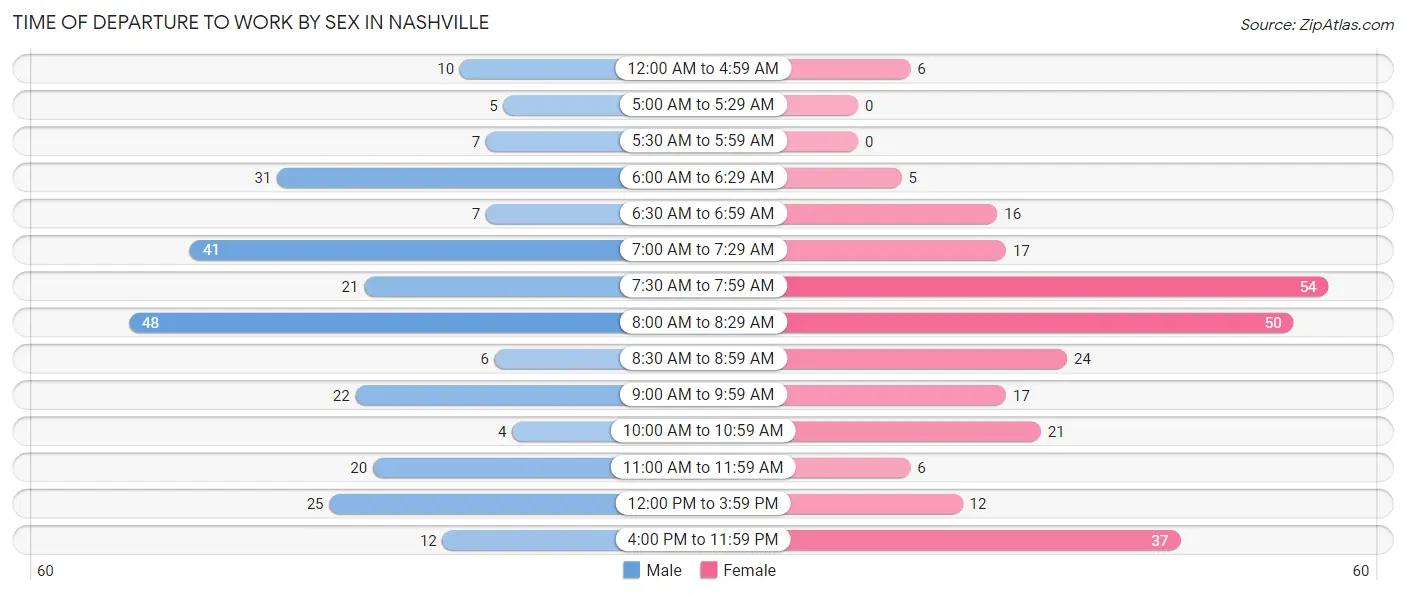
| Time of Departure | Male | Female |
| 12:00 AM to 4:59 AM | 10 (3.9%) | 6 (2.3%) |
| 5:00 AM to 5:29 AM | 5 (1.9%) | 0 (0.0%) |
| 5:30 AM to 5:59 AM | 7 (2.7%) | 0 (0.0%) |
| 6:00 AM to 6:29 AM | 31 (12.0%) | 5 (1.9%) |
| 6:30 AM to 6:59 AM | 7 (2.7%) | 16 (6.0%) |
| 7:00 AM to 7:29 AM | 41 (15.8%) | 17 (6.4%) |
| 7:30 AM to 7:59 AM | 21 (8.1%) | 54 (20.4%) |
| 8:00 AM to 8:29 AM | 48 (18.5%) | 50 (18.9%) |
| 8:30 AM to 8:59 AM | 6 (2.3%) | 24 (9.1%) |
| 9:00 AM to 9:59 AM | 22 (8.5%) | 17 (6.4%) |
| 10:00 AM to 10:59 AM | 4 (1.5%) | 21 (7.9%) |
| 11:00 AM to 11:59 AM | 20 (7.7%) | 6 (2.3%) |
| 12:00 PM to 3:59 PM | 25 (9.7%) | 12 (4.5%) |
| 4:00 PM to 11:59 PM | 12 (4.6%) | 37 (14.0%) |
| Total | 259 (100.0%) | 265 (100.0%) |
Housing Occupancy in Nashville
Occupancy by Ownership in Nashville
Of the total 781 dwellings in Nashville, owner-occupied units account for 502 (64.3%), while renter-occupied units make up 279 (35.7%).
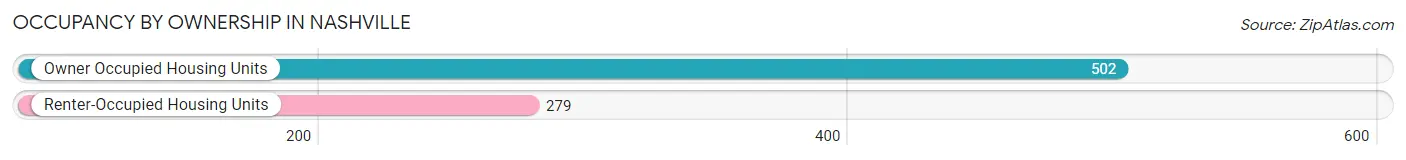
| Occupancy | # Housing Units | % Housing Units |
| Owner Occupied Housing Units | 502 | 64.3% |
| Renter-Occupied Housing Units | 279 | 35.7% |
| Total Occupied Housing Units | 781 | 100.0% |
Occupancy by Household Size in Nashville
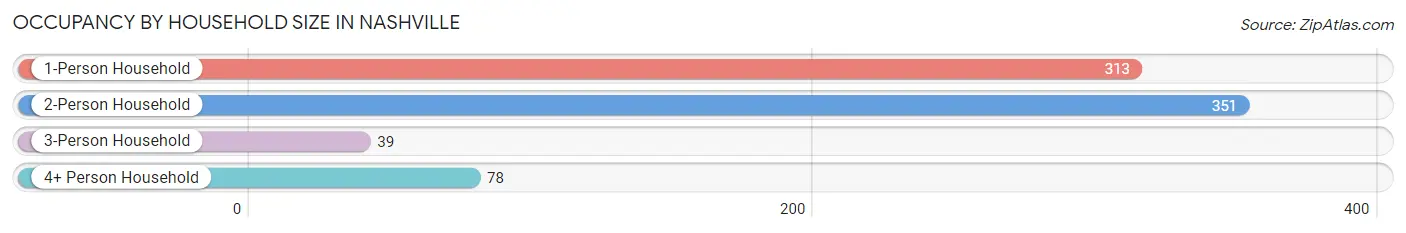
| Household Size | # Housing Units | % Housing Units |
| 1-Person Household | 313 | 40.1% |
| 2-Person Household | 351 | 44.9% |
| 3-Person Household | 39 | 5.0% |
| 4+ Person Household | 78 | 10.0% |
| Total Housing Units | 781 | 100.0% |
Occupancy by Ownership by Household Size in Nashville
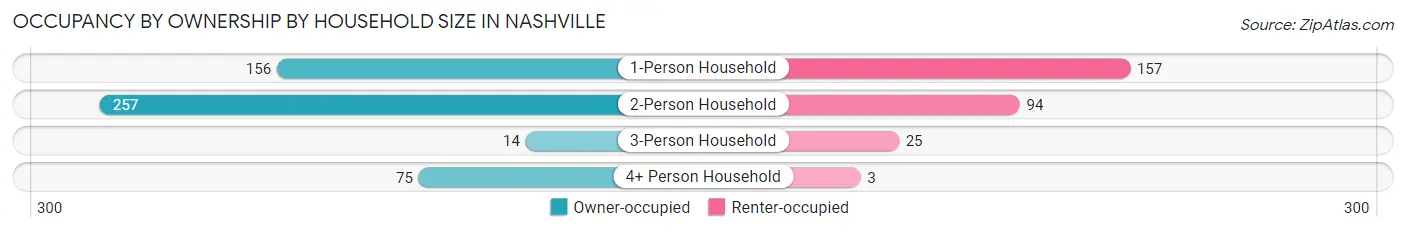
| Household Size | Owner-occupied | Renter-occupied |
| 1-Person Household | 156 (49.8%) | 157 (50.2%) |
| 2-Person Household | 257 (73.2%) | 94 (26.8%) |
| 3-Person Household | 14 (35.9%) | 25 (64.1%) |
| 4+ Person Household | 75 (96.2%) | 3 (3.8%) |
| Total Housing Units | 502 (64.3%) | 279 (35.7%) |
Occupancy by Educational Attainment in Nashville
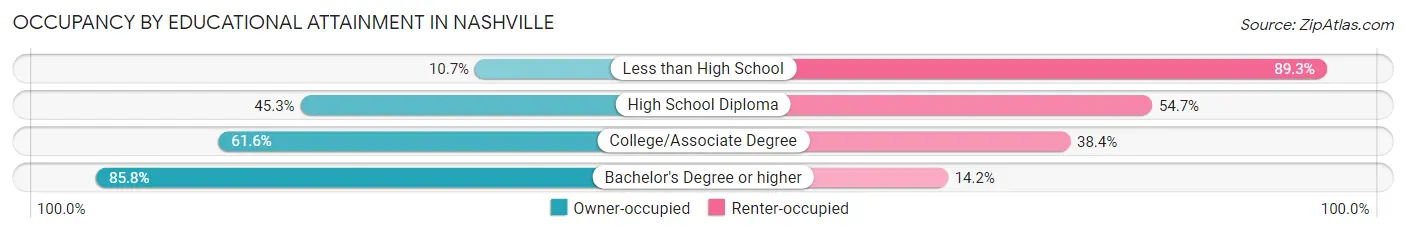
| Household Size | Owner-occupied | Renter-occupied |
| Less than High School | 3 (10.7%) | 25 (89.3%) |
| High School Diploma | 92 (45.3%) | 111 (54.7%) |
| College/Associate Degree | 165 (61.6%) | 103 (38.4%) |
| Bachelor's Degree or higher | 242 (85.8%) | 40 (14.2%) |
Occupancy by Age of Householder in Nashville
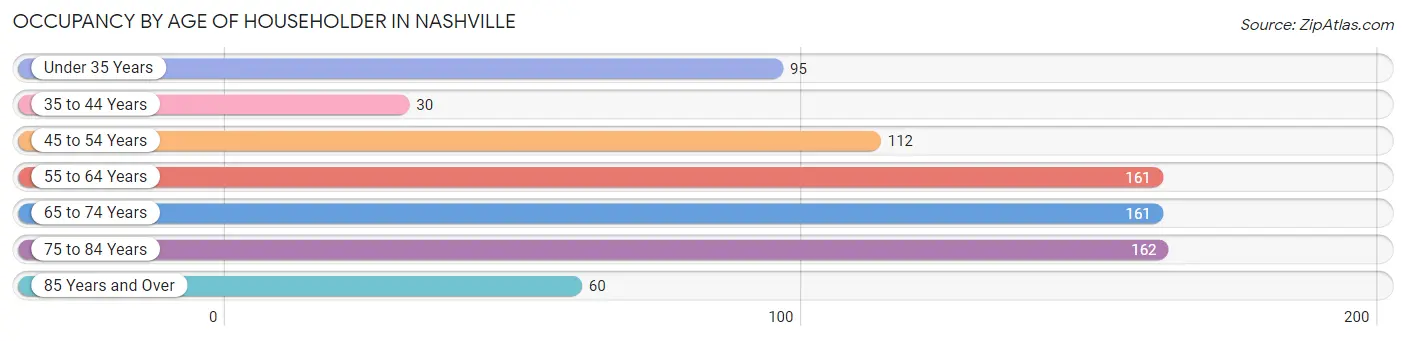
| Age Bracket | # Households | % Households |
| Under 35 Years | 95 | 12.2% |
| 35 to 44 Years | 30 | 3.8% |
| 45 to 54 Years | 112 | 14.3% |
| 55 to 64 Years | 161 | 20.6% |
| 65 to 74 Years | 161 | 20.6% |
| 75 to 84 Years | 162 | 20.7% |
| 85 Years and Over | 60 | 7.7% |
| Total | 781 | 100.0% |
Housing Finances in Nashville
Median Income by Occupancy in Nashville
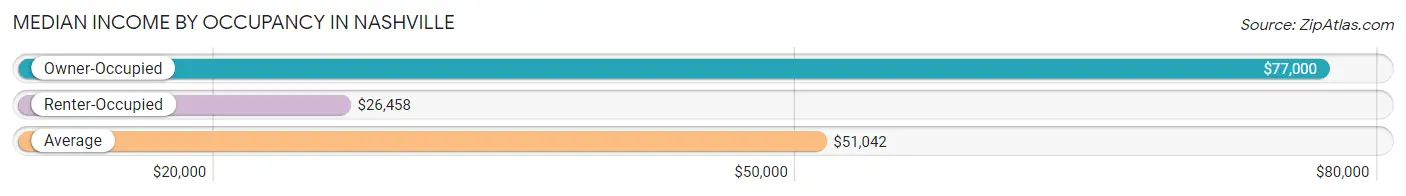
| Occupancy Type | # Households | Median Income |
| Owner-Occupied | 502 (64.3%) | $77,000 |
| Renter-Occupied | 279 (35.7%) | $26,458 |
| Average | 781 (100.0%) | $51,042 |
Occupancy by Householder Income Bracket in Nashville
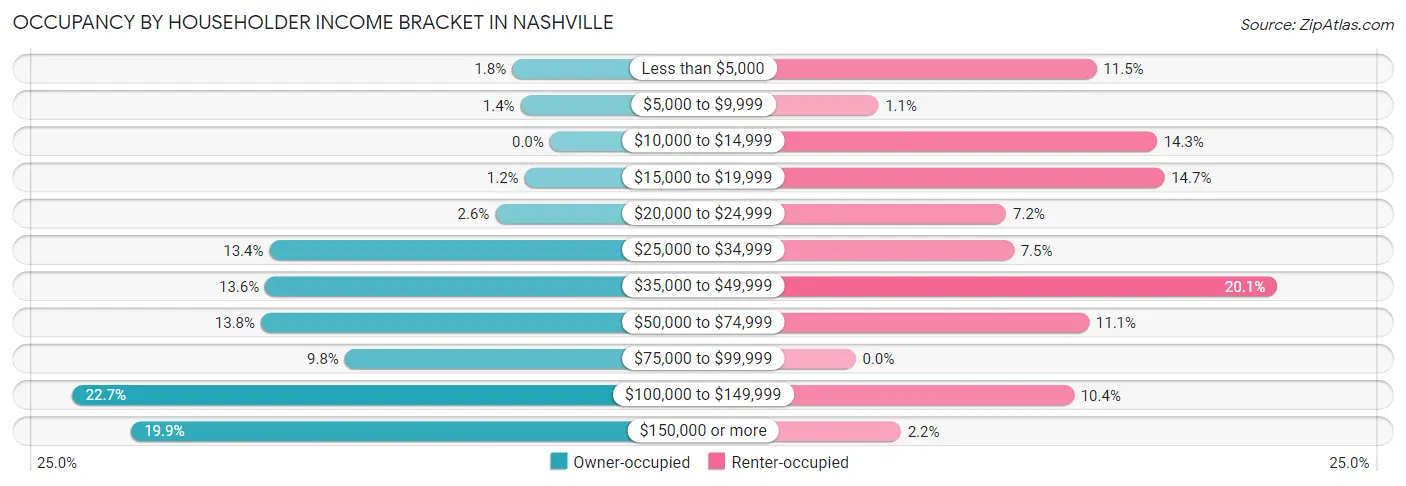
| Income Bracket | Owner-occupied | Renter-occupied |
| Less than $5,000 | 9 (1.8%) | 32 (11.5%) |
| $5,000 to $9,999 | 7 (1.4%) | 3 (1.1%) |
| $10,000 to $14,999 | 0 (0.0%) | 40 (14.3%) |
| $15,000 to $19,999 | 6 (1.2%) | 41 (14.7%) |
| $20,000 to $24,999 | 13 (2.6%) | 20 (7.2%) |
| $25,000 to $34,999 | 67 (13.4%) | 21 (7.5%) |
| $35,000 to $49,999 | 68 (13.6%) | 56 (20.1%) |
| $50,000 to $74,999 | 69 (13.8%) | 31 (11.1%) |
| $75,000 to $99,999 | 49 (9.8%) | 0 (0.0%) |
| $100,000 to $149,999 | 114 (22.7%) | 29 (10.4%) |
| $150,000 or more | 100 (19.9%) | 6 (2.1%) |
| Total | 502 (100.0%) | 279 (100.0%) |
Monthly Housing Cost Tiers in Nashville
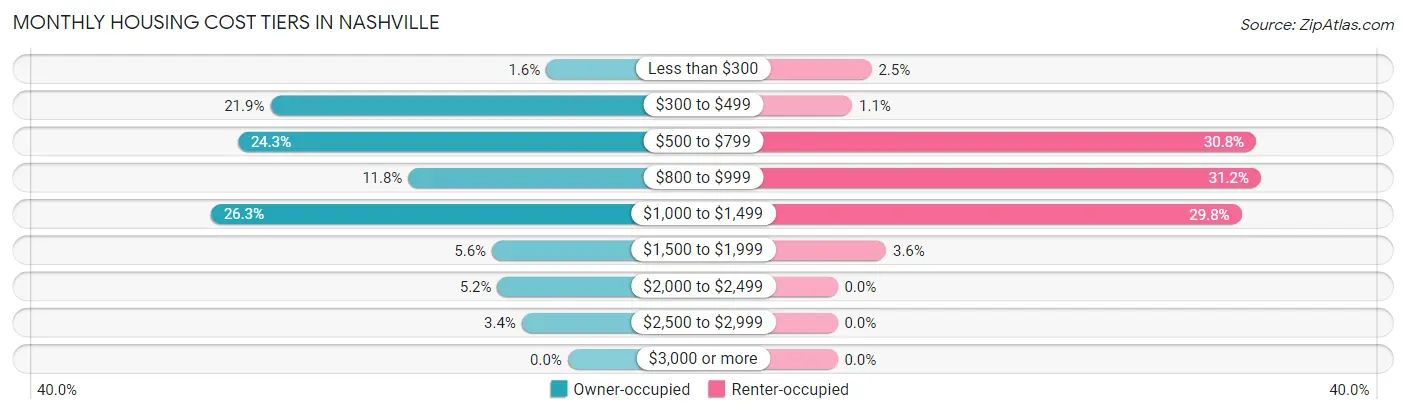
| Monthly Cost | Owner-occupied | Renter-occupied |
| Less than $300 | 8 (1.6%) | 7 (2.5%) |
| $300 to $499 | 110 (21.9%) | 3 (1.1%) |
| $500 to $799 | 122 (24.3%) | 86 (30.8%) |
| $800 to $999 | 59 (11.7%) | 87 (31.2%) |
| $1,000 to $1,499 | 132 (26.3%) | 83 (29.7%) |
| $1,500 to $1,999 | 28 (5.6%) | 10 (3.6%) |
| $2,000 to $2,499 | 26 (5.2%) | 0 (0.0%) |
| $2,500 to $2,999 | 17 (3.4%) | 0 (0.0%) |
| $3,000 or more | 0 (0.0%) | 0 (0.0%) |
| Total | 502 (100.0%) | 279 (100.0%) |
Physical Housing Characteristics in Nashville
Housing Structures in Nashville
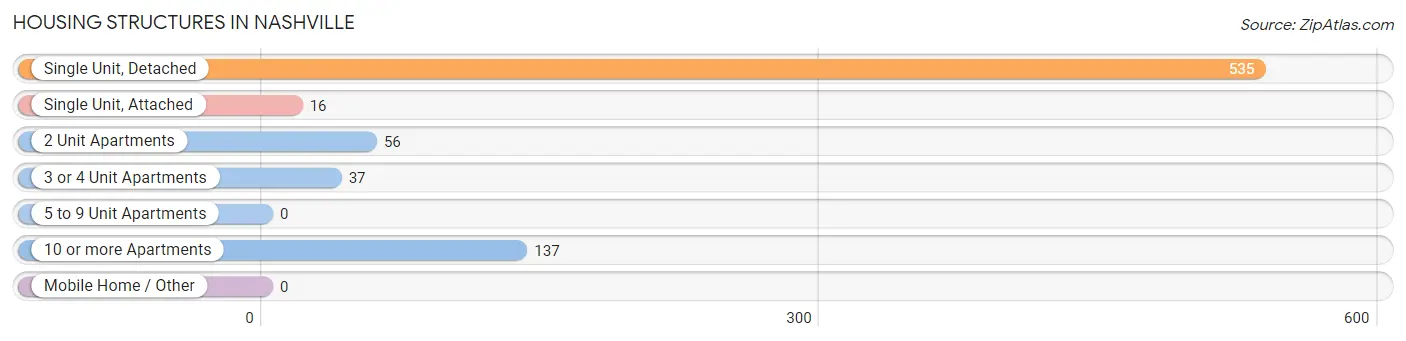
| Structure Type | # Housing Units | % Housing Units |
| Single Unit, Detached | 535 | 68.5% |
| Single Unit, Attached | 16 | 2.1% |
| 2 Unit Apartments | 56 | 7.2% |
| 3 or 4 Unit Apartments | 37 | 4.7% |
| 5 to 9 Unit Apartments | 0 | 0.0% |
| 10 or more Apartments | 137 | 17.5% |
| Mobile Home / Other | 0 | 0.0% |
| Total | 781 | 100.0% |
Housing Structures by Occupancy in Nashville
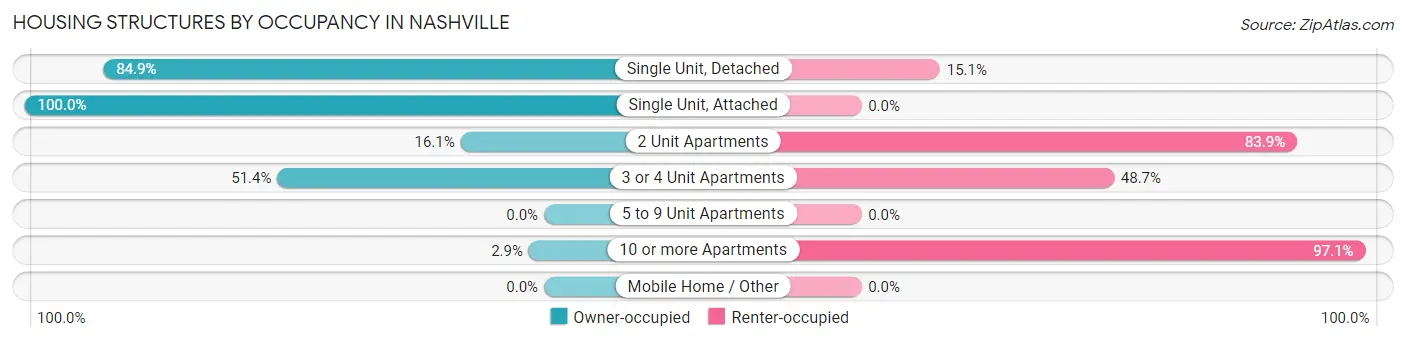
| Structure Type | Owner-occupied | Renter-occupied |
| Single Unit, Detached | 454 (84.9%) | 81 (15.1%) |
| Single Unit, Attached | 16 (100.0%) | 0 (0.0%) |
| 2 Unit Apartments | 9 (16.1%) | 47 (83.9%) |
| 3 or 4 Unit Apartments | 19 (51.3%) | 18 (48.6%) |
| 5 to 9 Unit Apartments | 0 (0.0%) | 0 (0.0%) |
| 10 or more Apartments | 4 (2.9%) | 133 (97.1%) |
| Mobile Home / Other | 0 (0.0%) | 0 (0.0%) |
| Total | 502 (64.3%) | 279 (35.7%) |
Housing Structures by Number of Rooms in Nashville
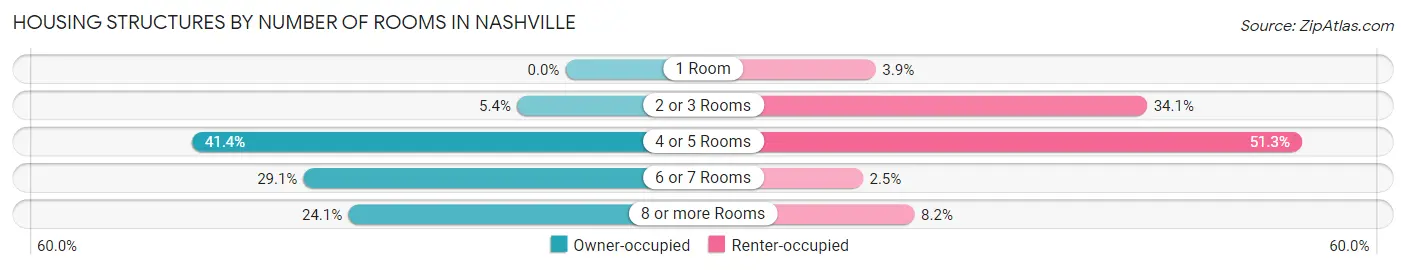
| Number of Rooms | Owner-occupied | Renter-occupied |
| 1 Room | 0 (0.0%) | 11 (3.9%) |
| 2 or 3 Rooms | 27 (5.4%) | 95 (34.1%) |
| 4 or 5 Rooms | 208 (41.4%) | 143 (51.2%) |
| 6 or 7 Rooms | 146 (29.1%) | 7 (2.5%) |
| 8 or more Rooms | 121 (24.1%) | 23 (8.2%) |
| Total | 502 (100.0%) | 279 (100.0%) |
Housing Structure by Heating Type in Nashville
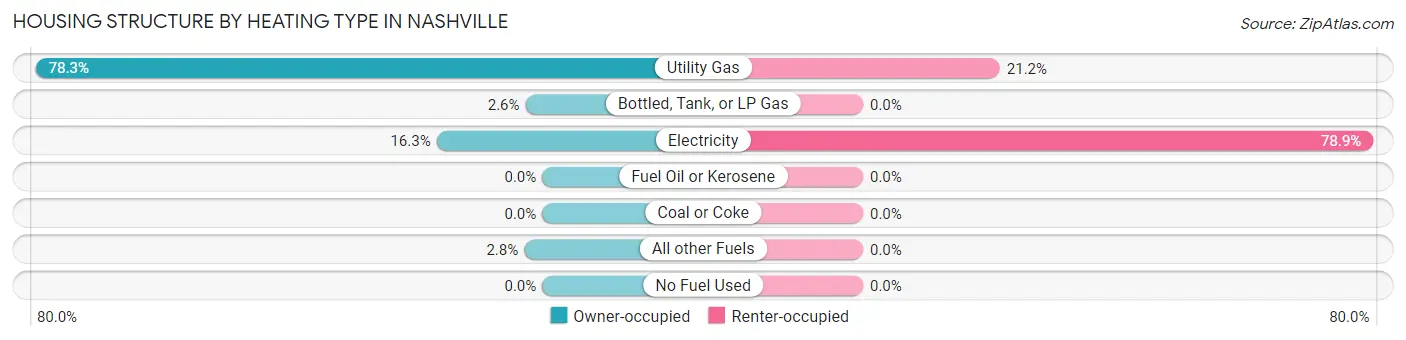
| Heating Type | Owner-occupied | Renter-occupied |
| Utility Gas | 393 (78.3%) | 59 (21.1%) |
| Bottled, Tank, or LP Gas | 13 (2.6%) | 0 (0.0%) |
| Electricity | 82 (16.3%) | 220 (78.8%) |
| Fuel Oil or Kerosene | 0 (0.0%) | 0 (0.0%) |
| Coal or Coke | 0 (0.0%) | 0 (0.0%) |
| All other Fuels | 14 (2.8%) | 0 (0.0%) |
| No Fuel Used | 0 (0.0%) | 0 (0.0%) |
| Total | 502 (100.0%) | 279 (100.0%) |
Household Vehicle Usage in Nashville
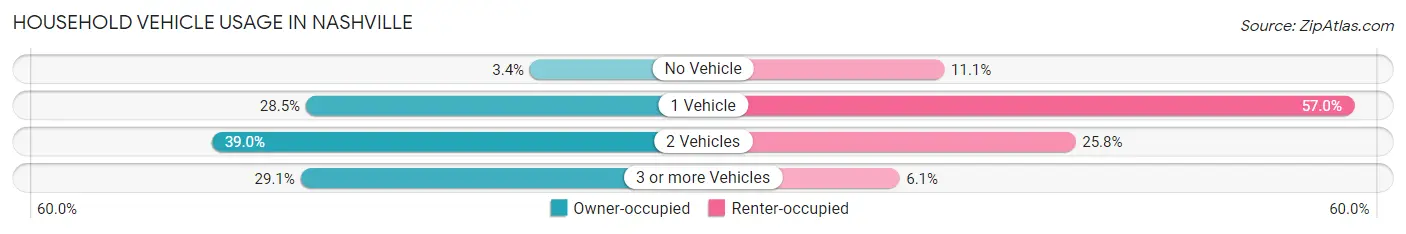
| Vehicles per Household | Owner-occupied | Renter-occupied |
| No Vehicle | 17 (3.4%) | 31 (11.1%) |
| 1 Vehicle | 143 (28.5%) | 159 (57.0%) |
| 2 Vehicles | 196 (39.0%) | 72 (25.8%) |
| 3 or more Vehicles | 146 (29.1%) | 17 (6.1%) |
| Total | 502 (100.0%) | 279 (100.0%) |
Real Estate & Mortgages in Nashville
Real Estate and Mortgage Overview in Nashville
| Characteristic | Without Mortgage | With Mortgage |
| Housing Units | 208 | 294 |
| Median Property Value | $235,200 | $191,000 |
| Median Household Income | $66,000 | $51 |
| Monthly Housing Costs | $488 | $0 |
| Real Estate Taxes | $1,148 | $3 |
Property Value by Mortgage Status in Nashville
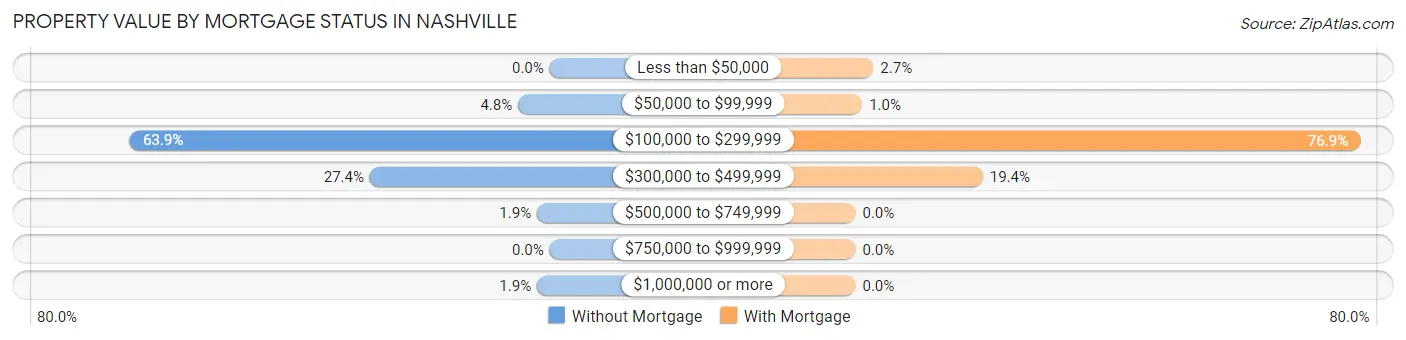
| Property Value | Without Mortgage | With Mortgage |
| Less than $50,000 | 0 (0.0%) | 8 (2.7%) |
| $50,000 to $99,999 | 10 (4.8%) | 3 (1.0%) |
| $100,000 to $299,999 | 133 (63.9%) | 226 (76.9%) |
| $300,000 to $499,999 | 57 (27.4%) | 57 (19.4%) |
| $500,000 to $749,999 | 4 (1.9%) | 0 (0.0%) |
| $750,000 to $999,999 | 0 (0.0%) | 0 (0.0%) |
| $1,000,000 or more | 4 (1.9%) | 0 (0.0%) |
| Total | 208 (100.0%) | 294 (100.0%) |
Household Income by Mortgage Status in Nashville
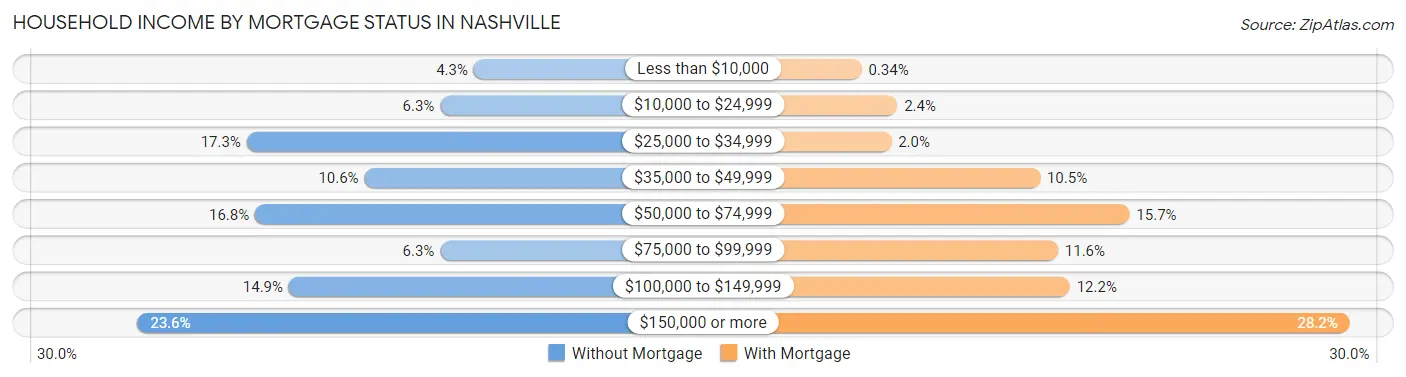
| Household Income | Without Mortgage | With Mortgage |
| Less than $10,000 | 9 (4.3%) | 1 (0.3%) |
| $10,000 to $24,999 | 13 (6.2%) | 7 (2.4%) |
| $25,000 to $34,999 | 36 (17.3%) | 6 (2.0%) |
| $35,000 to $49,999 | 22 (10.6%) | 31 (10.5%) |
| $50,000 to $74,999 | 35 (16.8%) | 46 (15.7%) |
| $75,000 to $99,999 | 13 (6.2%) | 34 (11.6%) |
| $100,000 to $149,999 | 31 (14.9%) | 36 (12.2%) |
| $150,000 or more | 49 (23.6%) | 83 (28.2%) |
| Total | 208 (100.0%) | 294 (100.0%) |
Property Value to Household Income Ratio in Nashville
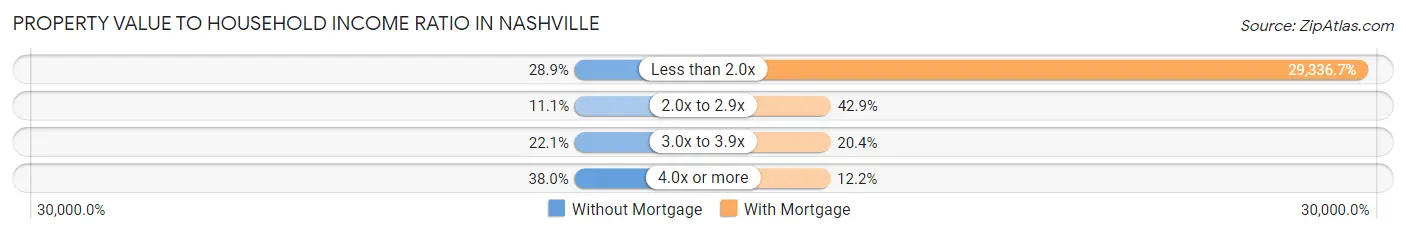
| Value-to-Income Ratio | Without Mortgage | With Mortgage |
| Less than 2.0x | 60 (28.8%) | 86,250 (29,336.7%) |
| 2.0x to 2.9x | 23 (11.1%) | 126 (42.9%) |
| 3.0x to 3.9x | 46 (22.1%) | 60 (20.4%) |
| 4.0x or more | 79 (38.0%) | 36 (12.2%) |
| Total | 208 (100.0%) | 294 (100.0%) |
Real Estate Taxes by Mortgage Status in Nashville
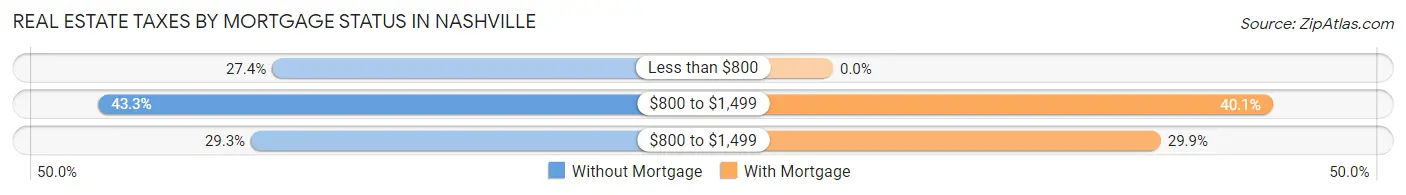
| Property Taxes | Without Mortgage | With Mortgage |
| Less than $800 | 57 (27.4%) | 0 (0.0%) |
| $800 to $1,499 | 90 (43.3%) | 118 (40.1%) |
| $800 to $1,499 | 61 (29.3%) | 88 (29.9%) |
| Total | 208 (100.0%) | 294 (100.0%) |
Health & Disability in Nashville
Health Insurance Coverage by Age in Nashville
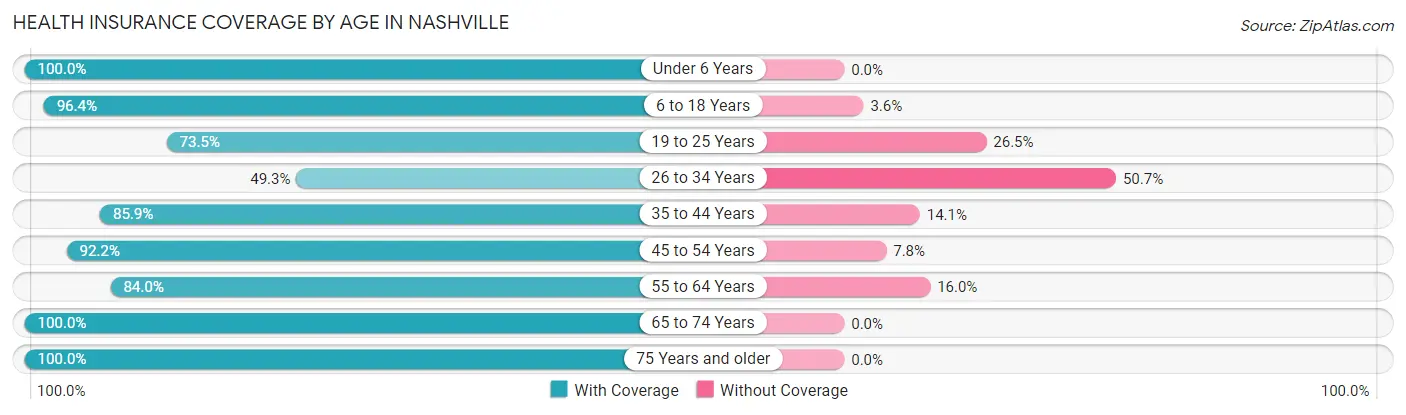
| Age Bracket | With Coverage | Without Coverage |
| Under 6 Years | 61 (100.0%) | 0 (0.0%) |
| 6 to 18 Years | 54 (96.4%) | 2 (3.6%) |
| 19 to 25 Years | 111 (73.5%) | 40 (26.5%) |
| 26 to 34 Years | 37 (49.3%) | 38 (50.7%) |
| 35 to 44 Years | 61 (85.9%) | 10 (14.1%) |
| 45 to 54 Years | 200 (92.2%) | 17 (7.8%) |
| 55 to 64 Years | 194 (84.0%) | 37 (16.0%) |
| 65 to 74 Years | 236 (100.0%) | 0 (0.0%) |
| 75 Years and older | 296 (100.0%) | 0 (0.0%) |
| Total | 1,250 (89.7%) | 144 (10.3%) |
Health Insurance Coverage by Citizenship Status in Nashville
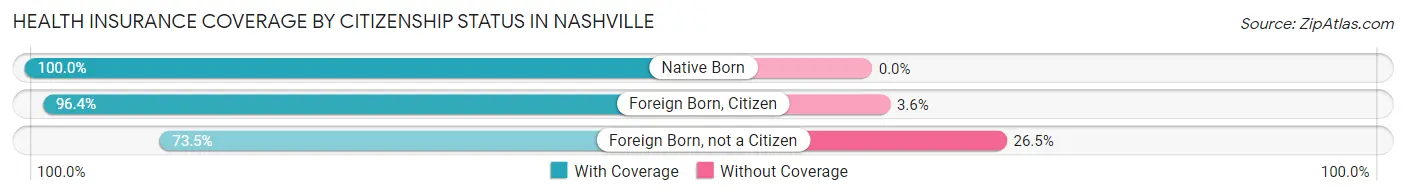
| Citizenship Status | With Coverage | Without Coverage |
| Native Born | 61 (100.0%) | 0 (0.0%) |
| Foreign Born, Citizen | 54 (96.4%) | 2 (3.6%) |
| Foreign Born, not a Citizen | 111 (73.5%) | 40 (26.5%) |
Health Insurance Coverage by Household Income in Nashville
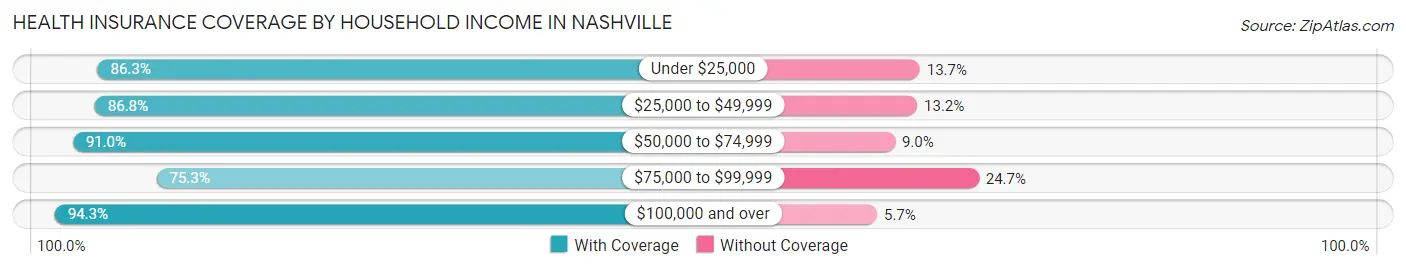
| Household Income | With Coverage | Without Coverage |
| Under $25,000 | 183 (86.3%) | 29 (13.7%) |
| $25,000 to $49,999 | 290 (86.8%) | 44 (13.2%) |
| $50,000 to $74,999 | 141 (91.0%) | 14 (9.0%) |
| $75,000 to $99,999 | 70 (75.3%) | 23 (24.7%) |
| $100,000 and over | 566 (94.3%) | 34 (5.7%) |
Public vs Private Health Insurance Coverage by Age in Nashville
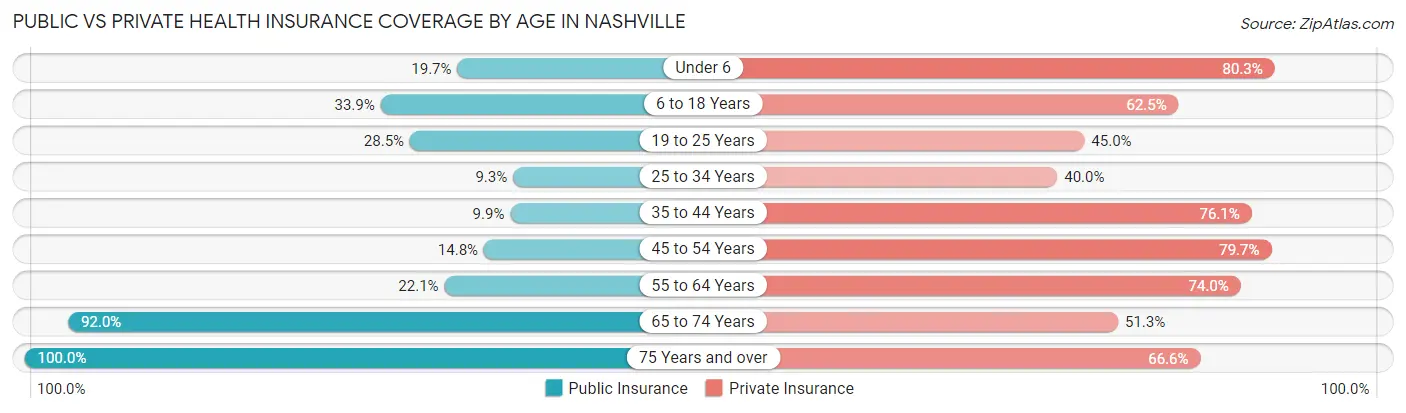
| Age Bracket | Public Insurance | Private Insurance |
| Under 6 | 12 (19.7%) | 49 (80.3%) |
| 6 to 18 Years | 19 (33.9%) | 35 (62.5%) |
| 19 to 25 Years | 43 (28.5%) | 68 (45.0%) |
| 25 to 34 Years | 7 (9.3%) | 30 (40.0%) |
| 35 to 44 Years | 7 (9.9%) | 54 (76.1%) |
| 45 to 54 Years | 32 (14.7%) | 173 (79.7%) |
| 55 to 64 Years | 51 (22.1%) | 171 (74.0%) |
| 65 to 74 Years | 217 (91.9%) | 121 (51.3%) |
| 75 Years and over | 296 (100.0%) | 197 (66.5%) |
| Total | 684 (49.1%) | 898 (64.4%) |
Disability Status by Sex by Age in Nashville
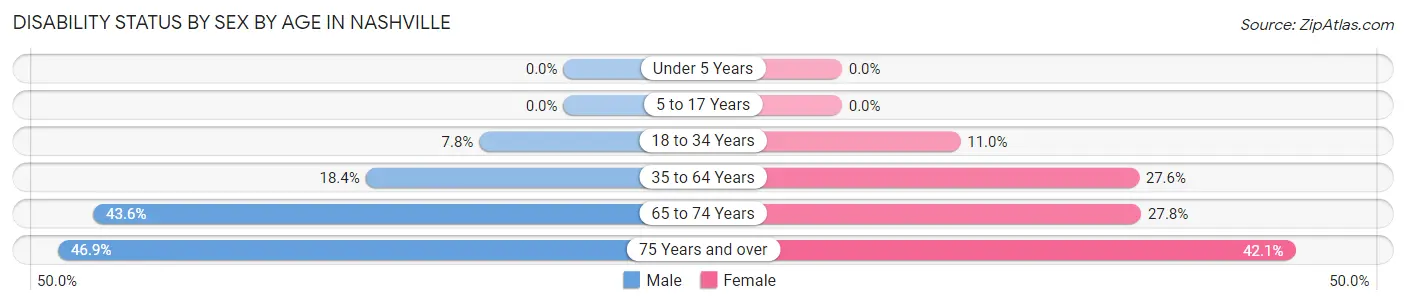
| Age Bracket | Male | Female |
| Under 5 Years | 0 (0.0%) | 0 (0.0%) |
| 5 to 17 Years | 0 (0.0%) | 0 (0.0%) |
| 18 to 34 Years | 10 (7.8%) | 11 (11.0%) |
| 35 to 64 Years | 38 (18.4%) | 86 (27.6%) |
| 65 to 74 Years | 48 (43.6%) | 35 (27.8%) |
| 75 Years and over | 53 (46.9%) | 77 (42.1%) |
Disability Class by Sex by Age in Nashville
Disability Class: Hearing Difficulty
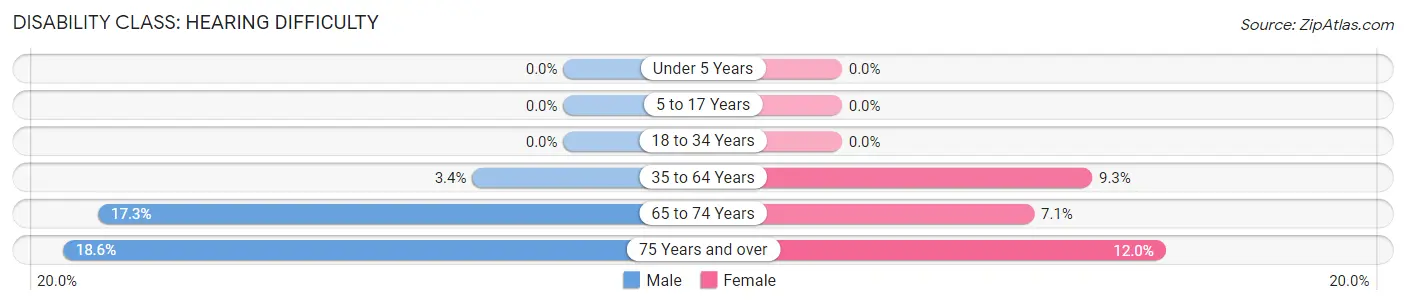
| Age Bracket | Male | Female |
| Under 5 Years | 0 (0.0%) | 0 (0.0%) |
| 5 to 17 Years | 0 (0.0%) | 0 (0.0%) |
| 18 to 34 Years | 0 (0.0%) | 0 (0.0%) |
| 35 to 64 Years | 7 (3.4%) | 29 (9.3%) |
| 65 to 74 Years | 19 (17.3%) | 9 (7.1%) |
| 75 Years and over | 21 (18.6%) | 22 (12.0%) |
Disability Class: Vision Difficulty
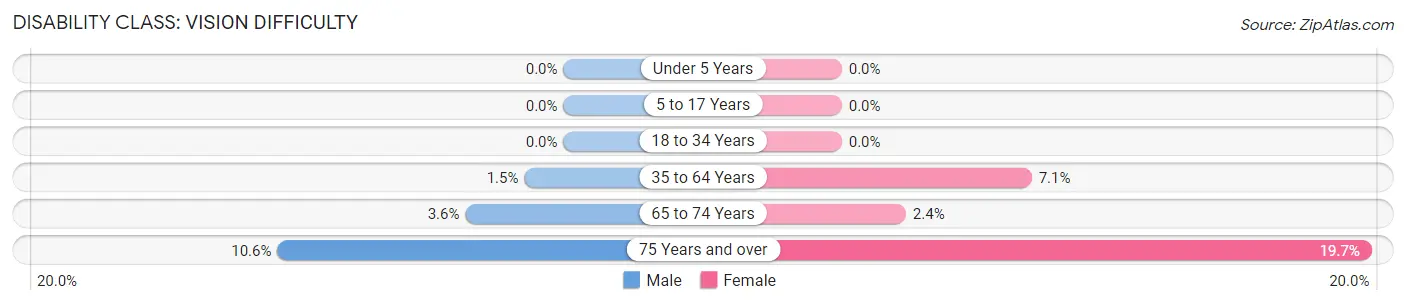
| Age Bracket | Male | Female |
| Under 5 Years | 0 (0.0%) | 0 (0.0%) |
| 5 to 17 Years | 0 (0.0%) | 0 (0.0%) |
| 18 to 34 Years | 0 (0.0%) | 0 (0.0%) |
| 35 to 64 Years | 3 (1.5%) | 22 (7.0%) |
| 65 to 74 Years | 4 (3.6%) | 3 (2.4%) |
| 75 Years and over | 12 (10.6%) | 36 (19.7%) |
Disability Class: Cognitive Difficulty
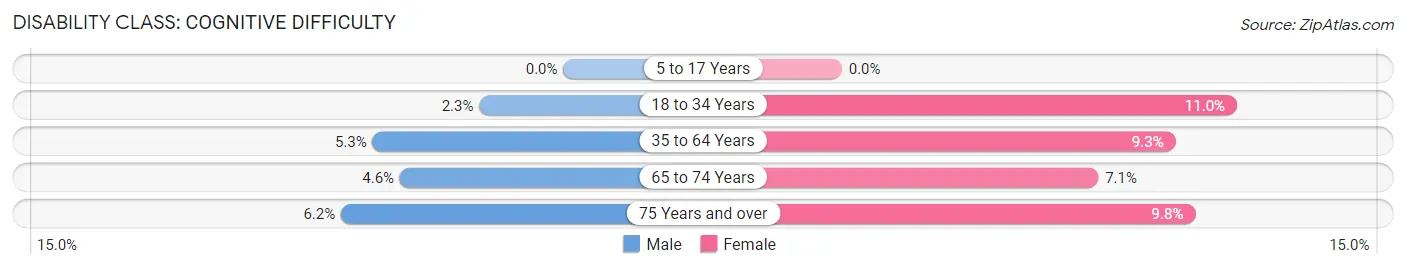
| Age Bracket | Male | Female |
| 5 to 17 Years | 0 (0.0%) | 0 (0.0%) |
| 18 to 34 Years | 3 (2.3%) | 11 (11.0%) |
| 35 to 64 Years | 11 (5.3%) | 29 (9.3%) |
| 65 to 74 Years | 5 (4.5%) | 9 (7.1%) |
| 75 Years and over | 7 (6.2%) | 18 (9.8%) |
Disability Class: Ambulatory Difficulty
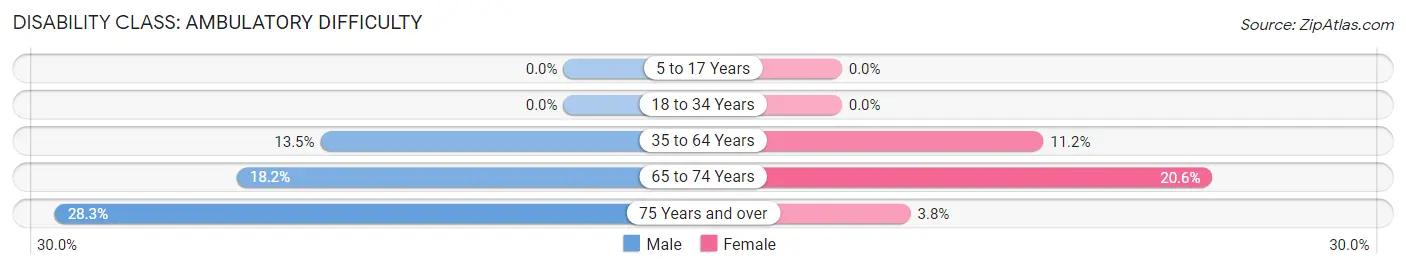
| Age Bracket | Male | Female |
| 5 to 17 Years | 0 (0.0%) | 0 (0.0%) |
| 18 to 34 Years | 0 (0.0%) | 0 (0.0%) |
| 35 to 64 Years | 28 (13.5%) | 35 (11.2%) |
| 65 to 74 Years | 20 (18.2%) | 26 (20.6%) |
| 75 Years and over | 32 (28.3%) | 7 (3.8%) |
Disability Class: Self-Care Difficulty
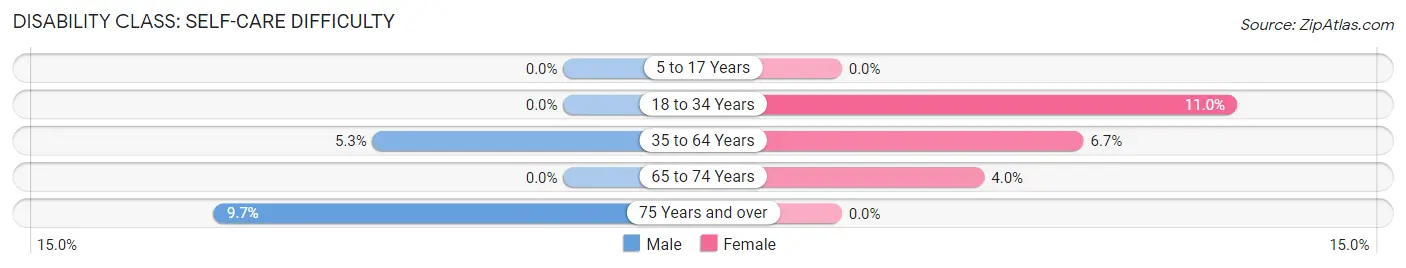
| Age Bracket | Male | Female |
| 5 to 17 Years | 0 (0.0%) | 0 (0.0%) |
| 18 to 34 Years | 0 (0.0%) | 11 (11.0%) |
| 35 to 64 Years | 11 (5.3%) | 21 (6.7%) |
| 65 to 74 Years | 0 (0.0%) | 5 (4.0%) |
| 75 Years and over | 11 (9.7%) | 0 (0.0%) |
Technology Access in Nashville
Computing Device Access in Nashville
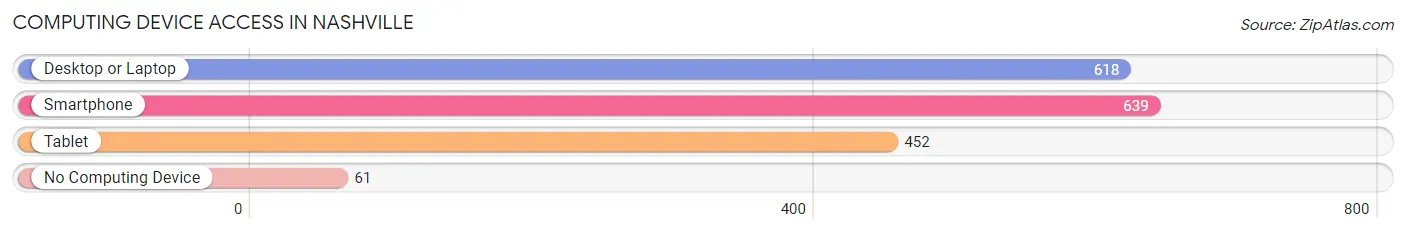
| Device Type | # Households | % Households |
| Desktop or Laptop | 618 | 79.1% |
| Smartphone | 639 | 81.8% |
| Tablet | 452 | 57.9% |
| No Computing Device | 61 | 7.8% |
| Total | 781 | 100.0% |
Internet Access in Nashville
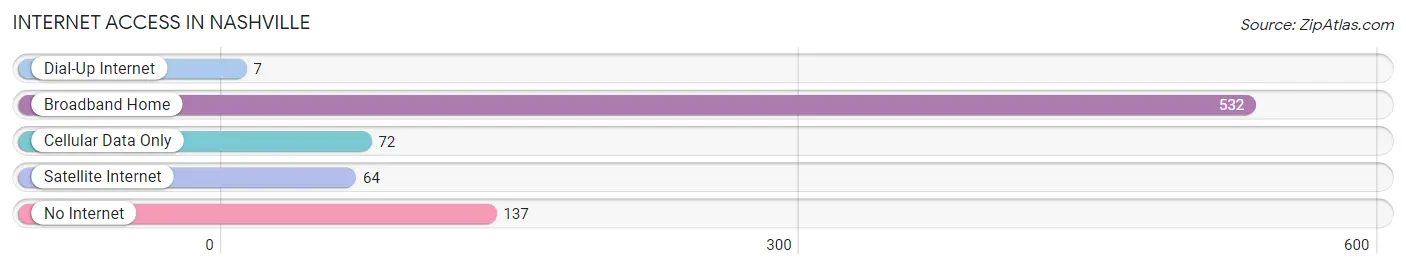
| Internet Type | # Households | % Households |
| Dial-Up Internet | 7 | 0.9% |
| Broadband Home | 532 | 68.1% |
| Cellular Data Only | 72 | 9.2% |
| Satellite Internet | 64 | 8.2% |
| No Internet | 137 | 17.5% |
| Total | 781 | 100.0% |
Nashville Summary
Nashville, Indiana is a small town located in Brown County, Indiana. It is situated in the rolling hills of southern Indiana, about 45 miles south of Indianapolis. The town is known for its picturesque beauty, its quaint downtown, and its many outdoor activities.
History
Nashville was founded in 1837 by a group of settlers from North Carolina. The town was named after General Francis Nash, a Revolutionary War hero from North Carolina. The town was originally a farming community, but it soon became a popular tourist destination due to its scenic beauty. In the late 19th century, the town became a popular destination for artists, writers, and musicians.
Geography
Nashville is located in the rolling hills of southern Indiana, about 45 miles south of Indianapolis. The town is situated in the foothills of the Hoosier National Forest, and is surrounded by lush forests and rolling hills. The town is located on the banks of the East Fork of the White River, and is home to several small lakes and ponds.
Economy
Nashville’s economy is largely based on tourism. The town is home to several popular tourist attractions, including the Brown County State Park, the Brown County Playhouse, and the Brown County Art Gallery. The town is also home to several wineries, breweries, and distilleries. In addition, the town is home to several small businesses, including restaurants, shops, and galleries.
Demographics
As of the 2010 census, the population of Nashville was 1,053. The racial makeup of the town was 97.3% White, 0.7% African American, 0.2% Native American, 0.2% Asian, 0.2% from other races, and 1.4% from two or more races. The median household income was $37,917, and the median family income was $45,938.
Conclusion
Nashville, Indiana is a small town located in Brown County, Indiana. It is known for its picturesque beauty, its quaint downtown, and its many outdoor activities. The town’s economy is largely based on tourism, and it is home to several popular tourist attractions. The population of Nashville is 1,053, and the median household income is $37,917. Nashville is a great place to visit, and it is a great place to call home.
Common Questions
What is Per Capita Income in Nashville?
Per Capita income in Nashville is $39,428.
What is the Median Family Income in Nashville?
Median Family Income in Nashville is $86,875.
What is the Median Household income in Nashville?
Median Household Income in Nashville is $51,042.
What is Income or Wage Gap in Nashville?
Income or Wage Gap in Nashville is 37.7%.
Women in Nashville earn 62.3 cents for every dollar earned by a man.
What is Inequality or Gini Index in Nashville?
Inequality or Gini Index in Nashville is 0.48.
What is the Total Population of Nashville?
Total Population of Nashville is 1,528.
What is the Total Male Population of Nashville?
Total Male Population of Nashville is 632.
What is the Total Female Population of Nashville?
Total Female Population of Nashville is 896.
What is the Ratio of Males per 100 Females in Nashville?
There are 70.54 Males per 100 Females in Nashville.
What is the Ratio of Females per 100 Males in Nashville?
There are 141.77 Females per 100 Males in Nashville.
What is the Median Population Age in Nashville?
Median Population Age in Nashville is 63.3 Years.
What is the Average Family Size in Nashville
Average Family Size in Nashville is 2.3 People.
What is the Average Household Size in Nashville
Average Household Size in Nashville is 1.8 People.
How Large is the Labor Force in Nashville?
There are 687 People in the Labor Forcein in Nashville.
What is the Percentage of People in the Labor Force in Nashville?
48.0% of People are in the Labor Force in Nashville.
What is the Unemployment Rate in Nashville?
Unemployment Rate in Nashville is 4.4%.