Burlington, IN Map & Demographics
Burlington Map
Burlington Overview
$33,343
PER CAPITA INCOME
$97,639
AVG FAMILY INCOME
$66,111
AVG HOUSEHOLD INCOME
14.1%
WAGE / INCOME GAP [ % ]
85.9¢/ $1
WAGE / INCOME GAP [ $ ]
0.33
INEQUALITY / GINI INDEX
633
TOTAL POPULATION
329
MALE POPULATION
304
FEMALE POPULATION
108.22
MALES / 100 FEMALES
92.40
FEMALES / 100 MALES
43.3
MEDIAN AGE
2.9
AVG FAMILY SIZE
2.3
AVG HOUSEHOLD SIZE
326
LABOR FORCE [ PEOPLE ]
64.8%
PERCENT IN LABOR FORCE
3.7%
UNEMPLOYMENT RATE
Burlington Zip Codes
Income in Burlington
Income Overview in Burlington
Per Capita Income in Burlington is $33,343, while median incomes of families and households are $97,639 and $66,111 respectively.
| Characteristic | Number | Measure |
| Per Capita Income | 633 | $33,343 |
| Median Family Income | 172 | $97,639 |
| Mean Family Income | 172 | $91,254 |
| Median Household Income | 280 | $66,111 |
| Mean Household Income | 280 | $74,462 |
| Income Deficit | 172 | $0 |
| Wage / Income Gap (%) | 633 | 14.14% |
| Wage / Income Gap ($) | 633 | 85.86¢ per $1 |
| Gini / Inequality Index | 633 | 0.33 |
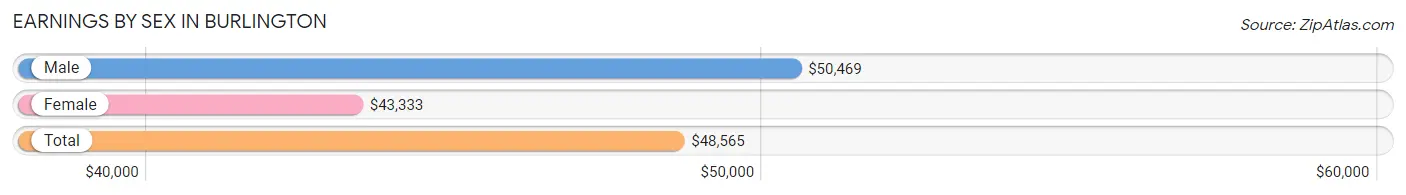
Earnings by Sex in Burlington
Average Earnings in Burlington are $48,565, $50,469 for men and $43,333 for women, a difference of 14.1%.
| Sex | Number | Average Earnings |
| Male | 195 (57.2%) | $50,469 |
| Female | 146 (42.8%) | $43,333 |
| Total | 341 (100.0%) | $48,565 |
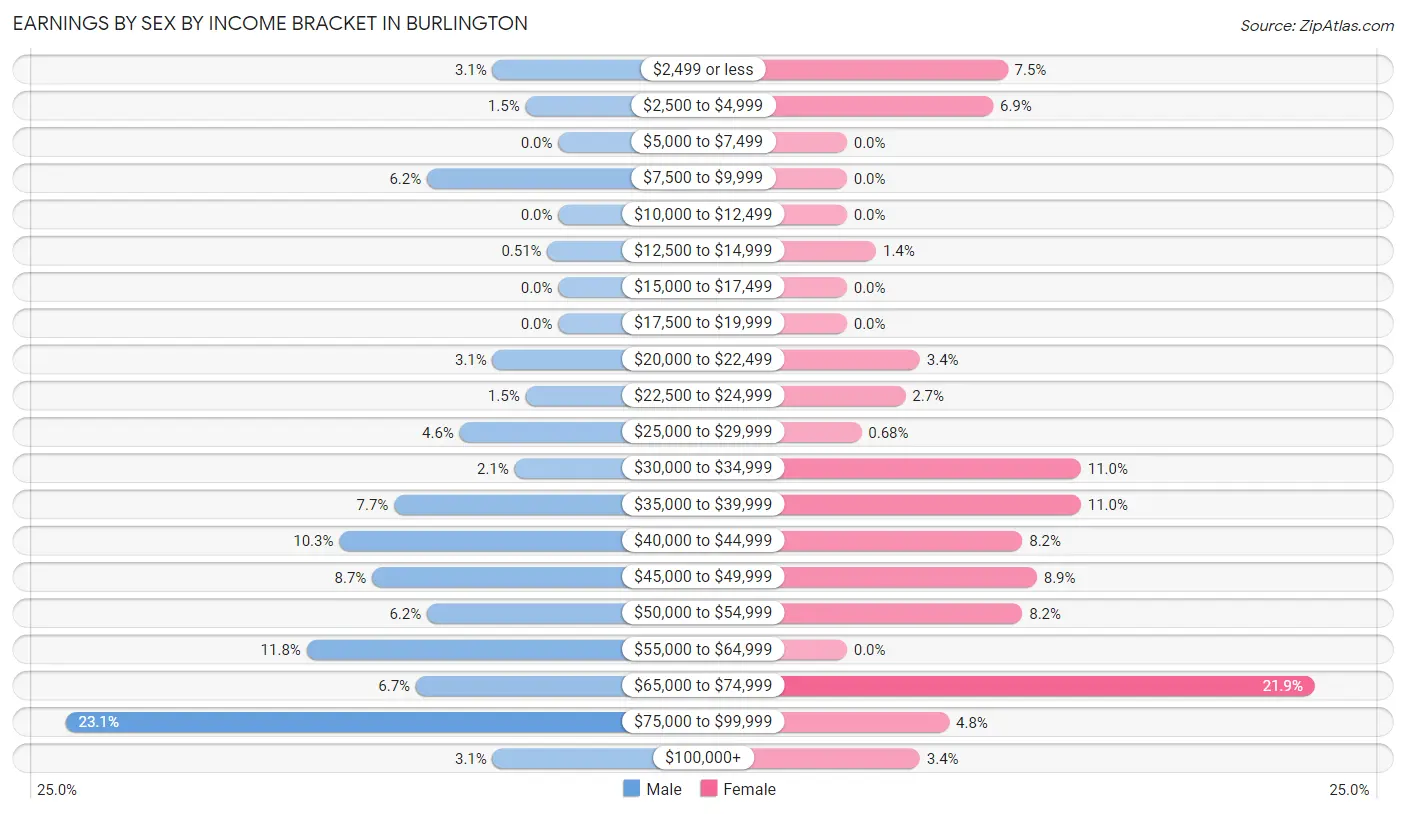
Earnings by Sex by Income Bracket in Burlington
The most common earnings brackets in Burlington are $75,000 to $99,999 for men (45 | 23.1%) and $65,000 to $74,999 for women (32 | 21.9%).
| Income | Male | Female |
| $2,499 or less | 6 (3.1%) | 11 (7.5%) |
| $2,500 to $4,999 | 3 (1.5%) | 10 (6.9%) |
| $5,000 to $7,499 | 0 (0.0%) | 0 (0.0%) |
| $7,500 to $9,999 | 12 (6.1%) | 0 (0.0%) |
| $10,000 to $12,499 | 0 (0.0%) | 0 (0.0%) |
| $12,500 to $14,999 | 1 (0.5%) | 2 (1.4%) |
| $15,000 to $17,499 | 0 (0.0%) | 0 (0.0%) |
| $17,500 to $19,999 | 0 (0.0%) | 0 (0.0%) |
| $20,000 to $22,499 | 6 (3.1%) | 5 (3.4%) |
| $22,500 to $24,999 | 3 (1.5%) | 4 (2.7%) |
| $25,000 to $29,999 | 9 (4.6%) | 1 (0.7%) |
| $30,000 to $34,999 | 4 (2.1%) | 16 (11.0%) |
| $35,000 to $39,999 | 15 (7.7%) | 16 (11.0%) |
| $40,000 to $44,999 | 20 (10.3%) | 12 (8.2%) |
| $45,000 to $49,999 | 17 (8.7%) | 13 (8.9%) |
| $50,000 to $54,999 | 12 (6.1%) | 12 (8.2%) |
| $55,000 to $64,999 | 23 (11.8%) | 0 (0.0%) |
| $65,000 to $74,999 | 13 (6.7%) | 32 (21.9%) |
| $75,000 to $99,999 | 45 (23.1%) | 7 (4.8%) |
| $100,000+ | 6 (3.1%) | 5 (3.4%) |
| Total | 195 (100.0%) | 146 (100.0%) |
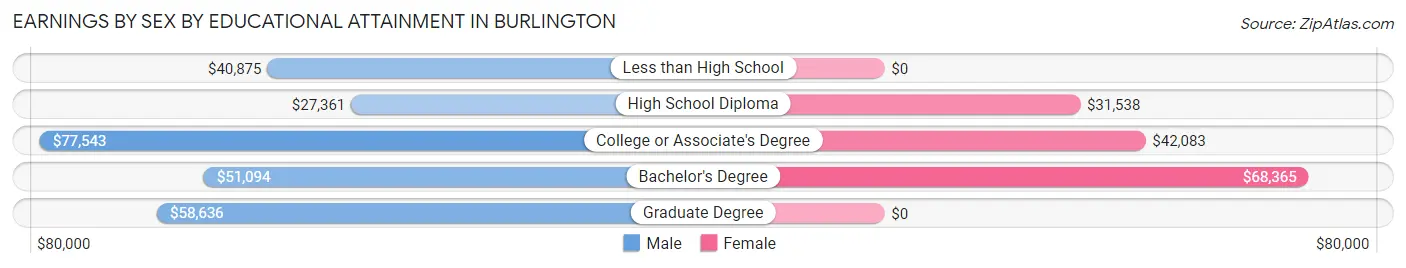
Earnings by Sex by Educational Attainment in Burlington
Average earnings in Burlington are $54,375 for men and $48,125 for women, a difference of 11.5%. Men with an educational attainment of college or associate's degree enjoy the highest average annual earnings of $77,543, while those with high school diploma education earn the least with $27,361. Women with an educational attainment of bachelor's degree earn the most with the average annual earnings of $68,365, while those with high school diploma education have the smallest earnings of $31,538.
| Educational Attainment | Male Income | Female Income |
| Less than High School | $40,875 | $0 |
| High School Diploma | $27,361 | $31,538 |
| College or Associate's Degree | $77,543 | $42,083 |
| Bachelor's Degree | $51,094 | $68,365 |
| Graduate Degree | $58,636 | $0 |
| Total | $54,375 | $48,125 |
Family Income in Burlington
Family Income Brackets in Burlington
According to the Burlington family income data, there are 59 families falling into the $100,000 to $149,999 income range, which is the most common income bracket and makes up 34.3% of all families.
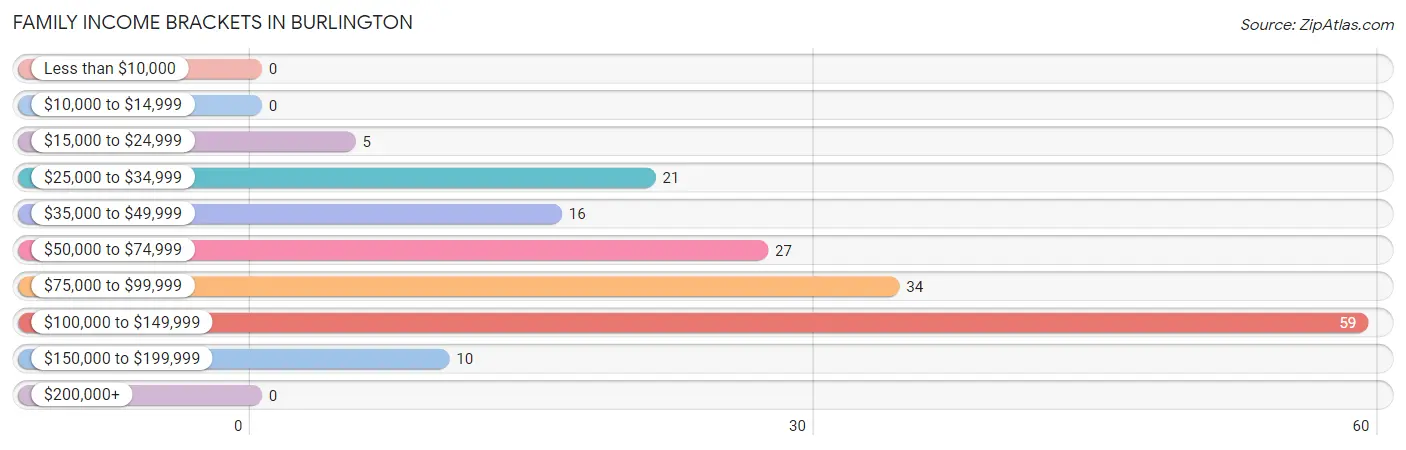
| Income Bracket | # Families | % Families |
| Less than $10,000 | 0 | 0.0% |
| $10,000 to $14,999 | 0 | 0.0% |
| $15,000 to $24,999 | 5 | 2.9% |
| $25,000 to $34,999 | 21 | 12.2% |
| $35,000 to $49,999 | 16 | 9.3% |
| $50,000 to $74,999 | 27 | 15.7% |
| $75,000 to $99,999 | 34 | 19.8% |
| $100,000 to $149,999 | 59 | 34.3% |
| $150,000 to $199,999 | 10 | 5.8% |
| $200,000+ | 0 | 0.0% |
Family Income by Famaliy Size in Burlington
4-person families (52 | 30.2%) account for the highest median family income in Burlington with $148,214 per family, while 4-person families (52 | 30.2%) have the highest median income of $37,054 per family member.
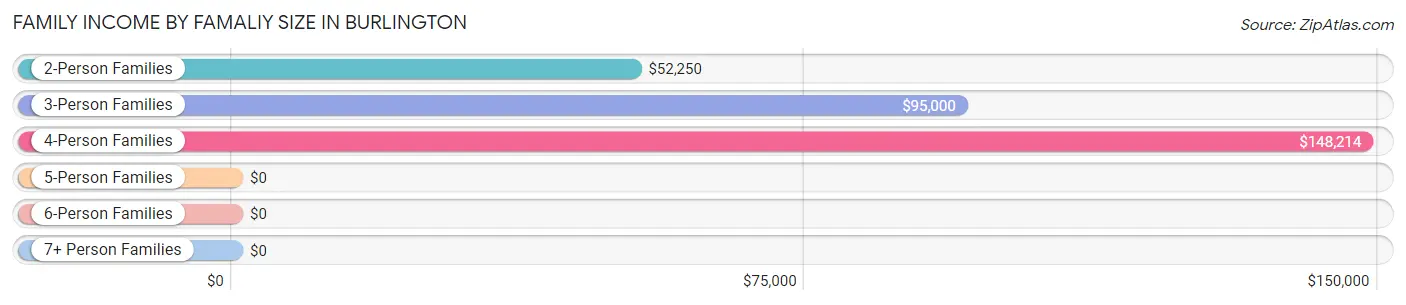
| Income Bracket | # Families | Median Income |
| 2-Person Families | 81 (47.1%) | $52,250 |
| 3-Person Families | 34 (19.8%) | $95,000 |
| 4-Person Families | 52 (30.2%) | $148,214 |
| 5-Person Families | 3 (1.7%) | $0 |
| 6-Person Families | 2 (1.2%) | $0 |
| 7+ Person Families | 0 (0.0%) | $0 |
| Total | 172 (100.0%) | $97,639 |
Family Income by Number of Earners in Burlington
The median family income in Burlington is $97,639, with families comprising 2 earners (75) having the highest median family income of $111,635, while families with no earners (39) have the lowest median family income of $49,375, accounting for 43.6% and 22.7% of families, respectively.
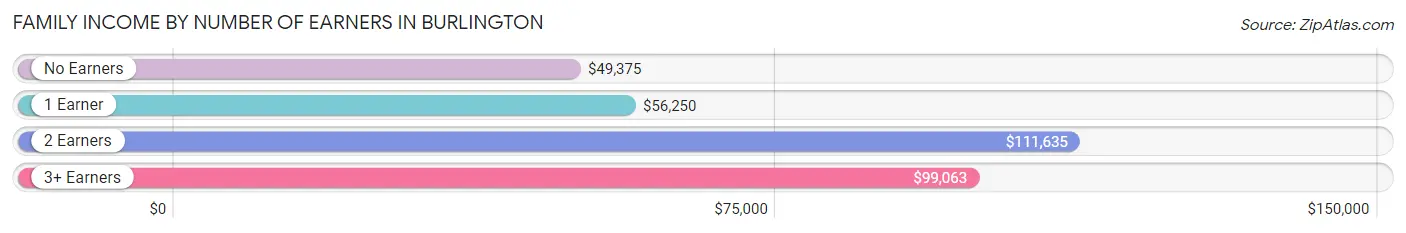
| Number of Earners | # Families | Median Income |
| No Earners | 39 (22.7%) | $49,375 |
| 1 Earner | 40 (23.3%) | $56,250 |
| 2 Earners | 75 (43.6%) | $111,635 |
| 3+ Earners | 18 (10.5%) | $99,063 |
| Total | 172 (100.0%) | $97,639 |
Household Income in Burlington
Household Income Brackets in Burlington
With 61 households falling in the category, the $100,000 to $149,999 income range is the most frequent in Burlington, accounting for 21.8% of all households.
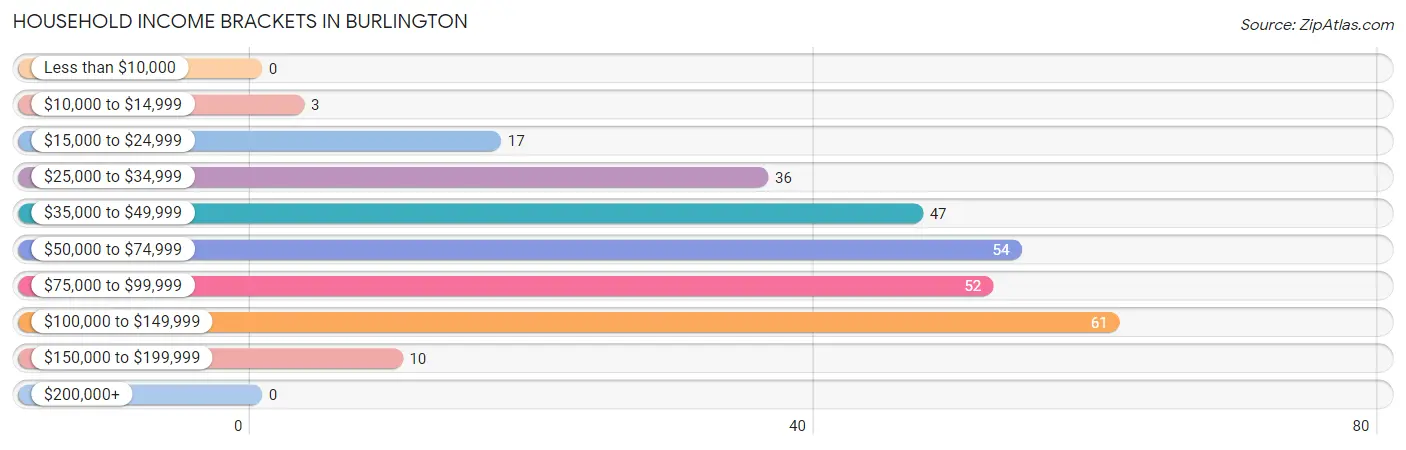
| Income Bracket | # Households | % Households |
| Less than $10,000 | 0 | 0.0% |
| $10,000 to $14,999 | 3 | 1.1% |
| $15,000 to $24,999 | 17 | 6.1% |
| $25,000 to $34,999 | 36 | 12.9% |
| $35,000 to $49,999 | 47 | 16.8% |
| $50,000 to $74,999 | 54 | 19.3% |
| $75,000 to $99,999 | 52 | 18.6% |
| $100,000 to $149,999 | 61 | 21.8% |
| $150,000 to $199,999 | 10 | 3.6% |
| $200,000+ | 0 | 0.0% |
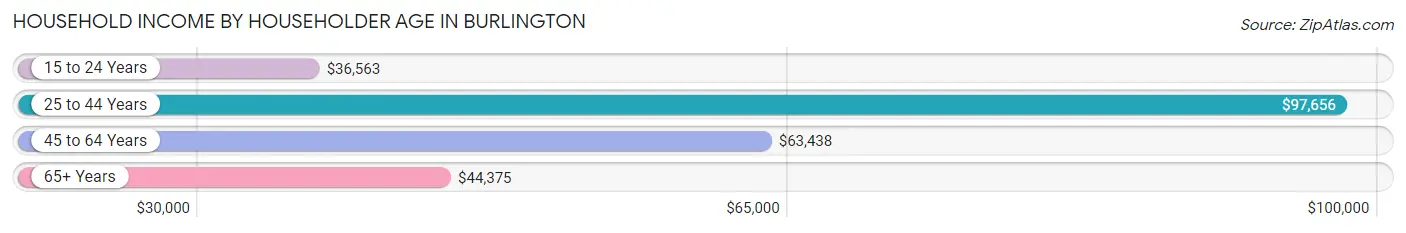
Household Income by Householder Age in Burlington
The median household income in Burlington is $66,111, with the highest median household income of $97,656 found in the 25 to 44 years age bracket for the primary householder. A total of 93 households (33.2%) fall into this category. Meanwhile, the 15 to 24 years age bracket for the primary householder has the lowest median household income of $36,563, with 13 households (4.6%) in this group.
| Income Bracket | # Households | Median Income |
| 15 to 24 Years | 13 (4.6%) | $36,563 |
| 25 to 44 Years | 93 (33.2%) | $97,656 |
| 45 to 64 Years | 107 (38.2%) | $63,438 |
| 65+ Years | 67 (23.9%) | $44,375 |
| Total | 280 (100.0%) | $66,111 |
Poverty in Burlington
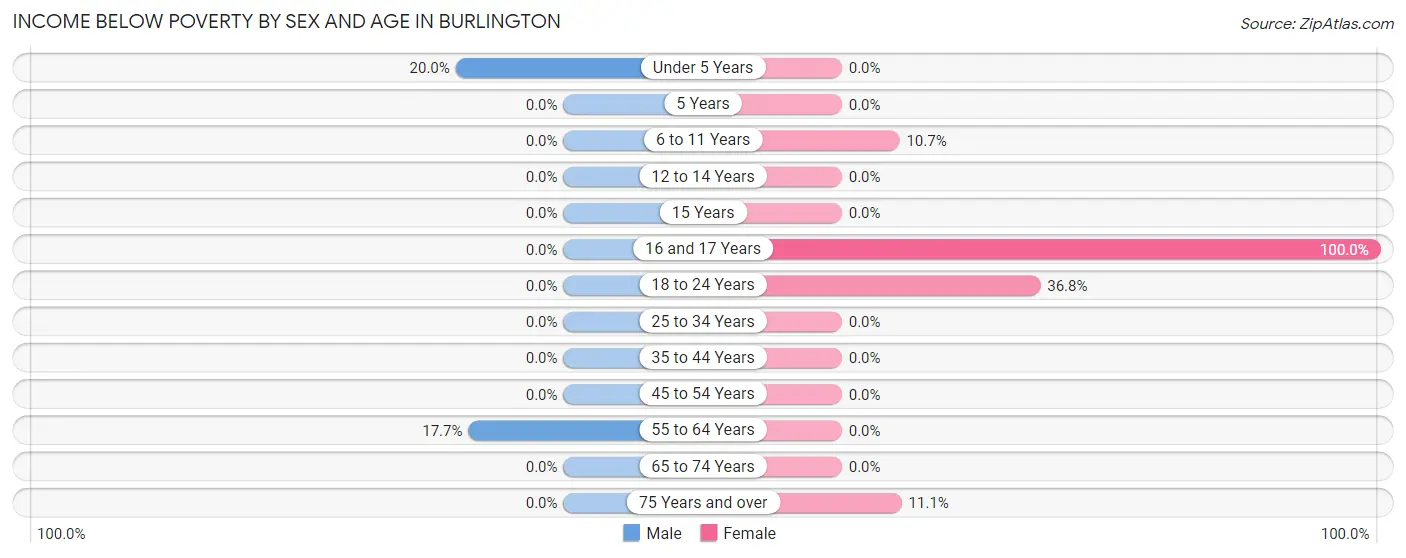
Income Below Poverty by Sex and Age in Burlington
With 1.5% poverty level for males and 6.2% for females among the residents of Burlington, under 5 year old males and 16 and 17 year old females are the most vulnerable to poverty, with 2 males (20.0%) and 3 females (100.0%) in their respective age groups living below the poverty level.
| Age Bracket | Male | Female |
| Under 5 Years | 2 (20.0%) | 0 (0.0%) |
| 5 Years | 0 (0.0%) | 0 (0.0%) |
| 6 to 11 Years | 0 (0.0%) | 6 (10.7%) |
| 12 to 14 Years | 0 (0.0%) | 0 (0.0%) |
| 15 Years | 0 (0.0%) | 0 (0.0%) |
| 16 and 17 Years | 0 (0.0%) | 3 (100.0%) |
| 18 to 24 Years | 0 (0.0%) | 7 (36.8%) |
| 25 to 34 Years | 0 (0.0%) | 0 (0.0%) |
| 35 to 44 Years | 0 (0.0%) | 0 (0.0%) |
| 45 to 54 Years | 0 (0.0%) | 0 (0.0%) |
| 55 to 64 Years | 3 (17.6%) | 0 (0.0%) |
| 65 to 74 Years | 0 (0.0%) | 0 (0.0%) |
| 75 Years and over | 0 (0.0%) | 3 (11.1%) |
| Total | 5 (1.5%) | 19 (6.2%) |
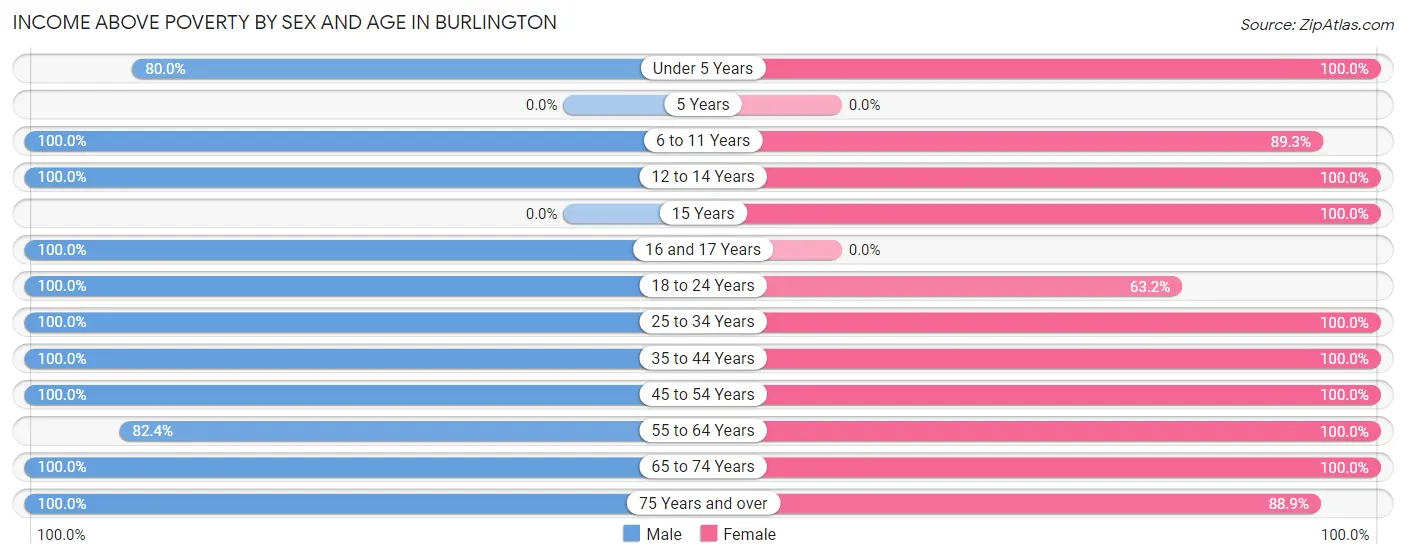
Income Above Poverty by Sex and Age in Burlington
According to the poverty statistics in Burlington, males aged 6 to 11 years and females aged under 5 years are the age groups that are most secure financially, with 100.0% of males and 100.0% of females in these age groups living above the poverty line.
| Age Bracket | Male | Female |
| Under 5 Years | 8 (80.0%) | 11 (100.0%) |
| 5 Years | 0 (0.0%) | 0 (0.0%) |
| 6 to 11 Years | 42 (100.0%) | 50 (89.3%) |
| 12 to 14 Years | 5 (100.0%) | 5 (100.0%) |
| 15 Years | 0 (0.0%) | 1 (100.0%) |
| 16 and 17 Years | 6 (100.0%) | 0 (0.0%) |
| 18 to 24 Years | 41 (100.0%) | 12 (63.2%) |
| 25 to 34 Years | 29 (100.0%) | 21 (100.0%) |
| 35 to 44 Years | 56 (100.0%) | 51 (100.0%) |
| 45 to 54 Years | 59 (100.0%) | 44 (100.0%) |
| 55 to 64 Years | 14 (82.4%) | 38 (100.0%) |
| 65 to 74 Years | 39 (100.0%) | 28 (100.0%) |
| 75 Years and over | 25 (100.0%) | 24 (88.9%) |
| Total | 324 (98.5%) | 285 (93.8%) |
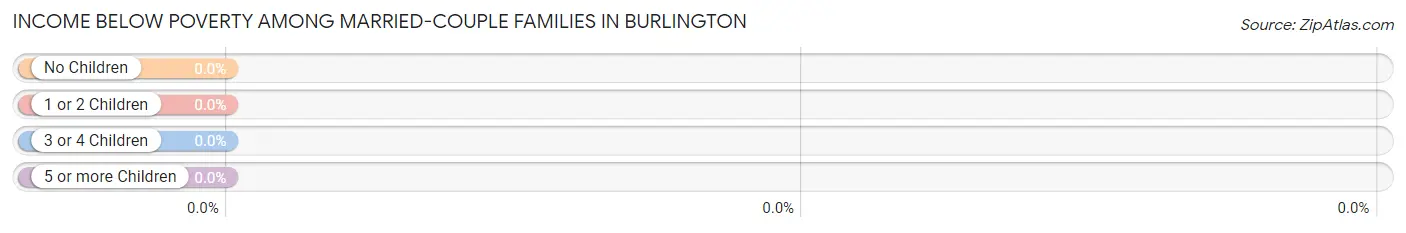
Income Below Poverty Among Married-Couple Families in Burlington
| Children | Above Poverty | Below Poverty |
| No Children | 94 (100.0%) | 0 (0.0%) |
| 1 or 2 Children | 44 (100.0%) | 0 (0.0%) |
| 3 or 4 Children | 5 (100.0%) | 0 (0.0%) |
| 5 or more Children | 0 (0.0%) | 0 (0.0%) |
| Total | 143 (100.0%) | 0 (0.0%) |
Income Below Poverty Among Single-Parent Households in Burlington
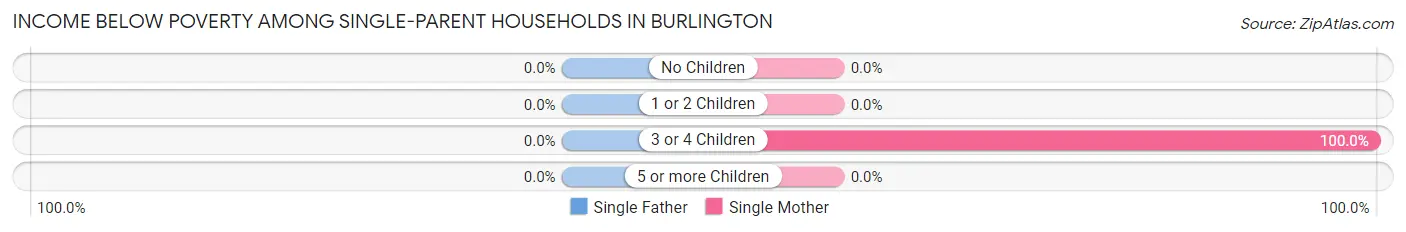
| Children | Single Father | Single Mother |
| No Children | 0 (0.0%) | 0 (0.0%) |
| 1 or 2 Children | 0 (0.0%) | 0 (0.0%) |
| 3 or 4 Children | 0 (0.0%) | 2 (100.0%) |
| 5 or more Children | 0 (0.0%) | 0 (0.0%) |
| Total | 0 (0.0%) | 2 (8.7%) |
Income Below Poverty Among Married-Couple vs Single-Parent Households in Burlington
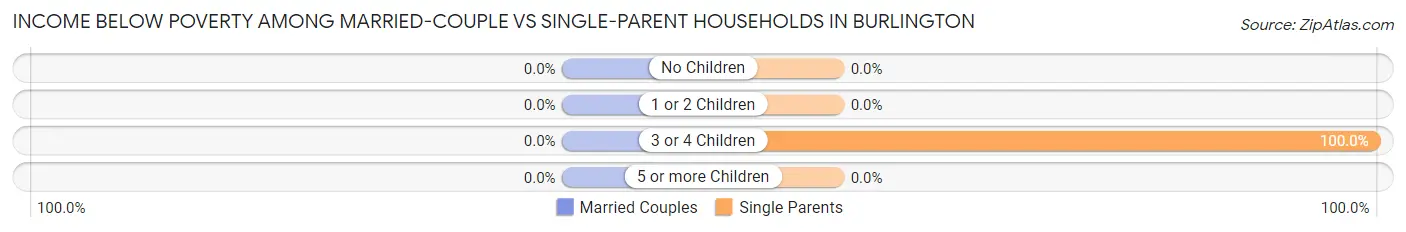
| Children | Married-Couple Families | Single-Parent Households |
| No Children | 0 (0.0%) | 0 (0.0%) |
| 1 or 2 Children | 0 (0.0%) | 0 (0.0%) |
| 3 or 4 Children | 0 (0.0%) | 2 (100.0%) |
| 5 or more Children | 0 (0.0%) | 0 (0.0%) |
| Total | 0 (0.0%) | 2 (6.9%) |
Race in Burlington
The most populous races in Burlington are White / Caucasian (609 | 96.2%), Two or more Races (24 | 3.8%), and Hispanic or Latino (3 | 0.5%).
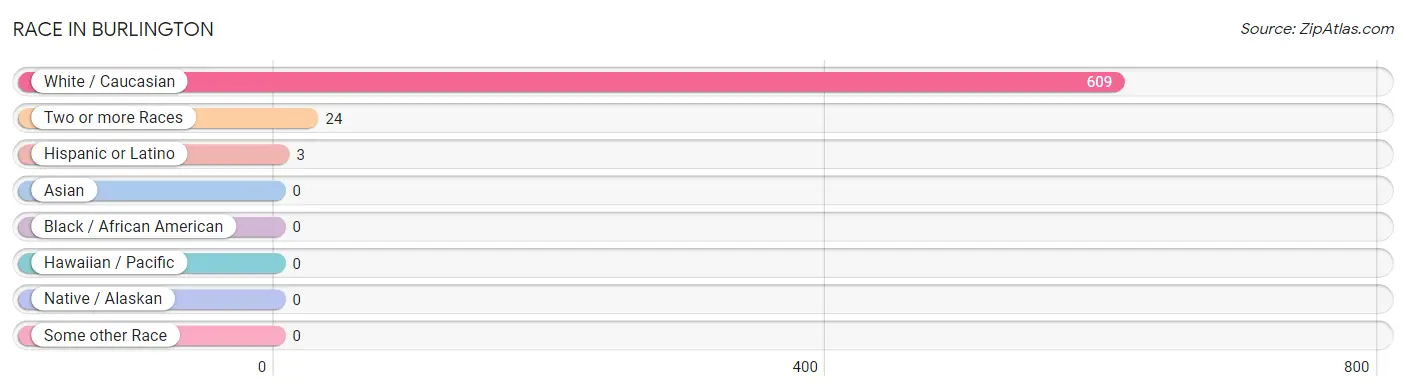
| Race | # Population | % Population |
| Asian | 0 | 0.0% |
| Black / African American | 0 | 0.0% |
| Hawaiian / Pacific | 0 | 0.0% |
| Hispanic or Latino | 3 | 0.5% |
| Native / Alaskan | 0 | 0.0% |
| White / Caucasian | 609 | 96.2% |
| Two or more Races | 24 | 3.8% |
| Some other Race | 0 | 0.0% |
| Total | 633 | 100.0% |
Ancestry in Burlington
The most populous ancestries reported in Burlington are German (135 | 21.3%), Irish (102 | 16.1%), English (97 | 15.3%), American (53 | 8.4%), and French (35 | 5.5%), together accounting for 66.7% of all Burlington residents.
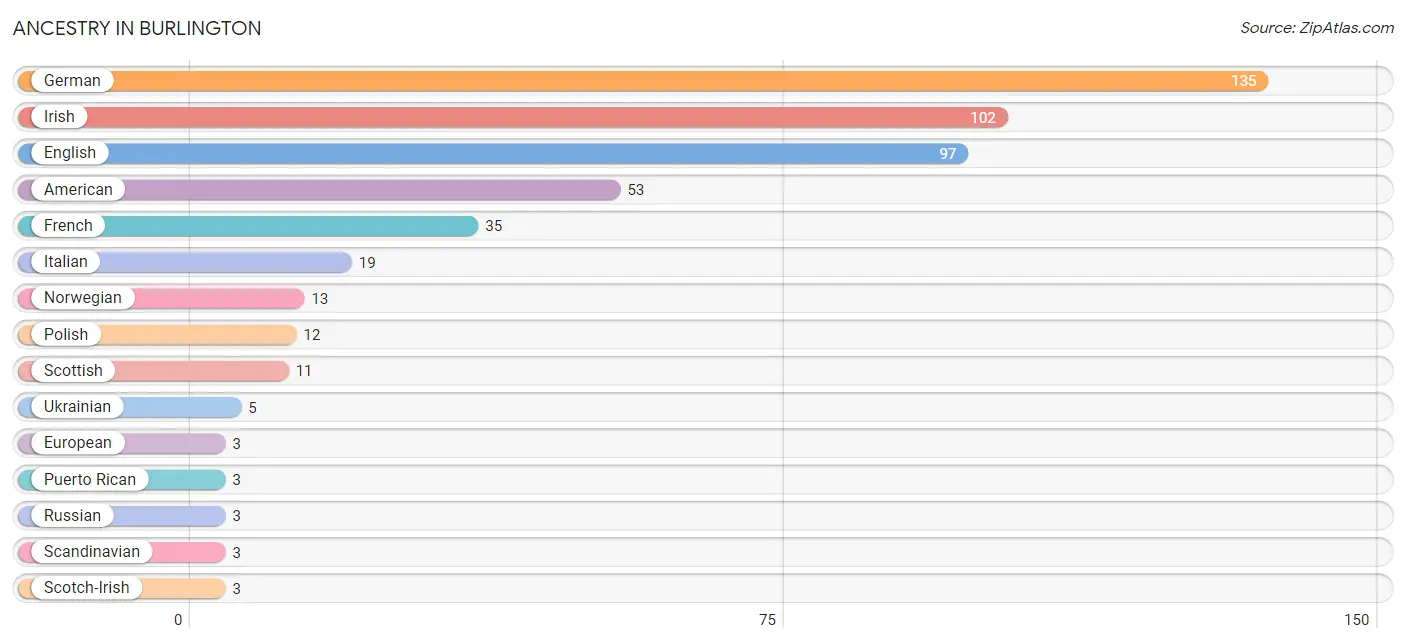
| Ancestry | # Population | % Population |
| American | 53 | 8.4% |
| British | 2 | 0.3% |
| Dutch | 2 | 0.3% |
| English | 97 | 15.3% |
| European | 3 | 0.5% |
| French | 35 | 5.5% |
| French Canadian | 1 | 0.2% |
| German | 135 | 21.3% |
| Irish | 102 | 16.1% |
| Italian | 19 | 3.0% |
| Norwegian | 13 | 2.1% |
| Polish | 12 | 1.9% |
| Puerto Rican | 3 | 0.5% |
| Russian | 3 | 0.5% |
| Scandinavian | 3 | 0.5% |
| Scotch-Irish | 3 | 0.5% |
| Scottish | 11 | 1.7% |
| Ukrainian | 5 | 0.8% | View All 18 Rows |
Immigrants in Burlington
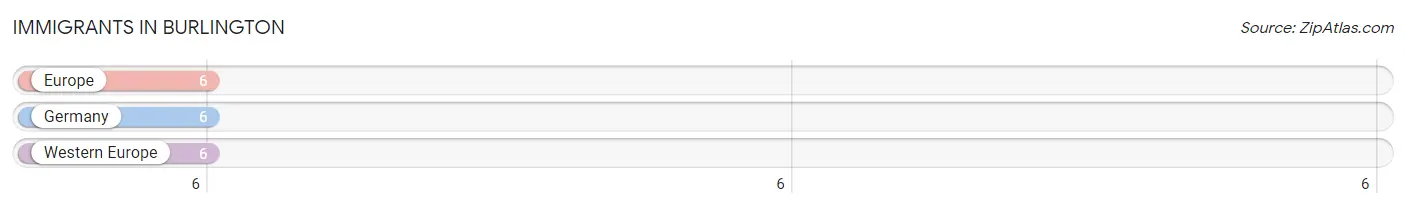
The most numerous immigrant groups reported in Burlington came from Europe (6 | 0.9%), Germany (6 | 0.9%), and Western Europe (6 | 0.9%), together accounting for 2.8% of all Burlington residents.
| Immigration Origin | # Population | % Population |
| Europe | 6 | 0.9% |
| Germany | 6 | 0.9% |
| Western Europe | 6 | 0.9% | View All 3 Rows |
Sex and Age in Burlington
Sex and Age in Burlington
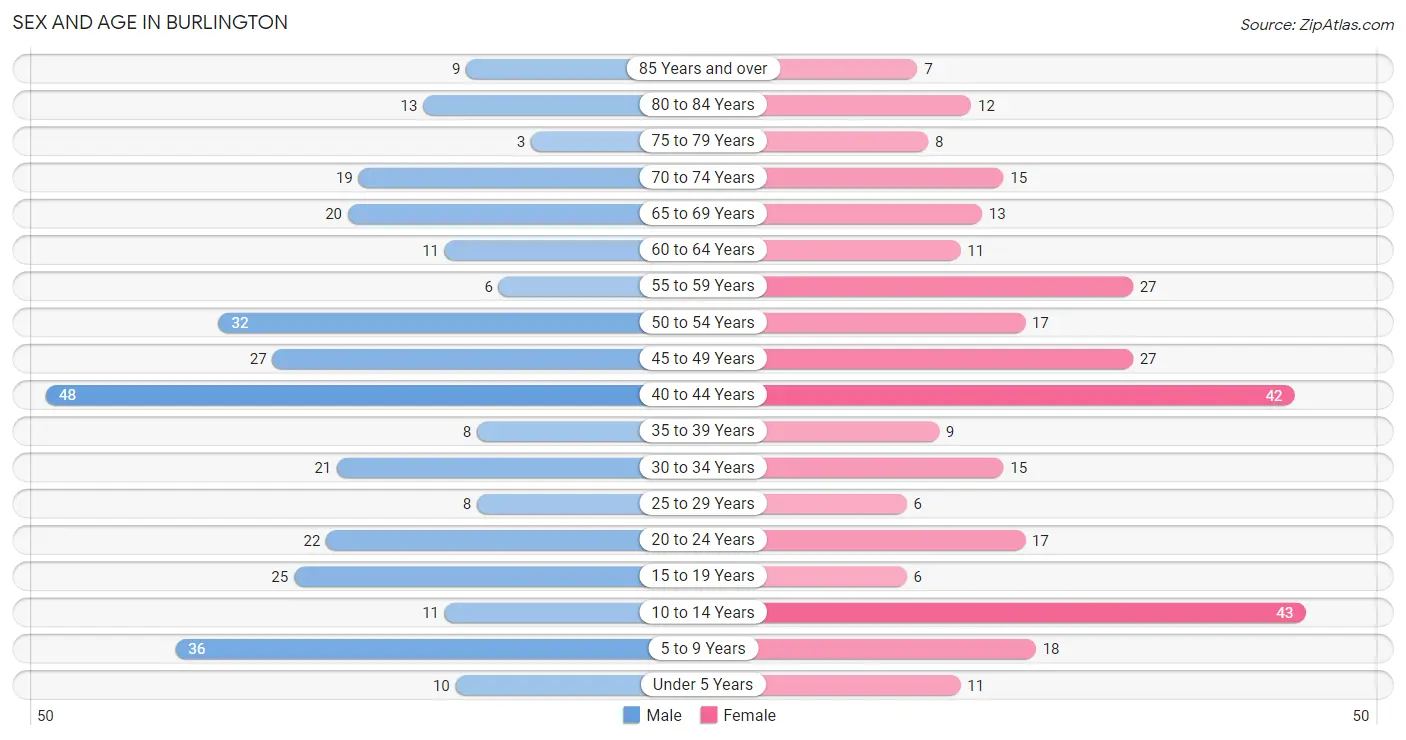
The most populous age groups in Burlington are 40 to 44 Years (48 | 14.6%) for men and 10 to 14 Years (43 | 14.1%) for women.
| Age Bracket | Male | Female |
| Under 5 Years | 10 (3.0%) | 11 (3.6%) |
| 5 to 9 Years | 36 (10.9%) | 18 (5.9%) |
| 10 to 14 Years | 11 (3.3%) | 43 (14.1%) |
| 15 to 19 Years | 25 (7.6%) | 6 (2.0%) |
| 20 to 24 Years | 22 (6.7%) | 17 (5.6%) |
| 25 to 29 Years | 8 (2.4%) | 6 (2.0%) |
| 30 to 34 Years | 21 (6.4%) | 15 (4.9%) |
| 35 to 39 Years | 8 (2.4%) | 9 (3.0%) |
| 40 to 44 Years | 48 (14.6%) | 42 (13.8%) |
| 45 to 49 Years | 27 (8.2%) | 27 (8.9%) |
| 50 to 54 Years | 32 (9.7%) | 17 (5.6%) |
| 55 to 59 Years | 6 (1.8%) | 27 (8.9%) |
| 60 to 64 Years | 11 (3.3%) | 11 (3.6%) |
| 65 to 69 Years | 20 (6.1%) | 13 (4.3%) |
| 70 to 74 Years | 19 (5.8%) | 15 (4.9%) |
| 75 to 79 Years | 3 (0.9%) | 8 (2.6%) |
| 80 to 84 Years | 13 (4.0%) | 12 (4.0%) |
| 85 Years and over | 9 (2.7%) | 7 (2.3%) |
| Total | 329 (100.0%) | 304 (100.0%) |
Families and Households in Burlington
Median Family Size in Burlington
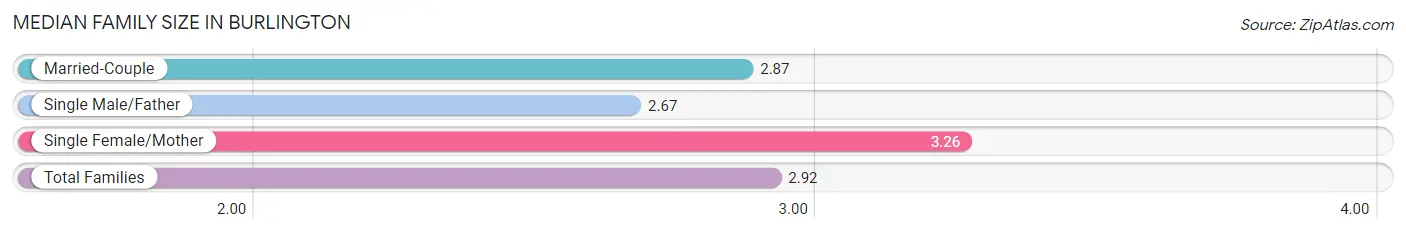
The median family size in Burlington is 2.92 persons per family, with single female/mother families (23 | 13.4%) accounting for the largest median family size of 3.26 persons per family. On the other hand, single male/father families (6 | 3.5%) represent the smallest median family size with 2.67 persons per family.
| Family Type | # Families | Family Size |
| Married-Couple | 143 (83.1%) | 2.87 |
| Single Male/Father | 6 (3.5%) | 2.67 |
| Single Female/Mother | 23 (13.4%) | 3.26 |
| Total Families | 172 (100.0%) | 2.92 |
Median Household Size in Burlington
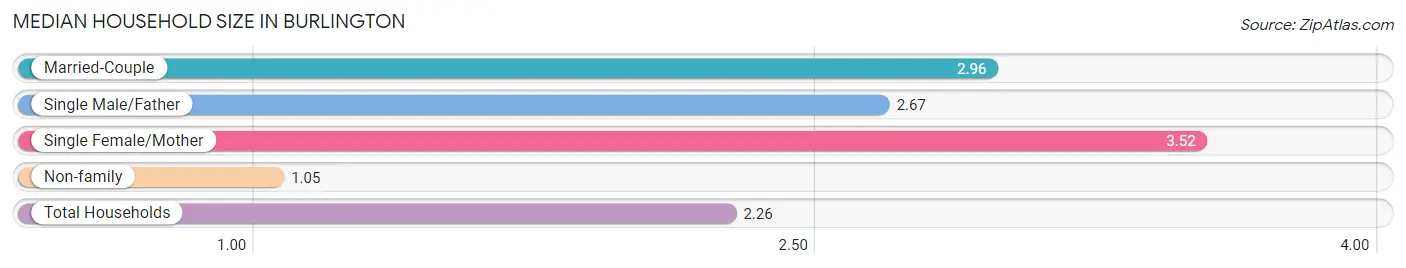
The median household size in Burlington is 2.26 persons per household, with single female/mother households (23 | 8.2%) accounting for the largest median household size of 3.52 persons per household. non-family households (108 | 38.6%) represent the smallest median household size with 1.05 persons per household.
| Household Type | # Households | Household Size |
| Married-Couple | 143 (51.1%) | 2.96 |
| Single Male/Father | 6 (2.1%) | 2.67 |
| Single Female/Mother | 23 (8.2%) | 3.52 |
| Non-family | 108 (38.6%) | 1.05 |
| Total Households | 280 (100.0%) | 2.26 |
Household Size by Marriage Status in Burlington
Out of a total of 280 households in Burlington, 172 (61.4%) are family households, while 108 (38.6%) are nonfamily households. The most numerous type of family households are 2-person households, comprising 76, and the most common type of nonfamily households are 1-person households, comprising 102.
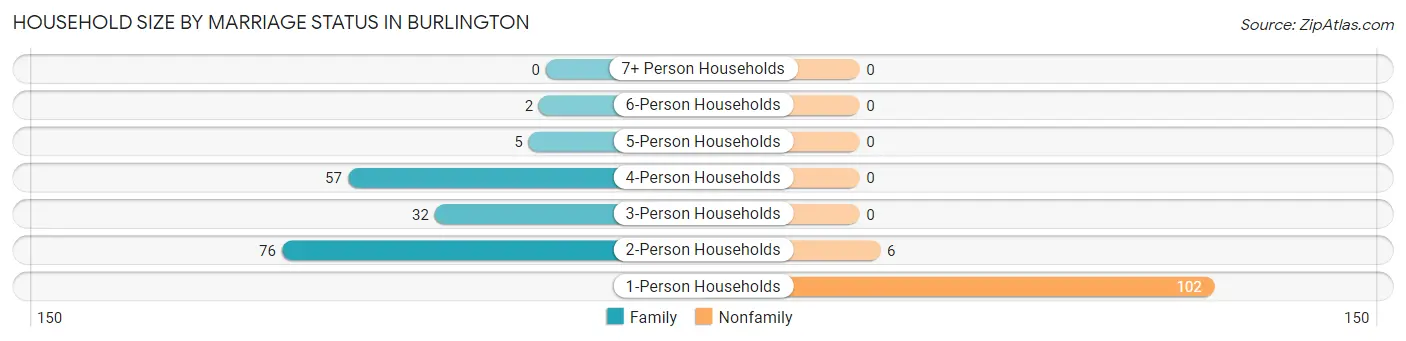
| Household Size | Family Households | Nonfamily Households |
| 1-Person Households | - | 102 (36.4%) |
| 2-Person Households | 76 (27.1%) | 6 (2.1%) |
| 3-Person Households | 32 (11.4%) | 0 (0.0%) |
| 4-Person Households | 57 (20.4%) | 0 (0.0%) |
| 5-Person Households | 5 (1.8%) | 0 (0.0%) |
| 6-Person Households | 2 (0.7%) | 0 (0.0%) |
| 7+ Person Households | 0 (0.0%) | 0 (0.0%) |
| Total | 172 (61.4%) | 108 (38.6%) |
Female Fertility in Burlington
Fertility by Age in Burlington
Average fertility rate in Burlington is 66.0 births per 1,000 women. Women in the age bracket of 20 to 34 years have the highest fertility rate with 211.0 births per 1,000 women. Women in the age bracket of 20 to 34 years acount for 100.0% of all women with births.
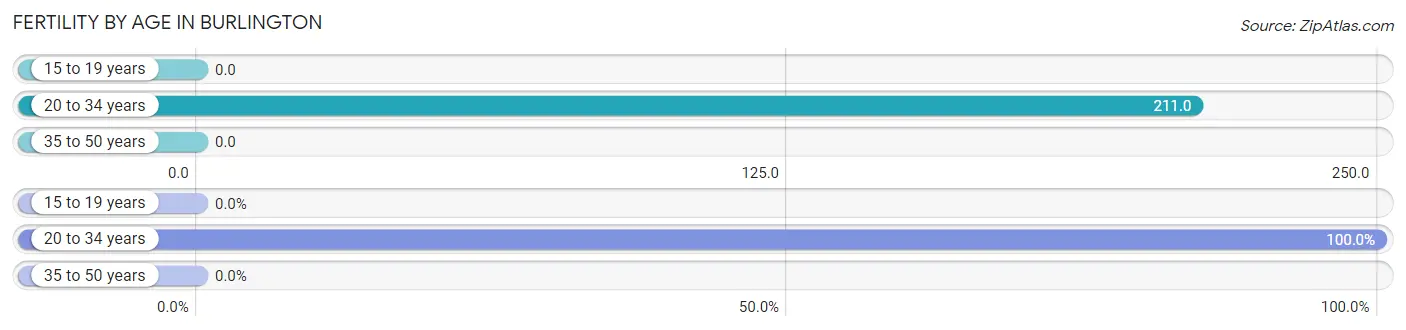
| Age Bracket | Women with Births | Births / 1,000 Women |
| 15 to 19 years | 0 (0.0%) | 0.0 |
| 20 to 34 years | 8 (100.0%) | 211.0 |
| 35 to 50 years | 0 (0.0%) | 0.0 |
| Total | 8 (100.0%) | 66.0 |
Fertility by Age by Marriage Status in Burlington
37.5% of women with births (8) in Burlington are married. The highest percentage of unmarried women with births falls into 20 to 34 years age bracket with 62.5% of them unmarried at the time of birth, while the lowest percentage of unmarried women with births belong to 20 to 34 years age bracket with 62.5% of them unmarried.
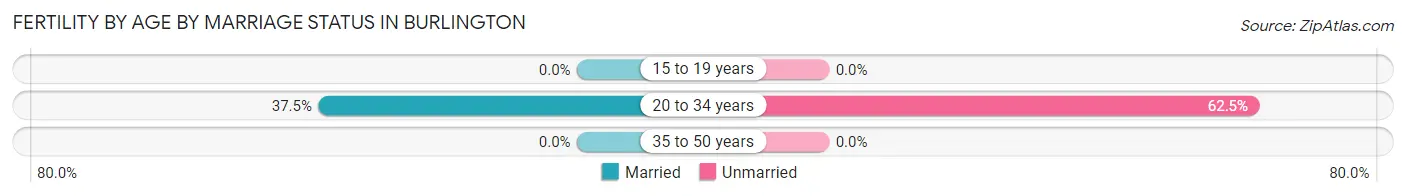
| Age Bracket | Married | Unmarried |
| 15 to 19 years | 0 (0.0%) | 0 (0.0%) |
| 20 to 34 years | 3 (37.5%) | 5 (62.5%) |
| 35 to 50 years | 0 (0.0%) | 0 (0.0%) |
| Total | 3 (37.5%) | 5 (62.5%) |
Fertility by Education in Burlington
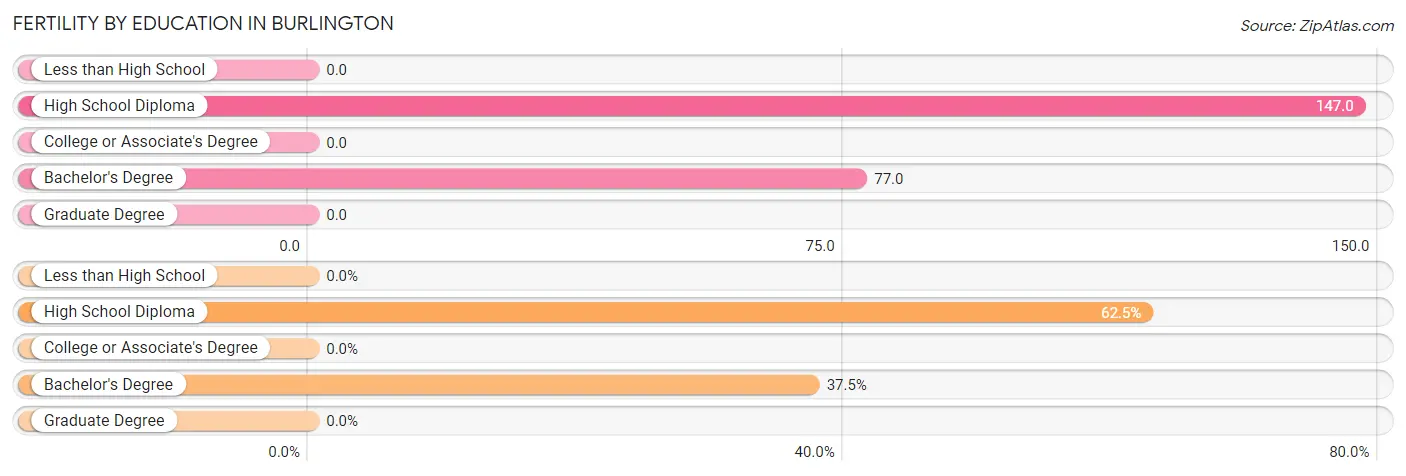
| Educational Attainment | Women with Births | Births / 1,000 Women |
| Less than High School | 0 (0.0%) | 0.0 |
| High School Diploma | 5 (62.5%) | 147.0 |
| College or Associate's Degree | 0 (0.0%) | 0.0 |
| Bachelor's Degree | 3 (37.5%) | 77.0 |
| Graduate Degree | 0 (0.0%) | 0.0 |
| Total | 8 (100.0%) | 66.0 |
Fertility by Education by Marriage Status in Burlington
62.5% of women with births in Burlington are unmarried. Women with the educational attainment of bachelor's degree are most likely to be married with 100.0% of them married at childbirth, while women with the educational attainment of high school diploma are least likely to be married with 100.0% of them unmarried at childbirth.
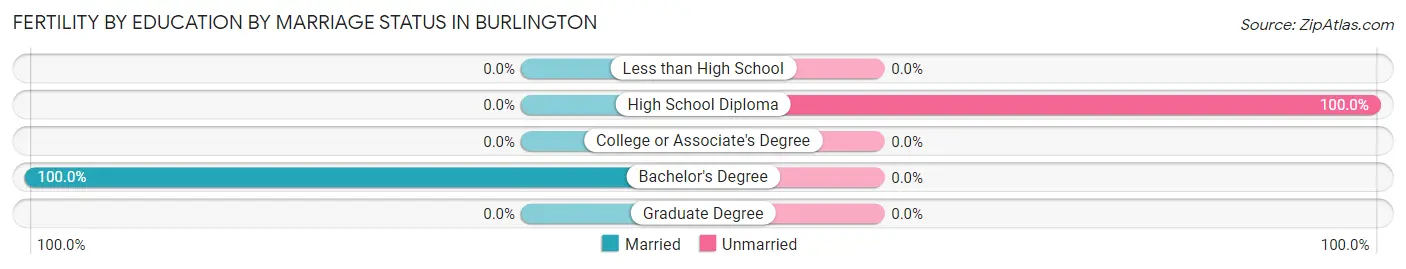
| Educational Attainment | Married | Unmarried |
| Less than High School | 0 (0.0%) | 0 (0.0%) |
| High School Diploma | 0 (0.0%) | 5 (100.0%) |
| College or Associate's Degree | 0 (0.0%) | 0 (0.0%) |
| Bachelor's Degree | 3 (100.0%) | 0 (0.0%) |
| Graduate Degree | 0 (0.0%) | 0 (0.0%) |
| Total | 3 (37.5%) | 5 (62.5%) |
Employment Characteristics in Burlington
Employment by Class of Employer in Burlington
Among the 313 employed individuals in Burlington, private company employees (183 | 58.5%), local government employees (57 | 18.2%), and not-for-profit organizations (44 | 14.1%) make up the most common classes of employment.
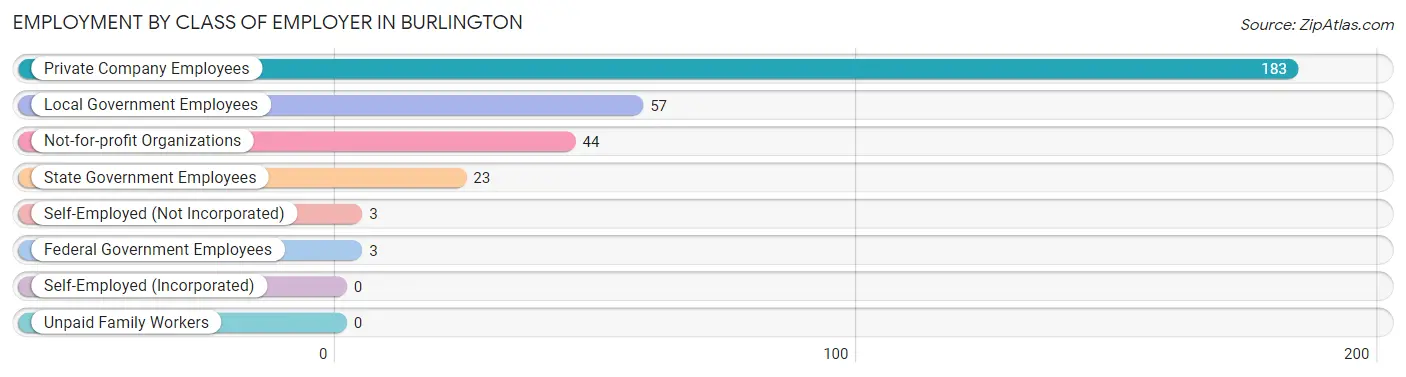
| Employer Class | # Employees | % Employees |
| Private Company Employees | 183 | 58.5% |
| Self-Employed (Incorporated) | 0 | 0.0% |
| Self-Employed (Not Incorporated) | 3 | 1.0% |
| Not-for-profit Organizations | 44 | 14.1% |
| Local Government Employees | 57 | 18.2% |
| State Government Employees | 23 | 7.3% |
| Federal Government Employees | 3 | 1.0% |
| Unpaid Family Workers | 0 | 0.0% |
| Total | 313 | 100.0% |
Employment Status by Age in Burlington
According to the labor force statistics for Burlington, out of the total population over 16 years of age (503), 64.8% or 326 individuals are in the labor force, with 3.7% or 12 of them unemployed. The age group with the highest labor force participation rate is 25 to 29 years, with 100.0% or 14 individuals in the labor force. Within the labor force, the 16 to 19 years age range has the highest percentage of unemployed individuals, with 100.0% or 2 of them being unemployed.
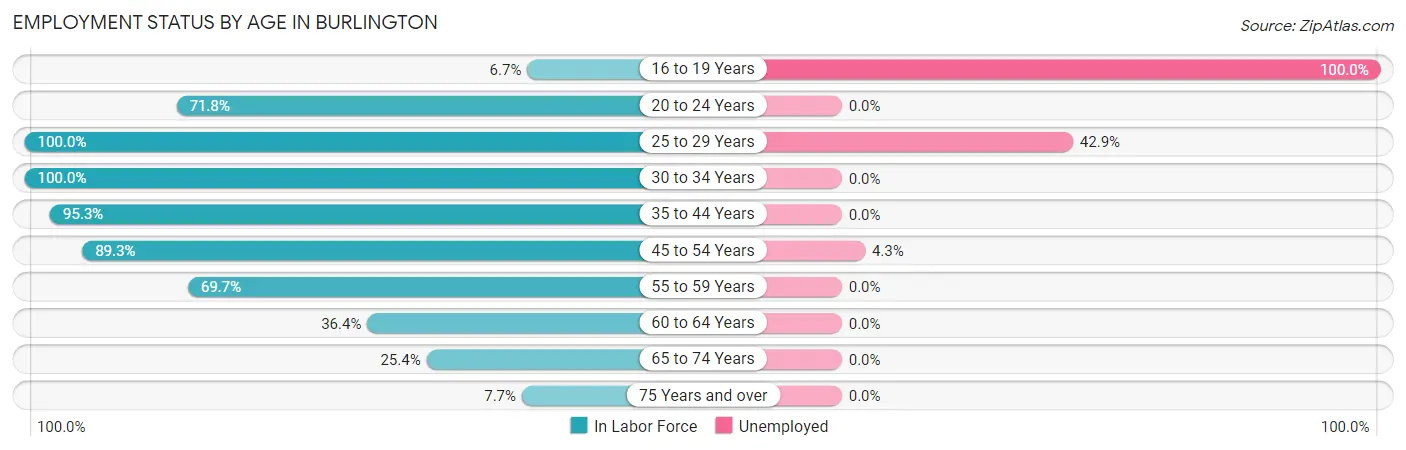
| Age Bracket | In Labor Force | Unemployed |
| 16 to 19 Years | 2 (6.7%) | 2 (100.0%) |
| 20 to 24 Years | 28 (71.8%) | 0 (0.0%) |
| 25 to 29 Years | 14 (100.0%) | 6 (42.9%) |
| 30 to 34 Years | 36 (100.0%) | 0 (0.0%) |
| 35 to 44 Years | 102 (95.3%) | 0 (0.0%) |
| 45 to 54 Years | 92 (89.3%) | 4 (4.3%) |
| 55 to 59 Years | 23 (69.7%) | 0 (0.0%) |
| 60 to 64 Years | 8 (36.4%) | 0 (0.0%) |
| 65 to 74 Years | 17 (25.4%) | 0 (0.0%) |
| 75 Years and over | 4 (7.7%) | 0 (0.0%) |
| Total | 326 (64.8%) | 12 (3.7%) |
Employment Status by Educational Attainment in Burlington
According to labor force statistics for Burlington, 87.3% of individuals (275) out of the total population between 25 and 64 years of age (315) are in the labor force, with 3.6% or 10 of them being unemployed. The group with the highest labor force participation rate are those with the educational attainment of less than high school, with 100.0% or 13 individuals in the labor force. Within the labor force, individuals with less than high school education have the highest percentage of unemployment, with 30.8% or 4 of them being unemployed.
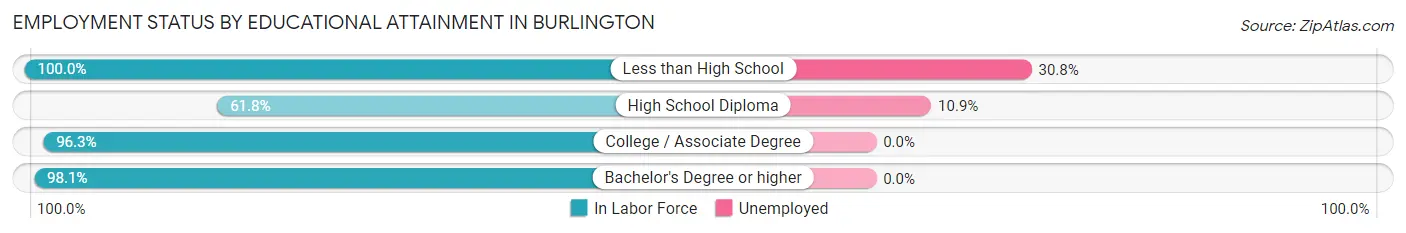
| Educational Attainment | In Labor Force | Unemployed |
| Less than High School | 13 (100.0%) | 4 (30.8%) |
| High School Diploma | 55 (61.8%) | 10 (10.9%) |
| College / Associate Degree | 104 (96.3%) | 0 (0.0%) |
| Bachelor's Degree or higher | 103 (98.1%) | 0 (0.0%) |
| Total | 275 (87.3%) | 11 (3.6%) |
Employment Occupations by Sex in Burlington
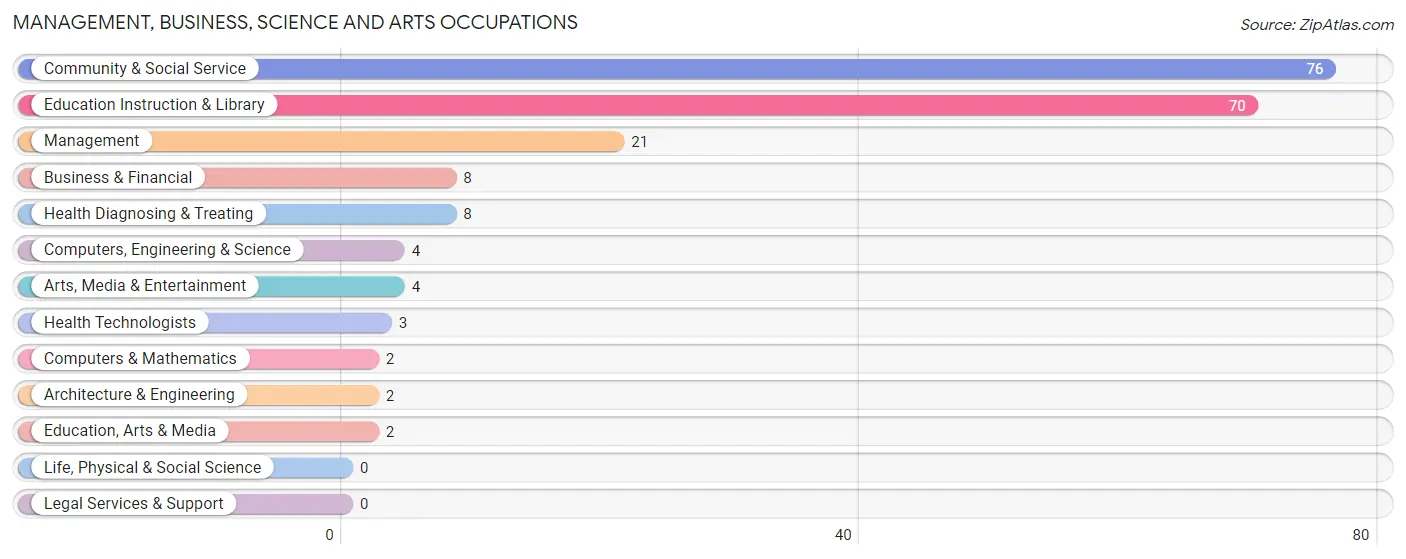
Management, Business, Science and Arts Occupations
The most common Management, Business, Science and Arts occupations in Burlington are Community & Social Service (76 | 24.2%), Education Instruction & Library (70 | 22.3%), Management (21 | 6.7%), Business & Financial (8 | 2.5%), and Health Diagnosing & Treating (8 | 2.5%).
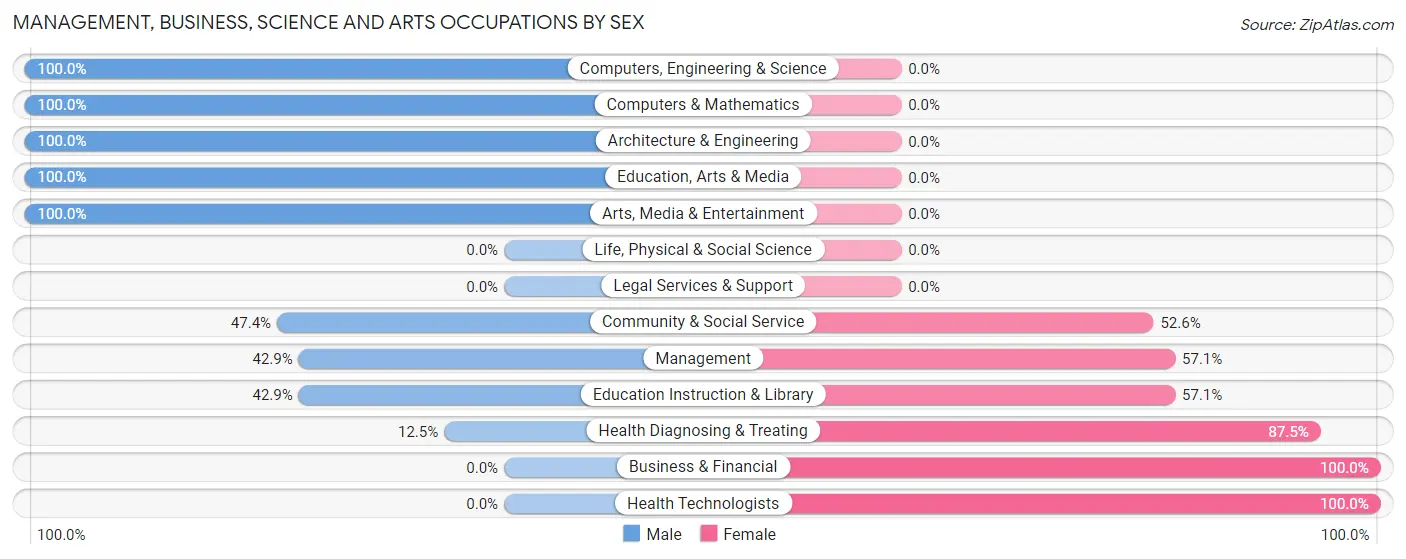
Management, Business, Science and Arts Occupations by Sex
Within the Management, Business, Science and Arts occupations in Burlington, the most male-oriented occupations are Computers, Engineering & Science (100.0%), Computers & Mathematics (100.0%), and Architecture & Engineering (100.0%), while the most female-oriented occupations are Business & Financial (100.0%), Health Technologists (100.0%), and Health Diagnosing & Treating (87.5%).
| Occupation | Male | Female |
| Management | 9 (42.9%) | 12 (57.1%) |
| Business & Financial | 0 (0.0%) | 8 (100.0%) |
| Computers, Engineering & Science | 4 (100.0%) | 0 (0.0%) |
| Computers & Mathematics | 2 (100.0%) | 0 (0.0%) |
| Architecture & Engineering | 2 (100.0%) | 0 (0.0%) |
| Life, Physical & Social Science | 0 (0.0%) | 0 (0.0%) |
| Community & Social Service | 36 (47.4%) | 40 (52.6%) |
| Education, Arts & Media | 2 (100.0%) | 0 (0.0%) |
| Legal Services & Support | 0 (0.0%) | 0 (0.0%) |
| Education Instruction & Library | 30 (42.9%) | 40 (57.1%) |
| Arts, Media & Entertainment | 4 (100.0%) | 0 (0.0%) |
| Health Diagnosing & Treating | 1 (12.5%) | 7 (87.5%) |
| Health Technologists | 0 (0.0%) | 3 (100.0%) |
| Total (Category) | 50 (42.7%) | 67 (57.3%) |
| Total (Overall) | 183 (58.3%) | 131 (41.7%) |
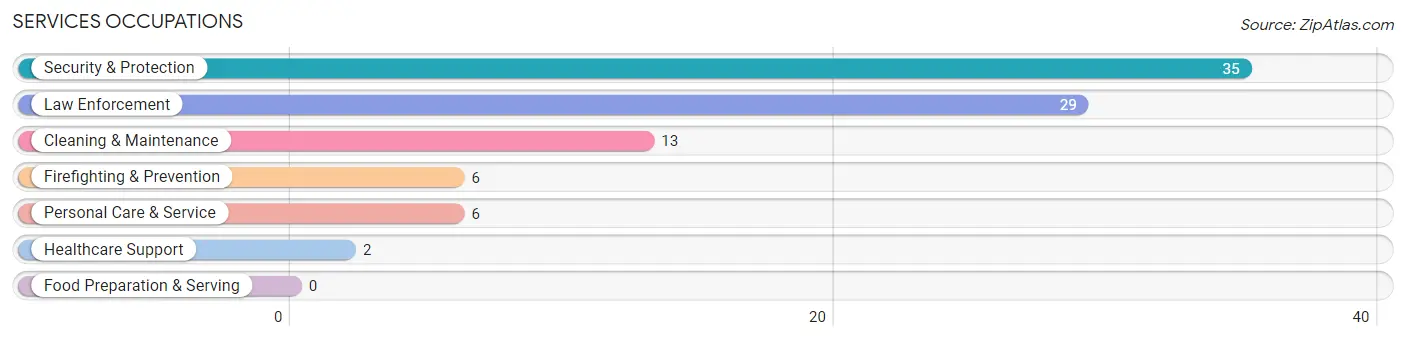
Services Occupations
The most common Services occupations in Burlington are Security & Protection (35 | 11.2%), Law Enforcement (29 | 9.2%), Cleaning & Maintenance (13 | 4.1%), Firefighting & Prevention (6 | 1.9%), and Personal Care & Service (6 | 1.9%).
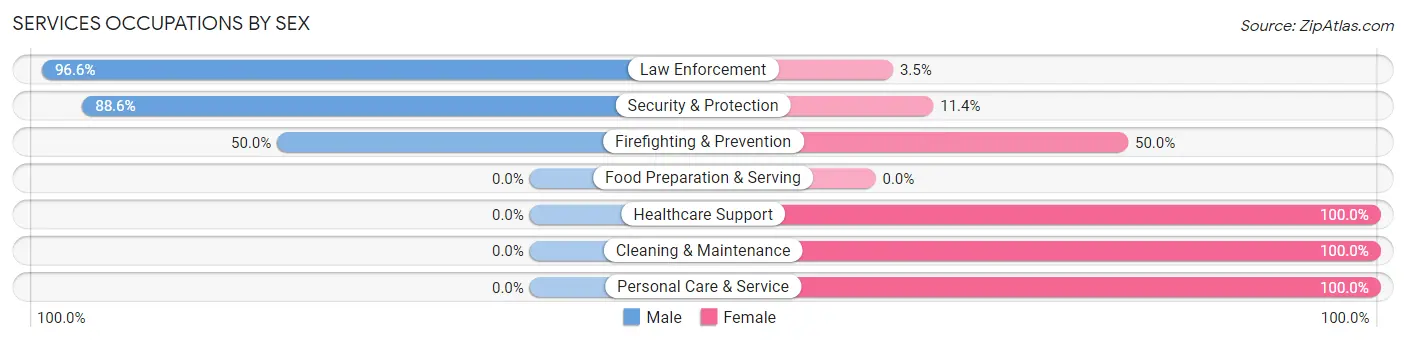
Services Occupations by Sex
Within the Services occupations in Burlington, the most male-oriented occupations are Law Enforcement (96.6%), Security & Protection (88.6%), and Firefighting & Prevention (50.0%), while the most female-oriented occupations are Healthcare Support (100.0%), Cleaning & Maintenance (100.0%), and Personal Care & Service (100.0%).
| Occupation | Male | Female |
| Healthcare Support | 0 (0.0%) | 2 (100.0%) |
| Security & Protection | 31 (88.6%) | 4 (11.4%) |
| Firefighting & Prevention | 3 (50.0%) | 3 (50.0%) |
| Law Enforcement | 28 (96.6%) | 1 (3.5%) |
| Food Preparation & Serving | 0 (0.0%) | 0 (0.0%) |
| Cleaning & Maintenance | 0 (0.0%) | 13 (100.0%) |
| Personal Care & Service | 0 (0.0%) | 6 (100.0%) |
| Total (Category) | 31 (55.4%) | 25 (44.6%) |
| Total (Overall) | 183 (58.3%) | 131 (41.7%) |
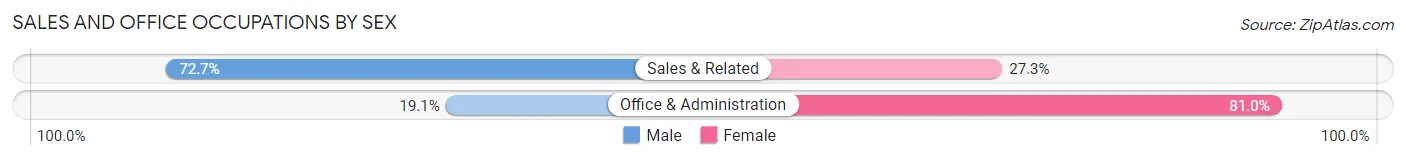
Sales and Office Occupations
The most common Sales and Office occupations in Burlington are Office & Administration (21 | 6.7%), and Sales & Related (11 | 3.5%).

Sales and Office Occupations by Sex
| Occupation | Male | Female |
| Sales & Related | 8 (72.7%) | 3 (27.3%) |
| Office & Administration | 4 (19.1%) | 17 (80.9%) |
| Total (Category) | 12 (37.5%) | 20 (62.5%) |
| Total (Overall) | 183 (58.3%) | 131 (41.7%) |
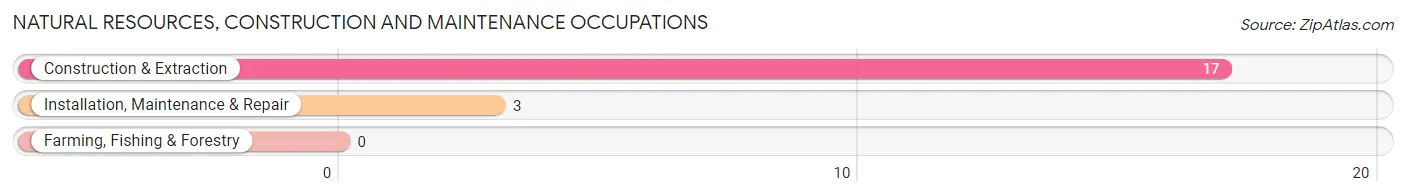
Natural Resources, Construction and Maintenance Occupations
The most common Natural Resources, Construction and Maintenance occupations in Burlington are Construction & Extraction (17 | 5.4%), and Installation, Maintenance & Repair (3 | 1.0%).
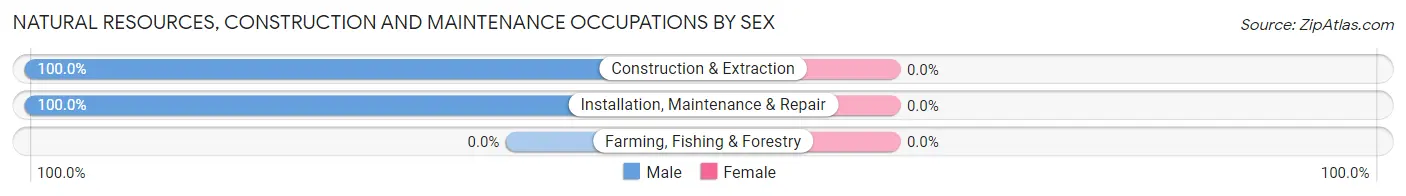
Natural Resources, Construction and Maintenance Occupations by Sex
| Occupation | Male | Female |
| Farming, Fishing & Forestry | 0 (0.0%) | 0 (0.0%) |
| Construction & Extraction | 17 (100.0%) | 0 (0.0%) |
| Installation, Maintenance & Repair | 3 (100.0%) | 0 (0.0%) |
| Total (Category) | 20 (100.0%) | 0 (0.0%) |
| Total (Overall) | 183 (58.3%) | 131 (41.7%) |
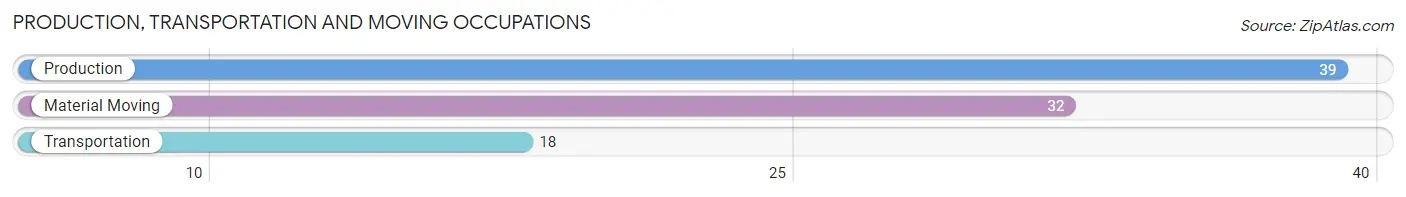
Production, Transportation and Moving Occupations
The most common Production, Transportation and Moving occupations in Burlington are Production (39 | 12.4%), Material Moving (32 | 10.2%), and Transportation (18 | 5.7%).
Production, Transportation and Moving Occupations by Sex
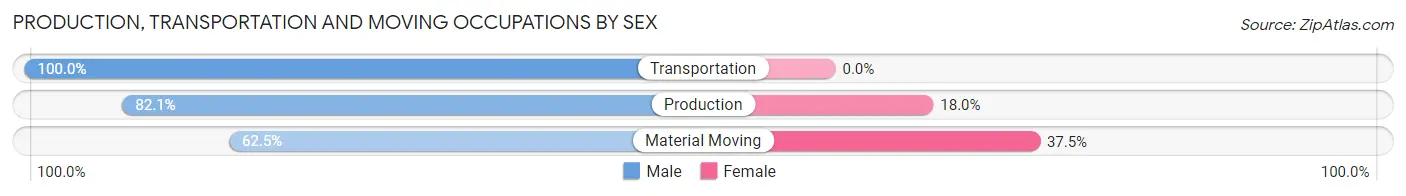
| Occupation | Male | Female |
| Production | 32 (82.1%) | 7 (17.9%) |
| Transportation | 18 (100.0%) | 0 (0.0%) |
| Material Moving | 20 (62.5%) | 12 (37.5%) |
| Total (Category) | 70 (78.6%) | 19 (21.3%) |
| Total (Overall) | 183 (58.3%) | 131 (41.7%) |
Employment Industries by Sex in Burlington
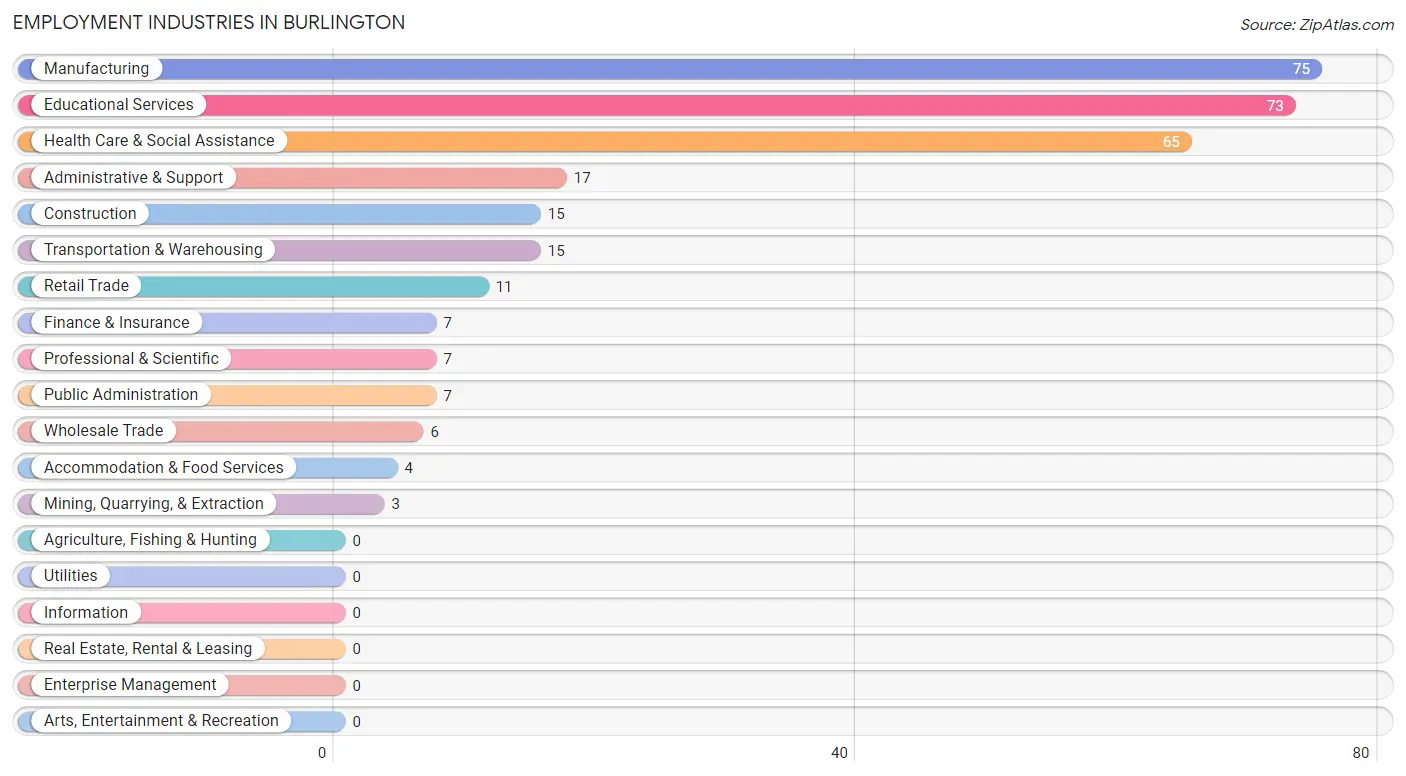
Employment Industries in Burlington
The major employment industries in Burlington include Manufacturing (75 | 23.9%), Educational Services (73 | 23.3%), Health Care & Social Assistance (65 | 20.7%), Administrative & Support (17 | 5.4%), and Construction (15 | 4.8%).
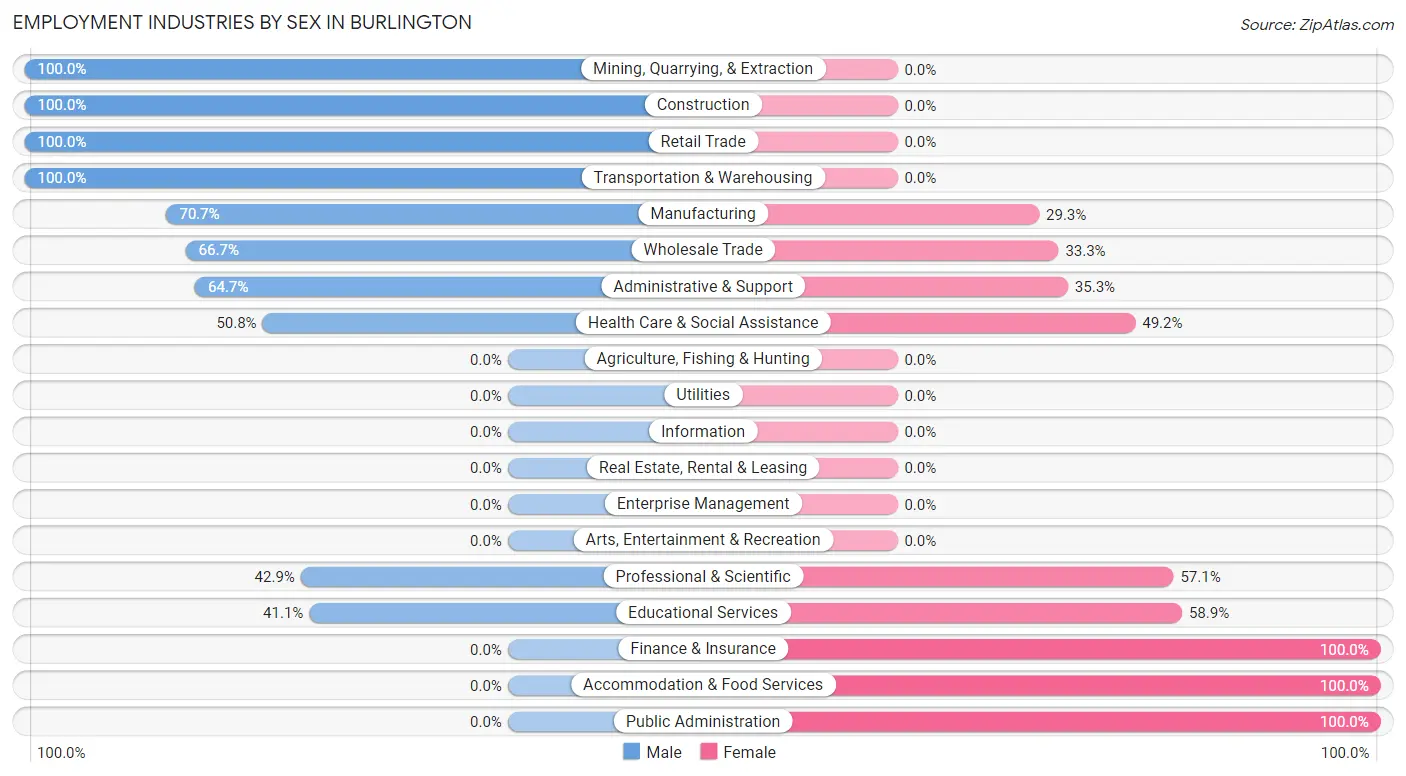
Employment Industries by Sex in Burlington
The Burlington industries that see more men than women are Mining, Quarrying, & Extraction (100.0%), Construction (100.0%), and Retail Trade (100.0%), whereas the industries that tend to have a higher number of women are Finance & Insurance (100.0%), Accommodation & Food Services (100.0%), and Public Administration (100.0%).
| Industry | Male | Female |
| Agriculture, Fishing & Hunting | 0 (0.0%) | 0 (0.0%) |
| Mining, Quarrying, & Extraction | 3 (100.0%) | 0 (0.0%) |
| Construction | 15 (100.0%) | 0 (0.0%) |
| Manufacturing | 53 (70.7%) | 22 (29.3%) |
| Wholesale Trade | 4 (66.7%) | 2 (33.3%) |
| Retail Trade | 11 (100.0%) | 0 (0.0%) |
| Transportation & Warehousing | 15 (100.0%) | 0 (0.0%) |
| Utilities | 0 (0.0%) | 0 (0.0%) |
| Information | 0 (0.0%) | 0 (0.0%) |
| Finance & Insurance | 0 (0.0%) | 7 (100.0%) |
| Real Estate, Rental & Leasing | 0 (0.0%) | 0 (0.0%) |
| Professional & Scientific | 3 (42.9%) | 4 (57.1%) |
| Enterprise Management | 0 (0.0%) | 0 (0.0%) |
| Administrative & Support | 11 (64.7%) | 6 (35.3%) |
| Educational Services | 30 (41.1%) | 43 (58.9%) |
| Health Care & Social Assistance | 33 (50.8%) | 32 (49.2%) |
| Arts, Entertainment & Recreation | 0 (0.0%) | 0 (0.0%) |
| Accommodation & Food Services | 0 (0.0%) | 4 (100.0%) |
| Public Administration | 0 (0.0%) | 7 (100.0%) |
| Total | 183 (58.3%) | 131 (41.7%) |
Education in Burlington
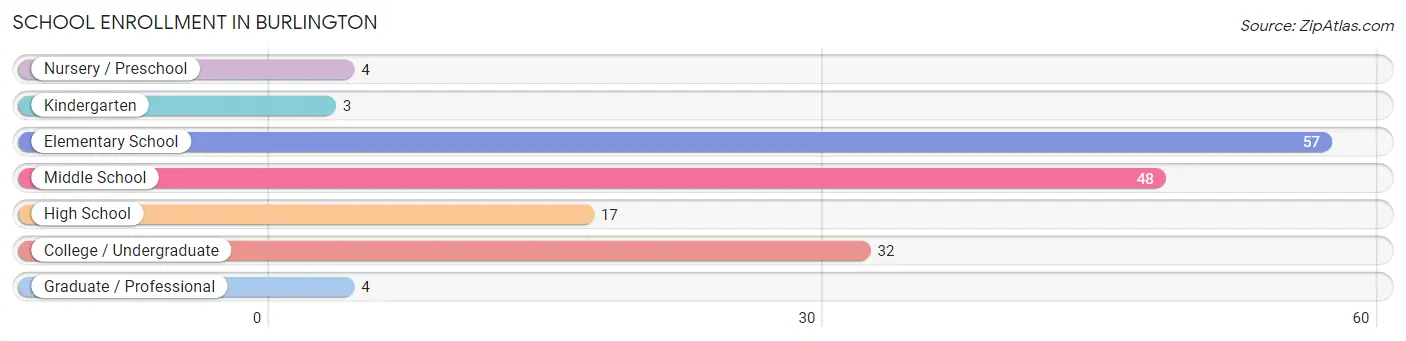
School Enrollment in Burlington
The most common levels of schooling among the 165 students in Burlington are elementary school (57 | 34.5%), middle school (48 | 29.1%), and college / undergraduate (32 | 19.4%).
| School Level | # Students | % Students |
| Nursery / Preschool | 4 | 2.4% |
| Kindergarten | 3 | 1.8% |
| Elementary School | 57 | 34.5% |
| Middle School | 48 | 29.1% |
| High School | 17 | 10.3% |
| College / Undergraduate | 32 | 19.4% |
| Graduate / Professional | 4 | 2.4% |
| Total | 165 | 100.0% |
School Enrollment by Age by Funding Source in Burlington
Out of a total of 165 students who are enrolled in schools in Burlington, 17 (10.3%) attend a private institution, while the remaining 148 (89.7%) are enrolled in public schools. The age group of 18 to 19 year olds has the highest likelihood of being enrolled in private schools, with 10 (83.3% in the age bracket) enrolled. Conversely, the age group of 3 to 4 year olds has the lowest likelihood of being enrolled in a private school, with 4 (100.0% in the age bracket) attending a public institution.
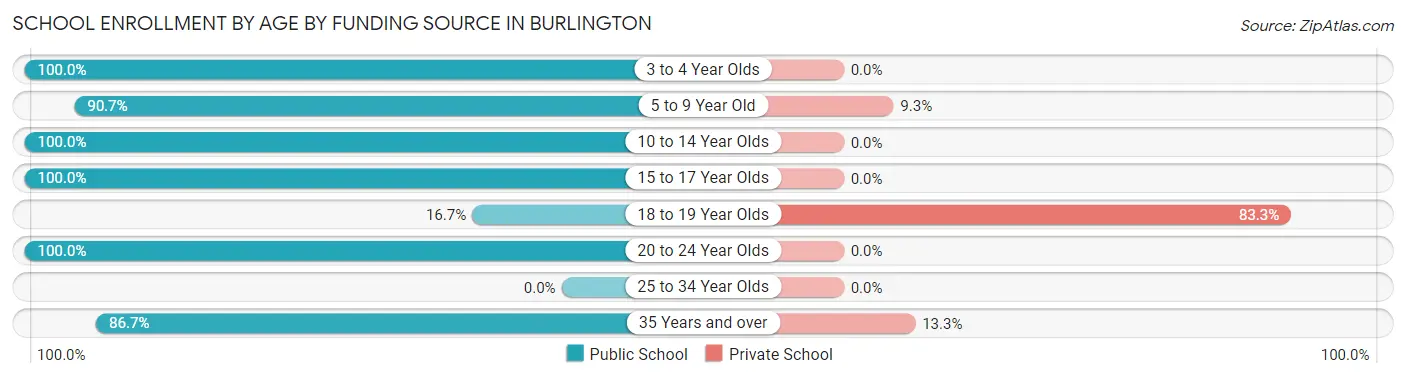
| Age Bracket | Public School | Private School |
| 3 to 4 Year Olds | 4 (100.0%) | 0 (0.0%) |
| 5 to 9 Year Old | 49 (90.7%) | 5 (9.3%) |
| 10 to 14 Year Olds | 54 (100.0%) | 0 (0.0%) |
| 15 to 17 Year Olds | 10 (100.0%) | 0 (0.0%) |
| 18 to 19 Year Olds | 2 (16.7%) | 10 (83.3%) |
| 20 to 24 Year Olds | 16 (100.0%) | 0 (0.0%) |
| 25 to 34 Year Olds | 0 (0.0%) | 0 (0.0%) |
| 35 Years and over | 13 (86.7%) | 2 (13.3%) |
| Total | 148 (89.7%) | 17 (10.3%) |
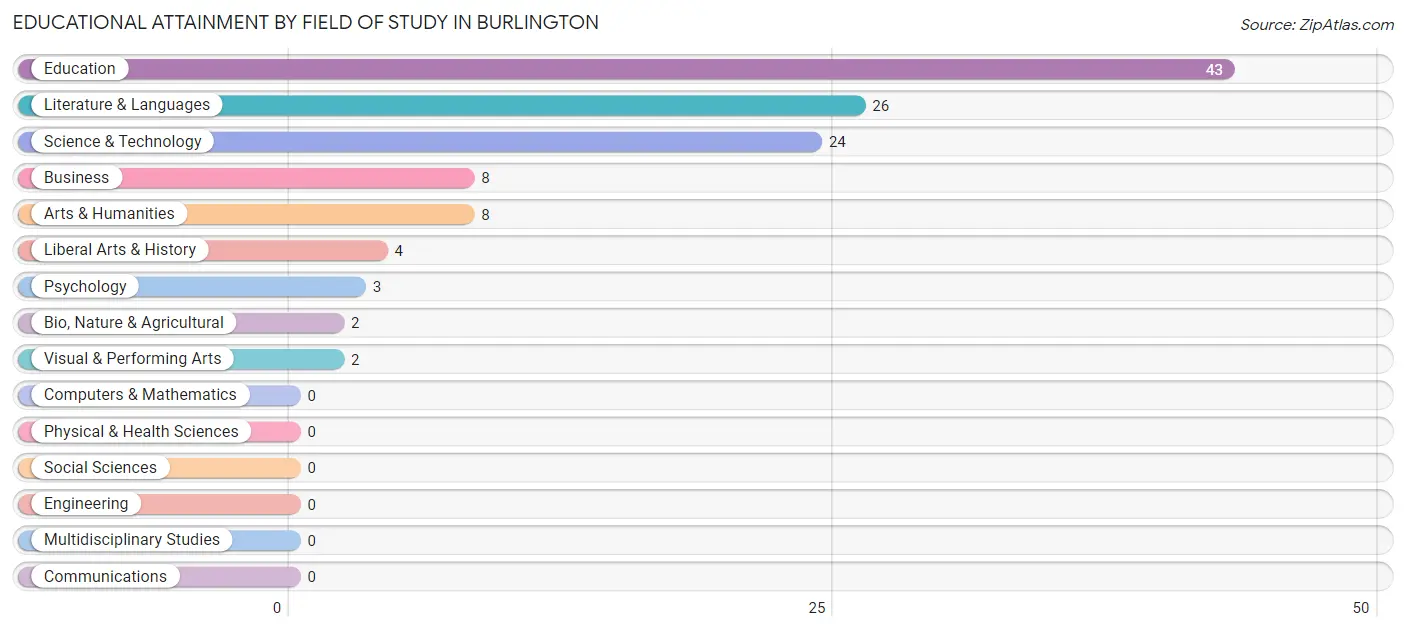
Educational Attainment by Field of Study in Burlington
Education (43 | 35.8%), literature & languages (26 | 21.7%), science & technology (24 | 20.0%), business (8 | 6.7%), and arts & humanities (8 | 6.7%) are the most common fields of study among 120 individuals in Burlington who have obtained a bachelor's degree or higher.
| Field of Study | # Graduates | % Graduates |
| Computers & Mathematics | 0 | 0.0% |
| Bio, Nature & Agricultural | 2 | 1.7% |
| Physical & Health Sciences | 0 | 0.0% |
| Psychology | 3 | 2.5% |
| Social Sciences | 0 | 0.0% |
| Engineering | 0 | 0.0% |
| Multidisciplinary Studies | 0 | 0.0% |
| Science & Technology | 24 | 20.0% |
| Business | 8 | 6.7% |
| Education | 43 | 35.8% |
| Literature & Languages | 26 | 21.7% |
| Liberal Arts & History | 4 | 3.3% |
| Visual & Performing Arts | 2 | 1.7% |
| Communications | 0 | 0.0% |
| Arts & Humanities | 8 | 6.7% |
| Total | 120 | 100.0% |
Transportation & Commute in Burlington
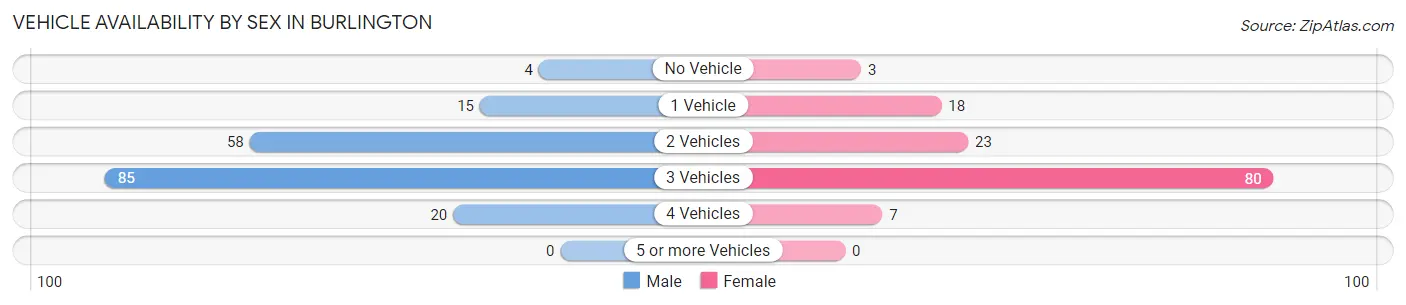
Vehicle Availability by Sex in Burlington
The most prevalent vehicle ownership categories in Burlington are males with 3 vehicles (85, accounting for 46.7%) and females with 3 vehicles (80, making up 64.9%).
| Vehicles Available | Male | Female |
| No Vehicle | 4 (2.2%) | 3 (2.3%) |
| 1 Vehicle | 15 (8.2%) | 18 (13.7%) |
| 2 Vehicles | 58 (31.9%) | 23 (17.6%) |
| 3 Vehicles | 85 (46.7%) | 80 (61.1%) |
| 4 Vehicles | 20 (11.0%) | 7 (5.3%) |
| 5 or more Vehicles | 0 (0.0%) | 0 (0.0%) |
| Total | 182 (100.0%) | 131 (100.0%) |
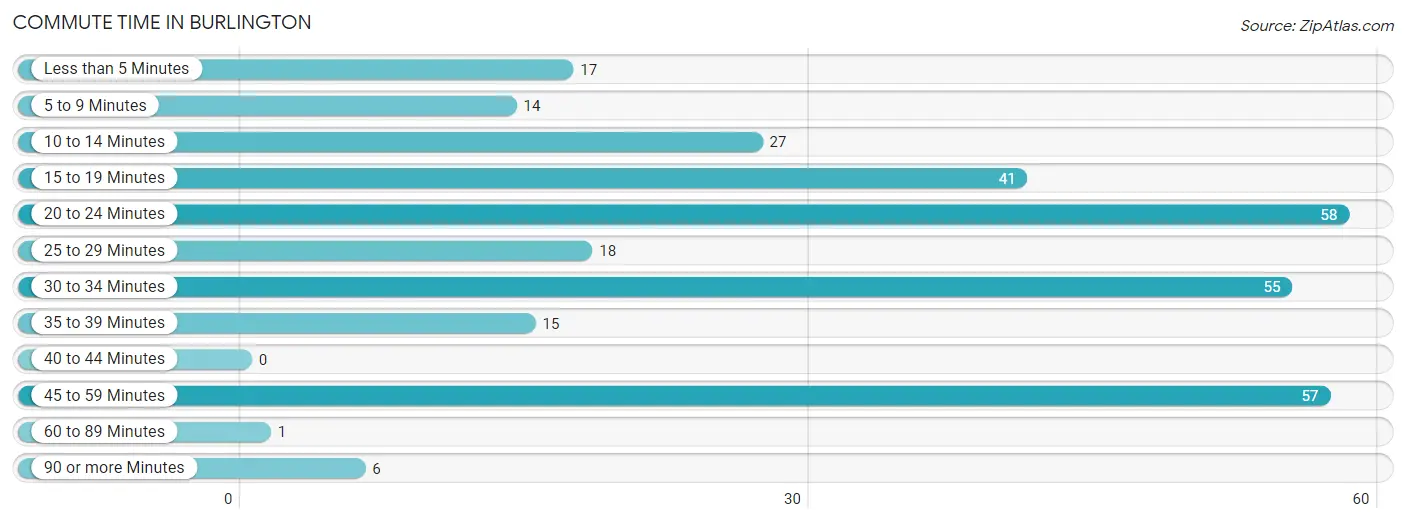
Commute Time in Burlington
The most frequently occuring commute durations in Burlington are 20 to 24 minutes (58 commuters, 18.8%), 45 to 59 minutes (57 commuters, 18.4%), and 30 to 34 minutes (55 commuters, 17.8%).
| Commute Time | # Commuters | % Commuters |
| Less than 5 Minutes | 17 | 5.5% |
| 5 to 9 Minutes | 14 | 4.5% |
| 10 to 14 Minutes | 27 | 8.7% |
| 15 to 19 Minutes | 41 | 13.3% |
| 20 to 24 Minutes | 58 | 18.8% |
| 25 to 29 Minutes | 18 | 5.8% |
| 30 to 34 Minutes | 55 | 17.8% |
| 35 to 39 Minutes | 15 | 4.9% |
| 40 to 44 Minutes | 0 | 0.0% |
| 45 to 59 Minutes | 57 | 18.4% |
| 60 to 89 Minutes | 1 | 0.3% |
| 90 or more Minutes | 6 | 1.9% |
Commute Time by Sex in Burlington
The most common commute times in Burlington are 45 to 59 minutes (37 commuters, 20.6%) for males and 20 to 24 minutes (46 commuters, 35.7%) for females.
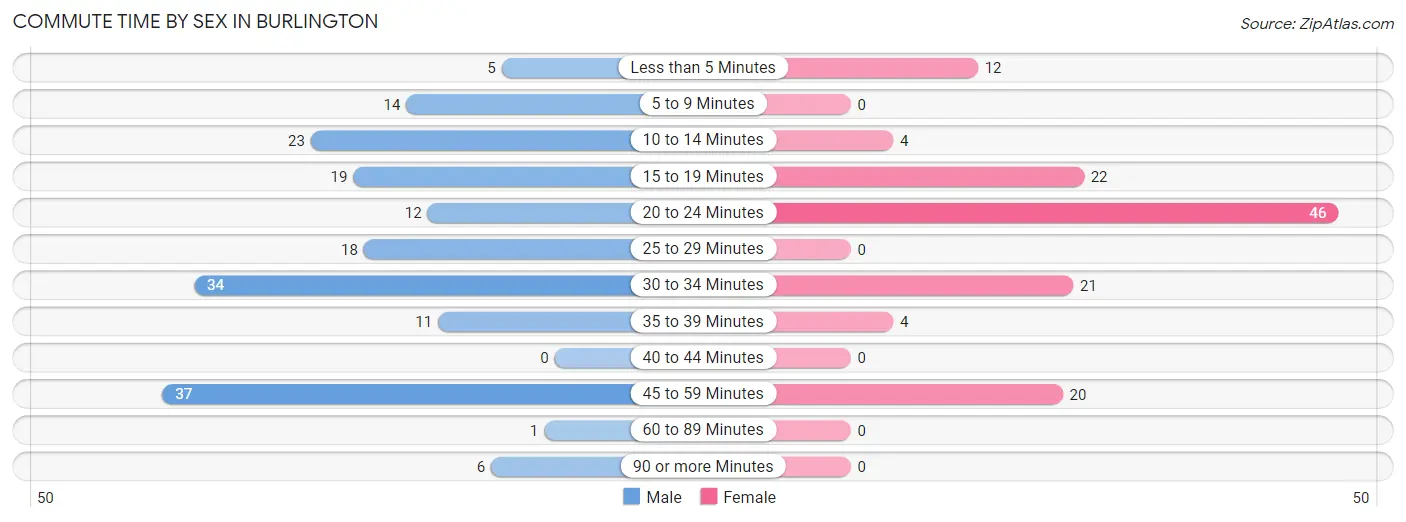
| Commute Time | Male | Female |
| Less than 5 Minutes | 5 (2.8%) | 12 (9.3%) |
| 5 to 9 Minutes | 14 (7.8%) | 0 (0.0%) |
| 10 to 14 Minutes | 23 (12.8%) | 4 (3.1%) |
| 15 to 19 Minutes | 19 (10.6%) | 22 (17.1%) |
| 20 to 24 Minutes | 12 (6.7%) | 46 (35.7%) |
| 25 to 29 Minutes | 18 (10.0%) | 0 (0.0%) |
| 30 to 34 Minutes | 34 (18.9%) | 21 (16.3%) |
| 35 to 39 Minutes | 11 (6.1%) | 4 (3.1%) |
| 40 to 44 Minutes | 0 (0.0%) | 0 (0.0%) |
| 45 to 59 Minutes | 37 (20.6%) | 20 (15.5%) |
| 60 to 89 Minutes | 1 (0.6%) | 0 (0.0%) |
| 90 or more Minutes | 6 (3.3%) | 0 (0.0%) |
Time of Departure to Work by Sex in Burlington
The most frequent times of departure to work in Burlington are 6:30 AM to 6:59 AM (52, 28.9%) for males and 6:30 AM to 6:59 AM (60, 46.5%) for females.
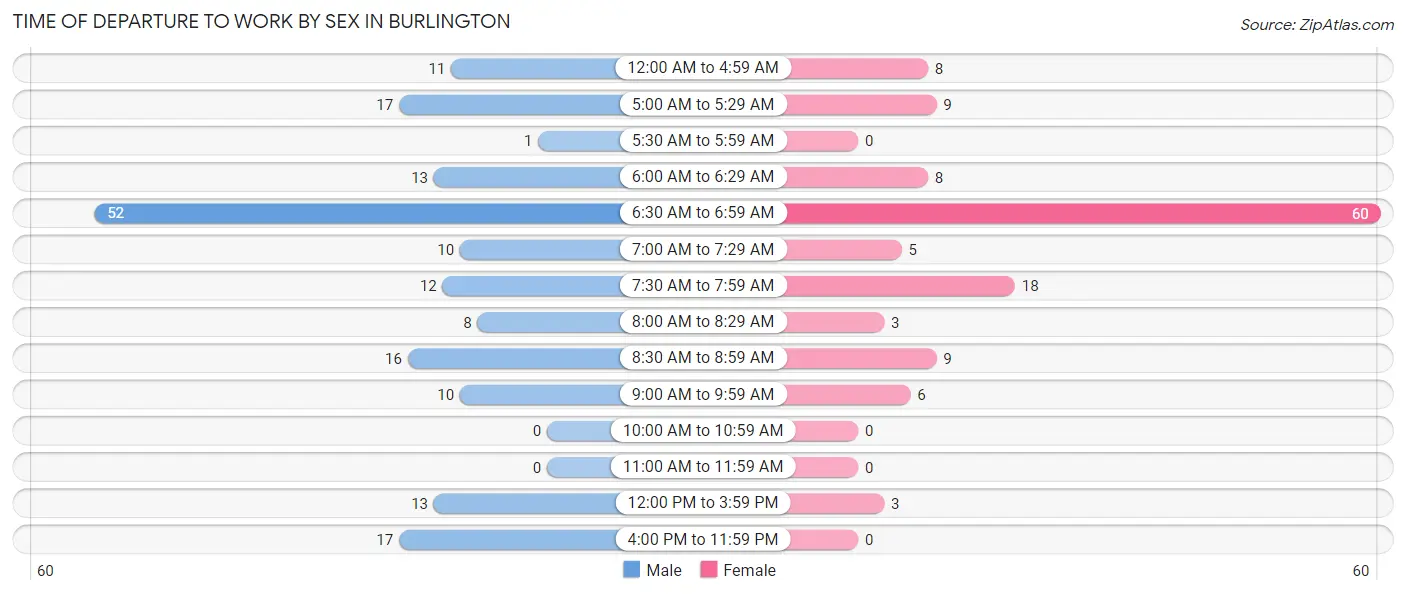
| Time of Departure | Male | Female |
| 12:00 AM to 4:59 AM | 11 (6.1%) | 8 (6.2%) |
| 5:00 AM to 5:29 AM | 17 (9.4%) | 9 (7.0%) |
| 5:30 AM to 5:59 AM | 1 (0.6%) | 0 (0.0%) |
| 6:00 AM to 6:29 AM | 13 (7.2%) | 8 (6.2%) |
| 6:30 AM to 6:59 AM | 52 (28.9%) | 60 (46.5%) |
| 7:00 AM to 7:29 AM | 10 (5.6%) | 5 (3.9%) |
| 7:30 AM to 7:59 AM | 12 (6.7%) | 18 (14.0%) |
| 8:00 AM to 8:29 AM | 8 (4.4%) | 3 (2.3%) |
| 8:30 AM to 8:59 AM | 16 (8.9%) | 9 (7.0%) |
| 9:00 AM to 9:59 AM | 10 (5.6%) | 6 (4.6%) |
| 10:00 AM to 10:59 AM | 0 (0.0%) | 0 (0.0%) |
| 11:00 AM to 11:59 AM | 0 (0.0%) | 0 (0.0%) |
| 12:00 PM to 3:59 PM | 13 (7.2%) | 3 (2.3%) |
| 4:00 PM to 11:59 PM | 17 (9.4%) | 0 (0.0%) |
| Total | 180 (100.0%) | 129 (100.0%) |
Housing Occupancy in Burlington
Occupancy by Ownership in Burlington
Of the total 280 dwellings in Burlington, owner-occupied units account for 218 (77.9%), while renter-occupied units make up 62 (22.1%).
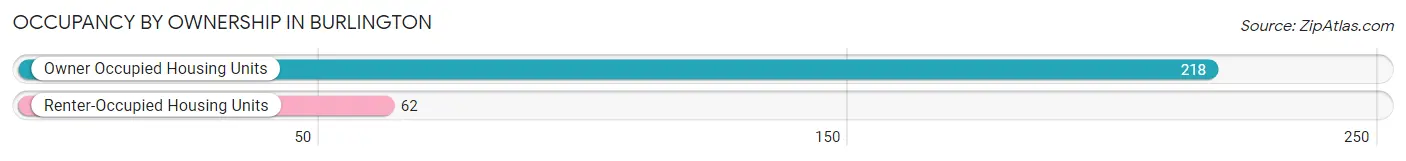
| Occupancy | # Housing Units | % Housing Units |
| Owner Occupied Housing Units | 218 | 77.9% |
| Renter-Occupied Housing Units | 62 | 22.1% |
| Total Occupied Housing Units | 280 | 100.0% |
Occupancy by Household Size in Burlington
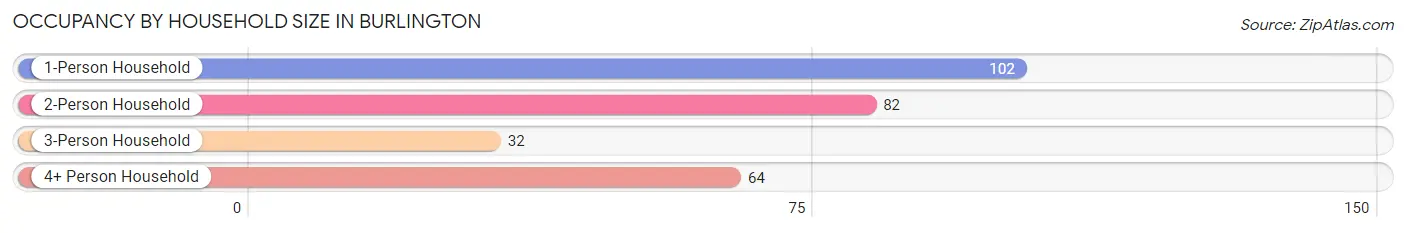
| Household Size | # Housing Units | % Housing Units |
| 1-Person Household | 102 | 36.4% |
| 2-Person Household | 82 | 29.3% |
| 3-Person Household | 32 | 11.4% |
| 4+ Person Household | 64 | 22.9% |
| Total Housing Units | 280 | 100.0% |
Occupancy by Ownership by Household Size in Burlington
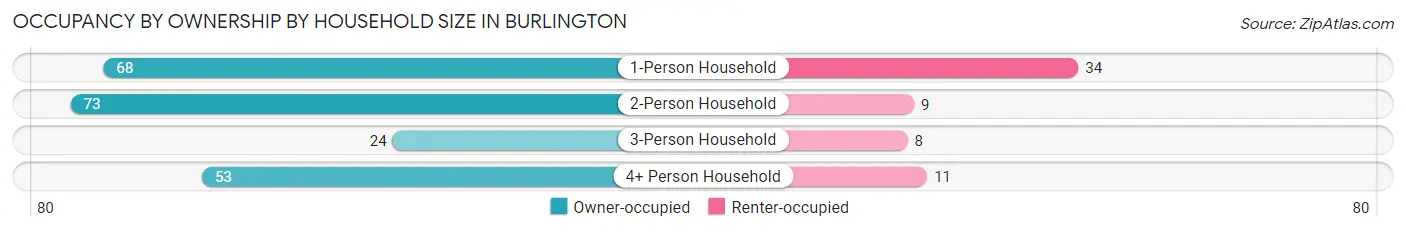
| Household Size | Owner-occupied | Renter-occupied |
| 1-Person Household | 68 (66.7%) | 34 (33.3%) |
| 2-Person Household | 73 (89.0%) | 9 (11.0%) |
| 3-Person Household | 24 (75.0%) | 8 (25.0%) |
| 4+ Person Household | 53 (82.8%) | 11 (17.2%) |
| Total Housing Units | 218 (77.9%) | 62 (22.1%) |
Occupancy by Educational Attainment in Burlington
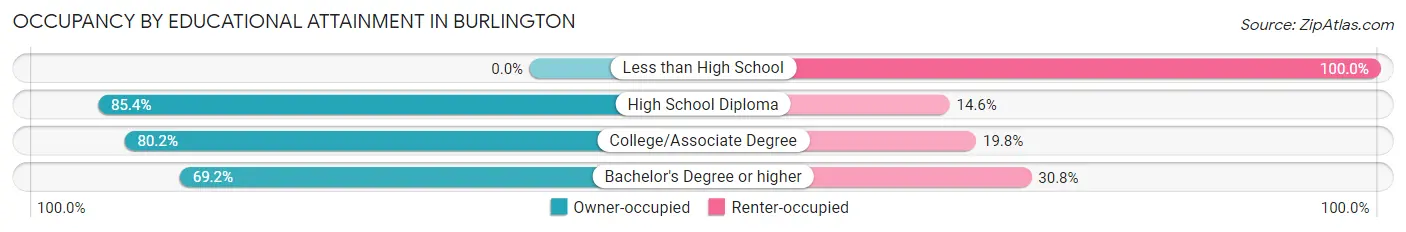
| Household Size | Owner-occupied | Renter-occupied |
| Less than High School | 0 (0.0%) | 6 (100.0%) |
| High School Diploma | 88 (85.4%) | 15 (14.6%) |
| College/Associate Degree | 85 (80.2%) | 21 (19.8%) |
| Bachelor's Degree or higher | 45 (69.2%) | 20 (30.8%) |
Occupancy by Age of Householder in Burlington
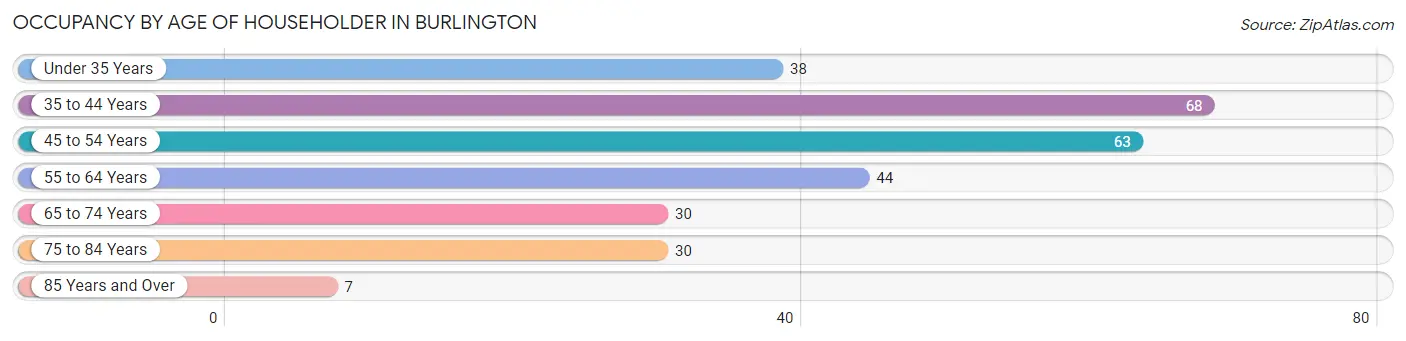
| Age Bracket | # Households | % Households |
| Under 35 Years | 38 | 13.6% |
| 35 to 44 Years | 68 | 24.3% |
| 45 to 54 Years | 63 | 22.5% |
| 55 to 64 Years | 44 | 15.7% |
| 65 to 74 Years | 30 | 10.7% |
| 75 to 84 Years | 30 | 10.7% |
| 85 Years and Over | 7 | 2.5% |
| Total | 280 | 100.0% |
Housing Finances in Burlington
Median Income by Occupancy in Burlington
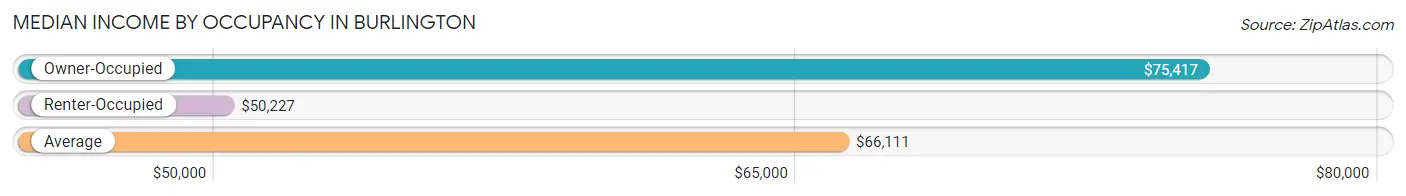
| Occupancy Type | # Households | Median Income |
| Owner-Occupied | 218 (77.9%) | $75,417 |
| Renter-Occupied | 62 (22.1%) | $50,227 |
| Average | 280 (100.0%) | $66,111 |
Occupancy by Householder Income Bracket in Burlington
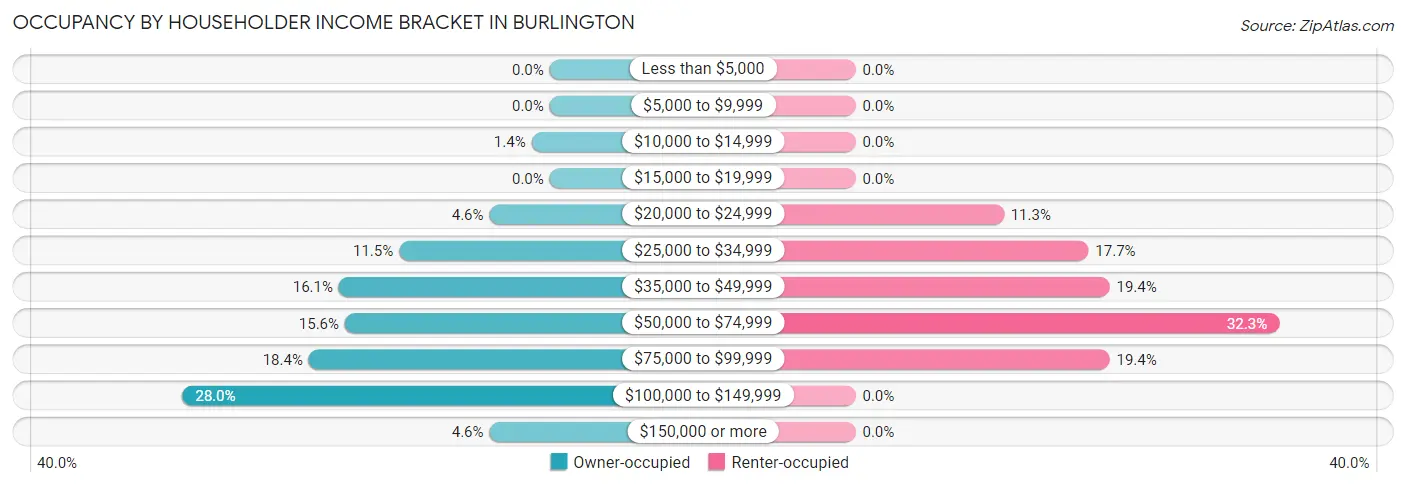
| Income Bracket | Owner-occupied | Renter-occupied |
| Less than $5,000 | 0 (0.0%) | 0 (0.0%) |
| $5,000 to $9,999 | 0 (0.0%) | 0 (0.0%) |
| $10,000 to $14,999 | 3 (1.4%) | 0 (0.0%) |
| $15,000 to $19,999 | 0 (0.0%) | 0 (0.0%) |
| $20,000 to $24,999 | 10 (4.6%) | 7 (11.3%) |
| $25,000 to $34,999 | 25 (11.5%) | 11 (17.7%) |
| $35,000 to $49,999 | 35 (16.1%) | 12 (19.4%) |
| $50,000 to $74,999 | 34 (15.6%) | 20 (32.3%) |
| $75,000 to $99,999 | 40 (18.3%) | 12 (19.4%) |
| $100,000 to $149,999 | 61 (28.0%) | 0 (0.0%) |
| $150,000 or more | 10 (4.6%) | 0 (0.0%) |
| Total | 218 (100.0%) | 62 (100.0%) |
Monthly Housing Cost Tiers in Burlington
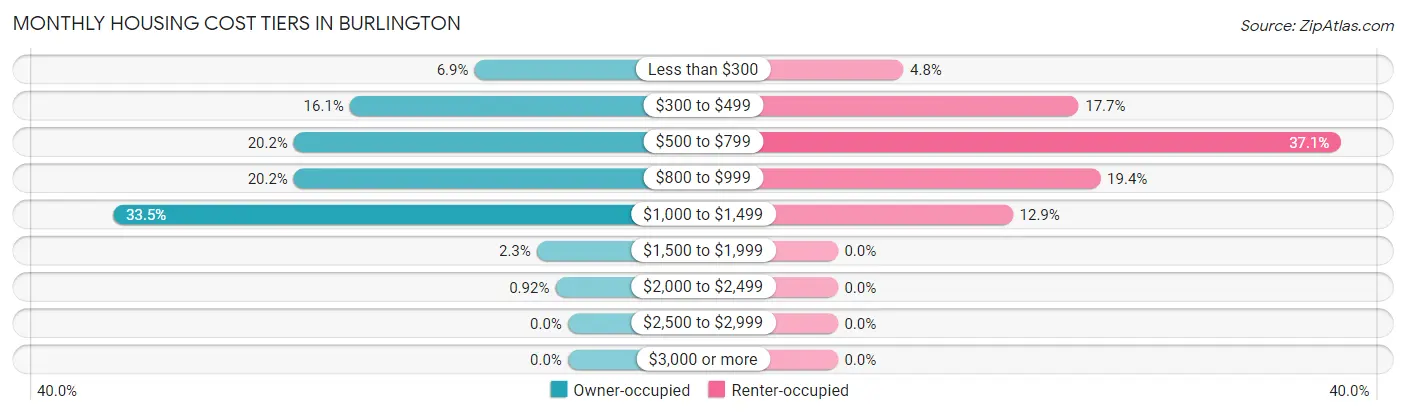
| Monthly Cost | Owner-occupied | Renter-occupied |
| Less than $300 | 15 (6.9%) | 3 (4.8%) |
| $300 to $499 | 35 (16.1%) | 11 (17.7%) |
| $500 to $799 | 44 (20.2%) | 23 (37.1%) |
| $800 to $999 | 44 (20.2%) | 12 (19.4%) |
| $1,000 to $1,499 | 73 (33.5%) | 8 (12.9%) |
| $1,500 to $1,999 | 5 (2.3%) | 0 (0.0%) |
| $2,000 to $2,499 | 2 (0.9%) | 0 (0.0%) |
| $2,500 to $2,999 | 0 (0.0%) | 0 (0.0%) |
| $3,000 or more | 0 (0.0%) | 0 (0.0%) |
| Total | 218 (100.0%) | 62 (100.0%) |
Physical Housing Characteristics in Burlington
Housing Structures in Burlington
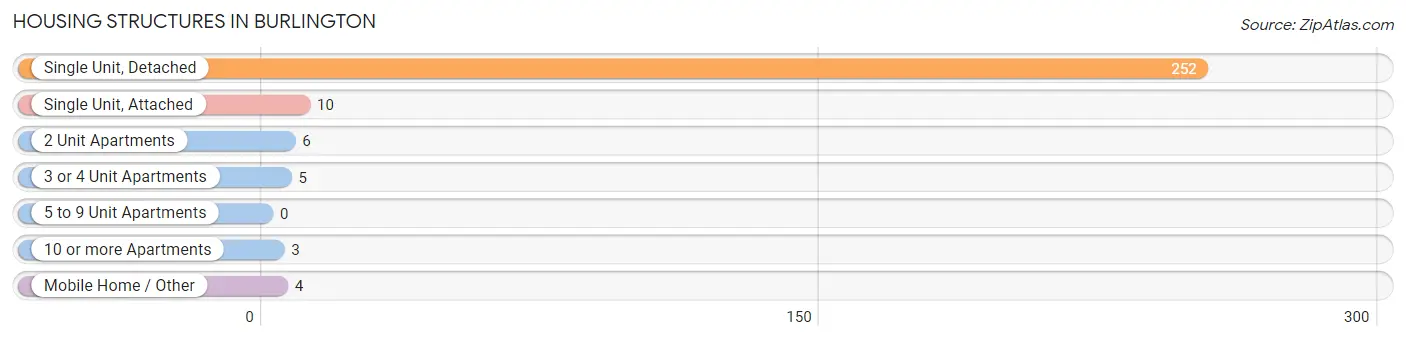
| Structure Type | # Housing Units | % Housing Units |
| Single Unit, Detached | 252 | 90.0% |
| Single Unit, Attached | 10 | 3.6% |
| 2 Unit Apartments | 6 | 2.1% |
| 3 or 4 Unit Apartments | 5 | 1.8% |
| 5 to 9 Unit Apartments | 0 | 0.0% |
| 10 or more Apartments | 3 | 1.1% |
| Mobile Home / Other | 4 | 1.4% |
| Total | 280 | 100.0% |
Housing Structures by Occupancy in Burlington
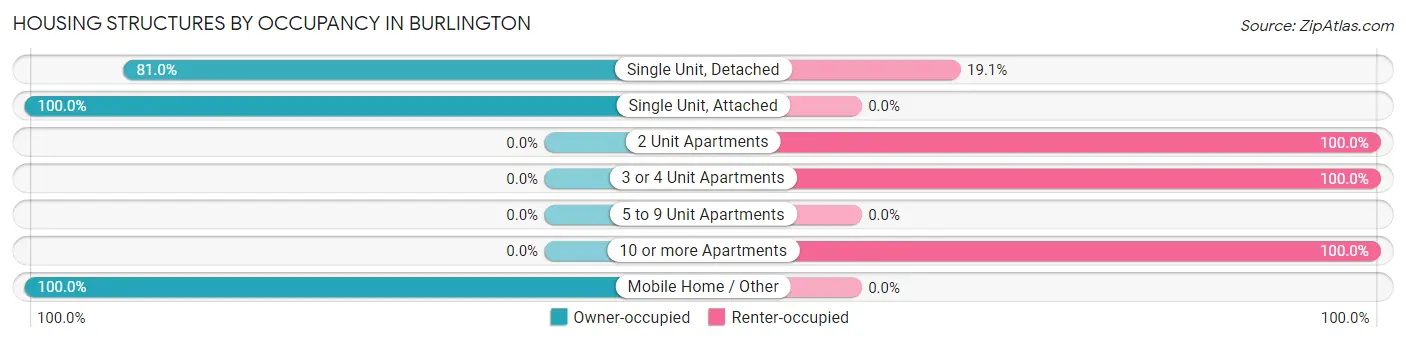
| Structure Type | Owner-occupied | Renter-occupied |
| Single Unit, Detached | 204 (80.9%) | 48 (19.1%) |
| Single Unit, Attached | 10 (100.0%) | 0 (0.0%) |
| 2 Unit Apartments | 0 (0.0%) | 6 (100.0%) |
| 3 or 4 Unit Apartments | 0 (0.0%) | 5 (100.0%) |
| 5 to 9 Unit Apartments | 0 (0.0%) | 0 (0.0%) |
| 10 or more Apartments | 0 (0.0%) | 3 (100.0%) |
| Mobile Home / Other | 4 (100.0%) | 0 (0.0%) |
| Total | 218 (77.9%) | 62 (22.1%) |
Housing Structures by Number of Rooms in Burlington
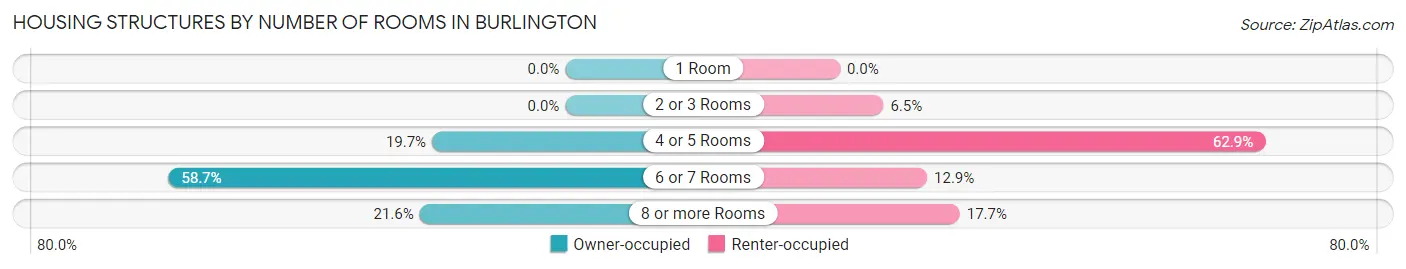
| Number of Rooms | Owner-occupied | Renter-occupied |
| 1 Room | 0 (0.0%) | 0 (0.0%) |
| 2 or 3 Rooms | 0 (0.0%) | 4 (6.5%) |
| 4 or 5 Rooms | 43 (19.7%) | 39 (62.9%) |
| 6 or 7 Rooms | 128 (58.7%) | 8 (12.9%) |
| 8 or more Rooms | 47 (21.6%) | 11 (17.7%) |
| Total | 218 (100.0%) | 62 (100.0%) |
Housing Structure by Heating Type in Burlington
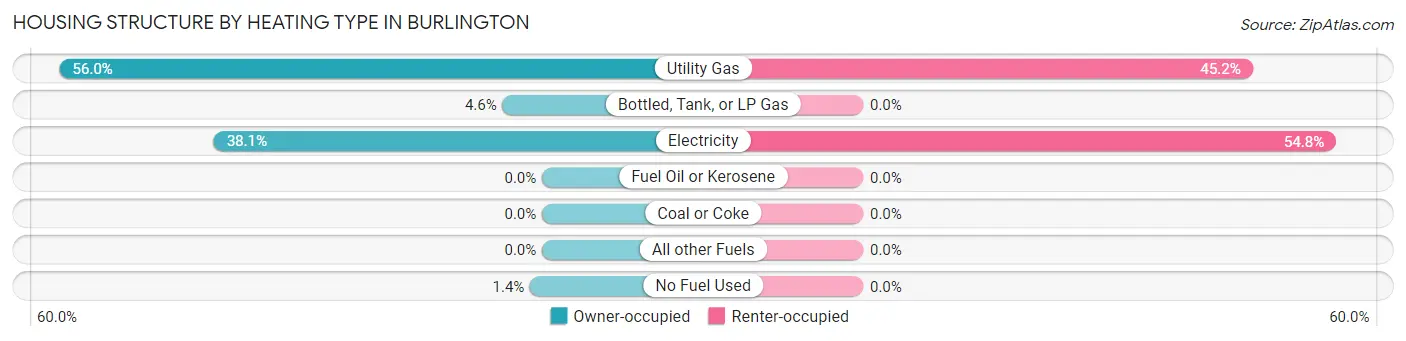
| Heating Type | Owner-occupied | Renter-occupied |
| Utility Gas | 122 (56.0%) | 28 (45.2%) |
| Bottled, Tank, or LP Gas | 10 (4.6%) | 0 (0.0%) |
| Electricity | 83 (38.1%) | 34 (54.8%) |
| Fuel Oil or Kerosene | 0 (0.0%) | 0 (0.0%) |
| Coal or Coke | 0 (0.0%) | 0 (0.0%) |
| All other Fuels | 0 (0.0%) | 0 (0.0%) |
| No Fuel Used | 3 (1.4%) | 0 (0.0%) |
| Total | 218 (100.0%) | 62 (100.0%) |
Household Vehicle Usage in Burlington
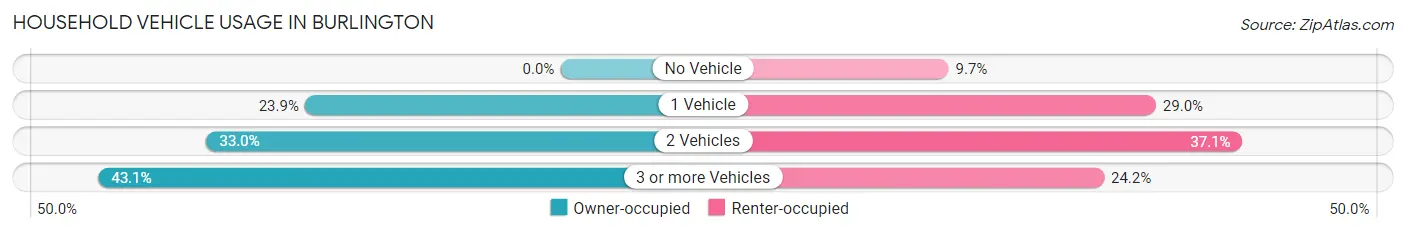
| Vehicles per Household | Owner-occupied | Renter-occupied |
| No Vehicle | 0 (0.0%) | 6 (9.7%) |
| 1 Vehicle | 52 (23.8%) | 18 (29.0%) |
| 2 Vehicles | 72 (33.0%) | 23 (37.1%) |
| 3 or more Vehicles | 94 (43.1%) | 15 (24.2%) |
| Total | 218 (100.0%) | 62 (100.0%) |
Real Estate & Mortgages in Burlington
Real Estate and Mortgage Overview in Burlington
| Characteristic | Without Mortgage | With Mortgage |
| Housing Units | 64 | 154 |
| Median Property Value | $110,000 | $129,700 |
| Median Household Income | $45,000 | $10 |
| Monthly Housing Costs | $373 | $0 |
| Real Estate Taxes | $600 | $4 |
Property Value by Mortgage Status in Burlington
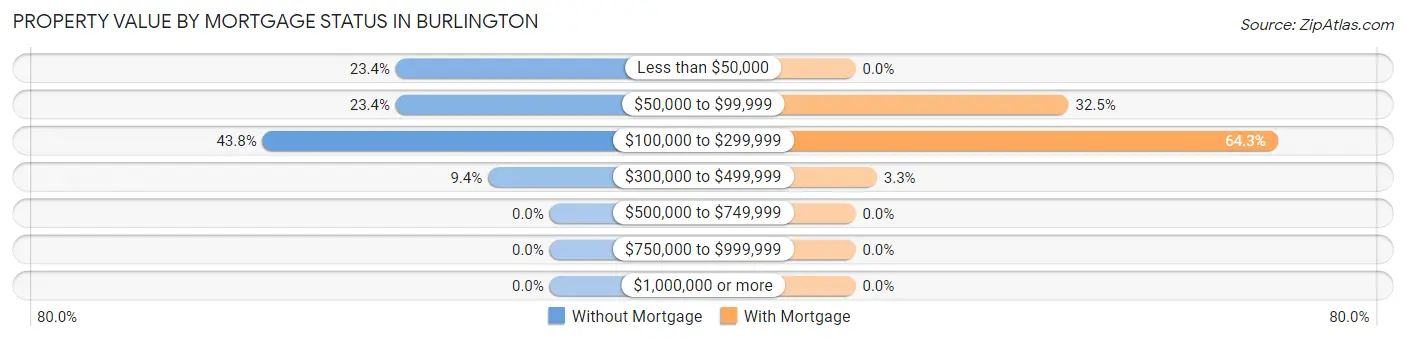
| Property Value | Without Mortgage | With Mortgage |
| Less than $50,000 | 15 (23.4%) | 0 (0.0%) |
| $50,000 to $99,999 | 15 (23.4%) | 50 (32.5%) |
| $100,000 to $299,999 | 28 (43.8%) | 99 (64.3%) |
| $300,000 to $499,999 | 6 (9.4%) | 5 (3.3%) |
| $500,000 to $749,999 | 0 (0.0%) | 0 (0.0%) |
| $750,000 to $999,999 | 0 (0.0%) | 0 (0.0%) |
| $1,000,000 or more | 0 (0.0%) | 0 (0.0%) |
| Total | 64 (100.0%) | 154 (100.0%) |
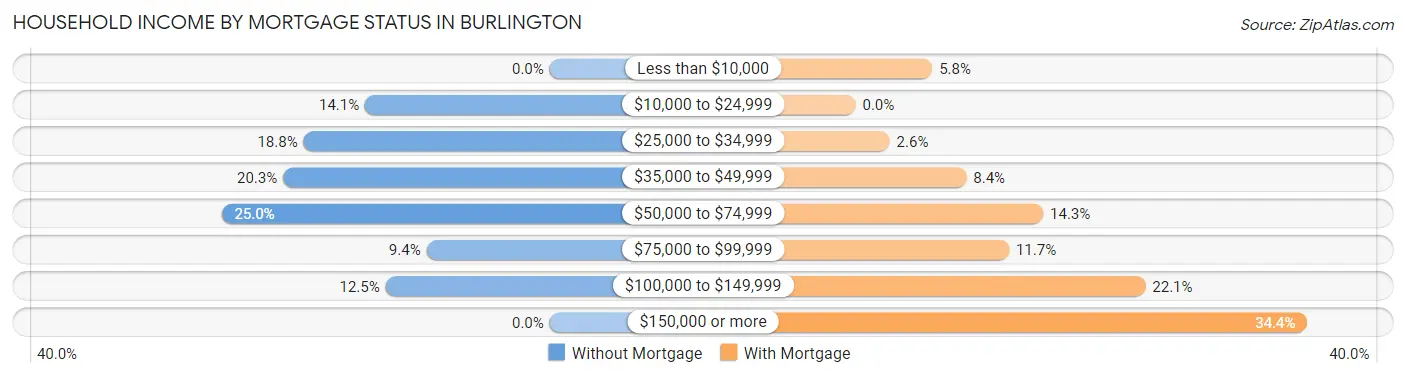
Household Income by Mortgage Status in Burlington
| Household Income | Without Mortgage | With Mortgage |
| Less than $10,000 | 0 (0.0%) | 9 (5.8%) |
| $10,000 to $24,999 | 9 (14.1%) | 0 (0.0%) |
| $25,000 to $34,999 | 12 (18.8%) | 4 (2.6%) |
| $35,000 to $49,999 | 13 (20.3%) | 13 (8.4%) |
| $50,000 to $74,999 | 16 (25.0%) | 22 (14.3%) |
| $75,000 to $99,999 | 6 (9.4%) | 18 (11.7%) |
| $100,000 to $149,999 | 8 (12.5%) | 34 (22.1%) |
| $150,000 or more | 0 (0.0%) | 53 (34.4%) |
| Total | 64 (100.0%) | 154 (100.0%) |
Property Value to Household Income Ratio in Burlington
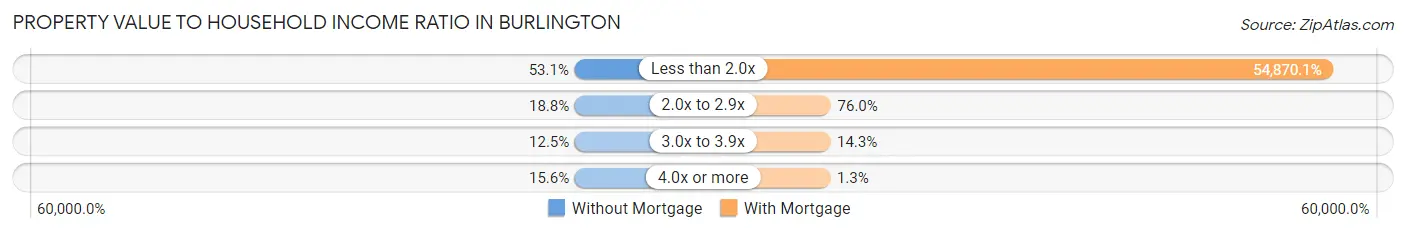
| Value-to-Income Ratio | Without Mortgage | With Mortgage |
| Less than 2.0x | 34 (53.1%) | 84,500 (54,870.1%) |
| 2.0x to 2.9x | 12 (18.8%) | 117 (76.0%) |
| 3.0x to 3.9x | 8 (12.5%) | 22 (14.3%) |
| 4.0x or more | 10 (15.6%) | 2 (1.3%) |
| Total | 64 (100.0%) | 154 (100.0%) |
Real Estate Taxes by Mortgage Status in Burlington
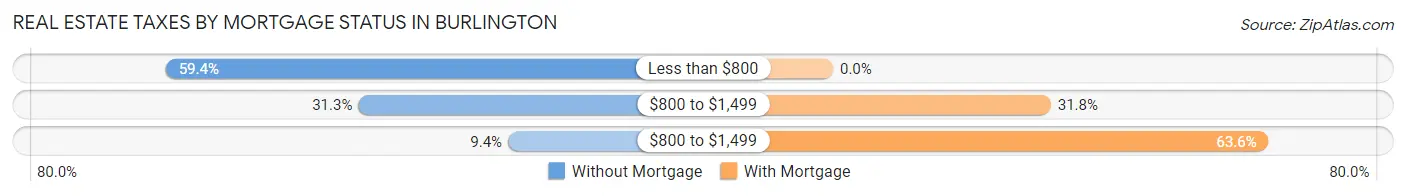
| Property Taxes | Without Mortgage | With Mortgage |
| Less than $800 | 38 (59.4%) | 0 (0.0%) |
| $800 to $1,499 | 20 (31.2%) | 49 (31.8%) |
| $800 to $1,499 | 6 (9.4%) | 98 (63.6%) |
| Total | 64 (100.0%) | 154 (100.0%) |
Health & Disability in Burlington
Health Insurance Coverage by Age in Burlington
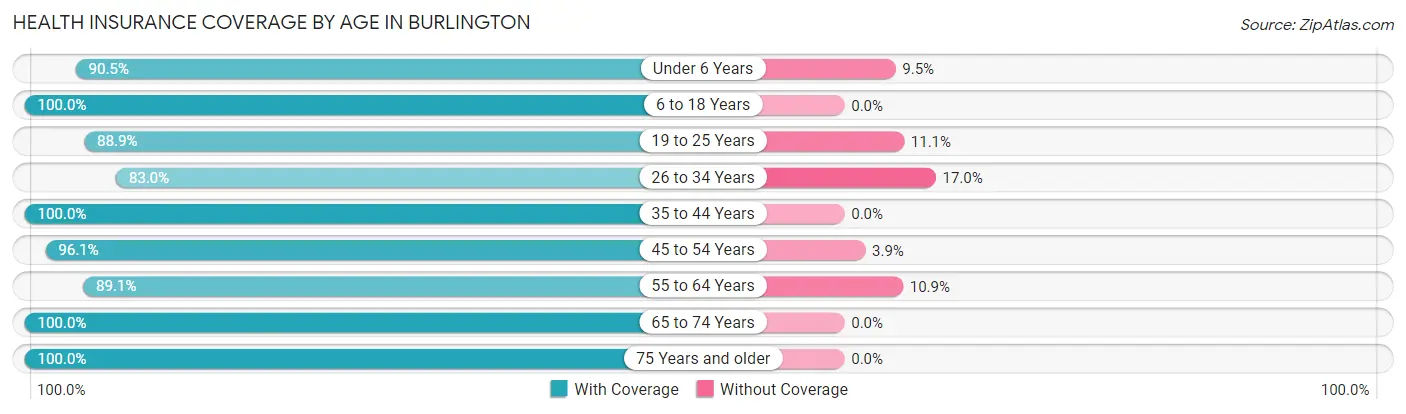
| Age Bracket | With Coverage | Without Coverage |
| Under 6 Years | 19 (90.5%) | 2 (9.5%) |
| 6 to 18 Years | 127 (100.0%) | 0 (0.0%) |
| 19 to 25 Years | 48 (88.9%) | 6 (11.1%) |
| 26 to 34 Years | 39 (83.0%) | 8 (17.0%) |
| 35 to 44 Years | 107 (100.0%) | 0 (0.0%) |
| 45 to 54 Years | 99 (96.1%) | 4 (3.9%) |
| 55 to 64 Years | 49 (89.1%) | 6 (10.9%) |
| 65 to 74 Years | 67 (100.0%) | 0 (0.0%) |
| 75 Years and older | 52 (100.0%) | 0 (0.0%) |
| Total | 607 (95.9%) | 26 (4.1%) |
Health Insurance Coverage by Citizenship Status in Burlington
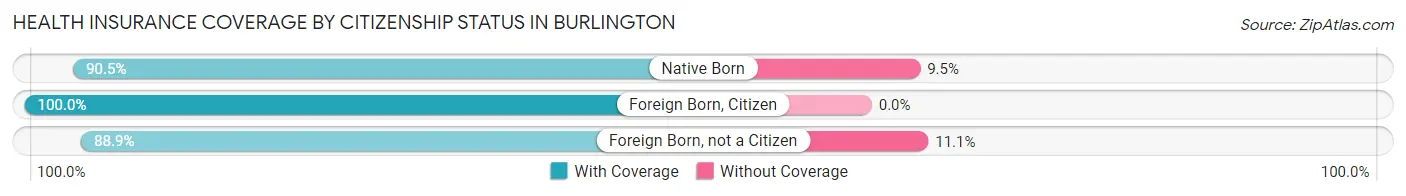
| Citizenship Status | With Coverage | Without Coverage |
| Native Born | 19 (90.5%) | 2 (9.5%) |
| Foreign Born, Citizen | 127 (100.0%) | 0 (0.0%) |
| Foreign Born, not a Citizen | 48 (88.9%) | 6 (11.1%) |
Health Insurance Coverage by Household Income in Burlington
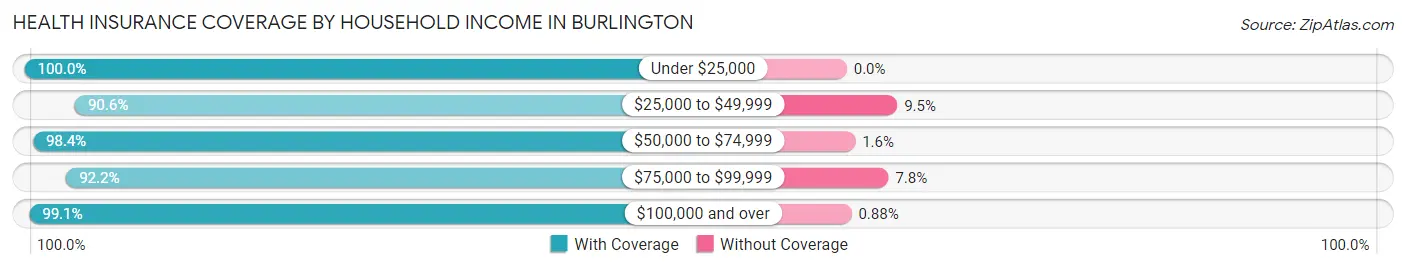
| Household Income | With Coverage | Without Coverage |
| Under $25,000 | 23 (100.0%) | 0 (0.0%) |
| $25,000 to $49,999 | 115 (90.5%) | 12 (9.5%) |
| $50,000 to $74,999 | 125 (98.4%) | 2 (1.6%) |
| $75,000 to $99,999 | 118 (92.2%) | 10 (7.8%) |
| $100,000 and over | 226 (99.1%) | 2 (0.9%) |
Public vs Private Health Insurance Coverage by Age in Burlington
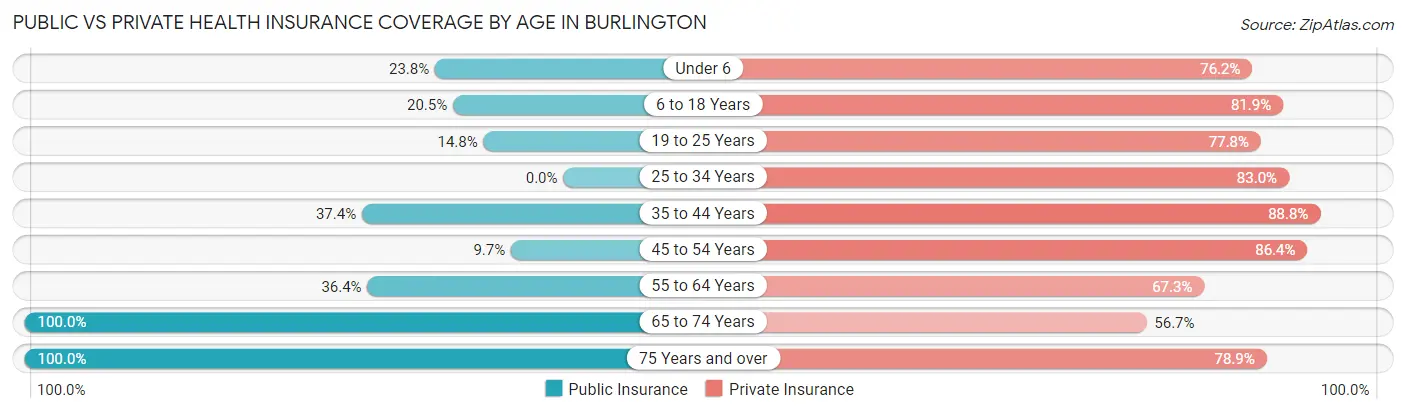
| Age Bracket | Public Insurance | Private Insurance |
| Under 6 | 5 (23.8%) | 16 (76.2%) |
| 6 to 18 Years | 26 (20.5%) | 104 (81.9%) |
| 19 to 25 Years | 8 (14.8%) | 42 (77.8%) |
| 25 to 34 Years | 0 (0.0%) | 39 (83.0%) |
| 35 to 44 Years | 40 (37.4%) | 95 (88.8%) |
| 45 to 54 Years | 10 (9.7%) | 89 (86.4%) |
| 55 to 64 Years | 20 (36.4%) | 37 (67.3%) |
| 65 to 74 Years | 67 (100.0%) | 38 (56.7%) |
| 75 Years and over | 52 (100.0%) | 41 (78.8%) |
| Total | 228 (36.0%) | 501 (79.1%) |
Disability Status by Sex by Age in Burlington
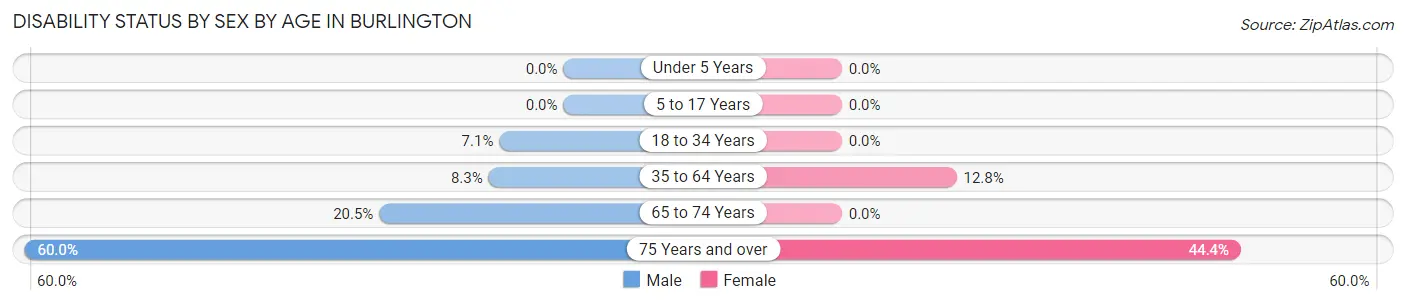
| Age Bracket | Male | Female |
| Under 5 Years | 0 (0.0%) | 0 (0.0%) |
| 5 to 17 Years | 0 (0.0%) | 0 (0.0%) |
| 18 to 34 Years | 5 (7.1%) | 0 (0.0%) |
| 35 to 64 Years | 11 (8.3%) | 17 (12.8%) |
| 65 to 74 Years | 8 (20.5%) | 0 (0.0%) |
| 75 Years and over | 15 (60.0%) | 12 (44.4%) |
Disability Class by Sex by Age in Burlington
Disability Class: Hearing Difficulty
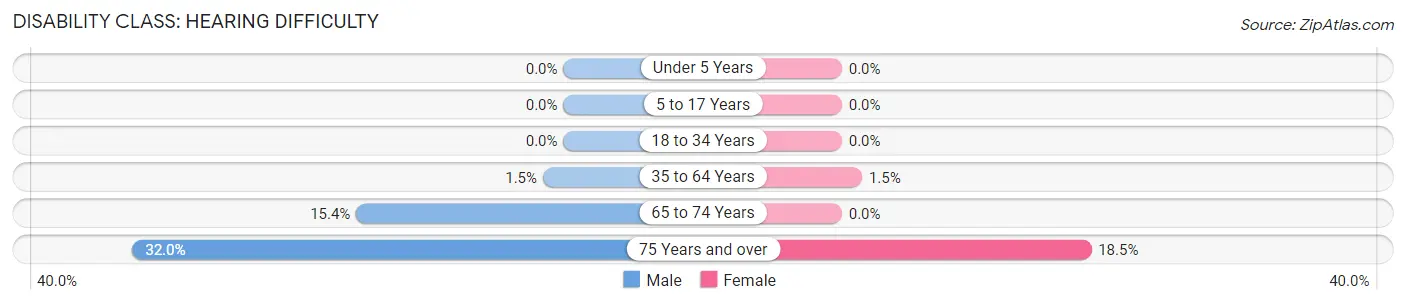
| Age Bracket | Male | Female |
| Under 5 Years | 0 (0.0%) | 0 (0.0%) |
| 5 to 17 Years | 0 (0.0%) | 0 (0.0%) |
| 18 to 34 Years | 0 (0.0%) | 0 (0.0%) |
| 35 to 64 Years | 2 (1.5%) | 2 (1.5%) |
| 65 to 74 Years | 6 (15.4%) | 0 (0.0%) |
| 75 Years and over | 8 (32.0%) | 5 (18.5%) |
Disability Class: Vision Difficulty
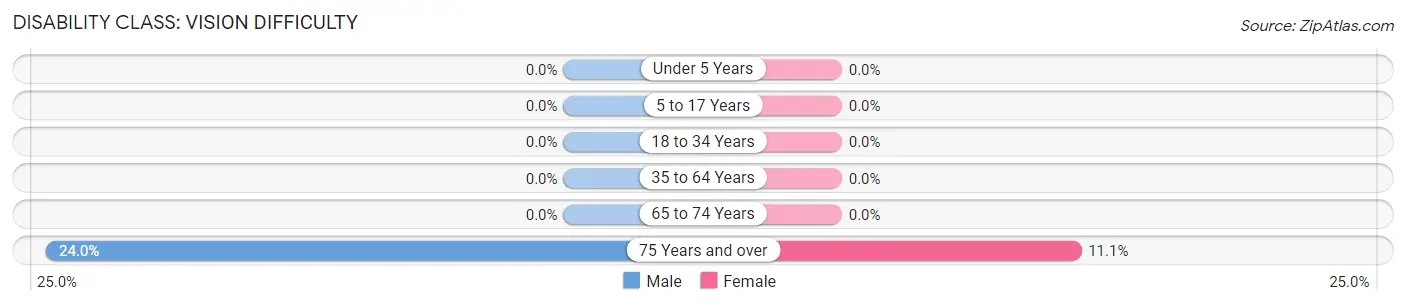
| Age Bracket | Male | Female |
| Under 5 Years | 0 (0.0%) | 0 (0.0%) |
| 5 to 17 Years | 0 (0.0%) | 0 (0.0%) |
| 18 to 34 Years | 0 (0.0%) | 0 (0.0%) |
| 35 to 64 Years | 0 (0.0%) | 0 (0.0%) |
| 65 to 74 Years | 0 (0.0%) | 0 (0.0%) |
| 75 Years and over | 6 (24.0%) | 3 (11.1%) |
Disability Class: Cognitive Difficulty
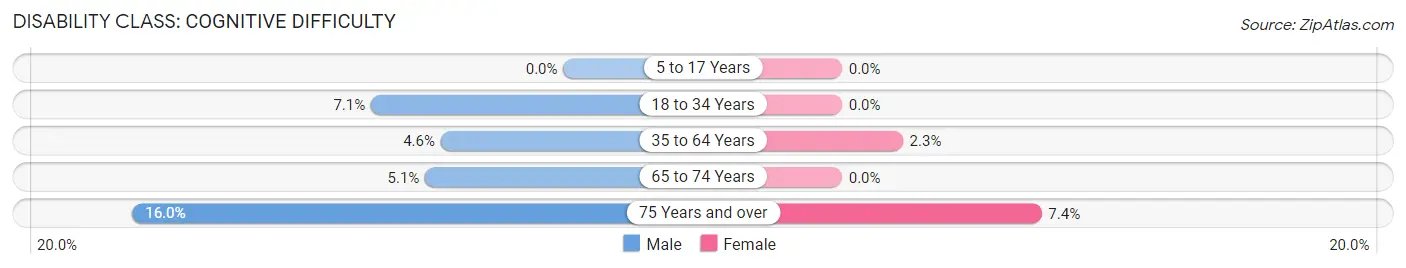
| Age Bracket | Male | Female |
| 5 to 17 Years | 0 (0.0%) | 0 (0.0%) |
| 18 to 34 Years | 5 (7.1%) | 0 (0.0%) |
| 35 to 64 Years | 6 (4.5%) | 3 (2.3%) |
| 65 to 74 Years | 2 (5.1%) | 0 (0.0%) |
| 75 Years and over | 4 (16.0%) | 2 (7.4%) |
Disability Class: Ambulatory Difficulty
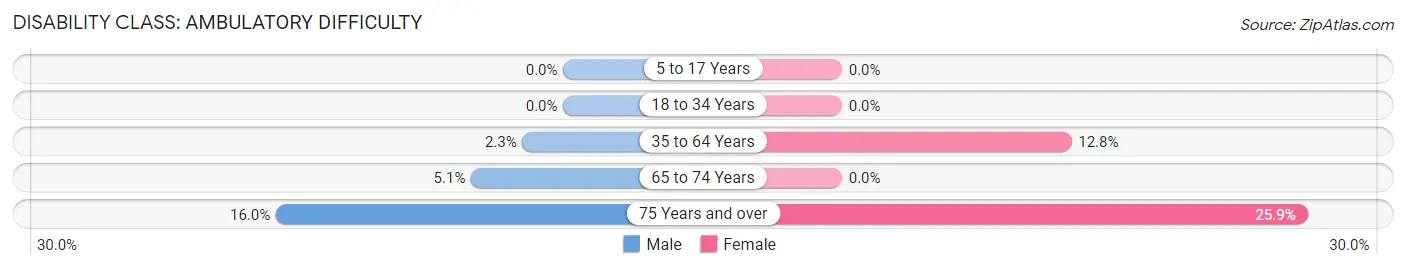
| Age Bracket | Male | Female |
| 5 to 17 Years | 0 (0.0%) | 0 (0.0%) |
| 18 to 34 Years | 0 (0.0%) | 0 (0.0%) |
| 35 to 64 Years | 3 (2.3%) | 17 (12.8%) |
| 65 to 74 Years | 2 (5.1%) | 0 (0.0%) |
| 75 Years and over | 4 (16.0%) | 7 (25.9%) |
Disability Class: Self-Care Difficulty
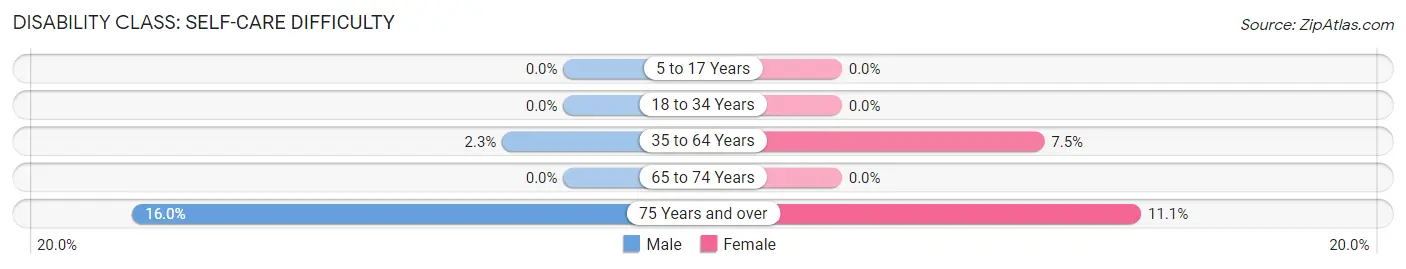
| Age Bracket | Male | Female |
| 5 to 17 Years | 0 (0.0%) | 0 (0.0%) |
| 18 to 34 Years | 0 (0.0%) | 0 (0.0%) |
| 35 to 64 Years | 3 (2.3%) | 10 (7.5%) |
| 65 to 74 Years | 0 (0.0%) | 0 (0.0%) |
| 75 Years and over | 4 (16.0%) | 3 (11.1%) |
Technology Access in Burlington
Computing Device Access in Burlington
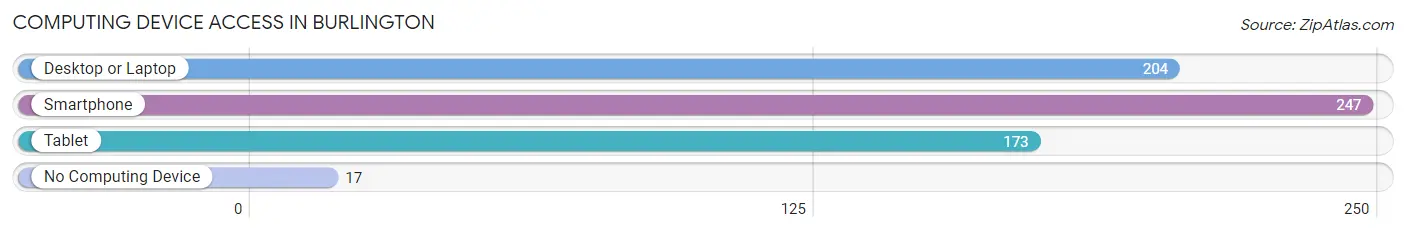
| Device Type | # Households | % Households |
| Desktop or Laptop | 204 | 72.9% |
| Smartphone | 247 | 88.2% |
| Tablet | 173 | 61.8% |
| No Computing Device | 17 | 6.1% |
| Total | 280 | 100.0% |
Internet Access in Burlington
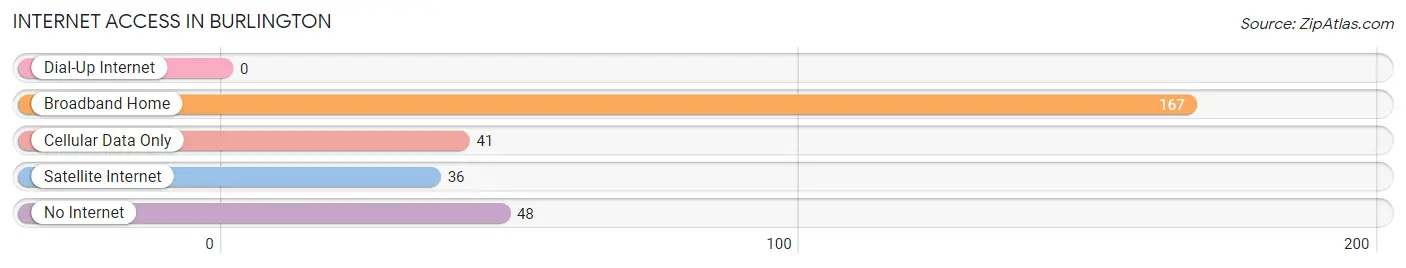
| Internet Type | # Households | % Households |
| Dial-Up Internet | 0 | 0.0% |
| Broadband Home | 167 | 59.6% |
| Cellular Data Only | 41 | 14.6% |
| Satellite Internet | 36 | 12.9% |
| No Internet | 48 | 17.1% |
| Total | 280 | 100.0% |
Burlington Summary
Burlington, Indiana is a small town located in Franklin County, Indiana. It is situated on the banks of the Whitewater River and is part of the Cincinnati metropolitan area. The town has a population of approximately 1,500 people and is known for its rural charm and small-town atmosphere.
History
Burlington was founded in 1818 by a group of settlers from North Carolina. The town was named after the nearby Burlington Creek, which was named after the town of Burlington, North Carolina. The town was originally a farming community, but it soon developed into a small industrial center. The first industry in the town was a sawmill, which was built in 1820. The town also had a gristmill, a tannery, and a woolen mill.
In 1851, the town was incorporated and the first mayor was elected. The town continued to grow and by the late 19th century, it had become a major center for the production of furniture. The town also had a number of other industries, including a brickyard, a canning factory, and a flour mill.
Geography
Burlington is located in the southeastern part of Franklin County, Indiana. It is situated on the banks of the Whitewater River and is part of the Cincinnati metropolitan area. The town is located approximately 30 miles east of Indianapolis and is bordered by the towns of Brookville, Metamora, and Laurel.
The town has a total area of 1.2 square miles, all of which is land. The town is located in a hilly region and is surrounded by forests and farmland. The town has a humid continental climate, with hot summers and cold winters.
Economy
The economy of Burlington is largely based on agriculture and manufacturing. The town is home to a number of small businesses, including a furniture factory, a canning factory, and a flour mill. The town also has a number of retail stores, restaurants, and other services.
The town is also home to a number of tourist attractions, including the Whitewater Valley Railroad, the Whitewater Canal State Historic Site, and the Burlington Antique Mall. The town is also home to a number of festivals, including the Burlington Fall Festival and the Burlington Summer Festival.
Demographics
As of the 2010 census, the population of Burlington was 1,500. The town has a median household income of $37,500 and a median family income of $45,000. The town has a population that is predominantly white (95.2%) and has a small Hispanic population (2.2%). The town also has a small African American population (1.2%).
The town has a high rate of homeownership (77.2%) and a low rate of poverty (7.2%). The town also has a high rate of educational attainment, with 92.2% of the population having at least a high school diploma and 28.2% having a bachelor's degree or higher.
Common Questions
What is Per Capita Income in Burlington?
Per Capita income in Burlington is $33,343.
What is the Median Family Income in Burlington?
Median Family Income in Burlington is $97,639.
What is the Median Household income in Burlington?
Median Household Income in Burlington is $66,111.
What is Income or Wage Gap in Burlington?
Income or Wage Gap in Burlington is 14.1%.
Women in Burlington earn 85.9 cents for every dollar earned by a man.
What is Inequality or Gini Index in Burlington?
Inequality or Gini Index in Burlington is 0.33.
What is the Total Population of Burlington?
Total Population of Burlington is 633.
What is the Total Male Population of Burlington?
Total Male Population of Burlington is 329.
What is the Total Female Population of Burlington?
Total Female Population of Burlington is 304.
What is the Ratio of Males per 100 Females in Burlington?
There are 108.22 Males per 100 Females in Burlington.
What is the Ratio of Females per 100 Males in Burlington?
There are 92.40 Females per 100 Males in Burlington.
What is the Median Population Age in Burlington?
Median Population Age in Burlington is 43.3 Years.
What is the Average Family Size in Burlington
Average Family Size in Burlington is 2.9 People.
What is the Average Household Size in Burlington
Average Household Size in Burlington is 2.3 People.
How Large is the Labor Force in Burlington?
There are 326 People in the Labor Forcein in Burlington.
What is the Percentage of People in the Labor Force in Burlington?
64.8% of People are in the Labor Force in Burlington.
What is the Unemployment Rate in Burlington?
Unemployment Rate in Burlington is 3.7%.