Clinton, IN Map & Demographics
Clinton Map
Clinton Overview
$24,386
PER CAPITA INCOME
$56,339
AVG FAMILY INCOME
$42,092
AVG HOUSEHOLD INCOME
33.1%
WAGE / INCOME GAP [ % ]
66.9¢/ $1
WAGE / INCOME GAP [ $ ]
0.42
INEQUALITY / GINI INDEX
4,821
TOTAL POPULATION
2,392
MALE POPULATION
2,429
FEMALE POPULATION
98.48
MALES / 100 FEMALES
101.55
FEMALES / 100 MALES
41.1
MEDIAN AGE
2.6
AVG FAMILY SIZE
2.2
AVG HOUSEHOLD SIZE
2,343
LABOR FORCE [ PEOPLE ]
59.5%
PERCENT IN LABOR FORCE
13.1%
UNEMPLOYMENT RATE
Clinton Zip Codes
Clinton Area Codes
Income in Clinton
Income Overview in Clinton
Per Capita Income in Clinton is $24,386, while median incomes of families and households are $56,339 and $42,092 respectively.
| Characteristic | Number | Measure |
| Per Capita Income | 4,821 | $24,386 |
| Median Family Income | 1,421 | $56,339 |
| Mean Family Income | 1,421 | $65,791 |
| Median Household Income | 2,060 | $42,092 |
| Mean Household Income | 2,060 | $56,626 |
| Income Deficit | 1,421 | $0 |
| Wage / Income Gap (%) | 4,821 | 33.10% |
| Wage / Income Gap ($) | 4,821 | 66.90¢ per $1 |
| Gini / Inequality Index | 4,821 | 0.42 |
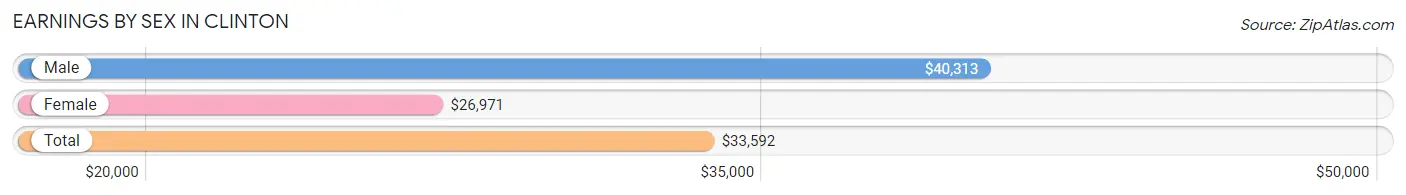
Earnings by Sex in Clinton
Average Earnings in Clinton are $33,592, $40,313 for men and $26,971 for women, a difference of 33.1%.
| Sex | Number | Average Earnings |
| Male | 1,245 (52.9%) | $40,313 |
| Female | 1,107 (47.1%) | $26,971 |
| Total | 2,352 (100.0%) | $33,592 |
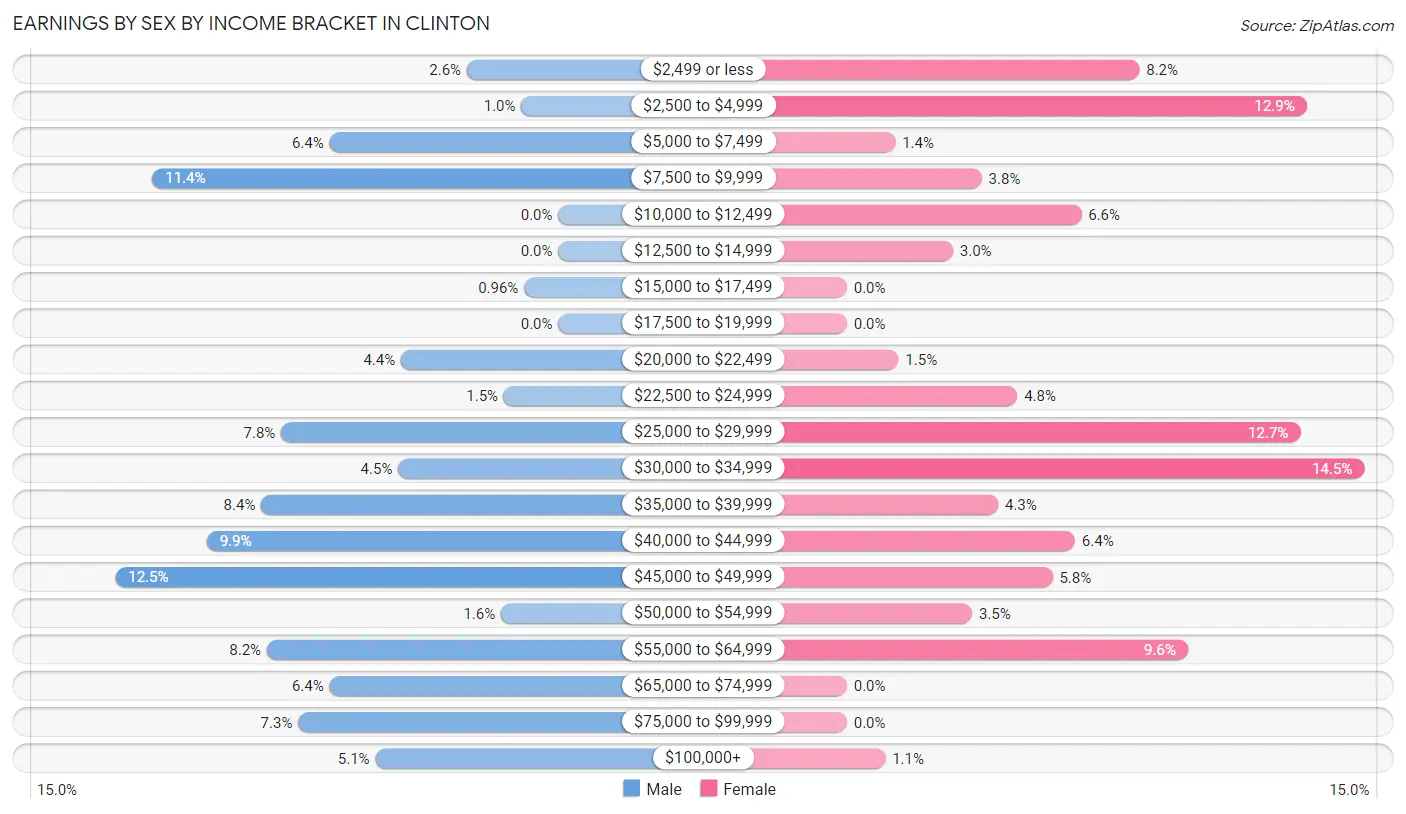
Earnings by Sex by Income Bracket in Clinton
The most common earnings brackets in Clinton are $45,000 to $49,999 for men (155 | 12.4%) and $30,000 to $34,999 for women (161 | 14.5%).
| Income | Male | Female |
| $2,499 or less | 32 (2.6%) | 91 (8.2%) |
| $2,500 to $4,999 | 13 (1.0%) | 143 (12.9%) |
| $5,000 to $7,499 | 80 (6.4%) | 15 (1.4%) |
| $7,500 to $9,999 | 142 (11.4%) | 42 (3.8%) |
| $10,000 to $12,499 | 0 (0.0%) | 73 (6.6%) |
| $12,500 to $14,999 | 0 (0.0%) | 33 (3.0%) |
| $15,000 to $17,499 | 12 (1.0%) | 0 (0.0%) |
| $17,500 to $19,999 | 0 (0.0%) | 0 (0.0%) |
| $20,000 to $22,499 | 55 (4.4%) | 16 (1.5%) |
| $22,500 to $24,999 | 19 (1.5%) | 53 (4.8%) |
| $25,000 to $29,999 | 97 (7.8%) | 141 (12.7%) |
| $30,000 to $34,999 | 56 (4.5%) | 161 (14.5%) |
| $35,000 to $39,999 | 104 (8.4%) | 47 (4.3%) |
| $40,000 to $44,999 | 123 (9.9%) | 71 (6.4%) |
| $45,000 to $49,999 | 155 (12.4%) | 64 (5.8%) |
| $50,000 to $54,999 | 20 (1.6%) | 39 (3.5%) |
| $55,000 to $64,999 | 102 (8.2%) | 106 (9.6%) |
| $65,000 to $74,999 | 80 (6.4%) | 0 (0.0%) |
| $75,000 to $99,999 | 91 (7.3%) | 0 (0.0%) |
| $100,000+ | 64 (5.1%) | 12 (1.1%) |
| Total | 1,245 (100.0%) | 1,107 (100.0%) |
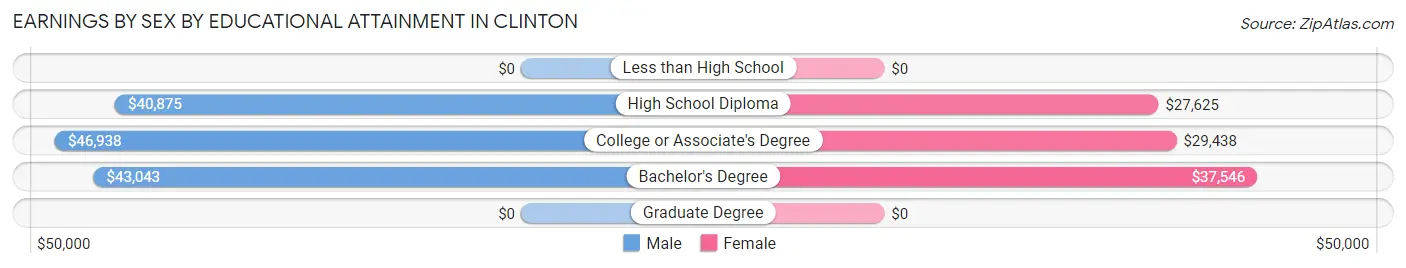
Earnings by Sex by Educational Attainment in Clinton
Average earnings in Clinton are $45,161 for men and $32,643 for women, a difference of 27.7%. Men with an educational attainment of college or associate's degree enjoy the highest average annual earnings of $46,938, while those with high school diploma education earn the least with $40,875. Women with an educational attainment of bachelor's degree earn the most with the average annual earnings of $37,546, while those with high school diploma education have the smallest earnings of $27,625.
| Educational Attainment | Male Income | Female Income |
| Less than High School | - | - |
| High School Diploma | $40,875 | $27,625 |
| College or Associate's Degree | $46,938 | $29,438 |
| Bachelor's Degree | $43,043 | $37,546 |
| Graduate Degree | - | - |
| Total | $45,161 | $32,643 |
Family Income in Clinton
Family Income Brackets in Clinton
According to the Clinton family income data, there are 286 families falling into the $100,000 to $149,999 income range, which is the most common income bracket and makes up 20.1% of all families. Conversely, the $150,000 to $199,999 income bracket is the least frequent group with only 34 families (2.4%) belonging to this category.
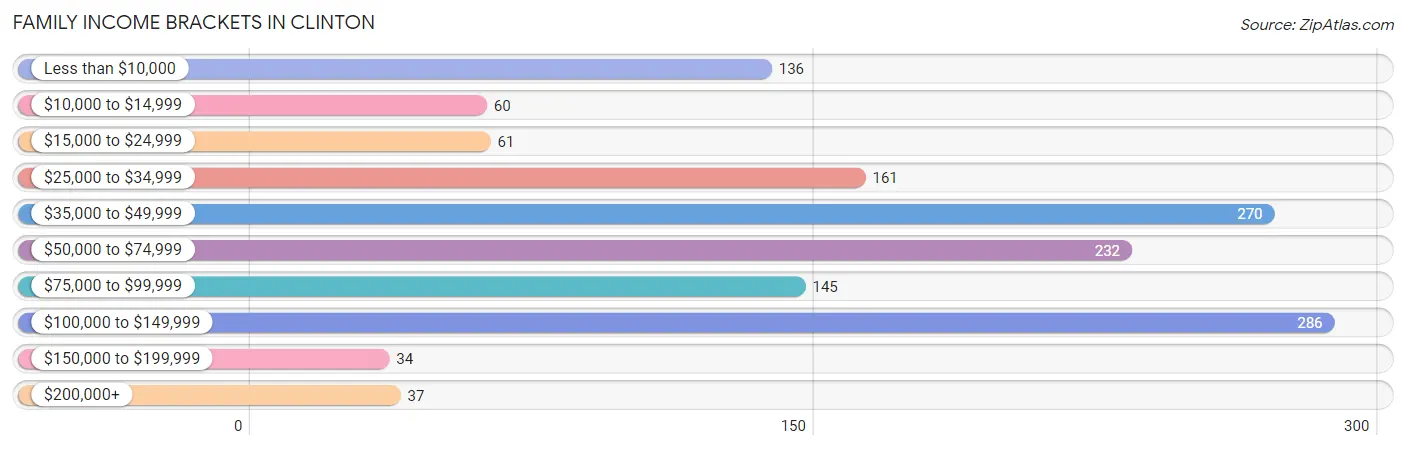
| Income Bracket | # Families | % Families |
| Less than $10,000 | 136 | 9.6% |
| $10,000 to $14,999 | 60 | 4.2% |
| $15,000 to $24,999 | 61 | 4.3% |
| $25,000 to $34,999 | 161 | 11.3% |
| $35,000 to $49,999 | 270 | 19.0% |
| $50,000 to $74,999 | 232 | 16.3% |
| $75,000 to $99,999 | 145 | 10.2% |
| $100,000 to $149,999 | 286 | 20.1% |
| $150,000 to $199,999 | 34 | 2.4% |
| $200,000+ | 37 | 2.6% |
Family Income by Famaliy Size in Clinton
5-person families (103 | 7.2%) account for the highest median family income in Clinton with $123,750 per family, while 2-person families (823 | 57.9%) have the highest median income of $28,200 per family member.
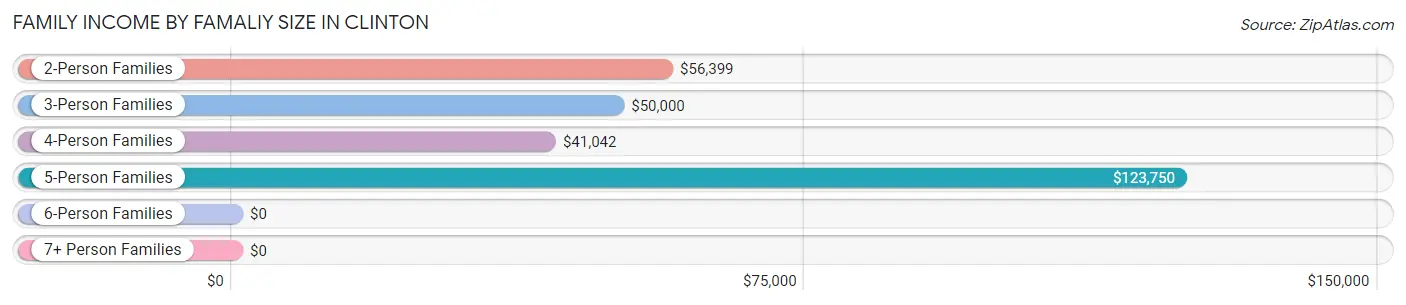
| Income Bracket | # Families | Median Income |
| 2-Person Families | 823 (57.9%) | $56,399 |
| 3-Person Families | 278 (19.6%) | $50,000 |
| 4-Person Families | 176 (12.4%) | $41,042 |
| 5-Person Families | 103 (7.2%) | $123,750 |
| 6-Person Families | 0 (0.0%) | $0 |
| 7+ Person Families | 41 (2.9%) | $0 |
| Total | 1,421 (100.0%) | $56,339 |
Family Income by Number of Earners in Clinton
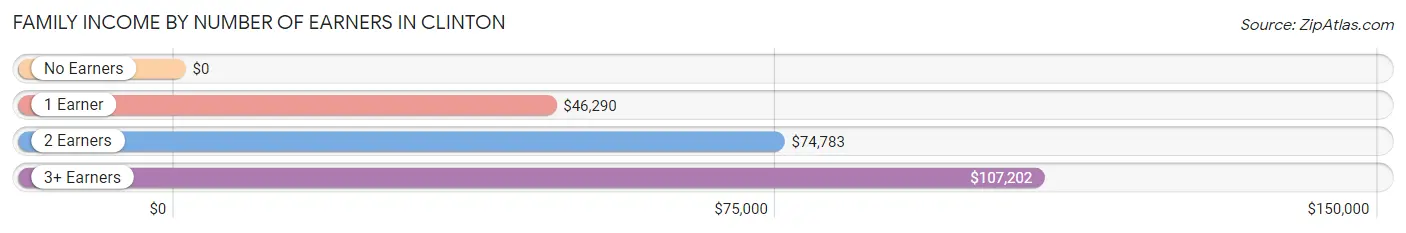
| Number of Earners | # Families | Median Income |
| No Earners | 250 (17.6%) | $0 |
| 1 Earner | 610 (42.9%) | $46,290 |
| 2 Earners | 450 (31.7%) | $74,783 |
| 3+ Earners | 111 (7.8%) | $107,202 |
| Total | 1,421 (100.0%) | $56,339 |
Household Income in Clinton
Household Income Brackets in Clinton
With 457 households falling in the category, the $35,000 to $49,999 income range is the most frequent in Clinton, accounting for 22.2% of all households. In contrast, only 16 households (0.8%) fall into the $150,000 to $199,999 income bracket, making it the least populous group.
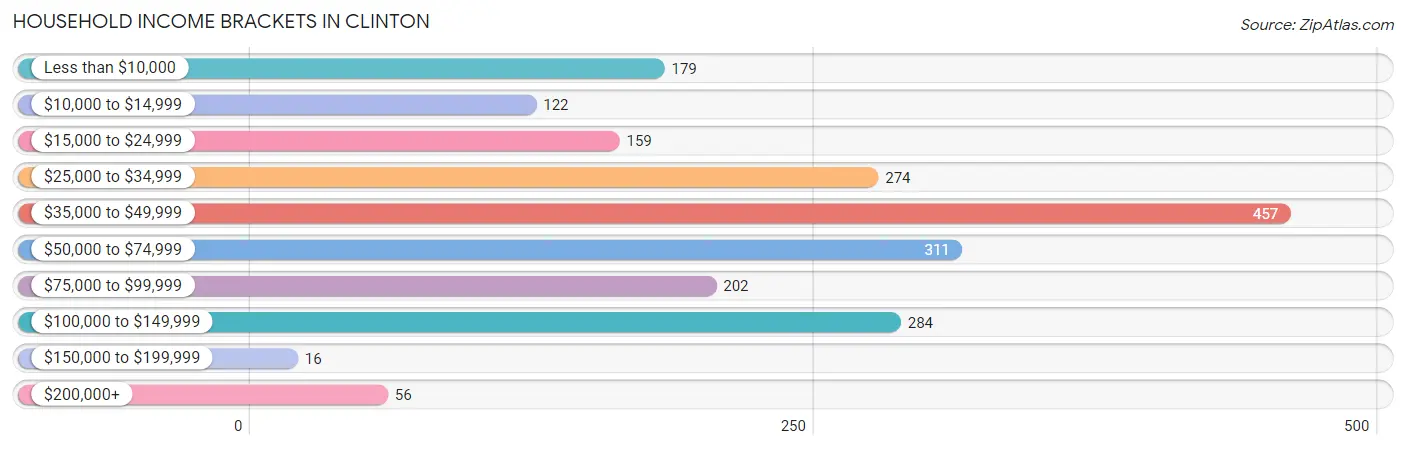
| Income Bracket | # Households | % Households |
| Less than $10,000 | 179 | 8.7% |
| $10,000 to $14,999 | 122 | 5.9% |
| $15,000 to $24,999 | 159 | 7.7% |
| $25,000 to $34,999 | 274 | 13.3% |
| $35,000 to $49,999 | 457 | 22.2% |
| $50,000 to $74,999 | 311 | 15.1% |
| $75,000 to $99,999 | 202 | 9.8% |
| $100,000 to $149,999 | 284 | 13.8% |
| $150,000 to $199,999 | 16 | 0.8% |
| $200,000+ | 56 | 2.7% |
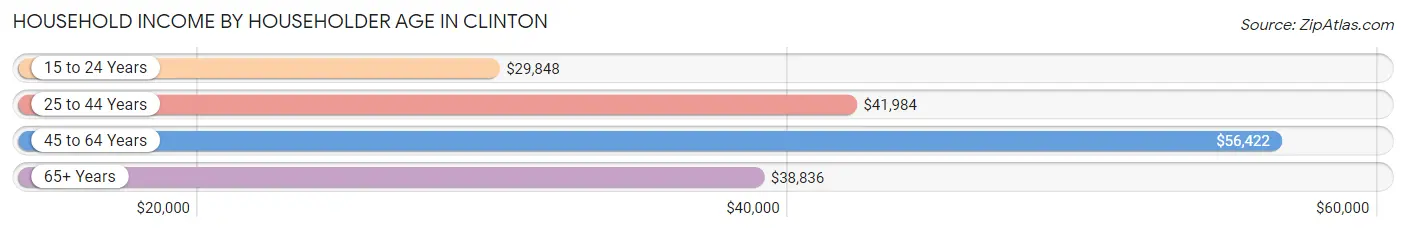
Household Income by Householder Age in Clinton
The median household income in Clinton is $42,092, with the highest median household income of $56,422 found in the 45 to 64 years age bracket for the primary householder. A total of 648 households (31.5%) fall into this category. Meanwhile, the 15 to 24 years age bracket for the primary householder has the lowest median household income of $29,848, with 178 households (8.6%) in this group.
| Income Bracket | # Households | Median Income |
| 15 to 24 Years | 178 (8.6%) | $29,848 |
| 25 to 44 Years | 599 (29.1%) | $41,984 |
| 45 to 64 Years | 648 (31.5%) | $56,422 |
| 65+ Years | 635 (30.8%) | $38,836 |
| Total | 2,060 (100.0%) | $42,092 |
Poverty in Clinton
Income Below Poverty by Sex and Age in Clinton
With 22.2% poverty level for males and 22.5% for females among the residents of Clinton, 12 to 14 year old males and 18 to 24 year old females are the most vulnerable to poverty, with 51 males (91.1%) and 73 females (51.0%) in their respective age groups living below the poverty level.
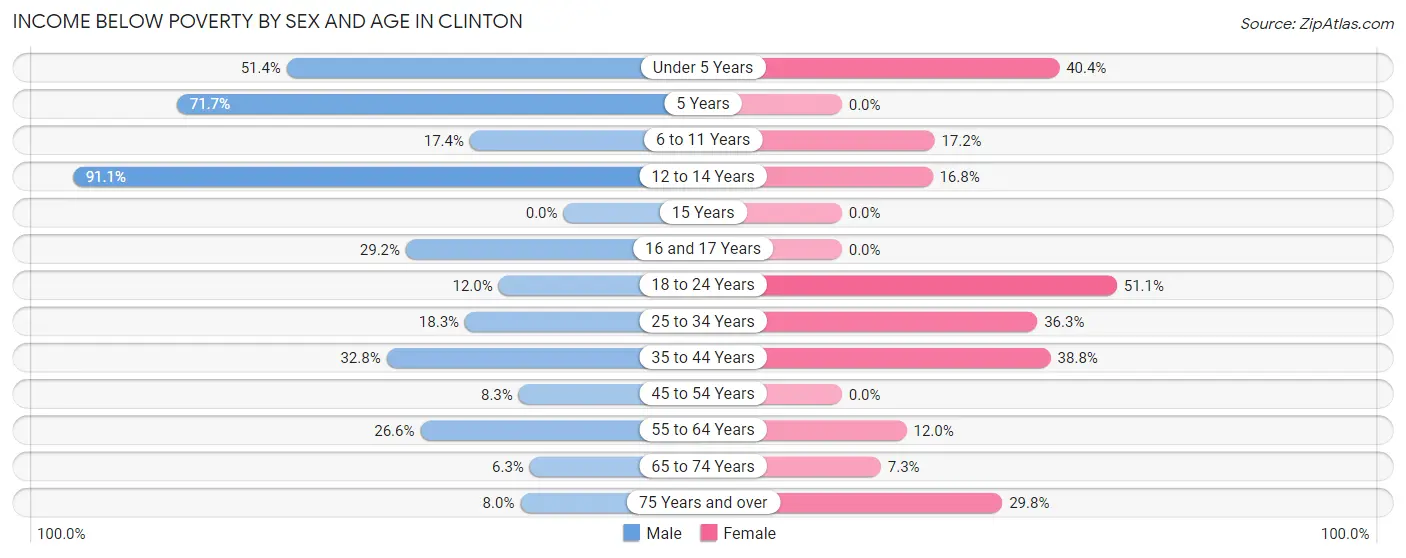
| Age Bracket | Male | Female |
| Under 5 Years | 76 (51.3%) | 46 (40.4%) |
| 5 Years | 33 (71.7%) | 0 (0.0%) |
| 6 to 11 Years | 33 (17.4%) | 32 (17.2%) |
| 12 to 14 Years | 51 (91.1%) | 17 (16.8%) |
| 15 Years | 0 (0.0%) | 0 (0.0%) |
| 16 and 17 Years | 19 (29.2%) | 0 (0.0%) |
| 18 to 24 Years | 32 (12.0%) | 73 (51.0%) |
| 25 to 34 Years | 55 (18.3%) | 123 (36.3%) |
| 35 to 44 Years | 87 (32.8%) | 107 (38.8%) |
| 45 to 54 Years | 24 (8.3%) | 0 (0.0%) |
| 55 to 64 Years | 73 (26.6%) | 41 (12.0%) |
| 65 to 74 Years | 16 (6.2%) | 25 (7.2%) |
| 75 Years and over | 12 (8.0%) | 53 (29.8%) |
| Total | 511 (22.2%) | 517 (22.5%) |
Income Above Poverty by Sex and Age in Clinton
According to the poverty statistics in Clinton, males aged 65 to 74 years and females aged 5 years are the age groups that are most secure financially, with 93.8% of males and 100.0% of females in these age groups living above the poverty line.
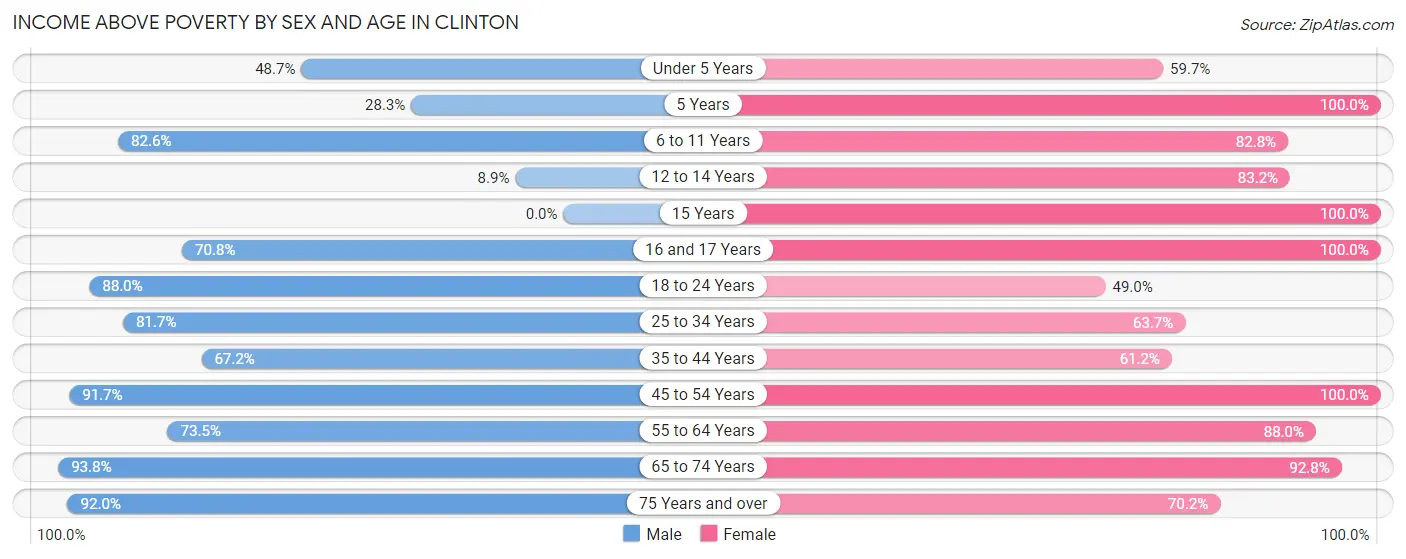
| Age Bracket | Male | Female |
| Under 5 Years | 72 (48.6%) | 68 (59.7%) |
| 5 Years | 13 (28.3%) | 15 (100.0%) |
| 6 to 11 Years | 157 (82.6%) | 154 (82.8%) |
| 12 to 14 Years | 5 (8.9%) | 84 (83.2%) |
| 15 Years | 0 (0.0%) | 14 (100.0%) |
| 16 and 17 Years | 46 (70.8%) | 78 (100.0%) |
| 18 to 24 Years | 234 (88.0%) | 70 (48.9%) |
| 25 to 34 Years | 246 (81.7%) | 216 (63.7%) |
| 35 to 44 Years | 178 (67.2%) | 169 (61.2%) |
| 45 to 54 Years | 265 (91.7%) | 170 (100.0%) |
| 55 to 64 Years | 202 (73.5%) | 300 (88.0%) |
| 65 to 74 Years | 240 (93.8%) | 320 (92.7%) |
| 75 Years and over | 138 (92.0%) | 125 (70.2%) |
| Total | 1,796 (77.8%) | 1,783 (77.5%) |
Income Below Poverty Among Married-Couple Families in Clinton
The poverty statistics for married-couple families in Clinton show that 5.4% or 48 of the total 883 families live below the poverty line. Families with 1 or 2 children have the highest poverty rate of 11.9%, comprising of 20 families. On the other hand, families with 3 or 4 children have the lowest poverty rate of 0.0%, which includes 0 families.
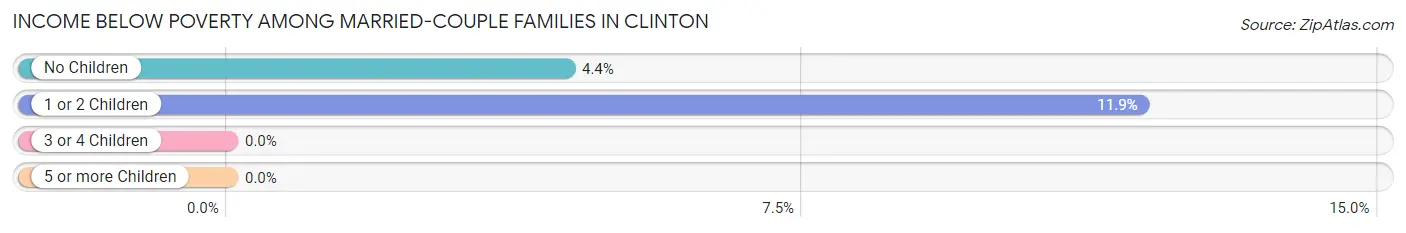
| Children | Above Poverty | Below Poverty |
| No Children | 609 (95.6%) | 28 (4.4%) |
| 1 or 2 Children | 148 (88.1%) | 20 (11.9%) |
| 3 or 4 Children | 57 (100.0%) | 0 (0.0%) |
| 5 or more Children | 21 (100.0%) | 0 (0.0%) |
| Total | 835 (94.6%) | 48 (5.4%) |
Income Below Poverty Among Single-Parent Households in Clinton
According to the poverty data in Clinton, 24.4% or 48 single-father households and 40.8% or 139 single-mother households are living below the poverty line. Among single-father households, those with 1 or 2 children have the highest poverty rate, with 48 households (40.0%) experiencing poverty. Likewise, among single-mother households, those with 3 or 4 children have the highest poverty rate, with 63 households (100.0%) falling below the poverty line.
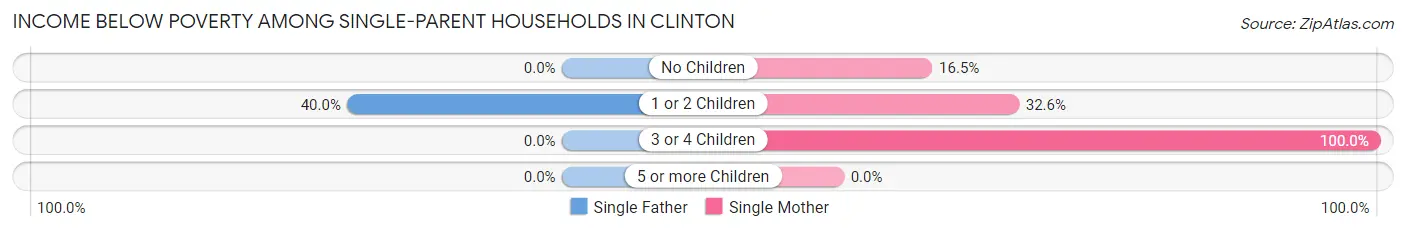
| Children | Single Father | Single Mother |
| No Children | 0 (0.0%) | 15 (16.5%) |
| 1 or 2 Children | 48 (40.0%) | 61 (32.6%) |
| 3 or 4 Children | 0 (0.0%) | 63 (100.0%) |
| 5 or more Children | 0 (0.0%) | 0 (0.0%) |
| Total | 48 (24.4%) | 139 (40.8%) |
Income Below Poverty Among Married-Couple vs Single-Parent Households in Clinton
The poverty data for Clinton shows that 48 of the married-couple family households (5.4%) and 187 of the single-parent households (34.8%) are living below the poverty level. Within the married-couple family households, those with 1 or 2 children have the highest poverty rate, with 20 households (11.9%) falling below the poverty line. Among the single-parent households, those with 3 or 4 children have the highest poverty rate, with 63 household (73.3%) living below poverty.
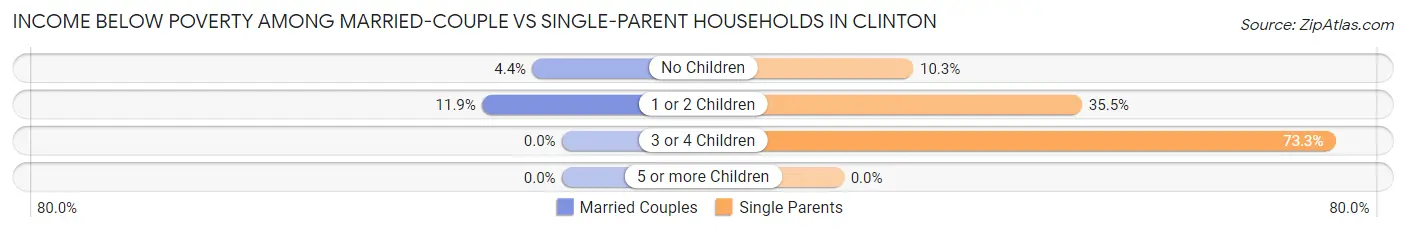
| Children | Married-Couple Families | Single-Parent Households |
| No Children | 28 (4.4%) | 15 (10.3%) |
| 1 or 2 Children | 20 (11.9%) | 109 (35.5%) |
| 3 or 4 Children | 0 (0.0%) | 63 (73.3%) |
| 5 or more Children | 0 (0.0%) | 0 (0.0%) |
| Total | 48 (5.4%) | 187 (34.8%) |
Race in Clinton
The most populous races in Clinton are White / Caucasian (4,695 | 97.4%), Black / African American (67 | 1.4%), and Two or more Races (40 | 0.8%).
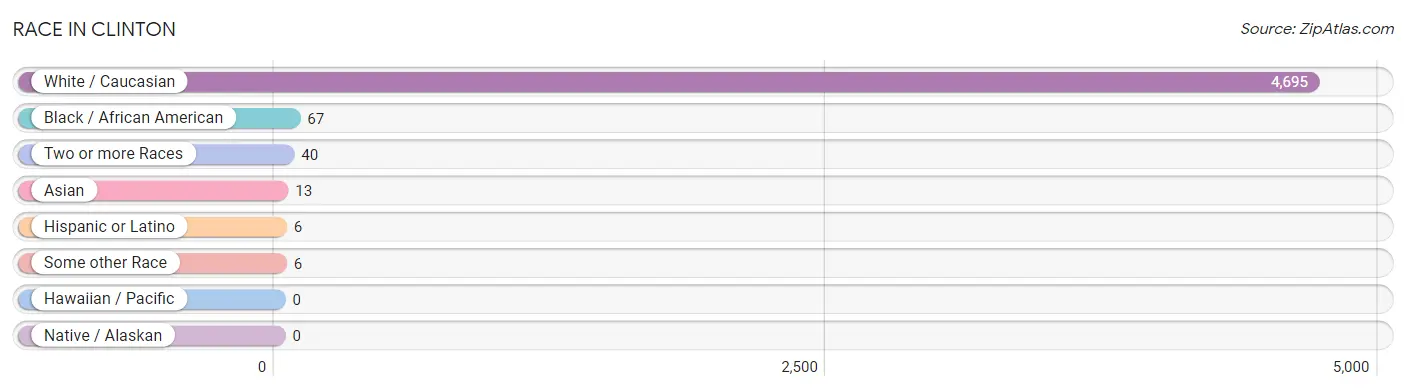
| Race | # Population | % Population |
| Asian | 13 | 0.3% |
| Black / African American | 67 | 1.4% |
| Hawaiian / Pacific | 0 | 0.0% |
| Hispanic or Latino | 6 | 0.1% |
| Native / Alaskan | 0 | 0.0% |
| White / Caucasian | 4,695 | 97.4% |
| Two or more Races | 40 | 0.8% |
| Some other Race | 6 | 0.1% |
| Total | 4,821 | 100.0% |
Ancestry in Clinton
The most populous ancestries reported in Clinton are German (752 | 15.6%), Irish (749 | 15.5%), English (590 | 12.2%), American (472 | 9.8%), and Italian (388 | 8.1%), together accounting for 61.2% of all Clinton residents.
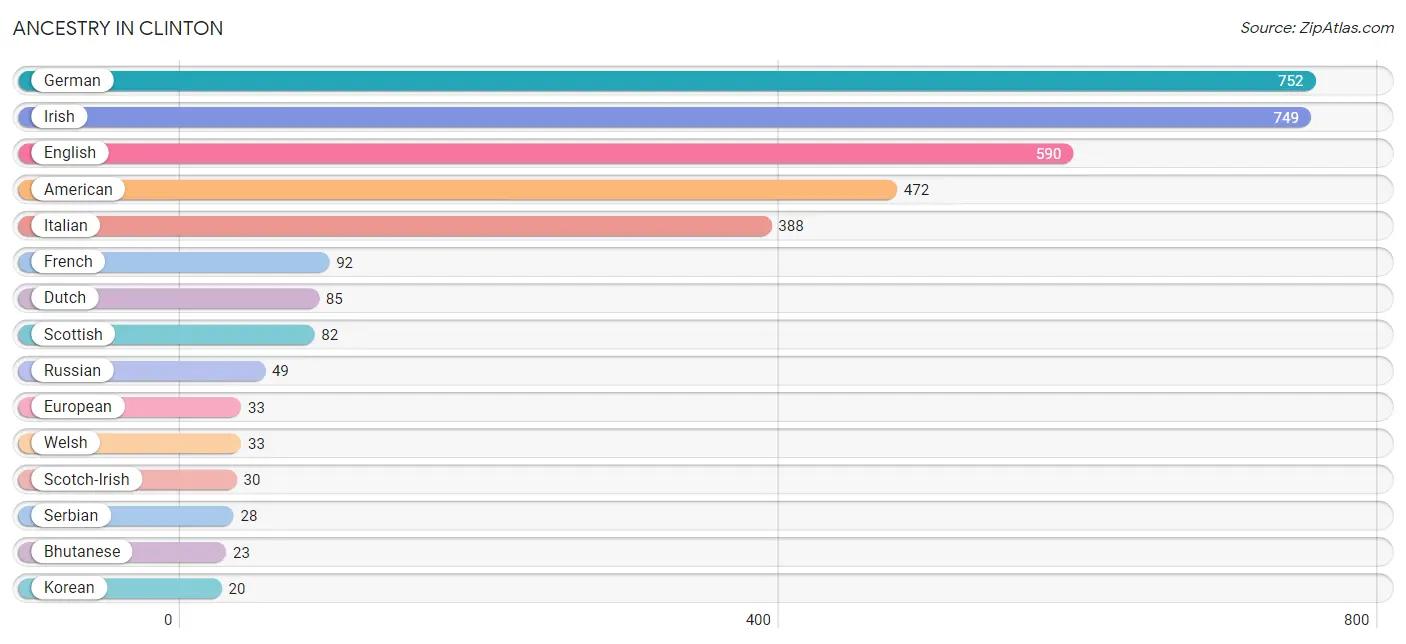
| Ancestry | # Population | % Population |
| American | 472 | 9.8% |
| Bhutanese | 23 | 0.5% |
| British | 13 | 0.3% |
| Cherokee | 10 | 0.2% |
| Czechoslovakian | 12 | 0.3% |
| Dutch | 85 | 1.8% |
| English | 590 | 12.2% |
| European | 33 | 0.7% |
| French | 92 | 1.9% |
| German | 752 | 15.6% |
| Irish | 749 | 15.5% |
| Italian | 388 | 8.1% |
| Korean | 20 | 0.4% |
| Liberian | 8 | 0.2% |
| Mexican | 6 | 0.1% |
| Polish | 12 | 0.3% |
| Romanian | 18 | 0.4% |
| Russian | 49 | 1.0% |
| Scotch-Irish | 30 | 0.6% |
| Scottish | 82 | 1.7% |
| Serbian | 28 | 0.6% |
| Slovak | 13 | 0.3% |
| Subsaharan African | 8 | 0.2% |
| Swiss | 19 | 0.4% |
| Welsh | 33 | 0.7% |
| Yugoslavian | 12 | 0.3% | View All 26 Rows |
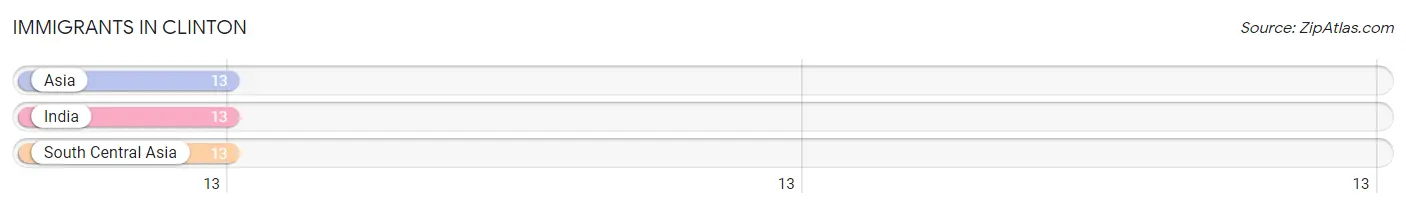
Immigrants in Clinton
The most numerous immigrant groups reported in Clinton came from Asia (13 | 0.3%), India (13 | 0.3%), and South Central Asia (13 | 0.3%), together accounting for 0.8% of all Clinton residents.
| Immigration Origin | # Population | % Population |
| Asia | 13 | 0.3% |
| India | 13 | 0.3% |
| South Central Asia | 13 | 0.3% | View All 3 Rows |
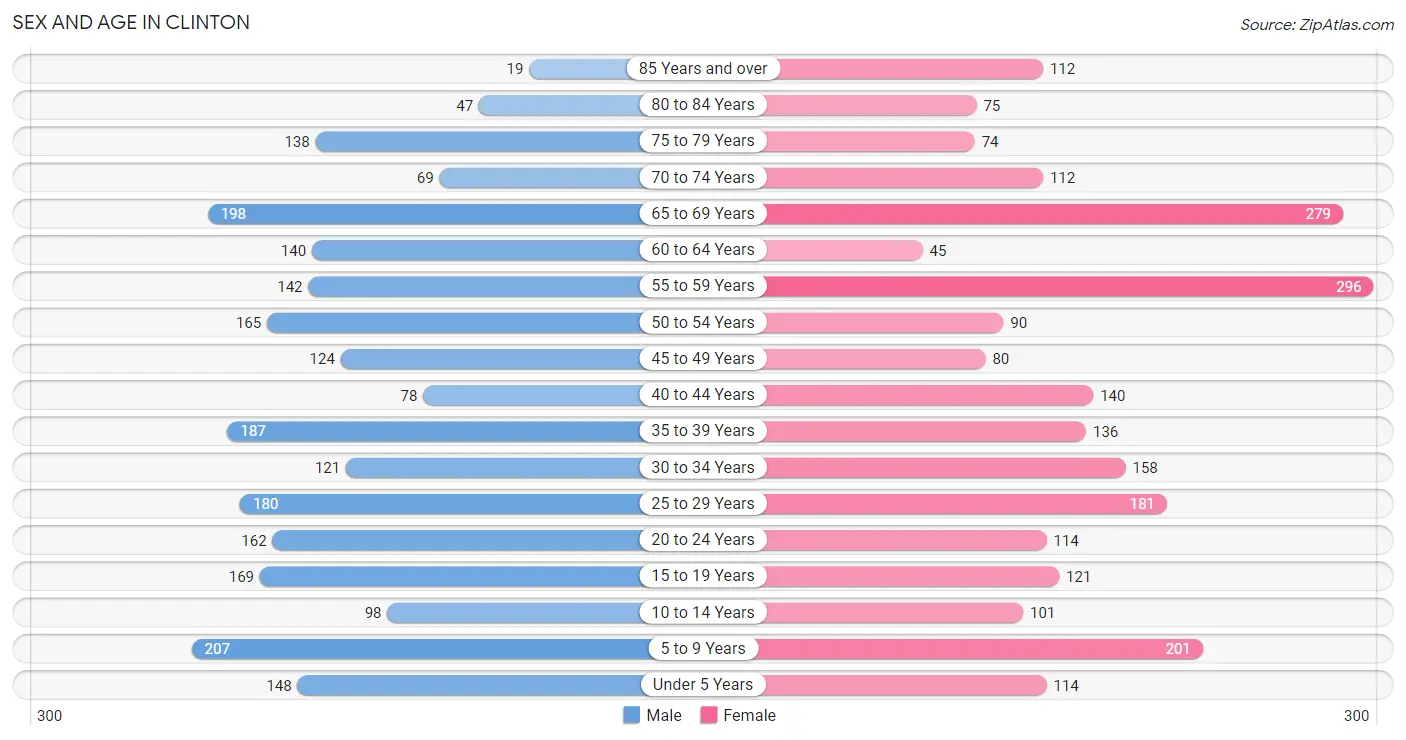
Sex and Age in Clinton
Sex and Age in Clinton
The most populous age groups in Clinton are 5 to 9 Years (207 | 8.6%) for men and 55 to 59 Years (296 | 12.2%) for women.
| Age Bracket | Male | Female |
| Under 5 Years | 148 (6.2%) | 114 (4.7%) |
| 5 to 9 Years | 207 (8.6%) | 201 (8.3%) |
| 10 to 14 Years | 98 (4.1%) | 101 (4.2%) |
| 15 to 19 Years | 169 (7.1%) | 121 (5.0%) |
| 20 to 24 Years | 162 (6.8%) | 114 (4.7%) |
| 25 to 29 Years | 180 (7.5%) | 181 (7.4%) |
| 30 to 34 Years | 121 (5.1%) | 158 (6.5%) |
| 35 to 39 Years | 187 (7.8%) | 136 (5.6%) |
| 40 to 44 Years | 78 (3.3%) | 140 (5.8%) |
| 45 to 49 Years | 124 (5.2%) | 80 (3.3%) |
| 50 to 54 Years | 165 (6.9%) | 90 (3.7%) |
| 55 to 59 Years | 142 (5.9%) | 296 (12.2%) |
| 60 to 64 Years | 140 (5.9%) | 45 (1.8%) |
| 65 to 69 Years | 198 (8.3%) | 279 (11.5%) |
| 70 to 74 Years | 69 (2.9%) | 112 (4.6%) |
| 75 to 79 Years | 138 (5.8%) | 74 (3.0%) |
| 80 to 84 Years | 47 (2.0%) | 75 (3.1%) |
| 85 Years and over | 19 (0.8%) | 112 (4.6%) |
| Total | 2,392 (100.0%) | 2,429 (100.0%) |
Families and Households in Clinton
Median Family Size in Clinton
The median family size in Clinton is 2.58 persons per family, with single female/mother families (341 | 24.0%) accounting for the largest median family size of 2.69 persons per family. On the other hand, single male/father families (197 | 13.9%) represent the smallest median family size with 2.29 persons per family.

| Family Type | # Families | Family Size |
| Married-Couple | 883 (62.1%) | 2.60 |
| Single Male/Father | 197 (13.9%) | 2.29 |
| Single Female/Mother | 341 (24.0%) | 2.69 |
| Total Families | 1,421 (100.0%) | 2.58 |
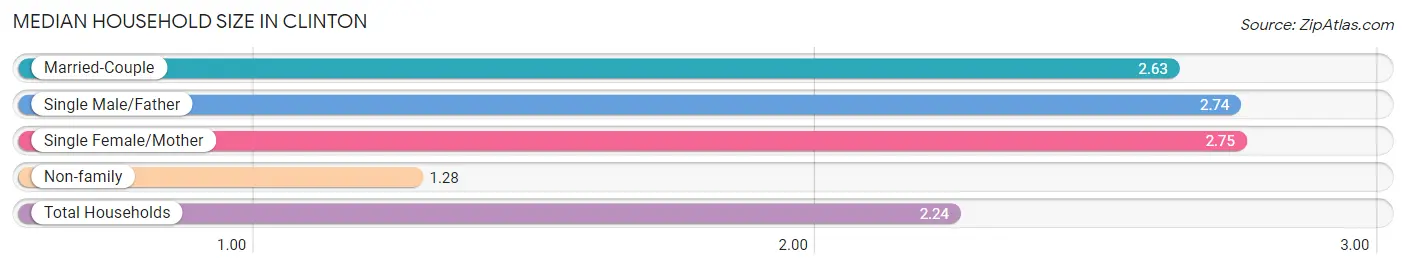
Median Household Size in Clinton
The median household size in Clinton is 2.24 persons per household, with single female/mother households (341 | 16.6%) accounting for the largest median household size of 2.75 persons per household. non-family households (639 | 31.0%) represent the smallest median household size with 1.28 persons per household.
| Household Type | # Households | Household Size |
| Married-Couple | 883 (42.9%) | 2.63 |
| Single Male/Father | 197 (9.6%) | 2.74 |
| Single Female/Mother | 341 (16.6%) | 2.75 |
| Non-family | 639 (31.0%) | 1.28 |
| Total Households | 2,060 (100.0%) | 2.24 |
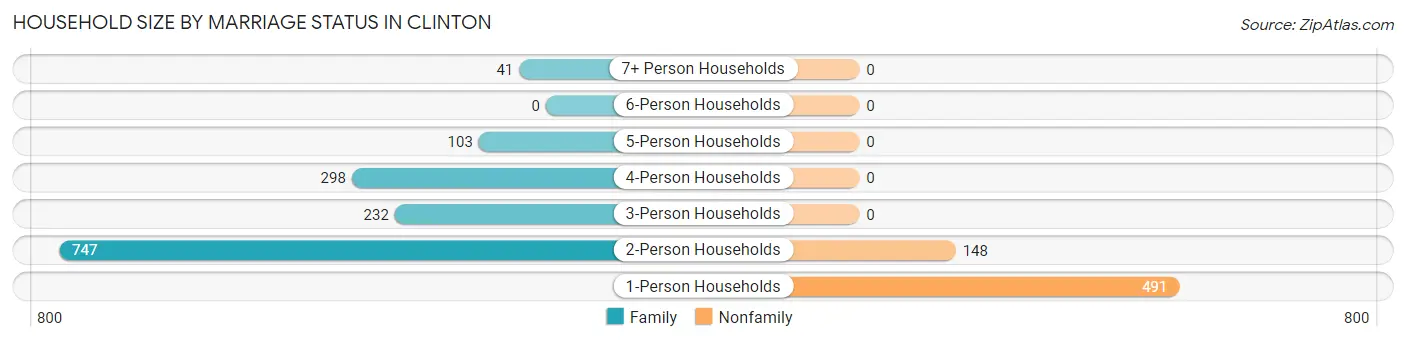
Household Size by Marriage Status in Clinton
Out of a total of 2,060 households in Clinton, 1,421 (69.0%) are family households, while 639 (31.0%) are nonfamily households. The most numerous type of family households are 2-person households, comprising 747, and the most common type of nonfamily households are 1-person households, comprising 491.
| Household Size | Family Households | Nonfamily Households |
| 1-Person Households | - | 491 (23.8%) |
| 2-Person Households | 747 (36.3%) | 148 (7.2%) |
| 3-Person Households | 232 (11.3%) | 0 (0.0%) |
| 4-Person Households | 298 (14.5%) | 0 (0.0%) |
| 5-Person Households | 103 (5.0%) | 0 (0.0%) |
| 6-Person Households | 0 (0.0%) | 0 (0.0%) |
| 7+ Person Households | 41 (2.0%) | 0 (0.0%) |
| Total | 1,421 (69.0%) | 639 (31.0%) |
Female Fertility in Clinton
Fertility by Age in Clinton
Average fertility rate in Clinton is 57.0 births per 1,000 women. Women in the age bracket of 20 to 34 years have the highest fertility rate with 121.0 births per 1,000 women. Women in the age bracket of 20 to 34 years acount for 100.0% of all women with births.
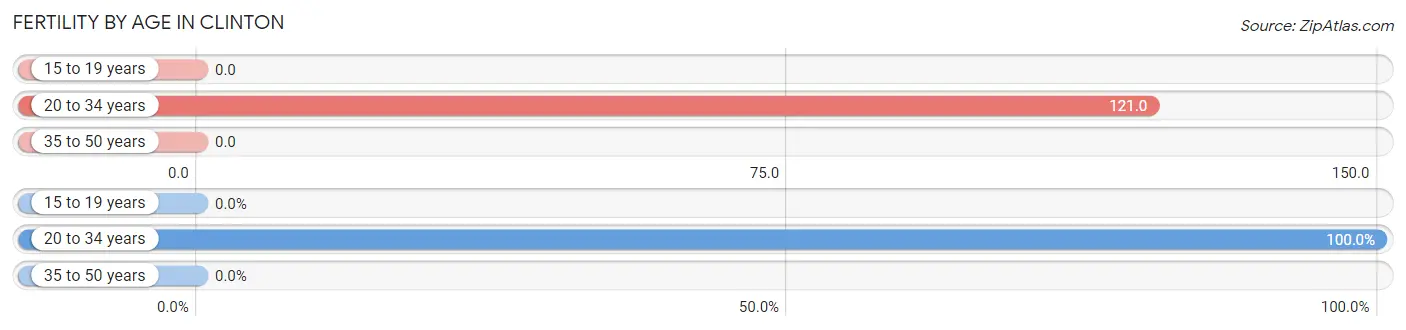
| Age Bracket | Women with Births | Births / 1,000 Women |
| 15 to 19 years | 0 (0.0%) | 0.0 |
| 20 to 34 years | 55 (100.0%) | 121.0 |
| 35 to 50 years | 0 (0.0%) | 0.0 |
| Total | 55 (100.0%) | 57.0 |
Fertility by Age by Marriage Status in Clinton
32.7% of women with births (55) in Clinton are married. The highest percentage of unmarried women with births falls into 20 to 34 years age bracket with 67.3% of them unmarried at the time of birth, while the lowest percentage of unmarried women with births belong to 20 to 34 years age bracket with 67.3% of them unmarried.
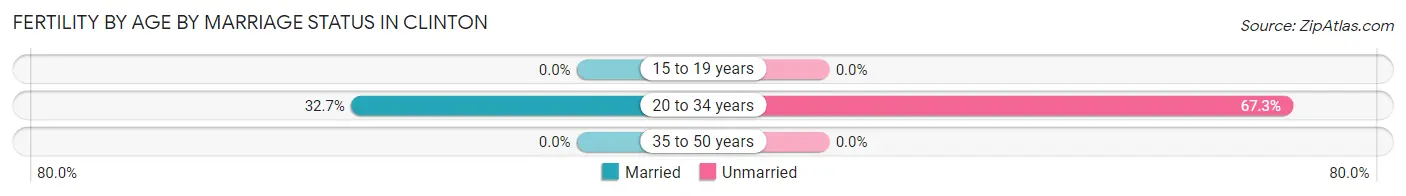
| Age Bracket | Married | Unmarried |
| 15 to 19 years | 0 (0.0%) | 0 (0.0%) |
| 20 to 34 years | 18 (32.7%) | 37 (67.3%) |
| 35 to 50 years | 0 (0.0%) | 0 (0.0%) |
| Total | 18 (32.7%) | 37 (67.3%) |
Fertility by Education in Clinton
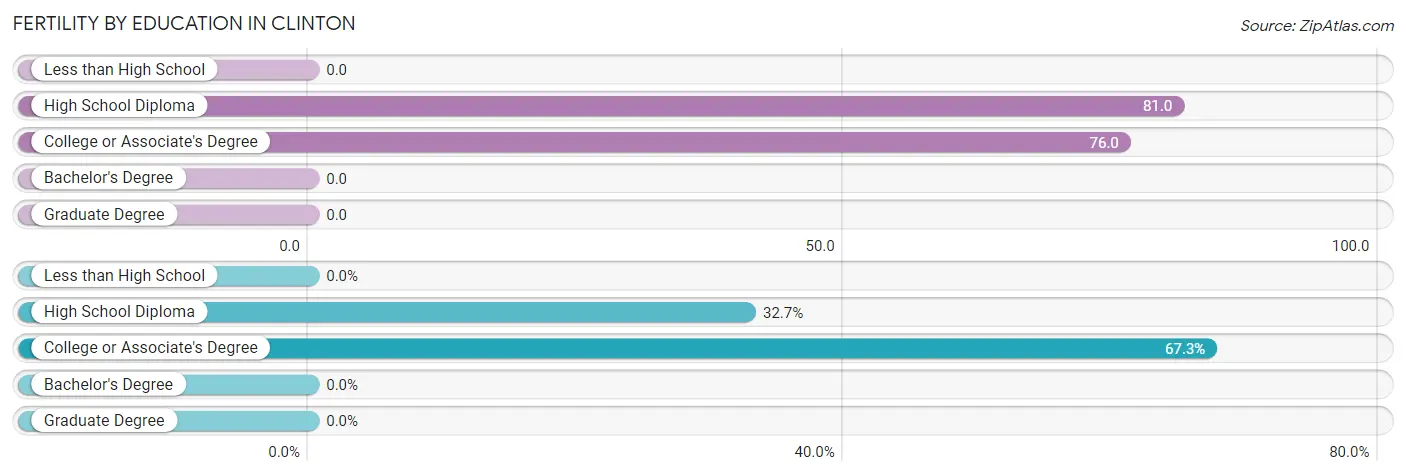
| Educational Attainment | Women with Births | Births / 1,000 Women |
| Less than High School | 0 (0.0%) | 0.0 |
| High School Diploma | 18 (32.7%) | 81.0 |
| College or Associate's Degree | 37 (67.3%) | 76.0 |
| Bachelor's Degree | 0 (0.0%) | 0.0 |
| Graduate Degree | 0 (0.0%) | 0.0 |
| Total | 55 (100.0%) | 57.0 |
Fertility by Education by Marriage Status in Clinton
67.3% of women with births in Clinton are unmarried. Women with the educational attainment of high school diploma are most likely to be married with 100.0% of them married at childbirth, while women with the educational attainment of college or associate's degree are least likely to be married with 100.0% of them unmarried at childbirth.
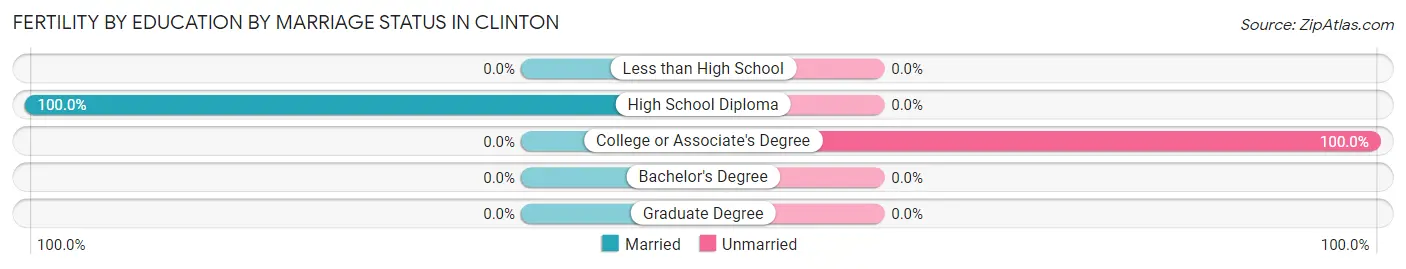
| Educational Attainment | Married | Unmarried |
| Less than High School | 0 (0.0%) | 0 (0.0%) |
| High School Diploma | 18 (100.0%) | 0 (0.0%) |
| College or Associate's Degree | 0 (0.0%) | 37 (100.0%) |
| Bachelor's Degree | 0 (0.0%) | 0 (0.0%) |
| Graduate Degree | 0 (0.0%) | 0 (0.0%) |
| Total | 18 (32.7%) | 37 (67.3%) |
Employment Characteristics in Clinton
Employment by Class of Employer in Clinton
Among the 1,980 employed individuals in Clinton, private company employees (1,208 | 61.0%), not-for-profit organizations (223 | 11.3%), and self-employed (incorporated) (161 | 8.1%) make up the most common classes of employment.
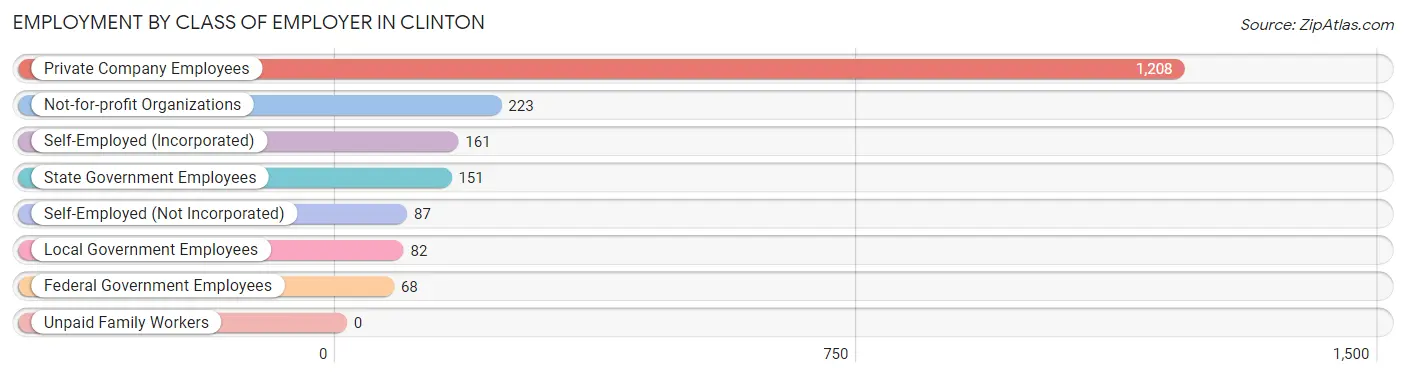
| Employer Class | # Employees | % Employees |
| Private Company Employees | 1,208 | 61.0% |
| Self-Employed (Incorporated) | 161 | 8.1% |
| Self-Employed (Not Incorporated) | 87 | 4.4% |
| Not-for-profit Organizations | 223 | 11.3% |
| Local Government Employees | 82 | 4.1% |
| State Government Employees | 151 | 7.6% |
| Federal Government Employees | 68 | 3.4% |
| Unpaid Family Workers | 0 | 0.0% |
| Total | 1,980 | 100.0% |
Employment Status by Age in Clinton
According to the labor force statistics for Clinton, out of the total population over 16 years of age (3,938), 59.5% or 2,343 individuals are in the labor force, with 13.1% or 307 of them unemployed. The age group with the highest labor force participation rate is 30 to 34 years, with 94.6% or 264 individuals in the labor force. Within the labor force, the 16 to 19 years age range has the highest percentage of unemployed individuals, with 45.9% or 95 of them being unemployed.
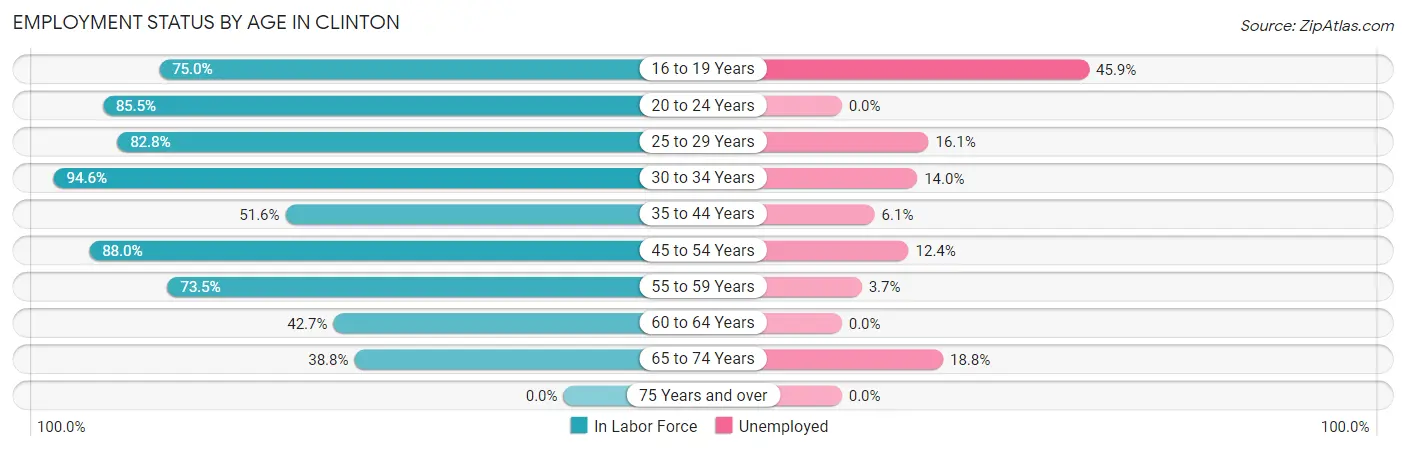
| Age Bracket | In Labor Force | Unemployed |
| 16 to 19 Years | 207 (75.0%) | 95 (45.9%) |
| 20 to 24 Years | 236 (85.5%) | 0 (0.0%) |
| 25 to 29 Years | 299 (82.8%) | 48 (16.1%) |
| 30 to 34 Years | 264 (94.6%) | 37 (14.0%) |
| 35 to 44 Years | 279 (51.6%) | 17 (6.1%) |
| 45 to 54 Years | 404 (88.0%) | 50 (12.4%) |
| 55 to 59 Years | 322 (73.5%) | 12 (3.7%) |
| 60 to 64 Years | 79 (42.7%) | 0 (0.0%) |
| 65 to 74 Years | 255 (38.8%) | 48 (18.8%) |
| 75 Years and over | 0 (0.0%) | 0 (0.0%) |
| Total | 2,343 (59.5%) | 307 (13.1%) |
Employment Status by Educational Attainment in Clinton
According to labor force statistics for Clinton, 72.8% of individuals (1,647) out of the total population between 25 and 64 years of age (2,263) are in the labor force, with 10.0% or 165 of them being unemployed. The group with the highest labor force participation rate are those with the educational attainment of college / associate degree, with 84.8% or 778 individuals in the labor force. Within the labor force, individuals with less than high school education have the highest percentage of unemployment, with 44.6% or 50 of them being unemployed.
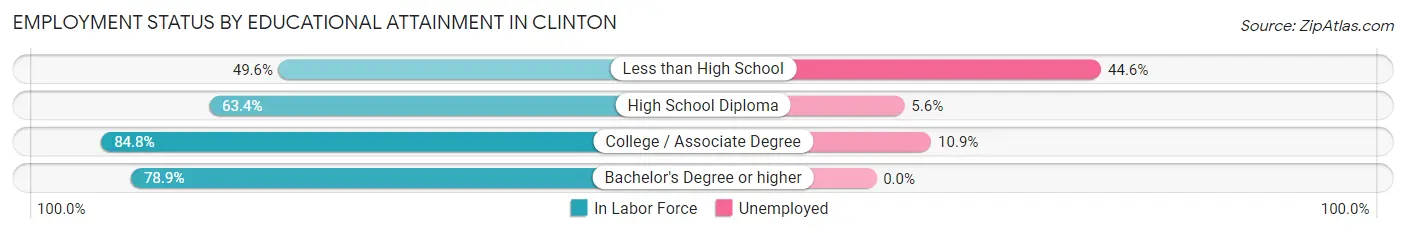
| Educational Attainment | In Labor Force | Unemployed |
| Less than High School | 112 (49.6%) | 101 (44.6%) |
| High School Diploma | 517 (63.4%) | 46 (5.6%) |
| College / Associate Degree | 778 (84.8%) | 100 (10.9%) |
| Bachelor's Degree or higher | 240 (78.9%) | 0 (0.0%) |
| Total | 1,647 (72.8%) | 226 (10.0%) |
Employment Occupations by Sex in Clinton
Management, Business, Science and Arts Occupations
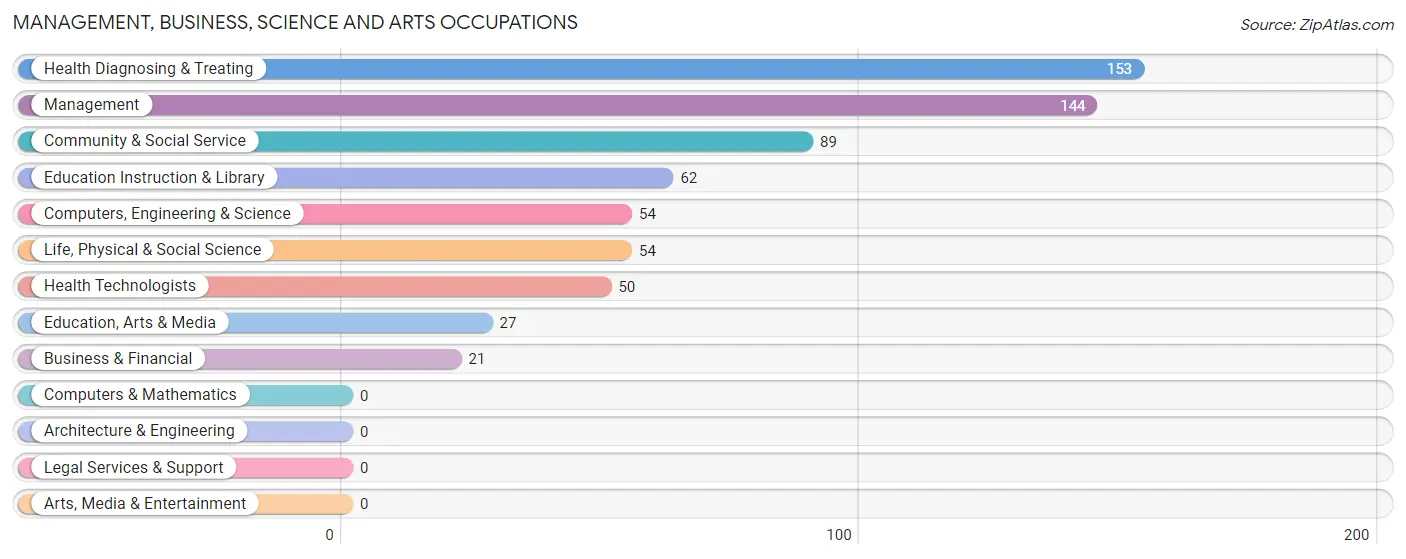
The most common Management, Business, Science and Arts occupations in Clinton are Health Diagnosing & Treating (153 | 7.5%), Management (144 | 7.1%), Community & Social Service (89 | 4.4%), Education Instruction & Library (62 | 3.0%), and Computers, Engineering & Science (54 | 2.6%).
Management, Business, Science and Arts Occupations by Sex
Within the Management, Business, Science and Arts occupations in Clinton, the most male-oriented occupations are Business & Financial (100.0%), Management (73.6%), and Education, Arts & Media (44.4%), while the most female-oriented occupations are Health Diagnosing & Treating (100.0%), Health Technologists (100.0%), and Education Instruction & Library (75.8%).
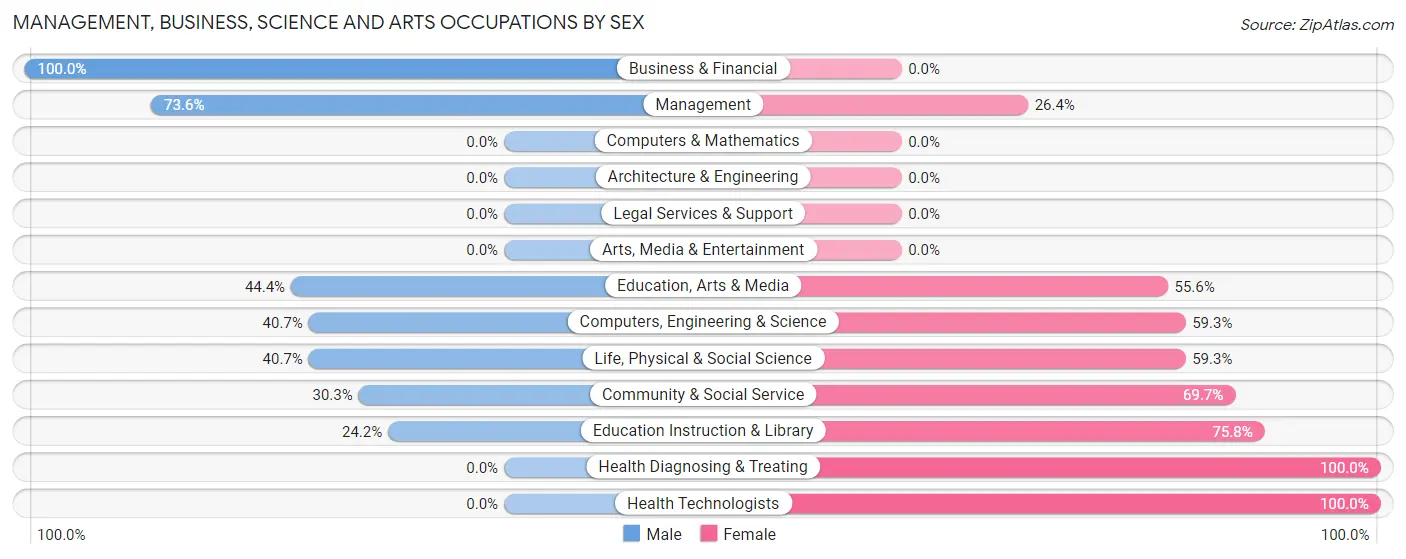
| Occupation | Male | Female |
| Management | 106 (73.6%) | 38 (26.4%) |
| Business & Financial | 21 (100.0%) | 0 (0.0%) |
| Computers, Engineering & Science | 22 (40.7%) | 32 (59.3%) |
| Computers & Mathematics | 0 (0.0%) | 0 (0.0%) |
| Architecture & Engineering | 0 (0.0%) | 0 (0.0%) |
| Life, Physical & Social Science | 22 (40.7%) | 32 (59.3%) |
| Community & Social Service | 27 (30.3%) | 62 (69.7%) |
| Education, Arts & Media | 12 (44.4%) | 15 (55.6%) |
| Legal Services & Support | 0 (0.0%) | 0 (0.0%) |
| Education Instruction & Library | 15 (24.2%) | 47 (75.8%) |
| Arts, Media & Entertainment | 0 (0.0%) | 0 (0.0%) |
| Health Diagnosing & Treating | 0 (0.0%) | 153 (100.0%) |
| Health Technologists | 0 (0.0%) | 50 (100.0%) |
| Total (Category) | 176 (38.2%) | 285 (61.8%) |
| Total (Overall) | 1,145 (56.2%) | 893 (43.8%) |
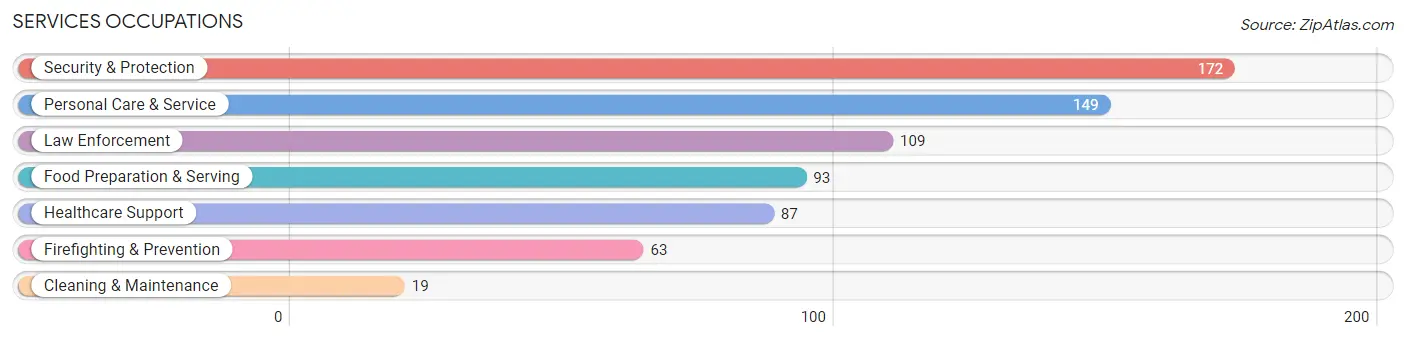
Services Occupations
The most common Services occupations in Clinton are Security & Protection (172 | 8.4%), Personal Care & Service (149 | 7.3%), Law Enforcement (109 | 5.3%), Food Preparation & Serving (93 | 4.6%), and Healthcare Support (87 | 4.3%).
Services Occupations by Sex
Within the Services occupations in Clinton, the most male-oriented occupations are Firefighting & Prevention (100.0%), Security & Protection (83.1%), and Personal Care & Service (81.9%), while the most female-oriented occupations are Cleaning & Maintenance (100.0%), Healthcare Support (77.0%), and Food Preparation & Serving (69.9%).
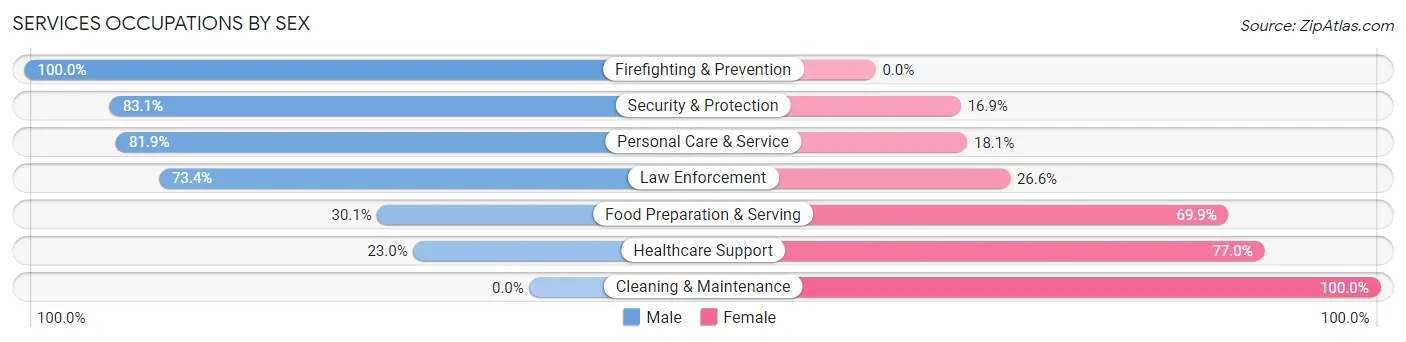
| Occupation | Male | Female |
| Healthcare Support | 20 (23.0%) | 67 (77.0%) |
| Security & Protection | 143 (83.1%) | 29 (16.9%) |
| Firefighting & Prevention | 63 (100.0%) | 0 (0.0%) |
| Law Enforcement | 80 (73.4%) | 29 (26.6%) |
| Food Preparation & Serving | 28 (30.1%) | 65 (69.9%) |
| Cleaning & Maintenance | 0 (0.0%) | 19 (100.0%) |
| Personal Care & Service | 122 (81.9%) | 27 (18.1%) |
| Total (Category) | 313 (60.2%) | 207 (39.8%) |
| Total (Overall) | 1,145 (56.2%) | 893 (43.8%) |
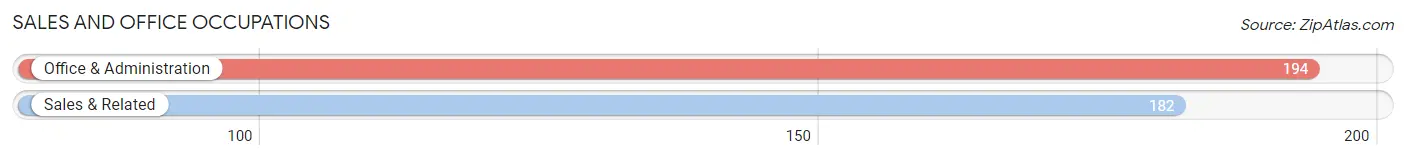
Sales and Office Occupations
The most common Sales and Office occupations in Clinton are Office & Administration (194 | 9.5%), and Sales & Related (182 | 8.9%).
Sales and Office Occupations by Sex
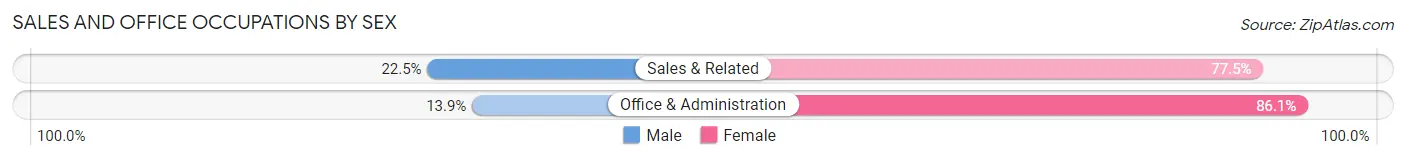
| Occupation | Male | Female |
| Sales & Related | 41 (22.5%) | 141 (77.5%) |
| Office & Administration | 27 (13.9%) | 167 (86.1%) |
| Total (Category) | 68 (18.1%) | 308 (81.9%) |
| Total (Overall) | 1,145 (56.2%) | 893 (43.8%) |
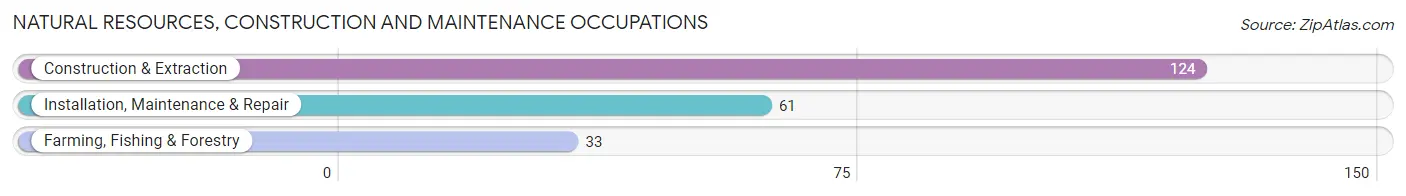
Natural Resources, Construction and Maintenance Occupations
The most common Natural Resources, Construction and Maintenance occupations in Clinton are Construction & Extraction (124 | 6.1%), Installation, Maintenance & Repair (61 | 3.0%), and Farming, Fishing & Forestry (33 | 1.6%).
Natural Resources, Construction and Maintenance Occupations by Sex
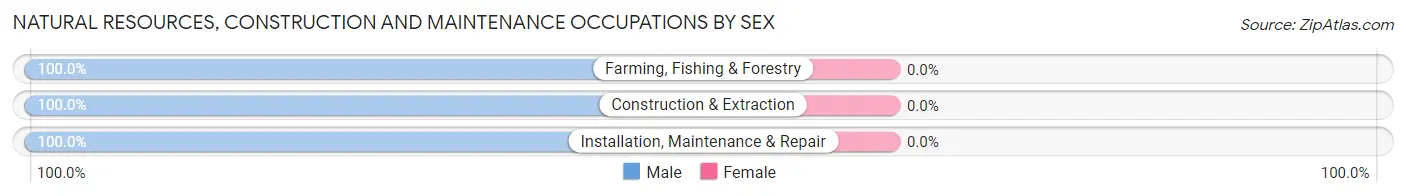
| Occupation | Male | Female |
| Farming, Fishing & Forestry | 33 (100.0%) | 0 (0.0%) |
| Construction & Extraction | 124 (100.0%) | 0 (0.0%) |
| Installation, Maintenance & Repair | 61 (100.0%) | 0 (0.0%) |
| Total (Category) | 218 (100.0%) | 0 (0.0%) |
| Total (Overall) | 1,145 (56.2%) | 893 (43.8%) |
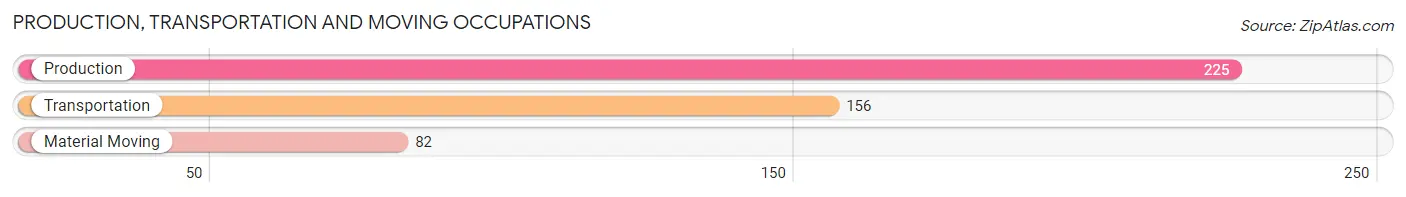
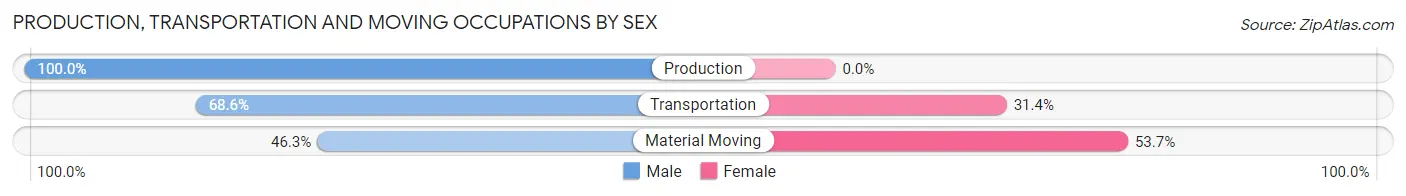
Production, Transportation and Moving Occupations
The most common Production, Transportation and Moving occupations in Clinton are Production (225 | 11.0%), Transportation (156 | 7.6%), and Material Moving (82 | 4.0%).
Production, Transportation and Moving Occupations by Sex
| Occupation | Male | Female |
| Production | 225 (100.0%) | 0 (0.0%) |
| Transportation | 107 (68.6%) | 49 (31.4%) |
| Material Moving | 38 (46.3%) | 44 (53.7%) |
| Total (Category) | 370 (79.9%) | 93 (20.1%) |
| Total (Overall) | 1,145 (56.2%) | 893 (43.8%) |
Employment Industries by Sex in Clinton
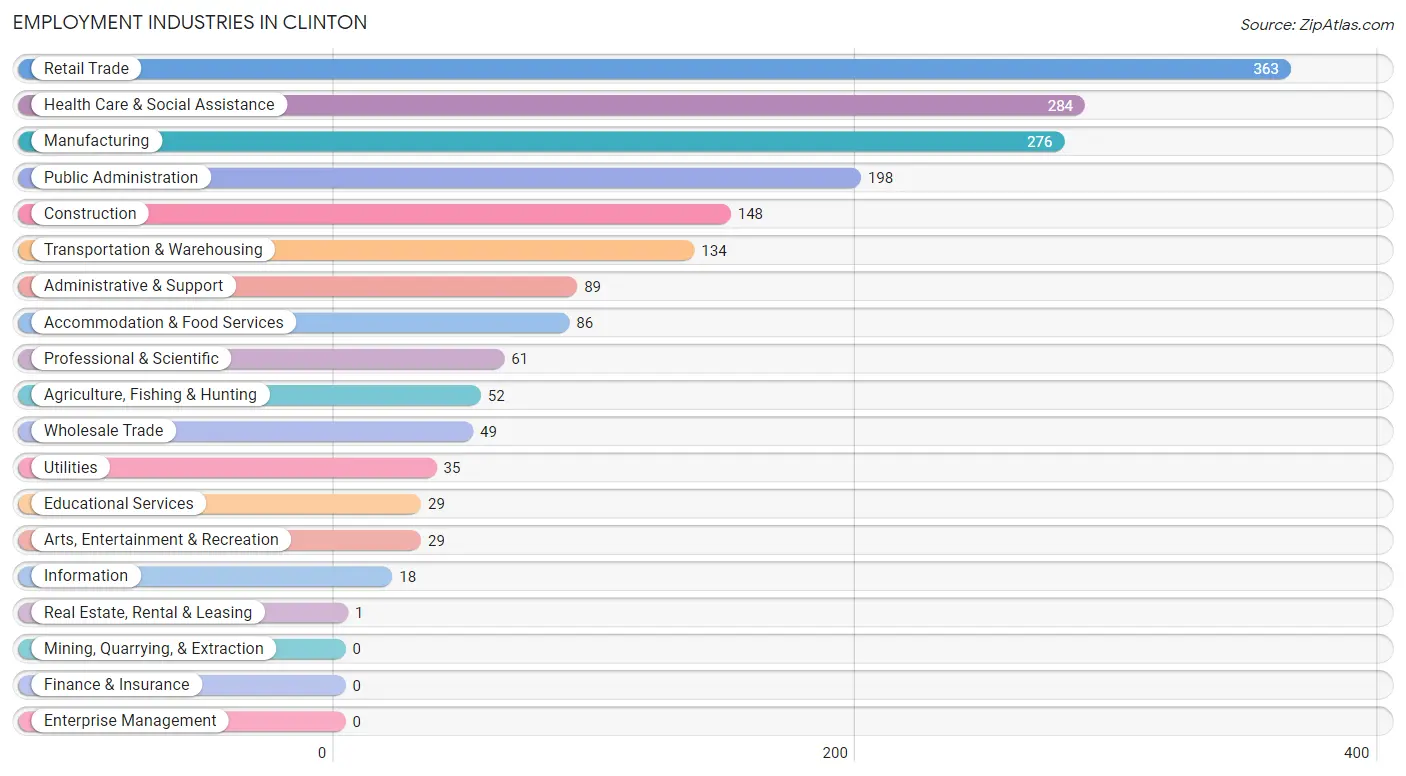
Employment Industries in Clinton
The major employment industries in Clinton include Retail Trade (363 | 17.8%), Health Care & Social Assistance (284 | 13.9%), Manufacturing (276 | 13.5%), Public Administration (198 | 9.7%), and Construction (148 | 7.3%).
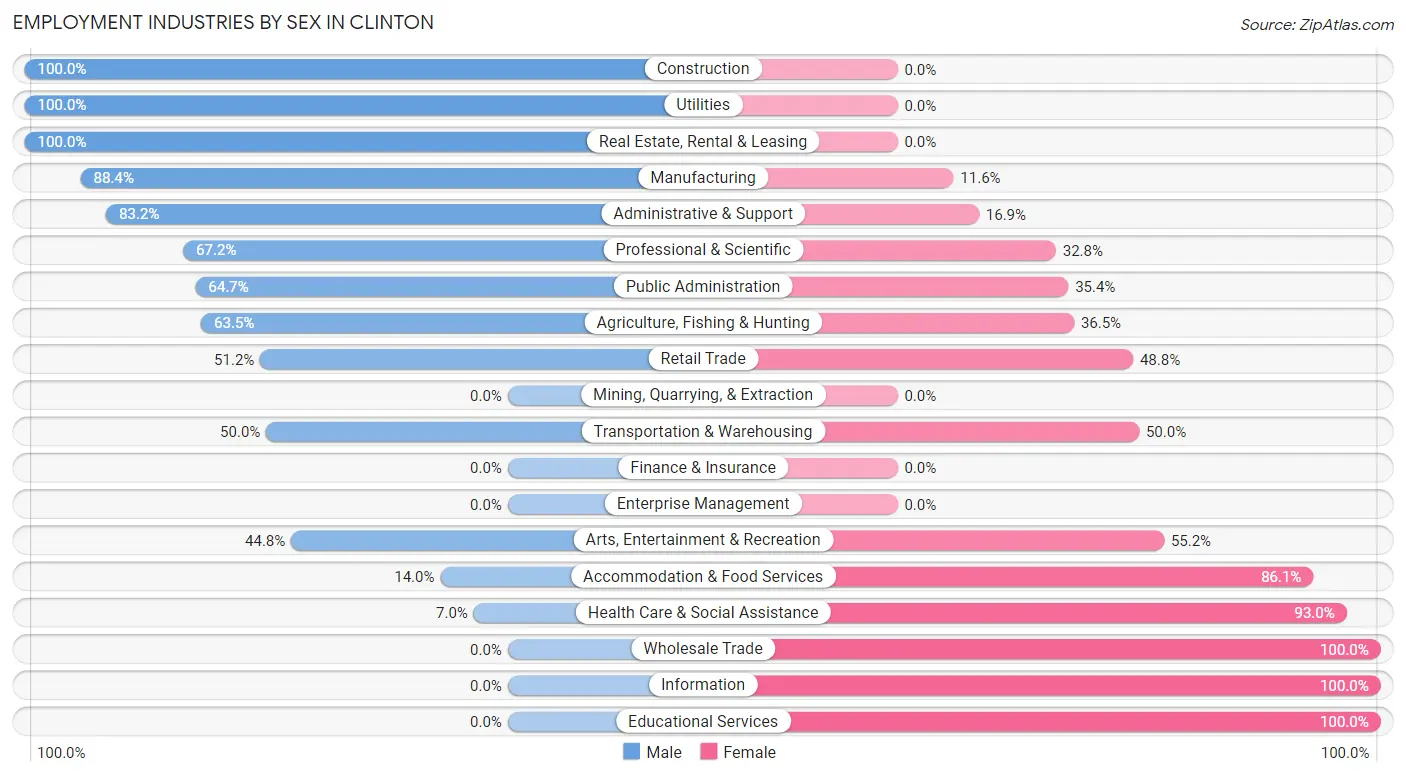
Employment Industries by Sex in Clinton
The Clinton industries that see more men than women are Construction (100.0%), Utilities (100.0%), and Real Estate, Rental & Leasing (100.0%), whereas the industries that tend to have a higher number of women are Wholesale Trade (100.0%), Information (100.0%), and Educational Services (100.0%).
| Industry | Male | Female |
| Agriculture, Fishing & Hunting | 33 (63.5%) | 19 (36.5%) |
| Mining, Quarrying, & Extraction | 0 (0.0%) | 0 (0.0%) |
| Construction | 148 (100.0%) | 0 (0.0%) |
| Manufacturing | 244 (88.4%) | 32 (11.6%) |
| Wholesale Trade | 0 (0.0%) | 49 (100.0%) |
| Retail Trade | 186 (51.2%) | 177 (48.8%) |
| Transportation & Warehousing | 67 (50.0%) | 67 (50.0%) |
| Utilities | 35 (100.0%) | 0 (0.0%) |
| Information | 0 (0.0%) | 18 (100.0%) |
| Finance & Insurance | 0 (0.0%) | 0 (0.0%) |
| Real Estate, Rental & Leasing | 1 (100.0%) | 0 (0.0%) |
| Professional & Scientific | 41 (67.2%) | 20 (32.8%) |
| Enterprise Management | 0 (0.0%) | 0 (0.0%) |
| Administrative & Support | 74 (83.2%) | 15 (16.9%) |
| Educational Services | 0 (0.0%) | 29 (100.0%) |
| Health Care & Social Assistance | 20 (7.0%) | 264 (93.0%) |
| Arts, Entertainment & Recreation | 13 (44.8%) | 16 (55.2%) |
| Accommodation & Food Services | 12 (14.0%) | 74 (86.1%) |
| Public Administration | 128 (64.6%) | 70 (35.3%) |
| Total | 1,145 (56.2%) | 893 (43.8%) |
Education in Clinton
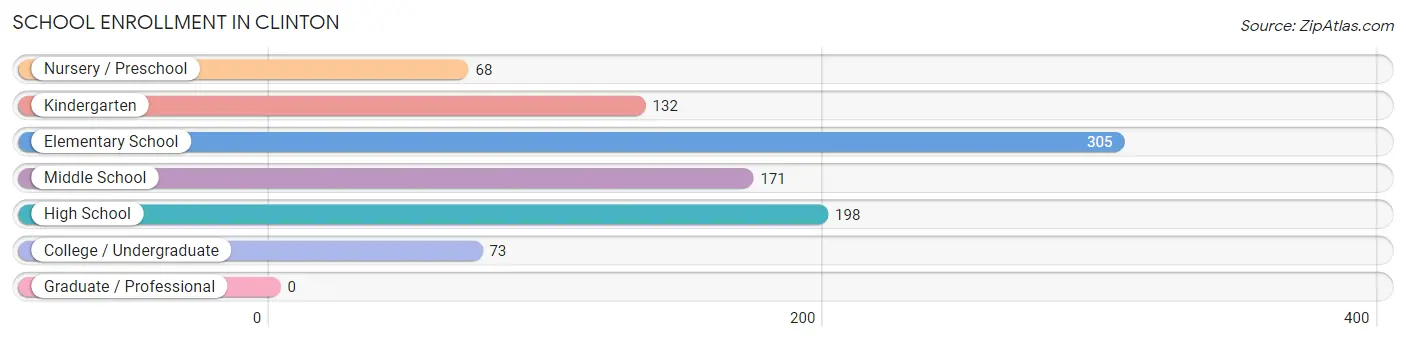
School Enrollment in Clinton
The most common levels of schooling among the 947 students in Clinton are elementary school (305 | 32.2%), high school (198 | 20.9%), and middle school (171 | 18.1%).
| School Level | # Students | % Students |
| Nursery / Preschool | 68 | 7.2% |
| Kindergarten | 132 | 13.9% |
| Elementary School | 305 | 32.2% |
| Middle School | 171 | 18.1% |
| High School | 198 | 20.9% |
| College / Undergraduate | 73 | 7.7% |
| Graduate / Professional | 0 | 0.0% |
| Total | 947 | 100.0% |
School Enrollment by Age by Funding Source in Clinton
Out of a total of 947 students who are enrolled in schools in Clinton, 18 (1.9%) attend a private institution, while the remaining 929 (98.1%) are enrolled in public schools. The age group of 15 to 17 year olds has the highest likelihood of being enrolled in private schools, with 18 (11.5% in the age bracket) enrolled. Conversely, the age group of 3 to 4 year olds has the lowest likelihood of being enrolled in a private school, with 68 (100.0% in the age bracket) attending a public institution.
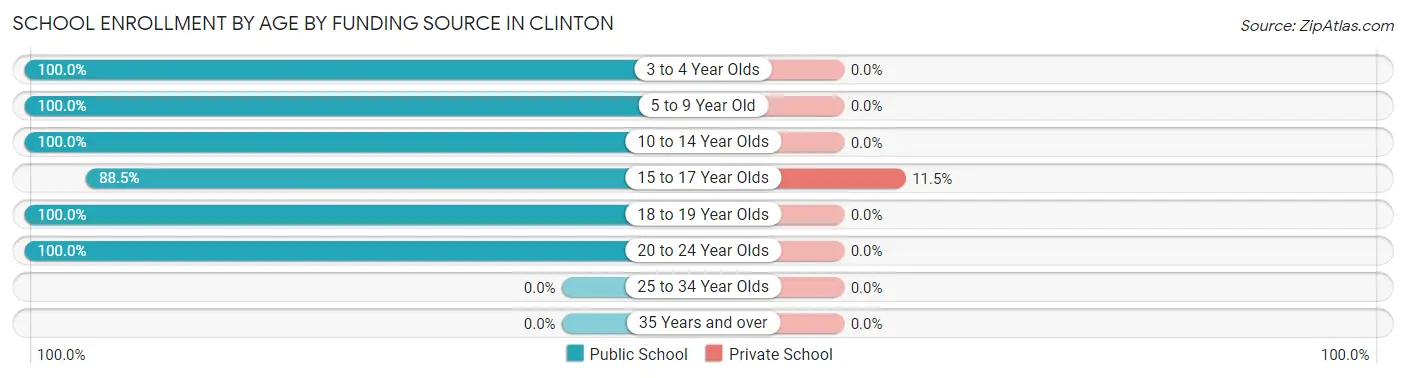
| Age Bracket | Public School | Private School |
| 3 to 4 Year Olds | 68 (100.0%) | 0 (0.0%) |
| 5 to 9 Year Old | 408 (100.0%) | 0 (0.0%) |
| 10 to 14 Year Olds | 186 (100.0%) | 0 (0.0%) |
| 15 to 17 Year Olds | 139 (88.5%) | 18 (11.5%) |
| 18 to 19 Year Olds | 88 (100.0%) | 0 (0.0%) |
| 20 to 24 Year Olds | 40 (100.0%) | 0 (0.0%) |
| 25 to 34 Year Olds | 0 (0.0%) | 0 (0.0%) |
| 35 Years and over | 0 (0.0%) | 0 (0.0%) |
| Total | 929 (98.1%) | 18 (1.9%) |
Educational Attainment by Field of Study in Clinton
Education (201 | 33.3%), business (163 | 27.0%), arts & humanities (70 | 11.6%), science & technology (67 | 11.1%), and visual & performing arts (50 | 8.3%) are the most common fields of study among 603 individuals in Clinton who have obtained a bachelor's degree or higher.
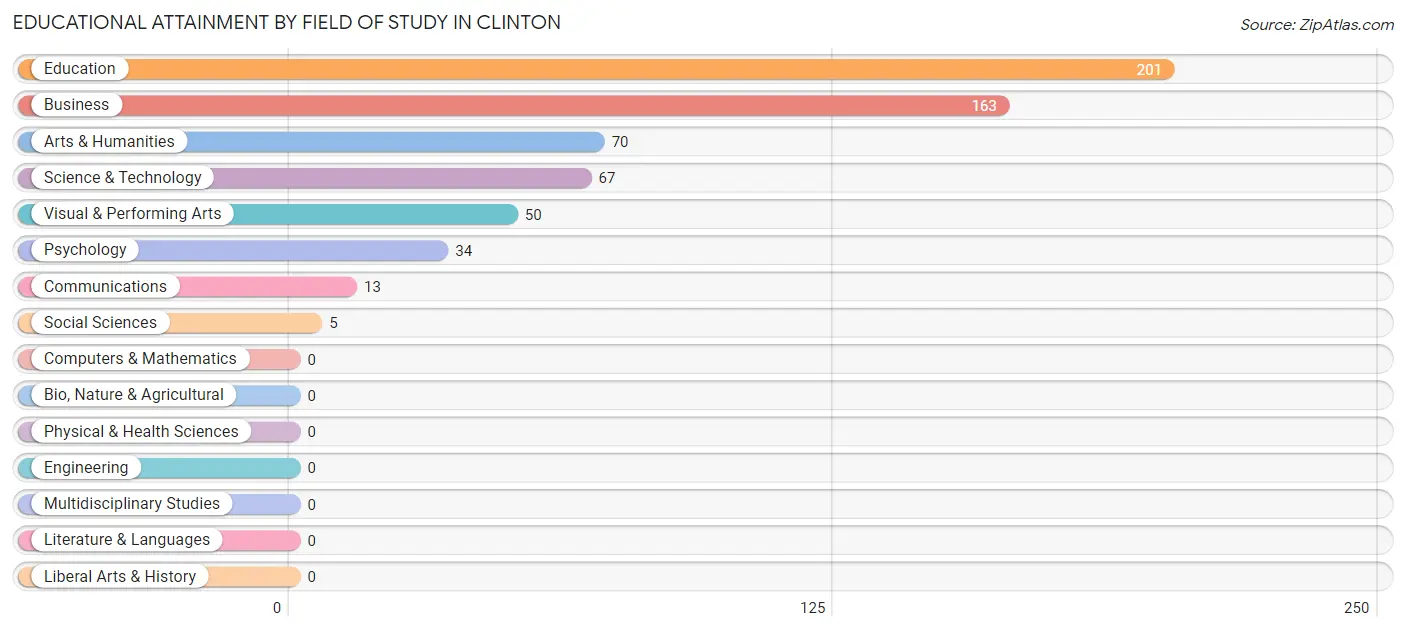
| Field of Study | # Graduates | % Graduates |
| Computers & Mathematics | 0 | 0.0% |
| Bio, Nature & Agricultural | 0 | 0.0% |
| Physical & Health Sciences | 0 | 0.0% |
| Psychology | 34 | 5.6% |
| Social Sciences | 5 | 0.8% |
| Engineering | 0 | 0.0% |
| Multidisciplinary Studies | 0 | 0.0% |
| Science & Technology | 67 | 11.1% |
| Business | 163 | 27.0% |
| Education | 201 | 33.3% |
| Literature & Languages | 0 | 0.0% |
| Liberal Arts & History | 0 | 0.0% |
| Visual & Performing Arts | 50 | 8.3% |
| Communications | 13 | 2.2% |
| Arts & Humanities | 70 | 11.6% |
| Total | 603 | 100.0% |
Transportation & Commute in Clinton
Vehicle Availability by Sex in Clinton
The most prevalent vehicle ownership categories in Clinton are males with 2 vehicles (467, accounting for 40.8%) and females with 2 vehicles (315, making up 55.9%).
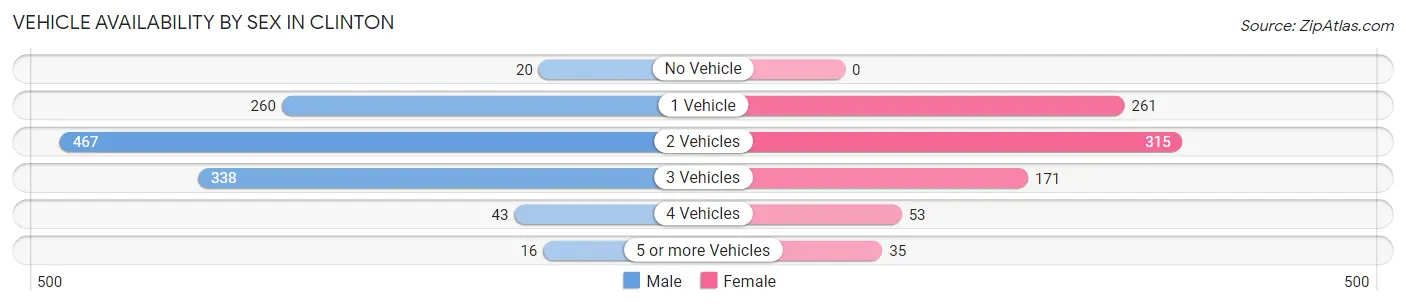
| Vehicles Available | Male | Female |
| No Vehicle | 20 (1.8%) | 0 (0.0%) |
| 1 Vehicle | 260 (22.7%) | 261 (31.3%) |
| 2 Vehicles | 467 (40.8%) | 315 (37.7%) |
| 3 Vehicles | 338 (29.5%) | 171 (20.5%) |
| 4 Vehicles | 43 (3.8%) | 53 (6.4%) |
| 5 or more Vehicles | 16 (1.4%) | 35 (4.2%) |
| Total | 1,144 (100.0%) | 835 (100.0%) |
Commute Time in Clinton
The most frequently occuring commute durations in Clinton are 20 to 24 minutes (445 commuters, 26.0%), 30 to 34 minutes (327 commuters, 19.1%), and 5 to 9 minutes (222 commuters, 13.0%).
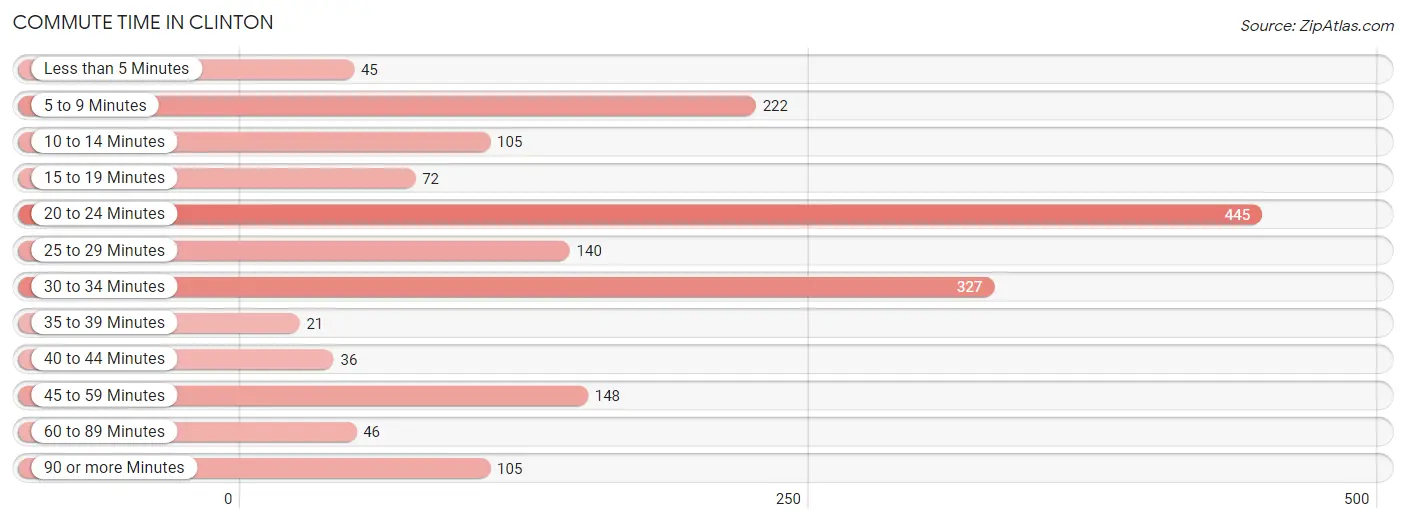
| Commute Time | # Commuters | % Commuters |
| Less than 5 Minutes | 45 | 2.6% |
| 5 to 9 Minutes | 222 | 13.0% |
| 10 to 14 Minutes | 105 | 6.1% |
| 15 to 19 Minutes | 72 | 4.2% |
| 20 to 24 Minutes | 445 | 26.0% |
| 25 to 29 Minutes | 140 | 8.2% |
| 30 to 34 Minutes | 327 | 19.1% |
| 35 to 39 Minutes | 21 | 1.2% |
| 40 to 44 Minutes | 36 | 2.1% |
| 45 to 59 Minutes | 148 | 8.6% |
| 60 to 89 Minutes | 46 | 2.7% |
| 90 or more Minutes | 105 | 6.1% |
Commute Time by Sex in Clinton
The most common commute times in Clinton are 30 to 34 minutes (235 commuters, 23.3%) for males and 20 to 24 minutes (225 commuters, 32.0%) for females.
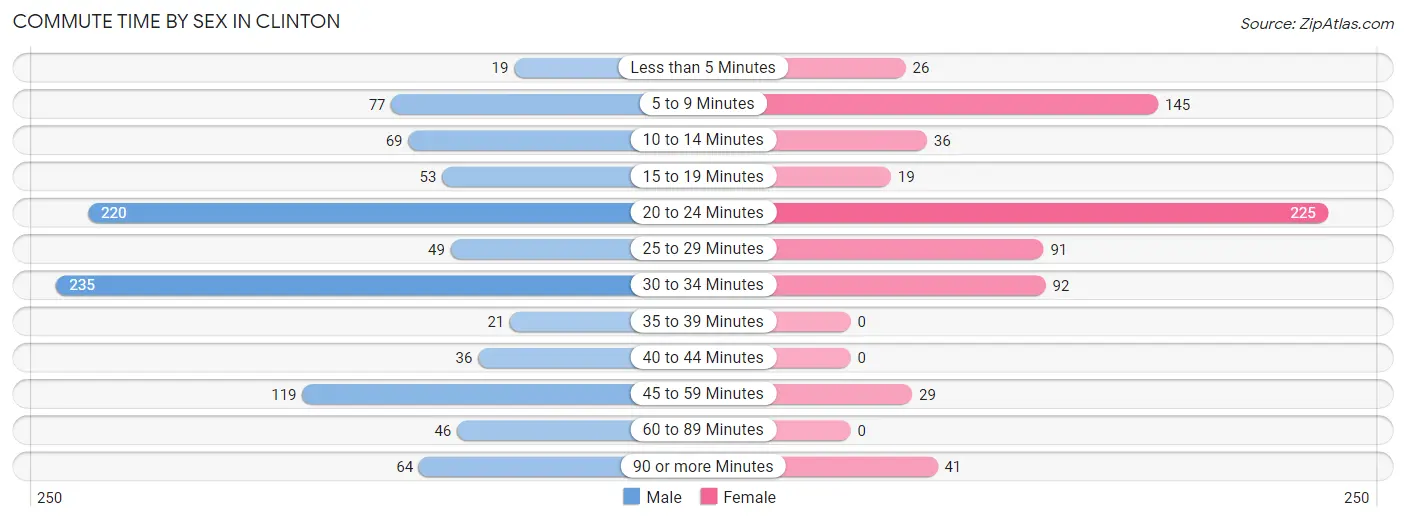
| Commute Time | Male | Female |
| Less than 5 Minutes | 19 (1.9%) | 26 (3.7%) |
| 5 to 9 Minutes | 77 (7.6%) | 145 (20.6%) |
| 10 to 14 Minutes | 69 (6.9%) | 36 (5.1%) |
| 15 to 19 Minutes | 53 (5.3%) | 19 (2.7%) |
| 20 to 24 Minutes | 220 (21.8%) | 225 (32.0%) |
| 25 to 29 Minutes | 49 (4.9%) | 91 (12.9%) |
| 30 to 34 Minutes | 235 (23.3%) | 92 (13.1%) |
| 35 to 39 Minutes | 21 (2.1%) | 0 (0.0%) |
| 40 to 44 Minutes | 36 (3.6%) | 0 (0.0%) |
| 45 to 59 Minutes | 119 (11.8%) | 29 (4.1%) |
| 60 to 89 Minutes | 46 (4.6%) | 0 (0.0%) |
| 90 or more Minutes | 64 (6.4%) | 41 (5.8%) |
Time of Departure to Work by Sex in Clinton
The most frequent times of departure to work in Clinton are 8:00 AM to 8:29 AM (186, 18.4%) for males and 8:00 AM to 8:29 AM (134, 19.0%) for females.
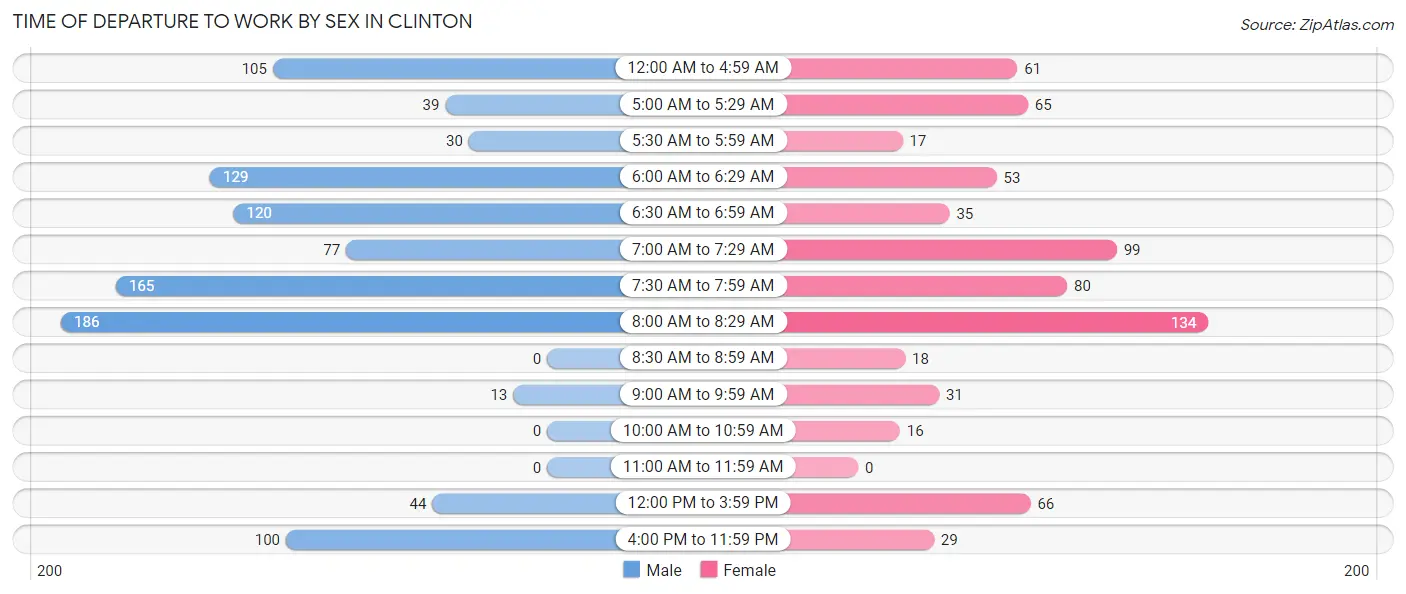
| Time of Departure | Male | Female |
| 12:00 AM to 4:59 AM | 105 (10.4%) | 61 (8.7%) |
| 5:00 AM to 5:29 AM | 39 (3.9%) | 65 (9.2%) |
| 5:30 AM to 5:59 AM | 30 (3.0%) | 17 (2.4%) |
| 6:00 AM to 6:29 AM | 129 (12.8%) | 53 (7.5%) |
| 6:30 AM to 6:59 AM | 120 (11.9%) | 35 (5.0%) |
| 7:00 AM to 7:29 AM | 77 (7.6%) | 99 (14.1%) |
| 7:30 AM to 7:59 AM | 165 (16.4%) | 80 (11.4%) |
| 8:00 AM to 8:29 AM | 186 (18.4%) | 134 (19.0%) |
| 8:30 AM to 8:59 AM | 0 (0.0%) | 18 (2.6%) |
| 9:00 AM to 9:59 AM | 13 (1.3%) | 31 (4.4%) |
| 10:00 AM to 10:59 AM | 0 (0.0%) | 16 (2.3%) |
| 11:00 AM to 11:59 AM | 0 (0.0%) | 0 (0.0%) |
| 12:00 PM to 3:59 PM | 44 (4.4%) | 66 (9.4%) |
| 4:00 PM to 11:59 PM | 100 (9.9%) | 29 (4.1%) |
| Total | 1,008 (100.0%) | 704 (100.0%) |
Housing Occupancy in Clinton
Occupancy by Ownership in Clinton
Of the total 2,060 dwellings in Clinton, owner-occupied units account for 1,215 (59.0%), while renter-occupied units make up 845 (41.0%).
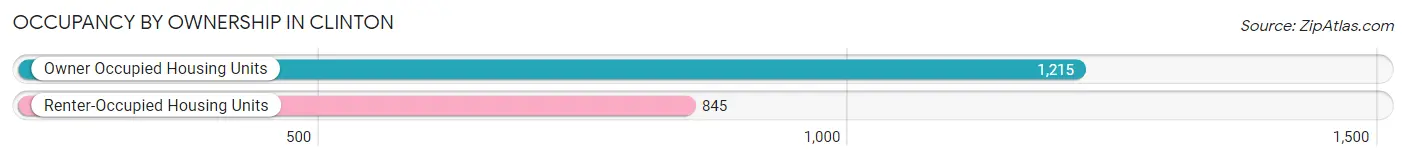
| Occupancy | # Housing Units | % Housing Units |
| Owner Occupied Housing Units | 1,215 | 59.0% |
| Renter-Occupied Housing Units | 845 | 41.0% |
| Total Occupied Housing Units | 2,060 | 100.0% |
Occupancy by Household Size in Clinton
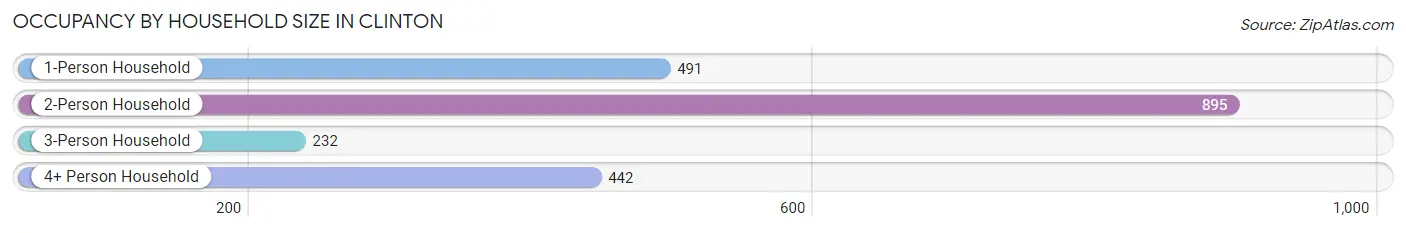
| Household Size | # Housing Units | % Housing Units |
| 1-Person Household | 491 | 23.8% |
| 2-Person Household | 895 | 43.4% |
| 3-Person Household | 232 | 11.3% |
| 4+ Person Household | 442 | 21.5% |
| Total Housing Units | 2,060 | 100.0% |
Occupancy by Ownership by Household Size in Clinton
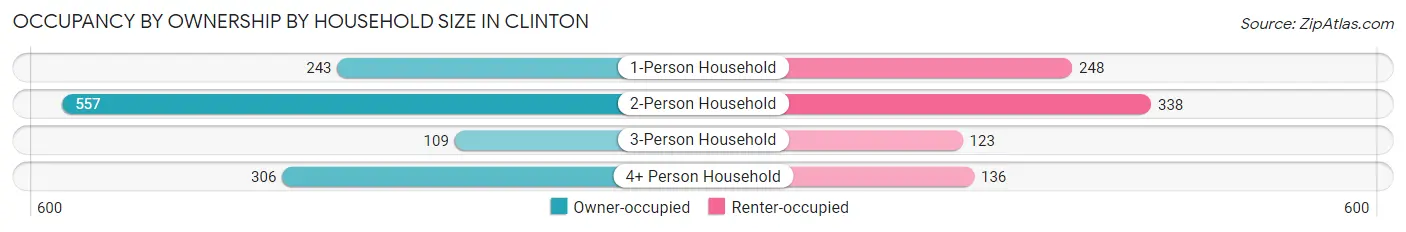
| Household Size | Owner-occupied | Renter-occupied |
| 1-Person Household | 243 (49.5%) | 248 (50.5%) |
| 2-Person Household | 557 (62.2%) | 338 (37.8%) |
| 3-Person Household | 109 (47.0%) | 123 (53.0%) |
| 4+ Person Household | 306 (69.2%) | 136 (30.8%) |
| Total Housing Units | 1,215 (59.0%) | 845 (41.0%) |
Occupancy by Educational Attainment in Clinton
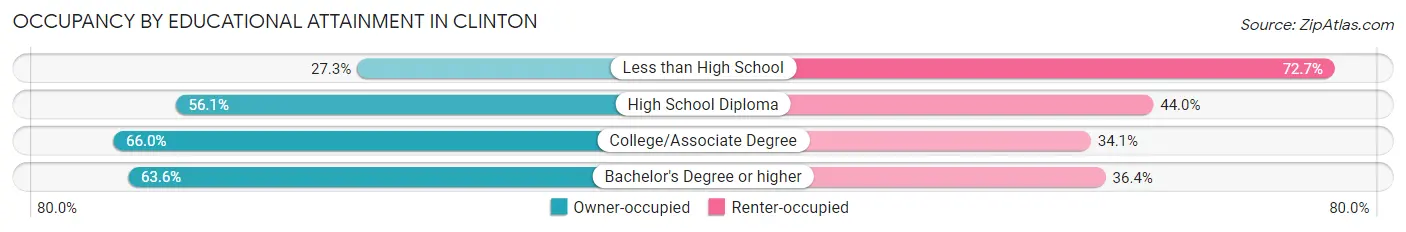
| Household Size | Owner-occupied | Renter-occupied |
| Less than High School | 42 (27.3%) | 112 (72.7%) |
| High School Diploma | 445 (56.0%) | 349 (44.0%) |
| College/Associate Degree | 583 (65.9%) | 301 (34.1%) |
| Bachelor's Degree or higher | 145 (63.6%) | 83 (36.4%) |
Occupancy by Age of Householder in Clinton
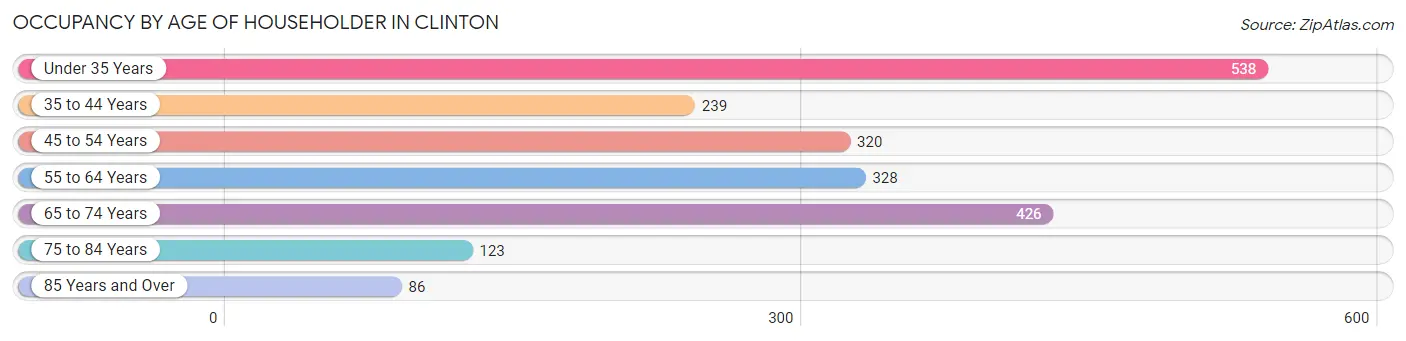
| Age Bracket | # Households | % Households |
| Under 35 Years | 538 | 26.1% |
| 35 to 44 Years | 239 | 11.6% |
| 45 to 54 Years | 320 | 15.5% |
| 55 to 64 Years | 328 | 15.9% |
| 65 to 74 Years | 426 | 20.7% |
| 75 to 84 Years | 123 | 6.0% |
| 85 Years and Over | 86 | 4.2% |
| Total | 2,060 | 100.0% |
Housing Finances in Clinton
Median Income by Occupancy in Clinton
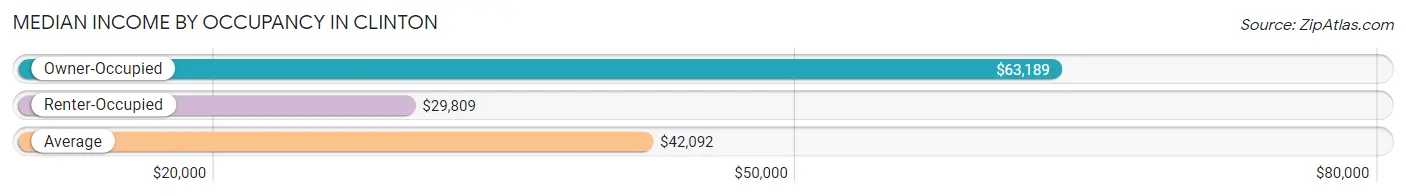
| Occupancy Type | # Households | Median Income |
| Owner-Occupied | 1,215 (59.0%) | $63,189 |
| Renter-Occupied | 845 (41.0%) | $29,809 |
| Average | 2,060 (100.0%) | $42,092 |
Occupancy by Householder Income Bracket in Clinton
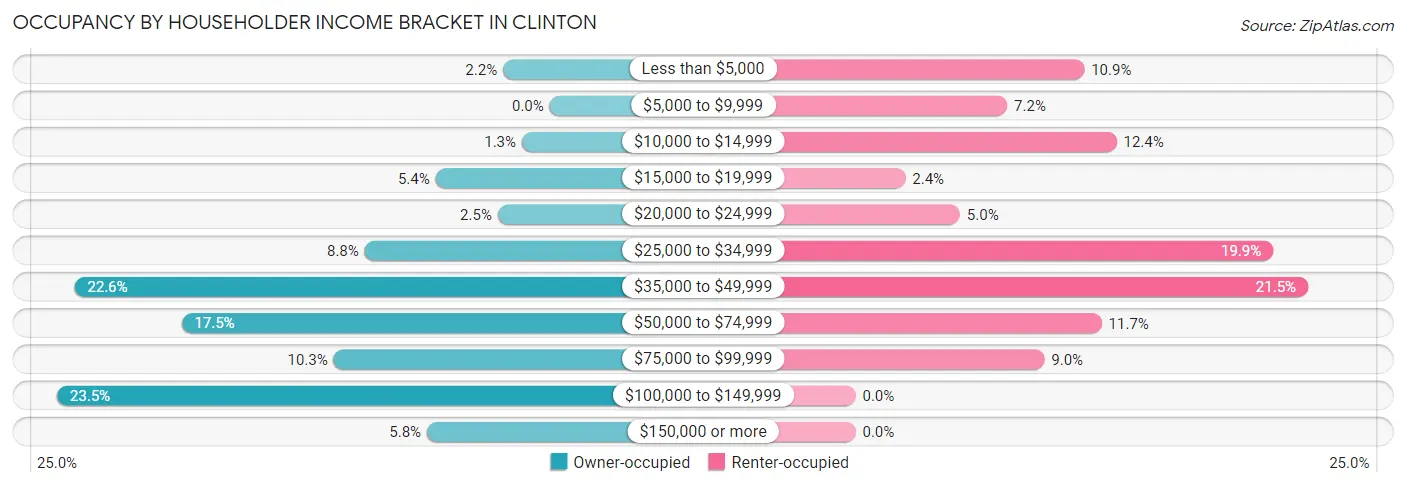
| Income Bracket | Owner-occupied | Renter-occupied |
| Less than $5,000 | 27 (2.2%) | 92 (10.9%) |
| $5,000 to $9,999 | 0 (0.0%) | 61 (7.2%) |
| $10,000 to $14,999 | 16 (1.3%) | 105 (12.4%) |
| $15,000 to $19,999 | 66 (5.4%) | 20 (2.4%) |
| $20,000 to $24,999 | 30 (2.5%) | 42 (5.0%) |
| $25,000 to $34,999 | 107 (8.8%) | 168 (19.9%) |
| $35,000 to $49,999 | 275 (22.6%) | 182 (21.5%) |
| $50,000 to $74,999 | 213 (17.5%) | 99 (11.7%) |
| $75,000 to $99,999 | 125 (10.3%) | 76 (9.0%) |
| $100,000 to $149,999 | 285 (23.5%) | 0 (0.0%) |
| $150,000 or more | 71 (5.8%) | 0 (0.0%) |
| Total | 1,215 (100.0%) | 845 (100.0%) |
Monthly Housing Cost Tiers in Clinton
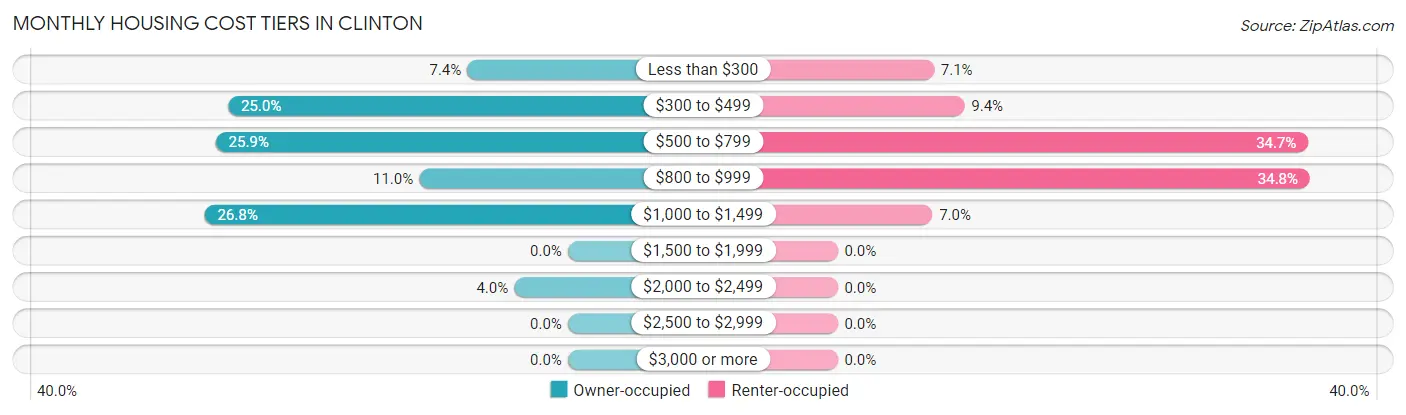
| Monthly Cost | Owner-occupied | Renter-occupied |
| Less than $300 | 90 (7.4%) | 60 (7.1%) |
| $300 to $499 | 304 (25.0%) | 79 (9.3%) |
| $500 to $799 | 315 (25.9%) | 293 (34.7%) |
| $800 to $999 | 133 (11.0%) | 294 (34.8%) |
| $1,000 to $1,499 | 325 (26.8%) | 59 (7.0%) |
| $1,500 to $1,999 | 0 (0.0%) | 0 (0.0%) |
| $2,000 to $2,499 | 48 (4.0%) | 0 (0.0%) |
| $2,500 to $2,999 | 0 (0.0%) | 0 (0.0%) |
| $3,000 or more | 0 (0.0%) | 0 (0.0%) |
| Total | 1,215 (100.0%) | 845 (100.0%) |
Physical Housing Characteristics in Clinton
Housing Structures in Clinton
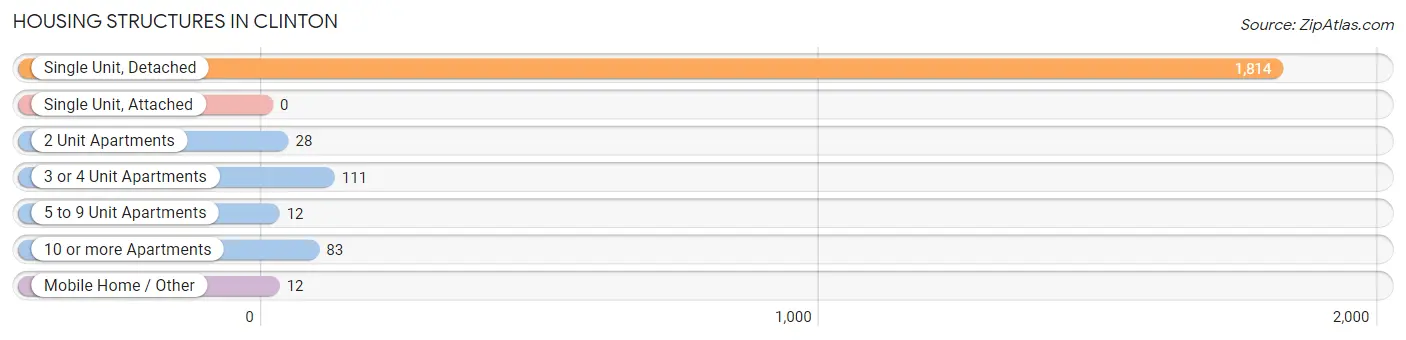
| Structure Type | # Housing Units | % Housing Units |
| Single Unit, Detached | 1,814 | 88.1% |
| Single Unit, Attached | 0 | 0.0% |
| 2 Unit Apartments | 28 | 1.4% |
| 3 or 4 Unit Apartments | 111 | 5.4% |
| 5 to 9 Unit Apartments | 12 | 0.6% |
| 10 or more Apartments | 83 | 4.0% |
| Mobile Home / Other | 12 | 0.6% |
| Total | 2,060 | 100.0% |
Housing Structures by Occupancy in Clinton
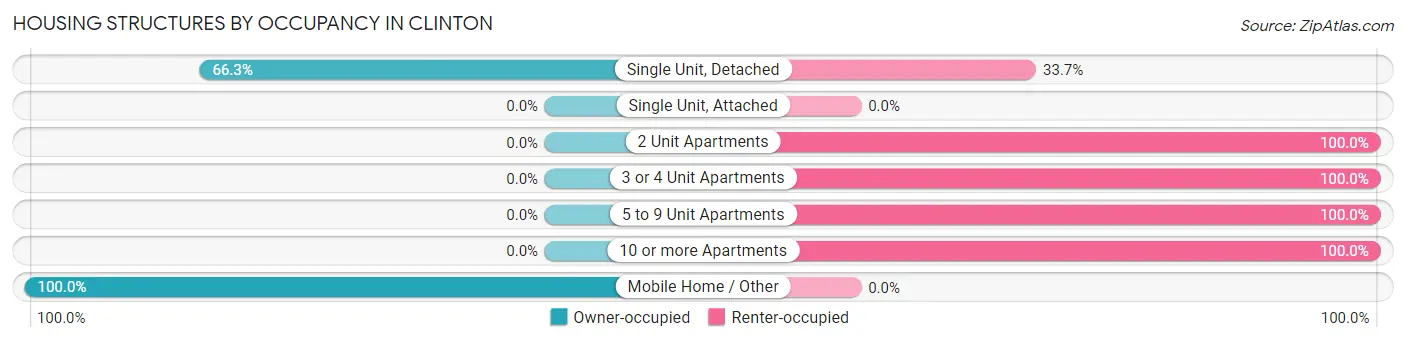
| Structure Type | Owner-occupied | Renter-occupied |
| Single Unit, Detached | 1,203 (66.3%) | 611 (33.7%) |
| Single Unit, Attached | 0 (0.0%) | 0 (0.0%) |
| 2 Unit Apartments | 0 (0.0%) | 28 (100.0%) |
| 3 or 4 Unit Apartments | 0 (0.0%) | 111 (100.0%) |
| 5 to 9 Unit Apartments | 0 (0.0%) | 12 (100.0%) |
| 10 or more Apartments | 0 (0.0%) | 83 (100.0%) |
| Mobile Home / Other | 12 (100.0%) | 0 (0.0%) |
| Total | 1,215 (59.0%) | 845 (41.0%) |
Housing Structures by Number of Rooms in Clinton
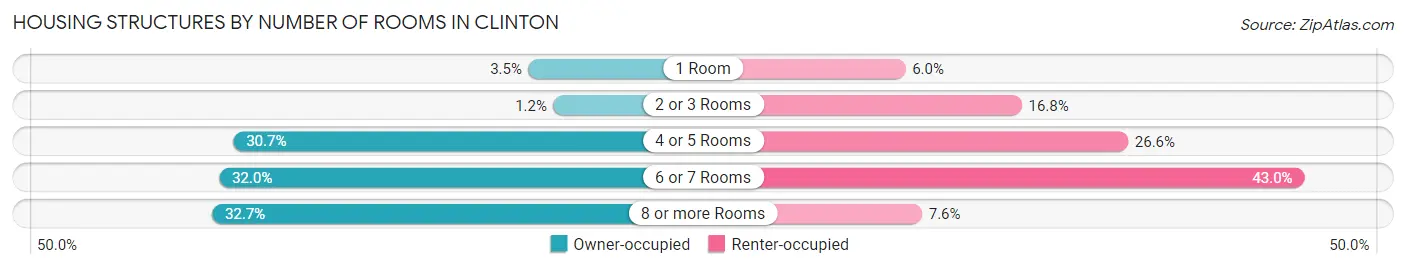
| Number of Rooms | Owner-occupied | Renter-occupied |
| 1 Room | 42 (3.5%) | 51 (6.0%) |
| 2 or 3 Rooms | 14 (1.1%) | 142 (16.8%) |
| 4 or 5 Rooms | 373 (30.7%) | 225 (26.6%) |
| 6 or 7 Rooms | 389 (32.0%) | 363 (43.0%) |
| 8 or more Rooms | 397 (32.7%) | 64 (7.6%) |
| Total | 1,215 (100.0%) | 845 (100.0%) |
Housing Structure by Heating Type in Clinton
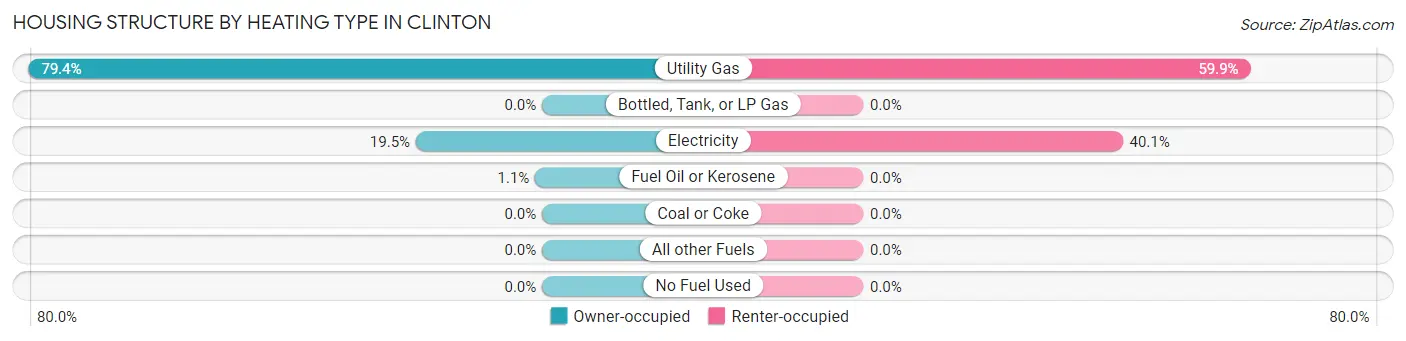
| Heating Type | Owner-occupied | Renter-occupied |
| Utility Gas | 965 (79.4%) | 506 (59.9%) |
| Bottled, Tank, or LP Gas | 0 (0.0%) | 0 (0.0%) |
| Electricity | 237 (19.5%) | 339 (40.1%) |
| Fuel Oil or Kerosene | 13 (1.1%) | 0 (0.0%) |
| Coal or Coke | 0 (0.0%) | 0 (0.0%) |
| All other Fuels | 0 (0.0%) | 0 (0.0%) |
| No Fuel Used | 0 (0.0%) | 0 (0.0%) |
| Total | 1,215 (100.0%) | 845 (100.0%) |
Household Vehicle Usage in Clinton
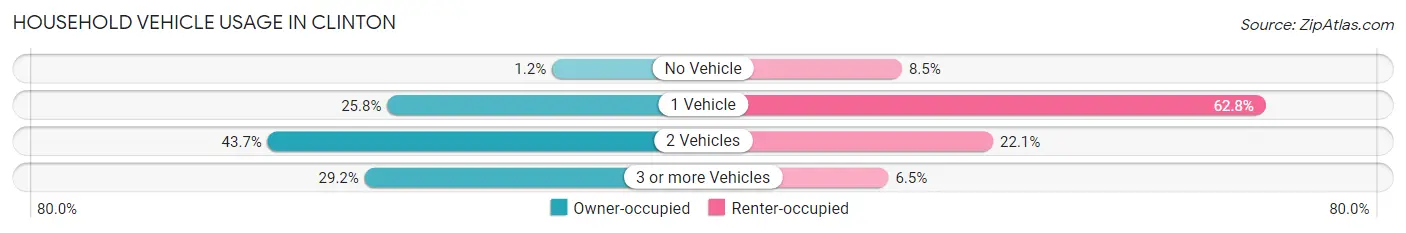
| Vehicles per Household | Owner-occupied | Renter-occupied |
| No Vehicle | 15 (1.2%) | 72 (8.5%) |
| 1 Vehicle | 314 (25.8%) | 531 (62.8%) |
| 2 Vehicles | 531 (43.7%) | 187 (22.1%) |
| 3 or more Vehicles | 355 (29.2%) | 55 (6.5%) |
| Total | 1,215 (100.0%) | 845 (100.0%) |
Real Estate & Mortgages in Clinton
Real Estate and Mortgage Overview in Clinton
| Characteristic | Without Mortgage | With Mortgage |
| Housing Units | 617 | 598 |
| Median Property Value | $87,600 | $90,700 |
| Median Household Income | $59,539 | $59 |
| Monthly Housing Costs | $463 | $0 |
| Real Estate Taxes | $599 | $0 |
Property Value by Mortgage Status in Clinton
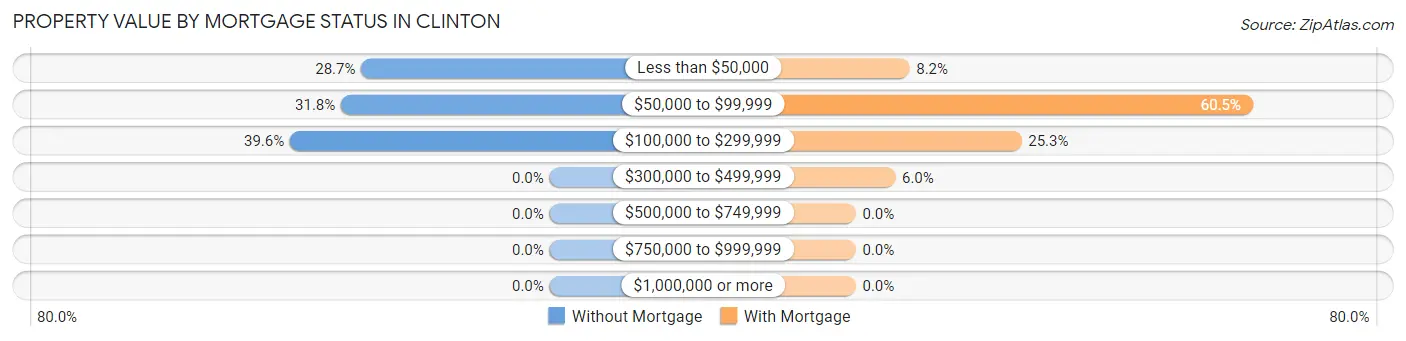
| Property Value | Without Mortgage | With Mortgage |
| Less than $50,000 | 177 (28.7%) | 49 (8.2%) |
| $50,000 to $99,999 | 196 (31.8%) | 362 (60.5%) |
| $100,000 to $299,999 | 244 (39.6%) | 151 (25.3%) |
| $300,000 to $499,999 | 0 (0.0%) | 36 (6.0%) |
| $500,000 to $749,999 | 0 (0.0%) | 0 (0.0%) |
| $750,000 to $999,999 | 0 (0.0%) | 0 (0.0%) |
| $1,000,000 or more | 0 (0.0%) | 0 (0.0%) |
| Total | 617 (100.0%) | 598 (100.0%) |
Household Income by Mortgage Status in Clinton
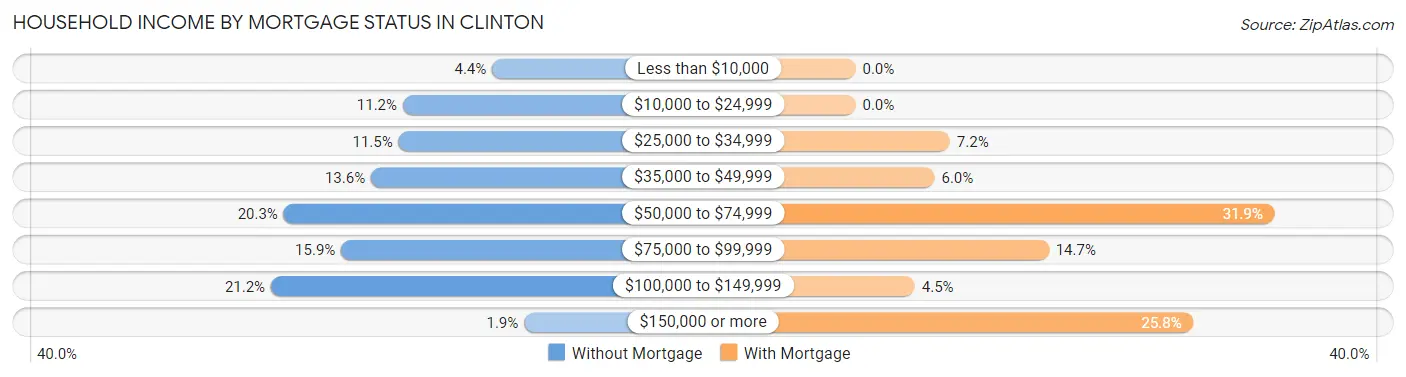
| Household Income | Without Mortgage | With Mortgage |
| Less than $10,000 | 27 (4.4%) | 0 (0.0%) |
| $10,000 to $24,999 | 69 (11.2%) | 0 (0.0%) |
| $25,000 to $34,999 | 71 (11.5%) | 43 (7.2%) |
| $35,000 to $49,999 | 84 (13.6%) | 36 (6.0%) |
| $50,000 to $74,999 | 125 (20.3%) | 191 (31.9%) |
| $75,000 to $99,999 | 98 (15.9%) | 88 (14.7%) |
| $100,000 to $149,999 | 131 (21.2%) | 27 (4.5%) |
| $150,000 or more | 12 (1.9%) | 154 (25.8%) |
| Total | 617 (100.0%) | 598 (100.0%) |
Property Value to Household Income Ratio in Clinton
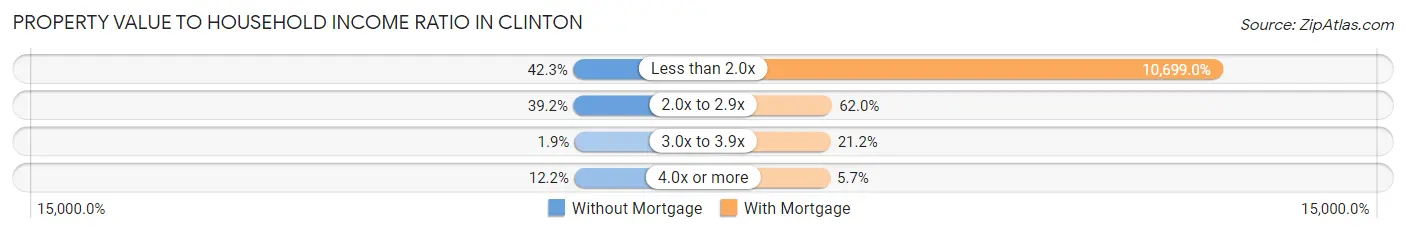
| Value-to-Income Ratio | Without Mortgage | With Mortgage |
| Less than 2.0x | 261 (42.3%) | 63,980 (10,699.0%) |
| 2.0x to 2.9x | 242 (39.2%) | 371 (62.0%) |
| 3.0x to 3.9x | 12 (1.9%) | 127 (21.2%) |
| 4.0x or more | 75 (12.2%) | 34 (5.7%) |
| Total | 617 (100.0%) | 598 (100.0%) |
Real Estate Taxes by Mortgage Status in Clinton
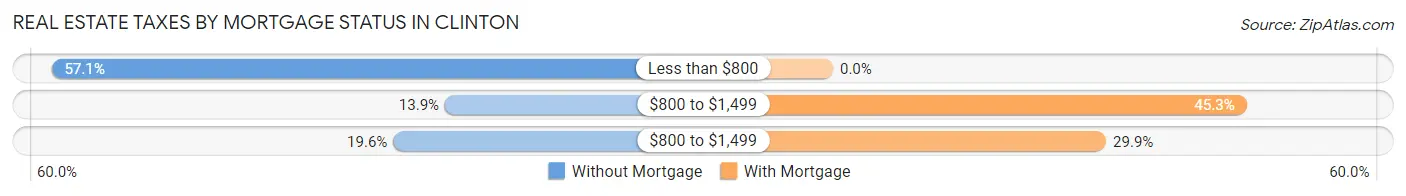
| Property Taxes | Without Mortgage | With Mortgage |
| Less than $800 | 352 (57.1%) | 0 (0.0%) |
| $800 to $1,499 | 86 (13.9%) | 271 (45.3%) |
| $800 to $1,499 | 121 (19.6%) | 179 (29.9%) |
| Total | 617 (100.0%) | 598 (100.0%) |
Health & Disability in Clinton
Health Insurance Coverage by Age in Clinton
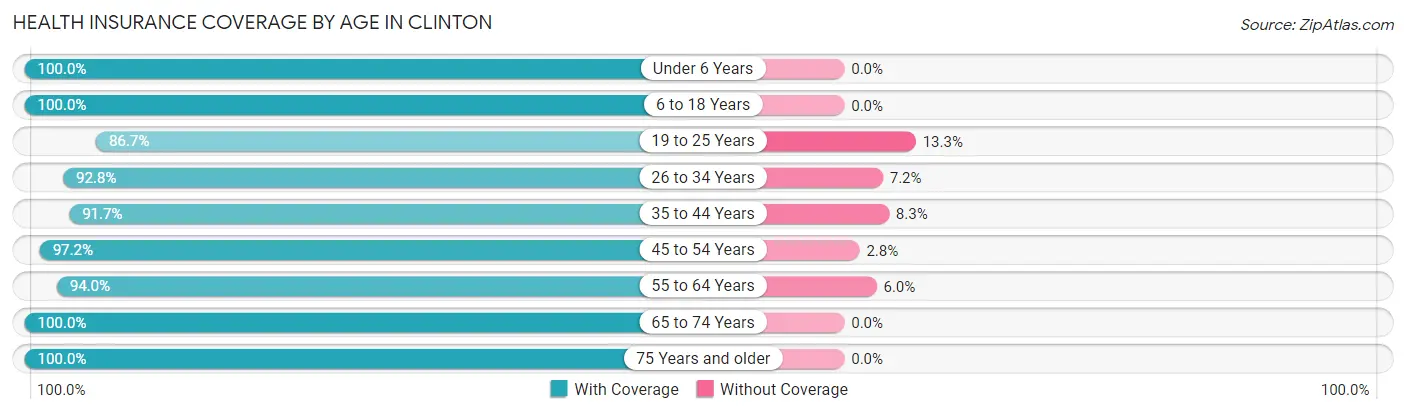
| Age Bracket | With Coverage | Without Coverage |
| Under 6 Years | 323 (100.0%) | 0 (0.0%) |
| 6 to 18 Years | 752 (100.0%) | 0 (0.0%) |
| 19 to 25 Years | 384 (86.7%) | 59 (13.3%) |
| 26 to 34 Years | 517 (92.8%) | 40 (7.2%) |
| 35 to 44 Years | 496 (91.7%) | 45 (8.3%) |
| 45 to 54 Years | 446 (97.2%) | 13 (2.8%) |
| 55 to 64 Years | 579 (94.0%) | 37 (6.0%) |
| 65 to 74 Years | 601 (100.0%) | 0 (0.0%) |
| 75 Years and older | 328 (100.0%) | 0 (0.0%) |
| Total | 4,426 (95.8%) | 194 (4.2%) |
Health Insurance Coverage by Citizenship Status in Clinton
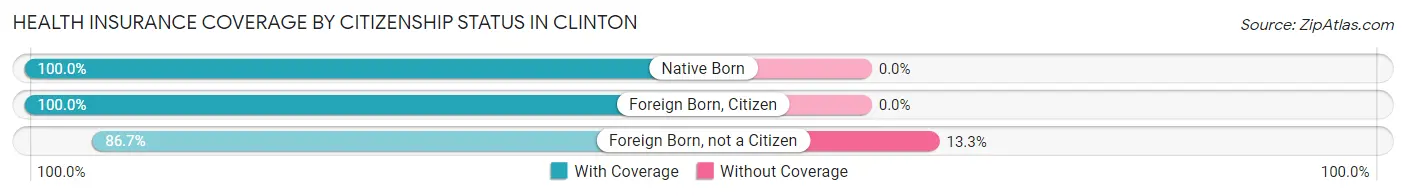
| Citizenship Status | With Coverage | Without Coverage |
| Native Born | 323 (100.0%) | 0 (0.0%) |
| Foreign Born, Citizen | 752 (100.0%) | 0 (0.0%) |
| Foreign Born, not a Citizen | 384 (86.7%) | 59 (13.3%) |
Health Insurance Coverage by Household Income in Clinton
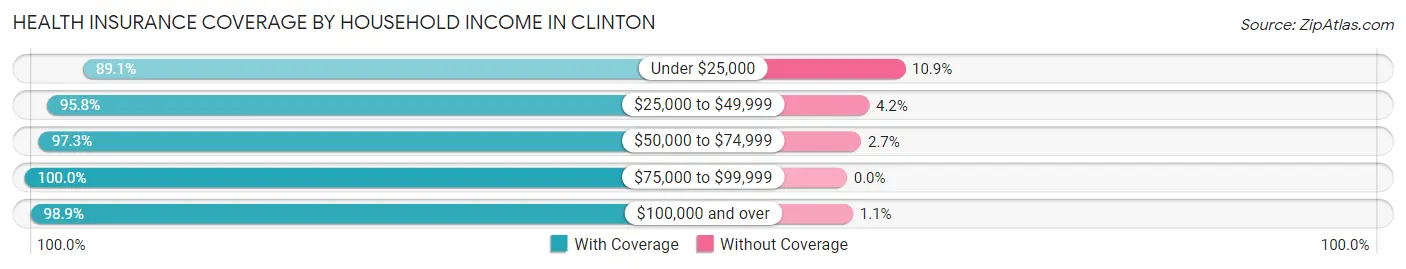
| Household Income | With Coverage | Without Coverage |
| Under $25,000 | 800 (89.1%) | 98 (10.9%) |
| $25,000 to $49,999 | 1,516 (95.8%) | 66 (4.2%) |
| $50,000 to $74,999 | 693 (97.3%) | 19 (2.7%) |
| $75,000 to $99,999 | 446 (100.0%) | 0 (0.0%) |
| $100,000 and over | 966 (98.9%) | 11 (1.1%) |
Public vs Private Health Insurance Coverage by Age in Clinton
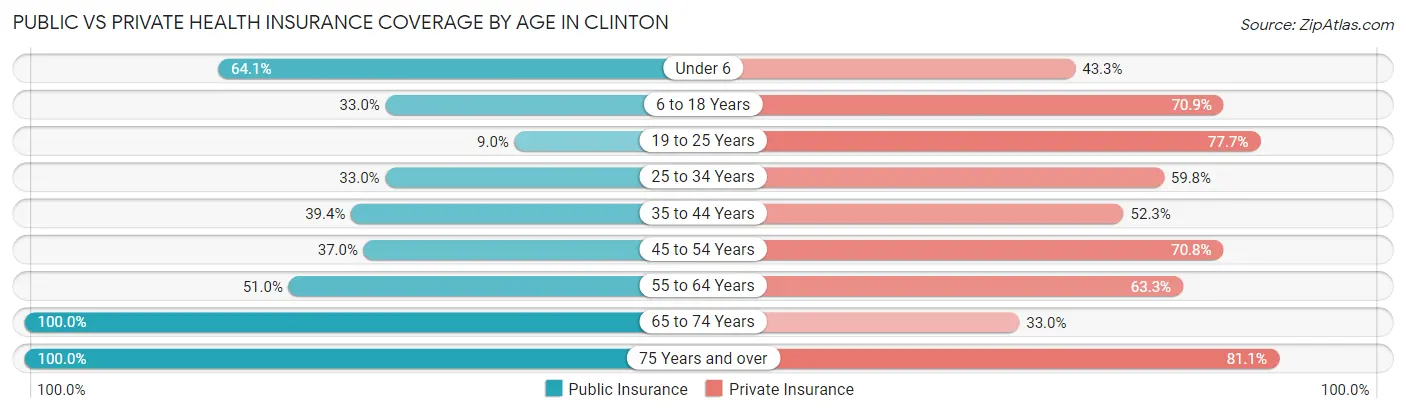
| Age Bracket | Public Insurance | Private Insurance |
| Under 6 | 207 (64.1%) | 140 (43.3%) |
| 6 to 18 Years | 248 (33.0%) | 533 (70.9%) |
| 19 to 25 Years | 40 (9.0%) | 344 (77.6%) |
| 25 to 34 Years | 184 (33.0%) | 333 (59.8%) |
| 35 to 44 Years | 213 (39.4%) | 283 (52.3%) |
| 45 to 54 Years | 170 (37.0%) | 325 (70.8%) |
| 55 to 64 Years | 314 (51.0%) | 390 (63.3%) |
| 65 to 74 Years | 601 (100.0%) | 198 (33.0%) |
| 75 Years and over | 328 (100.0%) | 266 (81.1%) |
| Total | 2,305 (49.9%) | 2,812 (60.9%) |
Disability Status by Sex by Age in Clinton
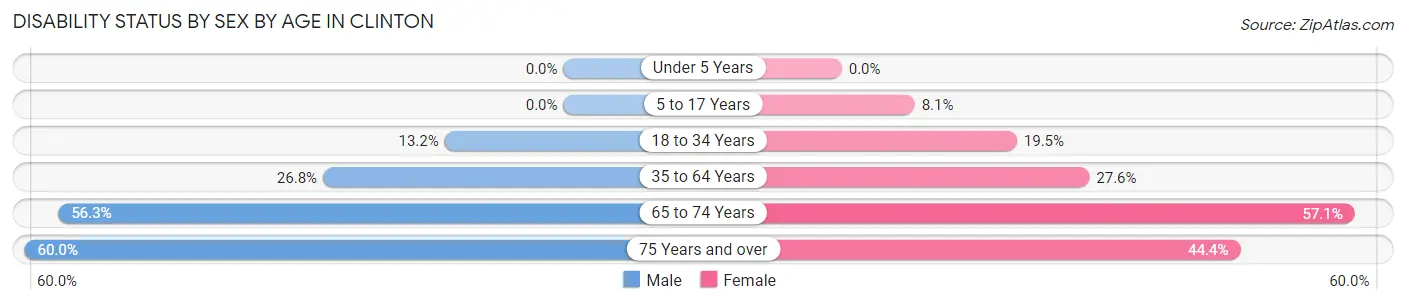
| Age Bracket | Male | Female |
| Under 5 Years | 0 (0.0%) | 0 (0.0%) |
| 5 to 17 Years | 0 (0.0%) | 32 (8.1%) |
| 18 to 34 Years | 75 (13.2%) | 94 (19.5%) |
| 35 to 64 Years | 222 (26.8%) | 217 (27.6%) |
| 65 to 74 Years | 144 (56.2%) | 197 (57.1%) |
| 75 Years and over | 90 (60.0%) | 79 (44.4%) |
Disability Class by Sex by Age in Clinton
Disability Class: Hearing Difficulty
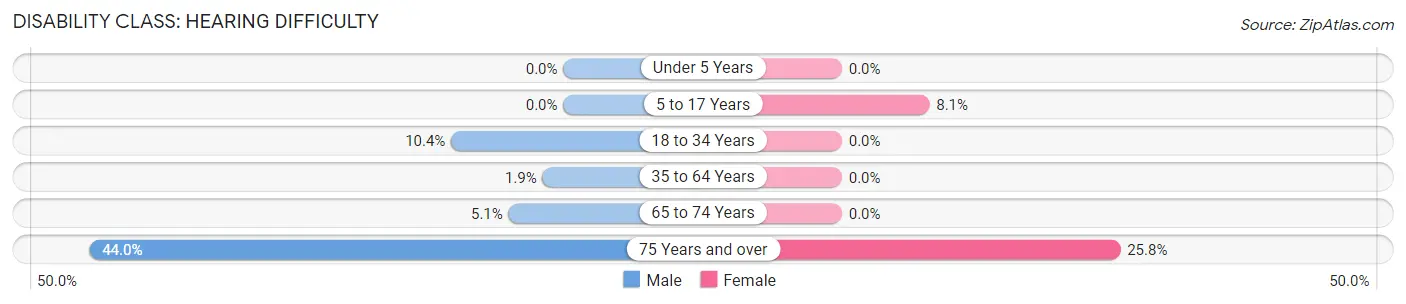
| Age Bracket | Male | Female |
| Under 5 Years | 0 (0.0%) | 0 (0.0%) |
| 5 to 17 Years | 0 (0.0%) | 32 (8.1%) |
| 18 to 34 Years | 59 (10.4%) | 0 (0.0%) |
| 35 to 64 Years | 16 (1.9%) | 0 (0.0%) |
| 65 to 74 Years | 13 (5.1%) | 0 (0.0%) |
| 75 Years and over | 66 (44.0%) | 46 (25.8%) |
Disability Class: Vision Difficulty
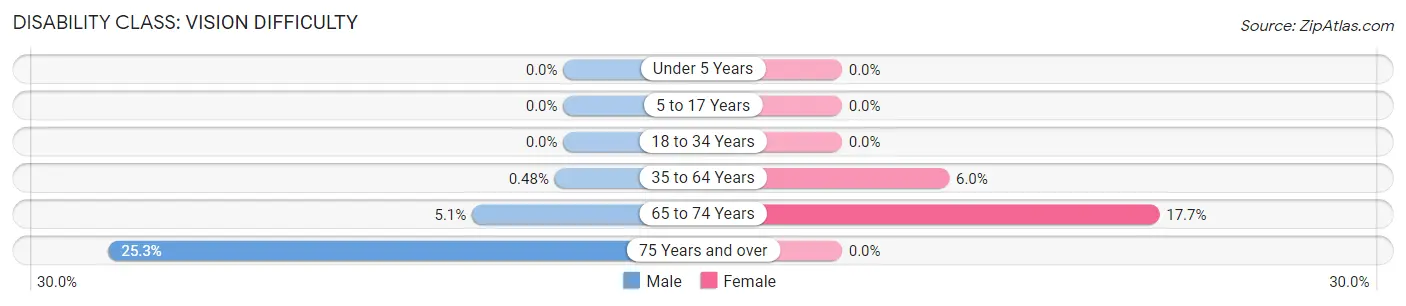
| Age Bracket | Male | Female |
| Under 5 Years | 0 (0.0%) | 0 (0.0%) |
| 5 to 17 Years | 0 (0.0%) | 0 (0.0%) |
| 18 to 34 Years | 0 (0.0%) | 0 (0.0%) |
| 35 to 64 Years | 4 (0.5%) | 47 (6.0%) |
| 65 to 74 Years | 13 (5.1%) | 61 (17.7%) |
| 75 Years and over | 38 (25.3%) | 0 (0.0%) |
Disability Class: Cognitive Difficulty
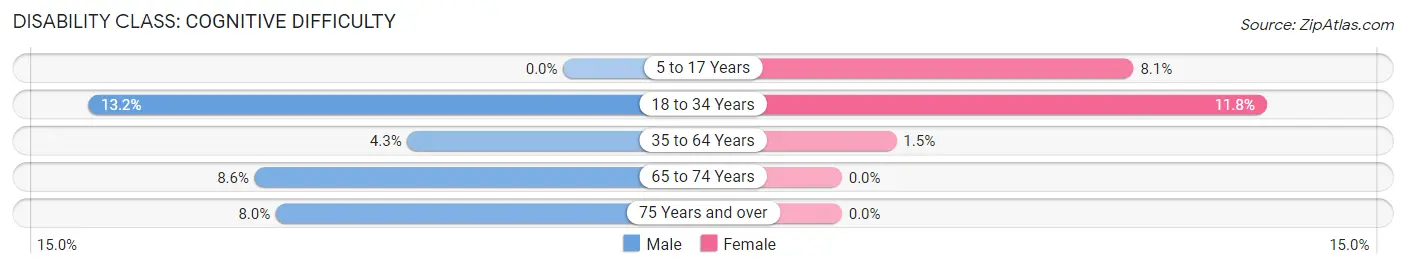
| Age Bracket | Male | Female |
| 5 to 17 Years | 0 (0.0%) | 32 (8.1%) |
| 18 to 34 Years | 75 (13.2%) | 57 (11.8%) |
| 35 to 64 Years | 36 (4.3%) | 12 (1.5%) |
| 65 to 74 Years | 22 (8.6%) | 0 (0.0%) |
| 75 Years and over | 12 (8.0%) | 0 (0.0%) |
Disability Class: Ambulatory Difficulty
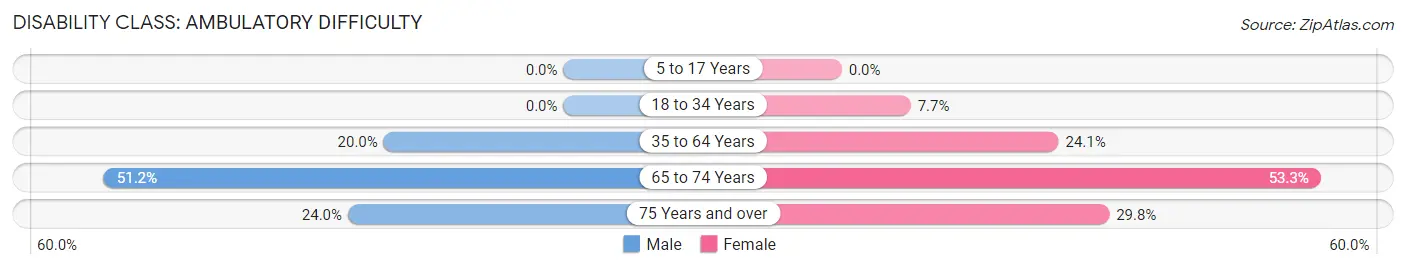
| Age Bracket | Male | Female |
| 5 to 17 Years | 0 (0.0%) | 0 (0.0%) |
| 18 to 34 Years | 0 (0.0%) | 37 (7.7%) |
| 35 to 64 Years | 166 (20.0%) | 190 (24.1%) |
| 65 to 74 Years | 131 (51.2%) | 184 (53.3%) |
| 75 Years and over | 36 (24.0%) | 53 (29.8%) |
Disability Class: Self-Care Difficulty
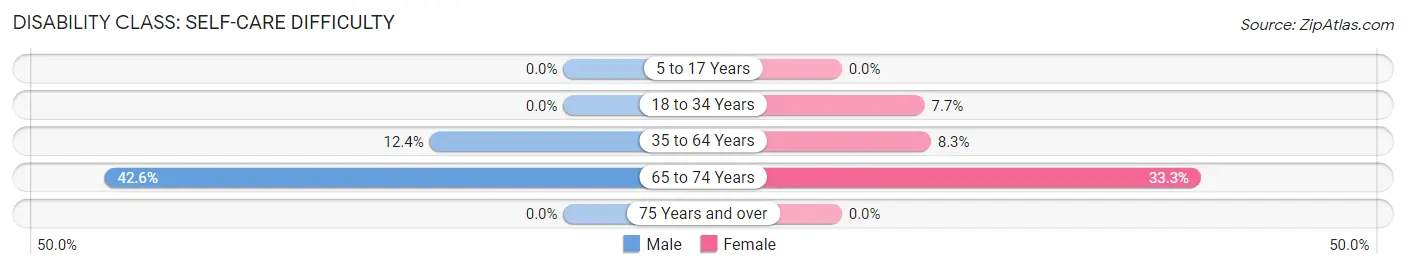
| Age Bracket | Male | Female |
| 5 to 17 Years | 0 (0.0%) | 0 (0.0%) |
| 18 to 34 Years | 0 (0.0%) | 37 (7.7%) |
| 35 to 64 Years | 103 (12.4%) | 65 (8.3%) |
| 65 to 74 Years | 109 (42.6%) | 115 (33.3%) |
| 75 Years and over | 0 (0.0%) | 0 (0.0%) |
Technology Access in Clinton
Computing Device Access in Clinton
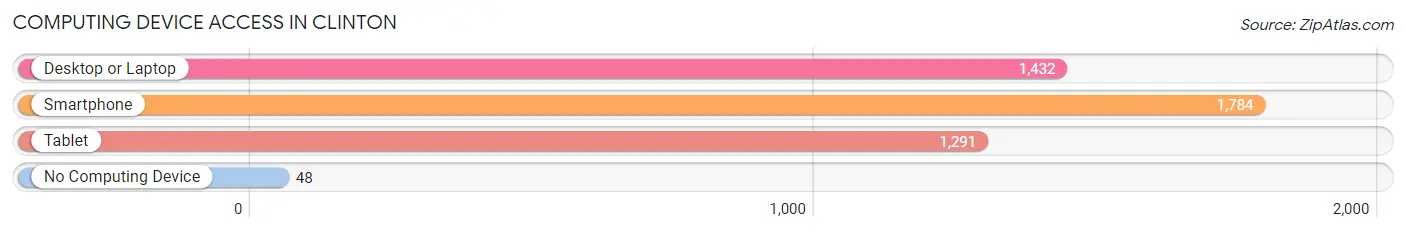
| Device Type | # Households | % Households |
| Desktop or Laptop | 1,432 | 69.5% |
| Smartphone | 1,784 | 86.6% |
| Tablet | 1,291 | 62.7% |
| No Computing Device | 48 | 2.3% |
| Total | 2,060 | 100.0% |
Internet Access in Clinton
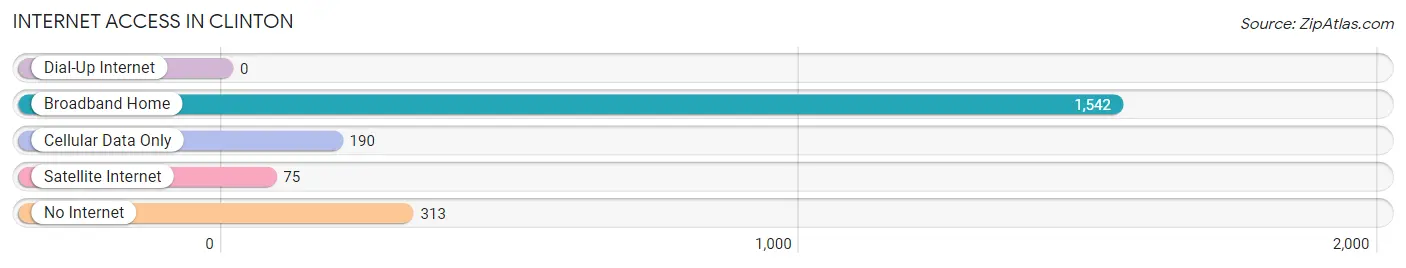
| Internet Type | # Households | % Households |
| Dial-Up Internet | 0 | 0.0% |
| Broadband Home | 1,542 | 74.9% |
| Cellular Data Only | 190 | 9.2% |
| Satellite Internet | 75 | 3.6% |
| No Internet | 313 | 15.2% |
| Total | 2,060 | 100.0% |
Clinton Summary
Clinton, Indiana is a small town located in Vermillion County in the western part of the state. It is situated on the Wabash River, about 25 miles south of Terre Haute. The town was founded in 1829 and has a population of around 2,500 people.
History
The area that is now Clinton was first settled in 1818 by a group of pioneers from Kentucky. The town was originally called Newberry, but was later renamed Clinton in honor of DeWitt Clinton, the former governor of New York. The town was officially incorporated in 1829.
In the early days, Clinton was a thriving river port and a major center for the lumber industry. The town was also home to several factories, including a flour mill, a sawmill, and a woolen mill.
In the late 19th century, Clinton became a major railroad hub. The town was served by the Big Four Railroad, the Wabash Railroad, and the Chicago and Eastern Illinois Railroad. The railroads brought new industry to the town, including a brickyard, a canning factory, and a furniture factory.
Geography
Clinton is located in western Indiana, about 25 miles south of Terre Haute. The town is situated on the Wabash River, which forms the western boundary of the town. The town is surrounded by rolling hills and farmland.
The climate in Clinton is typical of the Midwest, with hot summers and cold winters. The average annual temperature is around 50 degrees Fahrenheit. The average annual precipitation is around 40 inches.
Economy
The economy of Clinton is largely based on agriculture and manufacturing. The town is home to several factories, including a furniture factory, a canning factory, and a brickyard. The town is also home to several small businesses, including restaurants, shops, and service providers.
The town is served by the Big Four Railroad, the Wabash Railroad, and the Chicago and Eastern Illinois Railroad. The railroads provide access to markets in the Midwest and beyond.
Demographics
As of the 2010 census, the population of Clinton was 2,500. The racial makeup of the town was 95.2% White, 1.2% African American, 0.4% Native American, 0.4% Asian, 0.2% Pacific Islander, and 2.6% from other races. The median household income was $37,500.
The town is served by the Clinton Community School Corporation, which includes Clinton Central Elementary School, Clinton Central Middle School, and Clinton Central High School. The town is also home to several churches, including the First United Methodist Church, the First Baptist Church, and the Church of the Nazarene.
Conclusion
Clinton, Indiana is a small town located in Vermillion County in the western part of the state. It is situated on the Wabash River, about 25 miles south of Terre Haute. The town was founded in 1829 and has a population of around 2,500 people. The economy of Clinton is largely based on agriculture and manufacturing, and the town is served by several railroads. The racial makeup of the town is predominantly White, with a small percentage of African American, Native American, Asian, and Pacific Islander residents. The town is served by the Clinton Community School Corporation, and is home to several churches.
Common Questions
What is Per Capita Income in Clinton?
Per Capita income in Clinton is $24,386.
What is the Median Family Income in Clinton?
Median Family Income in Clinton is $56,339.
What is the Median Household income in Clinton?
Median Household Income in Clinton is $42,092.
What is Income or Wage Gap in Clinton?
Income or Wage Gap in Clinton is 33.1%.
Women in Clinton earn 66.9 cents for every dollar earned by a man.
What is Inequality or Gini Index in Clinton?
Inequality or Gini Index in Clinton is 0.42.
What is the Total Population of Clinton?
Total Population of Clinton is 4,821.
What is the Total Male Population of Clinton?
Total Male Population of Clinton is 2,392.
What is the Total Female Population of Clinton?
Total Female Population of Clinton is 2,429.
What is the Ratio of Males per 100 Females in Clinton?
There are 98.48 Males per 100 Females in Clinton.
What is the Ratio of Females per 100 Males in Clinton?
There are 101.55 Females per 100 Males in Clinton.
What is the Median Population Age in Clinton?
Median Population Age in Clinton is 41.1 Years.
What is the Average Family Size in Clinton
Average Family Size in Clinton is 2.6 People.
What is the Average Household Size in Clinton
Average Household Size in Clinton is 2.2 People.
How Large is the Labor Force in Clinton?
There are 2,343 People in the Labor Forcein in Clinton.
What is the Percentage of People in the Labor Force in Clinton?
59.5% of People are in the Labor Force in Clinton.
What is the Unemployment Rate in Clinton?
Unemployment Rate in Clinton is 13.1%.