Corydon, IN Map & Demographics
Corydon Map
Corydon Overview
$28,410
PER CAPITA INCOME
$69,115
AVG FAMILY INCOME
$54,125
AVG HOUSEHOLD INCOME
45.6%
WAGE / INCOME GAP [ % ]
54.4¢/ $1
WAGE / INCOME GAP [ $ ]
0.31
INEQUALITY / GINI INDEX
3,153
TOTAL POPULATION
1,643
MALE POPULATION
1,510
FEMALE POPULATION
108.81
MALES / 100 FEMALES
91.91
FEMALES / 100 MALES
41.7
MEDIAN AGE
3.5
AVG FAMILY SIZE
2.2
AVG HOUSEHOLD SIZE
1,418
LABOR FORCE [ PEOPLE ]
55.5%
PERCENT IN LABOR FORCE
1.6%
UNEMPLOYMENT RATE
Corydon Zip Codes
Corydon Area Codes
Income in Corydon
Income Overview in Corydon
Per Capita Income in Corydon is $28,410, while median incomes of families and households are $69,115 and $54,125 respectively.
| Characteristic | Number | Measure |
| Per Capita Income | 3,153 | $28,410 |
| Median Family Income | 560 | $69,115 |
| Mean Family Income | 560 | $82,409 |
| Median Household Income | 1,315 | $54,125 |
| Mean Household Income | 1,315 | $62,889 |
| Income Deficit | 560 | $0 |
| Wage / Income Gap (%) | 3,153 | 45.57% |
| Wage / Income Gap ($) | 3,153 | 54.43¢ per $1 |
| Gini / Inequality Index | 3,153 | 0.31 |
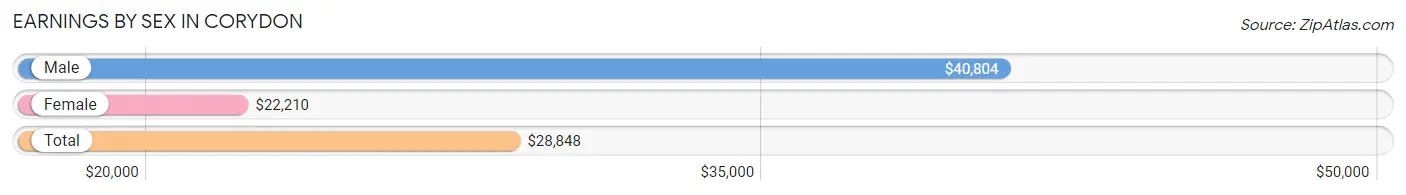
Earnings by Sex in Corydon
Average Earnings in Corydon are $28,848, $40,804 for men and $22,210 for women, a difference of 45.6%.
| Sex | Number | Average Earnings |
| Male | 784 (52.2%) | $40,804 |
| Female | 719 (47.8%) | $22,210 |
| Total | 1,503 (100.0%) | $28,848 |
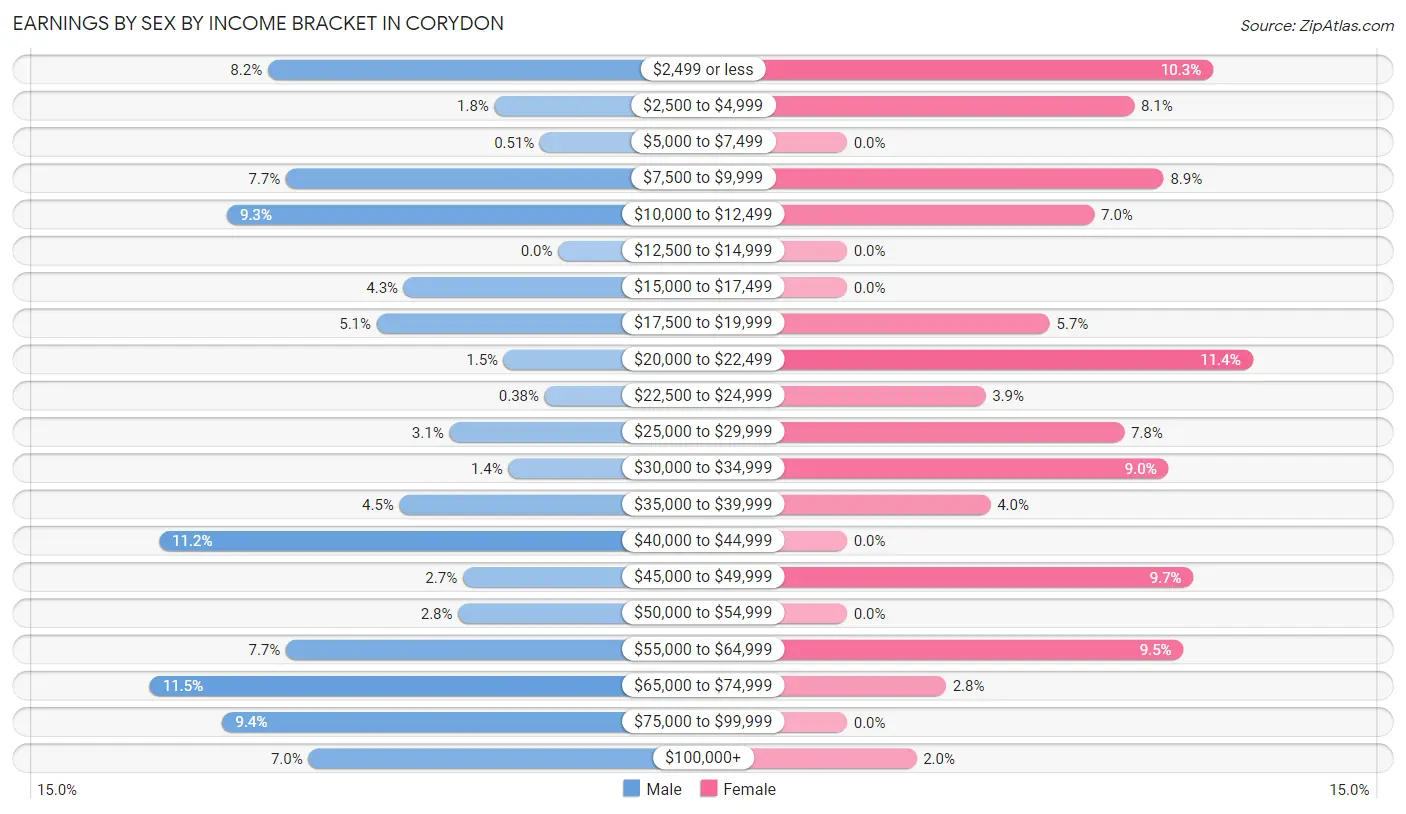
Earnings by Sex by Income Bracket in Corydon
The most common earnings brackets in Corydon are $65,000 to $74,999 for men (90 | 11.5%) and $20,000 to $22,499 for women (82 | 11.4%).
| Income | Male | Female |
| $2,499 or less | 64 (8.2%) | 74 (10.3%) |
| $2,500 to $4,999 | 14 (1.8%) | 58 (8.1%) |
| $5,000 to $7,499 | 4 (0.5%) | 0 (0.0%) |
| $7,500 to $9,999 | 60 (7.6%) | 64 (8.9%) |
| $10,000 to $12,499 | 73 (9.3%) | 50 (7.0%) |
| $12,500 to $14,999 | 0 (0.0%) | 0 (0.0%) |
| $15,000 to $17,499 | 34 (4.3%) | 0 (0.0%) |
| $17,500 to $19,999 | 40 (5.1%) | 41 (5.7%) |
| $20,000 to $22,499 | 12 (1.5%) | 82 (11.4%) |
| $22,500 to $24,999 | 3 (0.4%) | 28 (3.9%) |
| $25,000 to $29,999 | 24 (3.1%) | 56 (7.8%) |
| $30,000 to $34,999 | 11 (1.4%) | 65 (9.0%) |
| $35,000 to $39,999 | 35 (4.5%) | 29 (4.0%) |
| $40,000 to $44,999 | 88 (11.2%) | 0 (0.0%) |
| $45,000 to $49,999 | 21 (2.7%) | 70 (9.7%) |
| $50,000 to $54,999 | 22 (2.8%) | 0 (0.0%) |
| $55,000 to $64,999 | 60 (7.6%) | 68 (9.5%) |
| $65,000 to $74,999 | 90 (11.5%) | 20 (2.8%) |
| $75,000 to $99,999 | 74 (9.4%) | 0 (0.0%) |
| $100,000+ | 55 (7.0%) | 14 (1.9%) |
| Total | 784 (100.0%) | 719 (100.0%) |
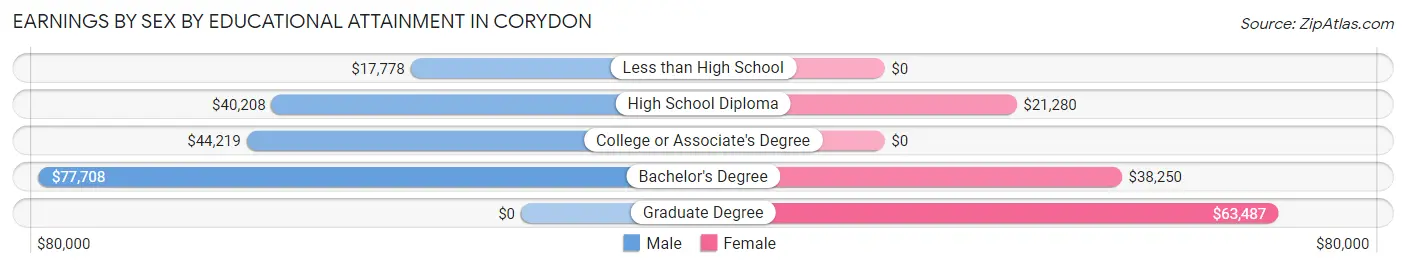
Earnings by Sex by Educational Attainment in Corydon
Average earnings in Corydon are $44,766 for men and $25,547 for women, a difference of 42.9%. Men with an educational attainment of bachelor's degree enjoy the highest average annual earnings of $77,708, while those with less than high school education earn the least with $17,778. Women with an educational attainment of graduate degree earn the most with the average annual earnings of $63,487, while those with high school diploma education have the smallest earnings of $21,280.
| Educational Attainment | Male Income | Female Income |
| Less than High School | $17,778 | $0 |
| High School Diploma | $40,208 | $21,280 |
| College or Associate's Degree | $44,219 | $0 |
| Bachelor's Degree | $77,708 | $38,250 |
| Graduate Degree | - | - |
| Total | $44,766 | $25,547 |
Family Income in Corydon
Family Income Brackets in Corydon
According to the Corydon family income data, there are 166 families falling into the $50,000 to $74,999 income range, which is the most common income bracket and makes up 29.6% of all families.
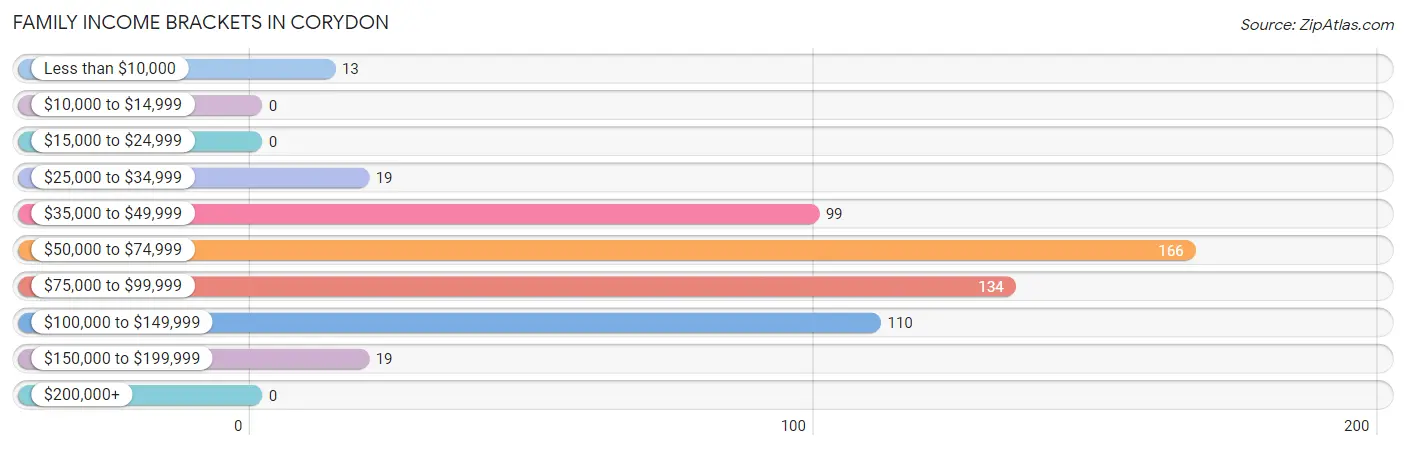
| Income Bracket | # Families | % Families |
| Less than $10,000 | 13 | 2.3% |
| $10,000 to $14,999 | 0 | 0.0% |
| $15,000 to $24,999 | 0 | 0.0% |
| $25,000 to $34,999 | 19 | 3.4% |
| $35,000 to $49,999 | 99 | 17.7% |
| $50,000 to $74,999 | 166 | 29.6% |
| $75,000 to $99,999 | 134 | 23.9% |
| $100,000 to $149,999 | 110 | 19.6% |
| $150,000 to $199,999 | 19 | 3.4% |
| $200,000+ | 0 | 0.0% |
Family Income by Famaliy Size in Corydon
4-person families (176 | 31.4%) account for the highest median family income in Corydon with $96,458 per family, while 4-person families (176 | 31.4%) have the highest median income of $24,114 per family member.
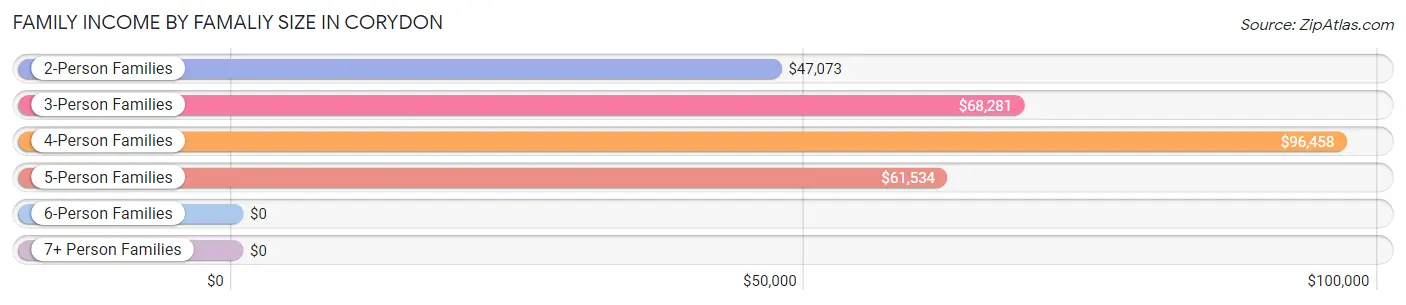
| Income Bracket | # Families | Median Income |
| 2-Person Families | 152 (27.1%) | $47,073 |
| 3-Person Families | 176 (31.4%) | $68,281 |
| 4-Person Families | 176 (31.4%) | $96,458 |
| 5-Person Families | 45 (8.0%) | $61,534 |
| 6-Person Families | 11 (2.0%) | $0 |
| 7+ Person Families | 0 (0.0%) | $0 |
| Total | 560 (100.0%) | $69,115 |
Family Income by Number of Earners in Corydon
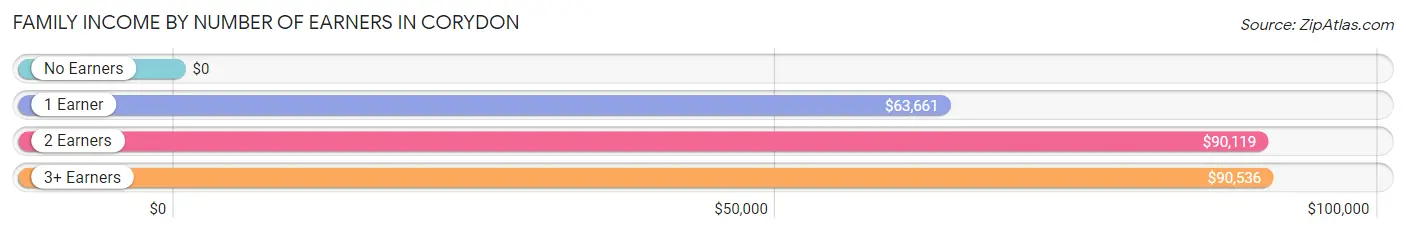
| Number of Earners | # Families | Median Income |
| No Earners | 30 (5.4%) | $0 |
| 1 Earner | 173 (30.9%) | $63,661 |
| 2 Earners | 244 (43.6%) | $90,119 |
| 3+ Earners | 113 (20.2%) | $90,536 |
| Total | 560 (100.0%) | $69,115 |
Household Income in Corydon
Household Income Brackets in Corydon
With 363 households falling in the category, the $50,000 to $74,999 income range is the most frequent in Corydon, accounting for 27.6% of all households.
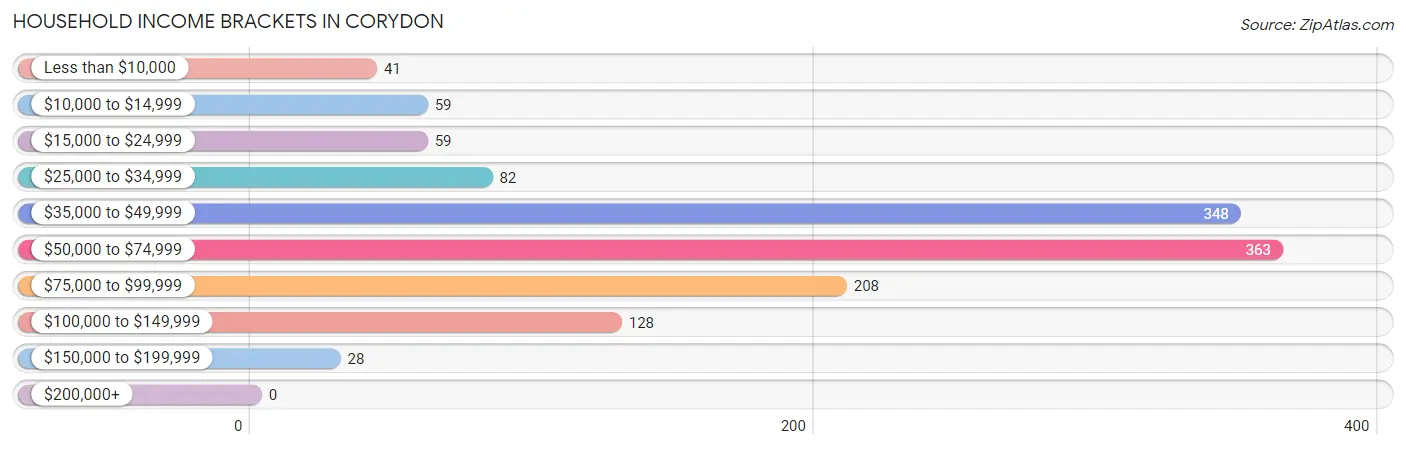
| Income Bracket | # Households | % Households |
| Less than $10,000 | 41 | 3.1% |
| $10,000 to $14,999 | 59 | 4.5% |
| $15,000 to $24,999 | 59 | 4.5% |
| $25,000 to $34,999 | 82 | 6.2% |
| $35,000 to $49,999 | 348 | 26.5% |
| $50,000 to $74,999 | 363 | 27.6% |
| $75,000 to $99,999 | 208 | 15.8% |
| $100,000 to $149,999 | 128 | 9.7% |
| $150,000 to $199,999 | 28 | 2.1% |
| $200,000+ | 0 | 0.0% |
Household Income by Householder Age in Corydon
The median household income in Corydon is $54,125, with the highest median household income of $68,843 found in the 25 to 44 years age bracket for the primary householder. A total of 393 households (29.9%) fall into this category. Meanwhile, the 15 to 24 years age bracket for the primary householder has the lowest median household income of $0, with 14 households (1.1%) in this group.
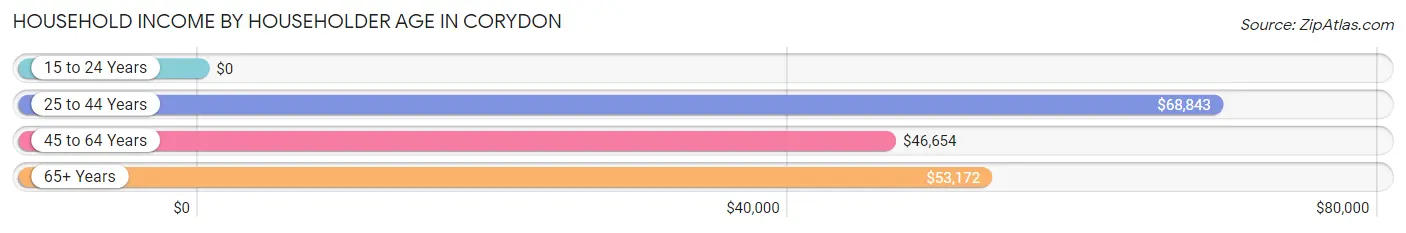
| Income Bracket | # Households | Median Income |
| 15 to 24 Years | 14 (1.1%) | $0 |
| 25 to 44 Years | 393 (29.9%) | $68,843 |
| 45 to 64 Years | 465 (35.4%) | $46,654 |
| 65+ Years | 443 (33.7%) | $53,172 |
| Total | 1,315 (100.0%) | $54,125 |
Poverty in Corydon
Income Below Poverty by Sex and Age in Corydon
With 9.2% poverty level for males and 7.9% for females among the residents of Corydon, 18 to 24 year old males and 6 to 11 year old females are the most vulnerable to poverty, with 27 males (20.4%) and 11 females (100.0%) in their respective age groups living below the poverty level.
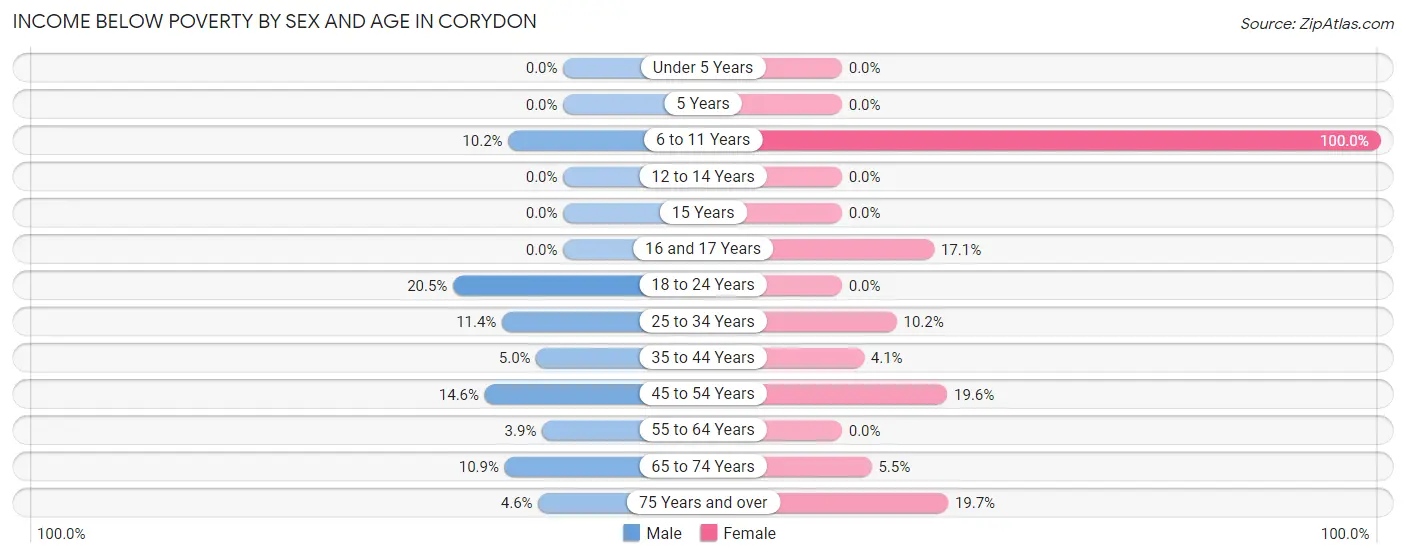
| Age Bracket | Male | Female |
| Under 5 Years | 0 (0.0%) | 0 (0.0%) |
| 5 Years | 0 (0.0%) | 0 (0.0%) |
| 6 to 11 Years | 15 (10.2%) | 11 (100.0%) |
| 12 to 14 Years | 0 (0.0%) | 0 (0.0%) |
| 15 Years | 0 (0.0%) | 0 (0.0%) |
| 16 and 17 Years | 0 (0.0%) | 13 (17.1%) |
| 18 to 24 Years | 27 (20.4%) | 0 (0.0%) |
| 25 to 34 Years | 16 (11.4%) | 13 (10.2%) |
| 35 to 44 Years | 14 (5.0%) | 13 (4.1%) |
| 45 to 54 Years | 44 (14.6%) | 35 (19.6%) |
| 55 to 64 Years | 4 (3.9%) | 0 (0.0%) |
| 65 to 74 Years | 15 (10.9%) | 15 (5.5%) |
| 75 Years and over | 3 (4.6%) | 13 (19.7%) |
| Total | 138 (9.2%) | 113 (7.9%) |
Income Above Poverty by Sex and Age in Corydon
According to the poverty statistics in Corydon, males aged under 5 years and females aged under 5 years are the age groups that are most secure financially, with 100.0% of males and 100.0% of females in these age groups living above the poverty line.
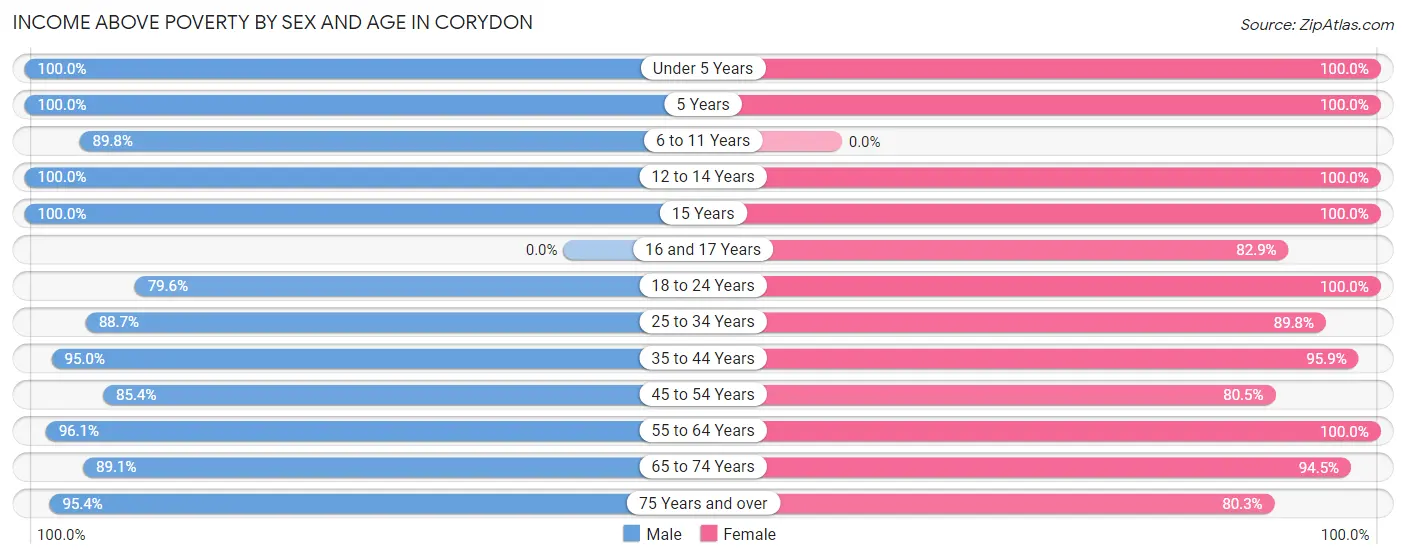
| Age Bracket | Male | Female |
| Under 5 Years | 82 (100.0%) | 116 (100.0%) |
| 5 Years | 43 (100.0%) | 11 (100.0%) |
| 6 to 11 Years | 132 (89.8%) | 0 (0.0%) |
| 12 to 14 Years | 49 (100.0%) | 78 (100.0%) |
| 15 Years | 23 (100.0%) | 25 (100.0%) |
| 16 and 17 Years | 0 (0.0%) | 63 (82.9%) |
| 18 to 24 Years | 105 (79.5%) | 101 (100.0%) |
| 25 to 34 Years | 125 (88.6%) | 115 (89.8%) |
| 35 to 44 Years | 266 (95.0%) | 304 (95.9%) |
| 45 to 54 Years | 258 (85.4%) | 144 (80.4%) |
| 55 to 64 Years | 98 (96.1%) | 48 (100.0%) |
| 65 to 74 Years | 123 (89.1%) | 257 (94.5%) |
| 75 Years and over | 62 (95.4%) | 53 (80.3%) |
| Total | 1,366 (90.8%) | 1,315 (92.1%) |
Income Below Poverty Among Married-Couple Families in Corydon
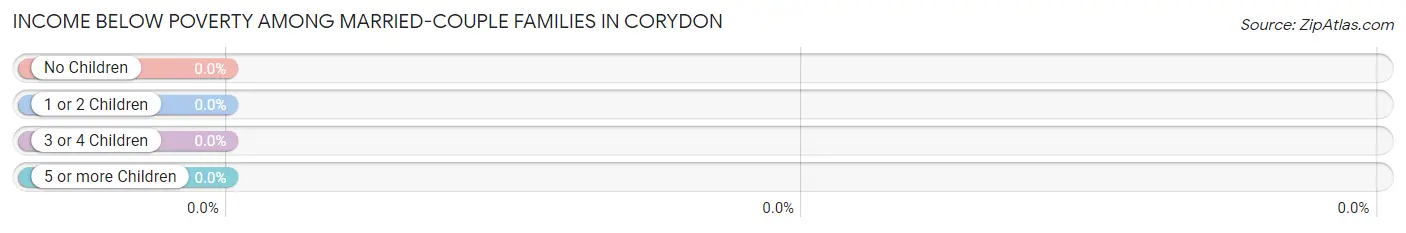
| Children | Above Poverty | Below Poverty |
| No Children | 188 (100.0%) | 0 (0.0%) |
| 1 or 2 Children | 212 (100.0%) | 0 (0.0%) |
| 3 or 4 Children | 34 (100.0%) | 0 (0.0%) |
| 5 or more Children | 0 (0.0%) | 0 (0.0%) |
| Total | 434 (100.0%) | 0 (0.0%) |
Income Below Poverty Among Single-Parent Households in Corydon
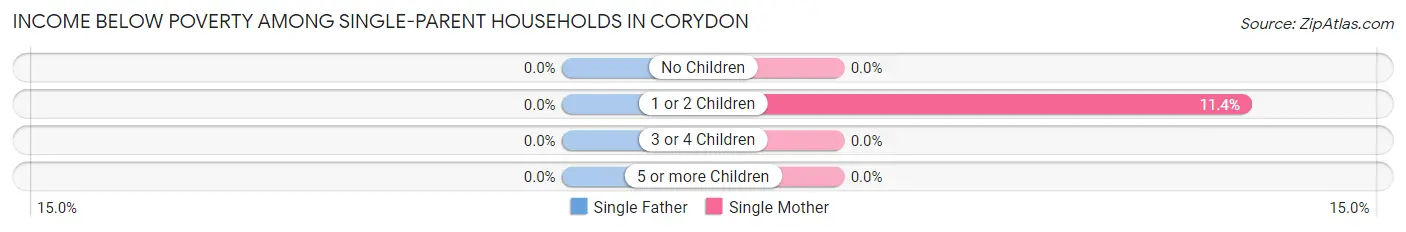
| Children | Single Father | Single Mother |
| No Children | 0 (0.0%) | 0 (0.0%) |
| 1 or 2 Children | 0 (0.0%) | 13 (11.4%) |
| 3 or 4 Children | 0 (0.0%) | 0 (0.0%) |
| 5 or more Children | 0 (0.0%) | 0 (0.0%) |
| Total | 0 (0.0%) | 13 (11.4%) |
Income Below Poverty Among Married-Couple vs Single-Parent Households in Corydon
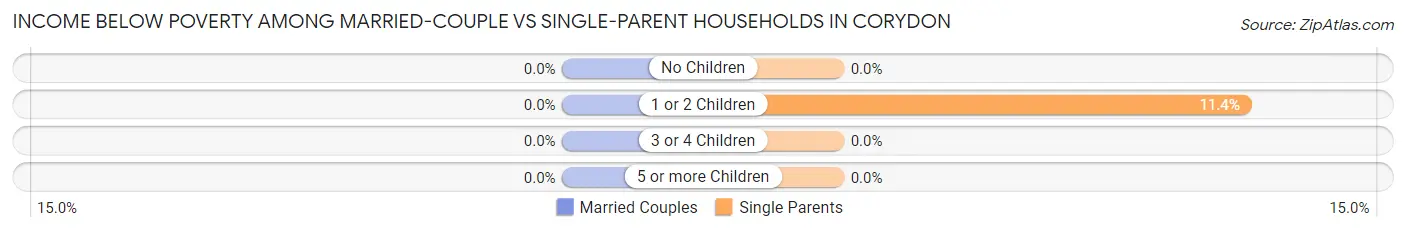
| Children | Married-Couple Families | Single-Parent Households |
| No Children | 0 (0.0%) | 0 (0.0%) |
| 1 or 2 Children | 0 (0.0%) | 13 (11.4%) |
| 3 or 4 Children | 0 (0.0%) | 0 (0.0%) |
| 5 or more Children | 0 (0.0%) | 0 (0.0%) |
| Total | 0 (0.0%) | 13 (10.3%) |
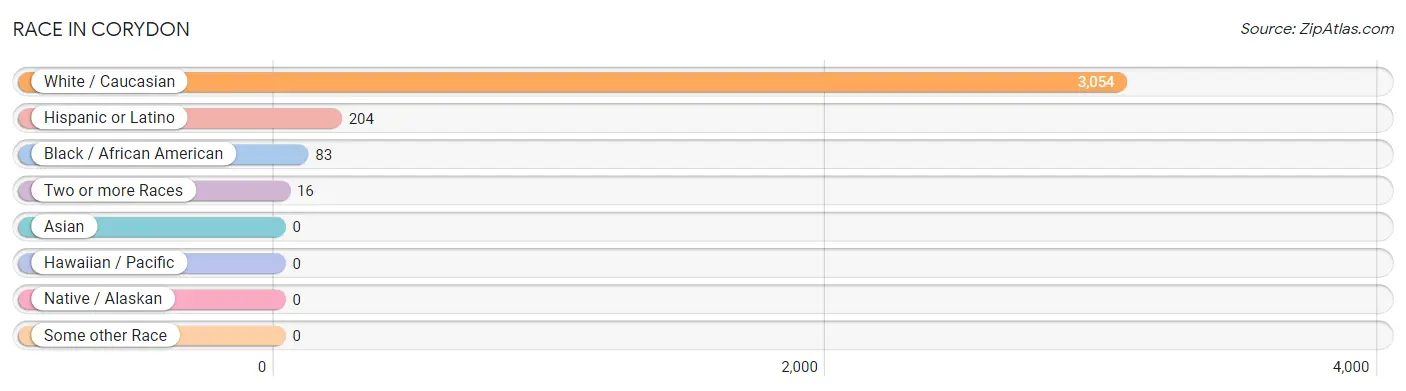
Race in Corydon
The most populous races in Corydon are White / Caucasian (3,054 | 96.9%), Hispanic or Latino (204 | 6.5%), and Black / African American (83 | 2.6%).
| Race | # Population | % Population |
| Asian | 0 | 0.0% |
| Black / African American | 83 | 2.6% |
| Hawaiian / Pacific | 0 | 0.0% |
| Hispanic or Latino | 204 | 6.5% |
| Native / Alaskan | 0 | 0.0% |
| White / Caucasian | 3,054 | 96.9% |
| Two or more Races | 16 | 0.5% |
| Some other Race | 0 | 0.0% |
| Total | 3,153 | 100.0% |
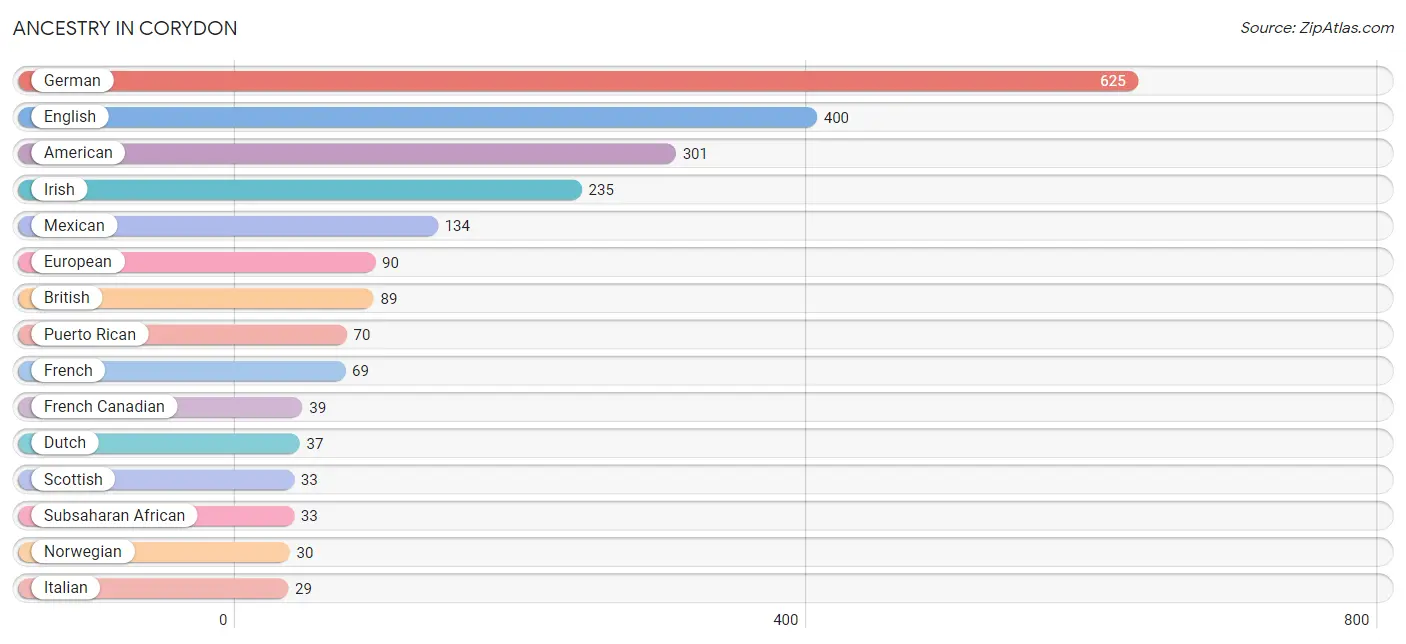
Ancestry in Corydon
The most populous ancestries reported in Corydon are German (625 | 19.8%), English (400 | 12.7%), American (301 | 9.6%), Irish (235 | 7.4%), and Mexican (134 | 4.3%), together accounting for 53.8% of all Corydon residents.
| Ancestry | # Population | % Population |
| African | 12 | 0.4% |
| American | 301 | 9.6% |
| Belgian | 3 | 0.1% |
| British | 89 | 2.8% |
| Cherokee | 16 | 0.5% |
| Croatian | 16 | 0.5% |
| Dutch | 37 | 1.2% |
| English | 400 | 12.7% |
| European | 90 | 2.9% |
| French | 69 | 2.2% |
| French Canadian | 39 | 1.2% |
| German | 625 | 19.8% |
| Irish | 235 | 7.4% |
| Italian | 29 | 0.9% |
| Mexican | 134 | 4.3% |
| Norwegian | 30 | 0.9% |
| Polish | 6 | 0.2% |
| Puerto Rican | 70 | 2.2% |
| Scandinavian | 10 | 0.3% |
| Scottish | 33 | 1.1% |
| Sierra Leonean | 21 | 0.7% |
| Subsaharan African | 33 | 1.1% | View All 22 Rows |
Immigrants in Corydon
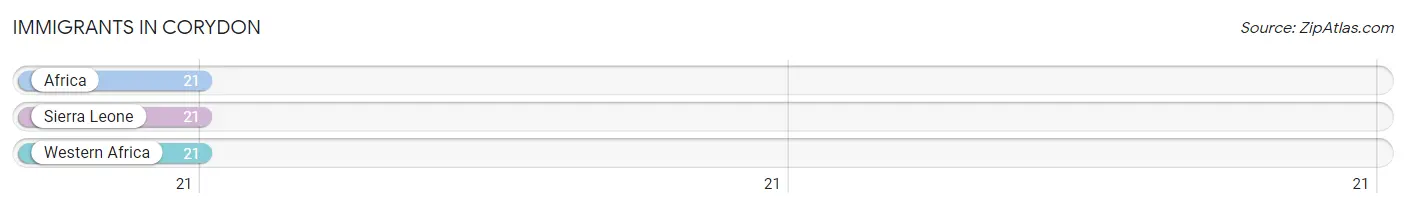
The most numerous immigrant groups reported in Corydon came from Africa (21 | 0.7%), Sierra Leone (21 | 0.7%), and Western Africa (21 | 0.7%), together accounting for 2.0% of all Corydon residents.
| Immigration Origin | # Population | % Population |
| Africa | 21 | 0.7% |
| Sierra Leone | 21 | 0.7% |
| Western Africa | 21 | 0.7% | View All 3 Rows |
Sex and Age in Corydon
Sex and Age in Corydon
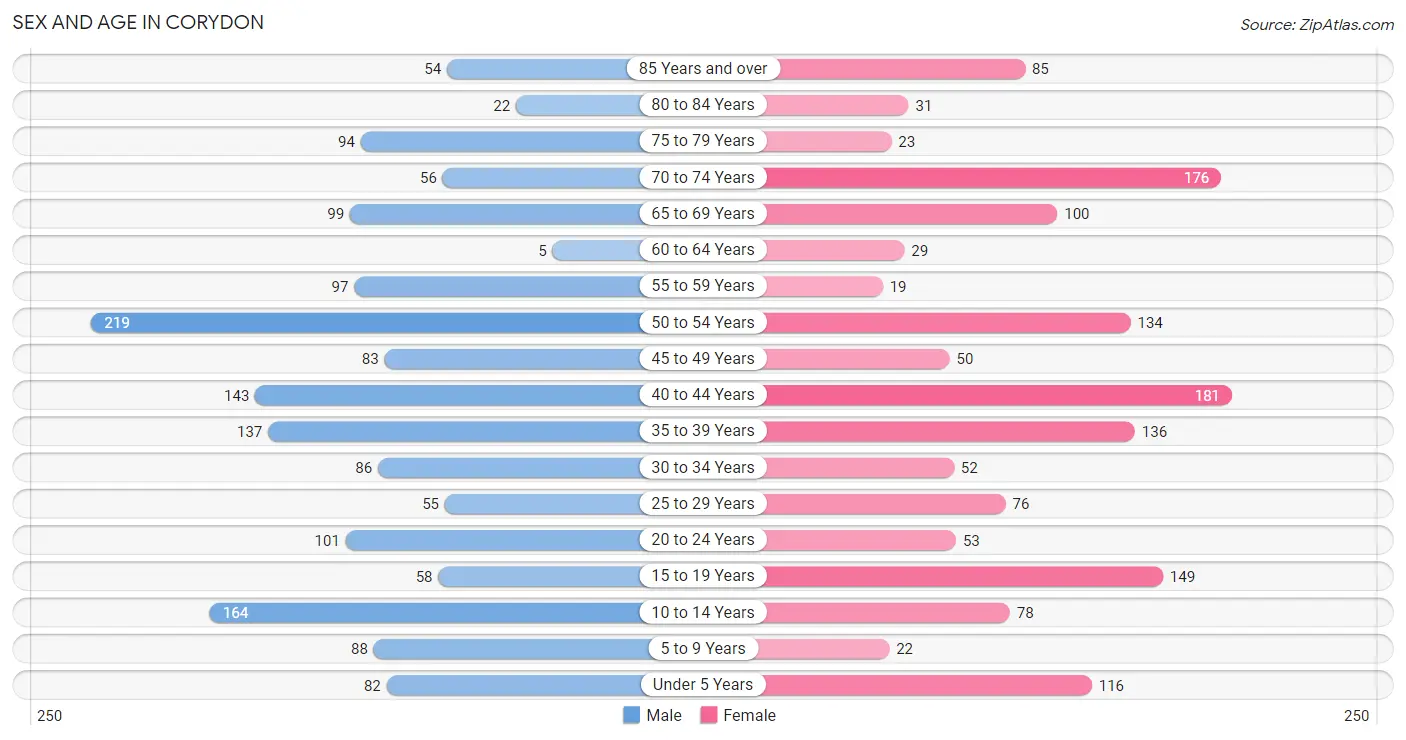
The most populous age groups in Corydon are 50 to 54 Years (219 | 13.3%) for men and 40 to 44 Years (181 | 12.0%) for women.
| Age Bracket | Male | Female |
| Under 5 Years | 82 (5.0%) | 116 (7.7%) |
| 5 to 9 Years | 88 (5.4%) | 22 (1.5%) |
| 10 to 14 Years | 164 (10.0%) | 78 (5.2%) |
| 15 to 19 Years | 58 (3.5%) | 149 (9.9%) |
| 20 to 24 Years | 101 (6.1%) | 53 (3.5%) |
| 25 to 29 Years | 55 (3.4%) | 76 (5.0%) |
| 30 to 34 Years | 86 (5.2%) | 52 (3.4%) |
| 35 to 39 Years | 137 (8.3%) | 136 (9.0%) |
| 40 to 44 Years | 143 (8.7%) | 181 (12.0%) |
| 45 to 49 Years | 83 (5.1%) | 50 (3.3%) |
| 50 to 54 Years | 219 (13.3%) | 134 (8.9%) |
| 55 to 59 Years | 97 (5.9%) | 19 (1.3%) |
| 60 to 64 Years | 5 (0.3%) | 29 (1.9%) |
| 65 to 69 Years | 99 (6.0%) | 100 (6.6%) |
| 70 to 74 Years | 56 (3.4%) | 176 (11.7%) |
| 75 to 79 Years | 94 (5.7%) | 23 (1.5%) |
| 80 to 84 Years | 22 (1.3%) | 31 (2.1%) |
| 85 Years and over | 54 (3.3%) | 85 (5.6%) |
| Total | 1,643 (100.0%) | 1,510 (100.0%) |
Families and Households in Corydon
Median Family Size in Corydon
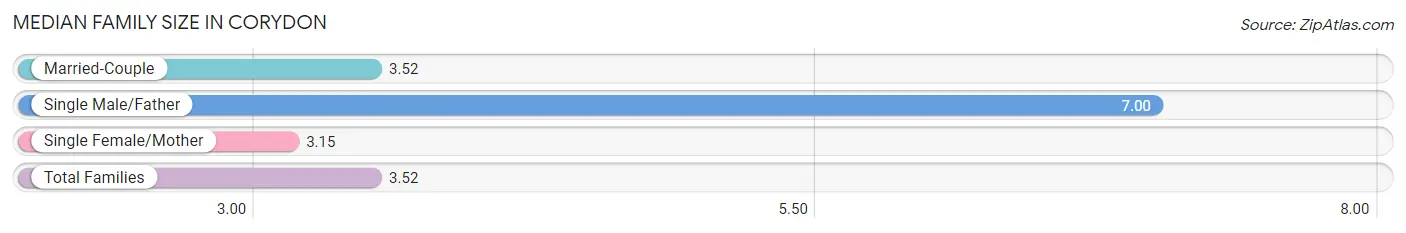
The median family size in Corydon is 3.52 persons per family, with single male/father families (12 | 2.1%) accounting for the largest median family size of 7 persons per family. On the other hand, single female/mother families (114 | 20.4%) represent the smallest median family size with 3.15 persons per family.
| Family Type | # Families | Family Size |
| Married-Couple | 434 (77.5%) | 3.52 |
| Single Male/Father | 12 (2.1%) | 7.00 |
| Single Female/Mother | 114 (20.4%) | 3.15 |
| Total Families | 560 (100.0%) | 3.52 |
Median Household Size in Corydon
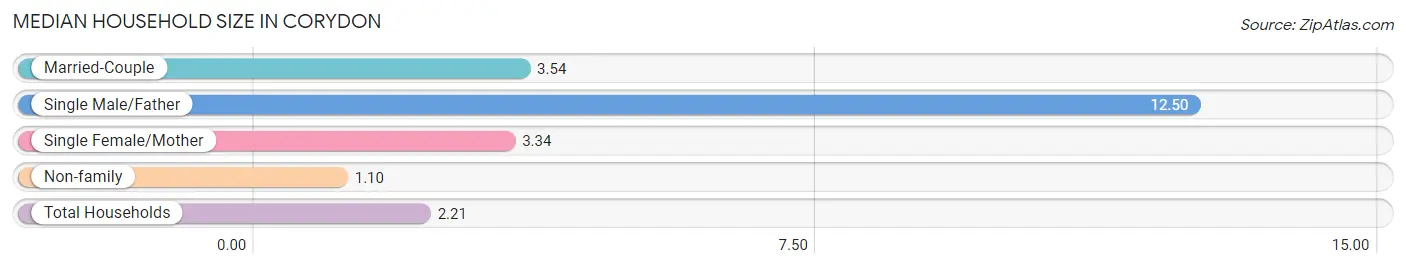
The median household size in Corydon is 2.21 persons per household, with single male/father households (12 | 0.9%) accounting for the largest median household size of 12.5 persons per household. non-family households (755 | 57.4%) represent the smallest median household size with 1.10 persons per household.
| Household Type | # Households | Household Size |
| Married-Couple | 434 (33.0%) | 3.54 |
| Single Male/Father | 12 (0.9%) | 12.50 |
| Single Female/Mother | 114 (8.7%) | 3.34 |
| Non-family | 755 (57.4%) | 1.10 |
| Total Households | 1,315 (100.0%) | 2.21 |
Household Size by Marriage Status in Corydon
Out of a total of 1,315 households in Corydon, 560 (42.6%) are family households, while 755 (57.4%) are nonfamily households. The most numerous type of family households are 3-person households, comprising 173, and the most common type of nonfamily households are 1-person households, comprising 698.
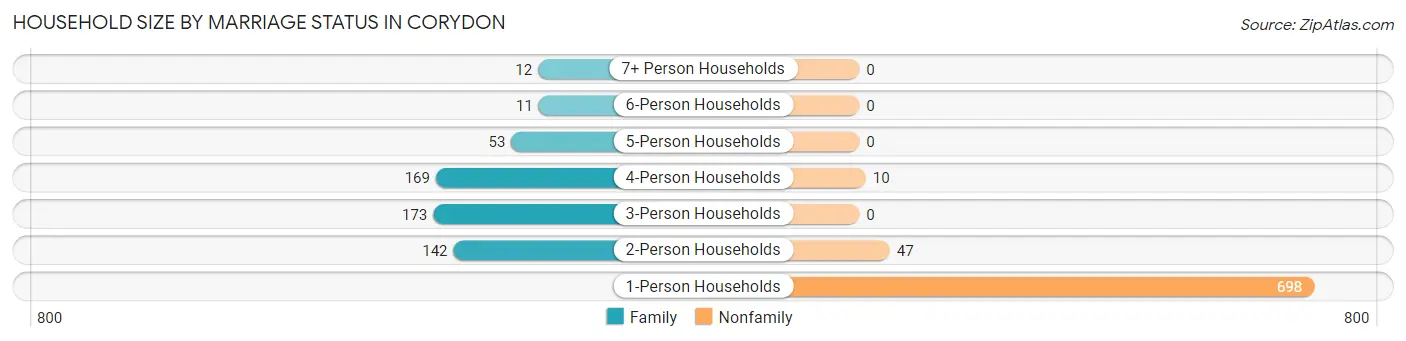
| Household Size | Family Households | Nonfamily Households |
| 1-Person Households | - | 698 (53.1%) |
| 2-Person Households | 142 (10.8%) | 47 (3.6%) |
| 3-Person Households | 173 (13.2%) | 0 (0.0%) |
| 4-Person Households | 169 (12.9%) | 10 (0.8%) |
| 5-Person Households | 53 (4.0%) | 0 (0.0%) |
| 6-Person Households | 11 (0.8%) | 0 (0.0%) |
| 7+ Person Households | 12 (0.9%) | 0 (0.0%) |
| Total | 560 (42.6%) | 755 (57.4%) |
Female Fertility in Corydon
Fertility by Age in Corydon
Average fertility rate in Corydon is 131.0 births per 1,000 women. Women in the age bracket of 20 to 34 years have the highest fertility rate with 442.0 births per 1,000 women. Women in the age bracket of 20 to 34 years acount for 87.9% of all women with births.
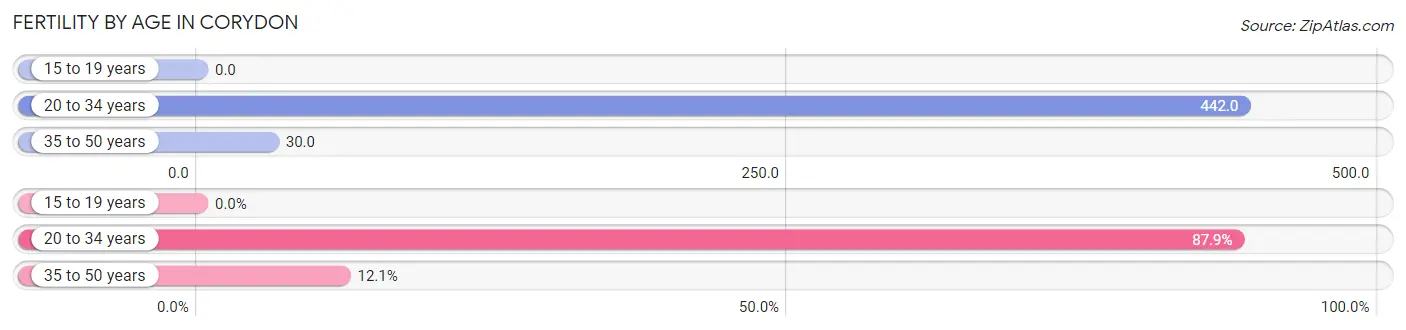
| Age Bracket | Women with Births | Births / 1,000 Women |
| 15 to 19 years | 0 (0.0%) | 0.0 |
| 20 to 34 years | 80 (87.9%) | 442.0 |
| 35 to 50 years | 11 (12.1%) | 30.0 |
| Total | 91 (100.0%) | 131.0 |
Fertility by Age by Marriage Status in Corydon
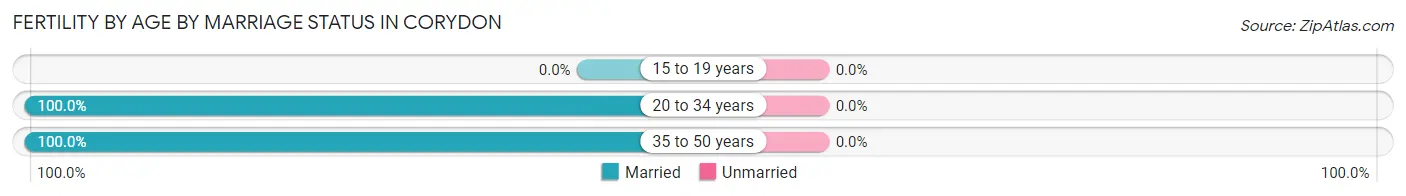
| Age Bracket | Married | Unmarried |
| 15 to 19 years | 0 (0.0%) | 0 (0.0%) |
| 20 to 34 years | 80 (100.0%) | 0 (0.0%) |
| 35 to 50 years | 11 (100.0%) | 0 (0.0%) |
| Total | 91 (100.0%) | 0 (0.0%) |
Fertility by Education in Corydon
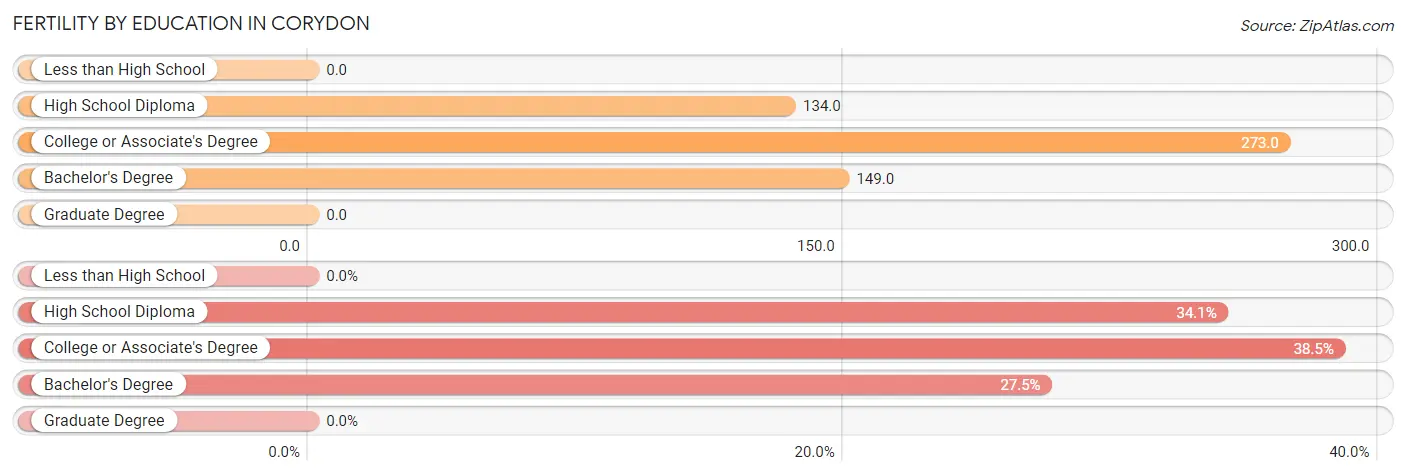
| Educational Attainment | Women with Births | Births / 1,000 Women |
| Less than High School | 0 (0.0%) | 0.0 |
| High School Diploma | 31 (34.1%) | 134.0 |
| College or Associate's Degree | 35 (38.5%) | 273.0 |
| Bachelor's Degree | 25 (27.5%) | 149.0 |
| Graduate Degree | 0 (0.0%) | 0.0 |
| Total | 91 (100.0%) | 131.0 |
Fertility by Education by Marriage Status in Corydon
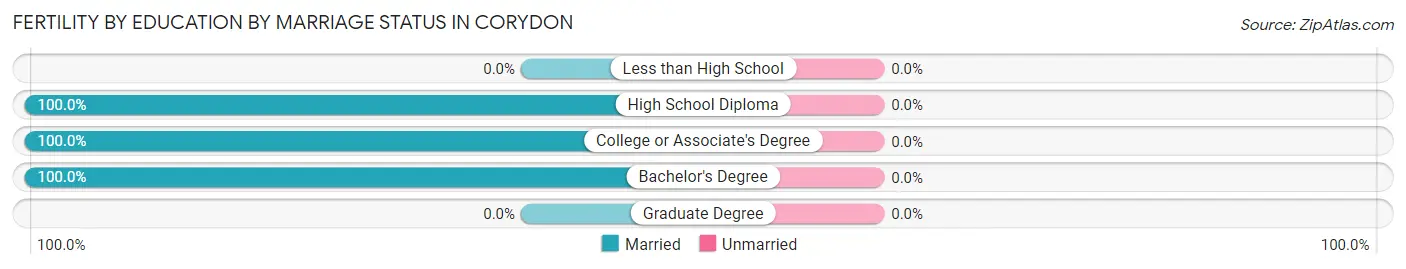
| Educational Attainment | Married | Unmarried |
| Less than High School | 0 (0.0%) | 0 (0.0%) |
| High School Diploma | 31 (100.0%) | 0 (0.0%) |
| College or Associate's Degree | 35 (100.0%) | 0 (0.0%) |
| Bachelor's Degree | 25 (100.0%) | 0 (0.0%) |
| Graduate Degree | 0 (0.0%) | 0 (0.0%) |
| Total | 91 (100.0%) | 0 (0.0%) |
Employment Characteristics in Corydon
Employment by Class of Employer in Corydon
Among the 1,324 employed individuals in Corydon, private company employees (1,062 | 80.2%), not-for-profit organizations (118 | 8.9%), and local government employees (81 | 6.1%) make up the most common classes of employment.
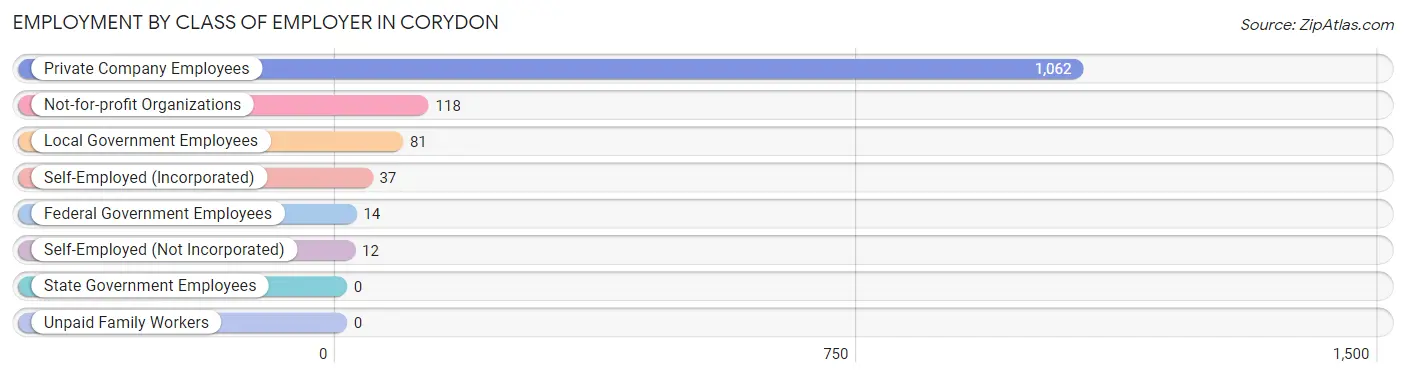
| Employer Class | # Employees | % Employees |
| Private Company Employees | 1,062 | 80.2% |
| Self-Employed (Incorporated) | 37 | 2.8% |
| Self-Employed (Not Incorporated) | 12 | 0.9% |
| Not-for-profit Organizations | 118 | 8.9% |
| Local Government Employees | 81 | 6.1% |
| State Government Employees | 0 | 0.0% |
| Federal Government Employees | 14 | 1.1% |
| Unpaid Family Workers | 0 | 0.0% |
| Total | 1,324 | 100.0% |
Employment Status by Age in Corydon
According to the labor force statistics for Corydon, out of the total population over 16 years of age (2,555), 55.5% or 1,418 individuals are in the labor force, with 1.6% or 23 of them unemployed. The age group with the highest labor force participation rate is 25 to 29 years, with 100.0% or 131 individuals in the labor force. Within the labor force, the 30 to 34 years age range has the highest percentage of unemployed individuals, with 13.0% or 13 of them being unemployed.
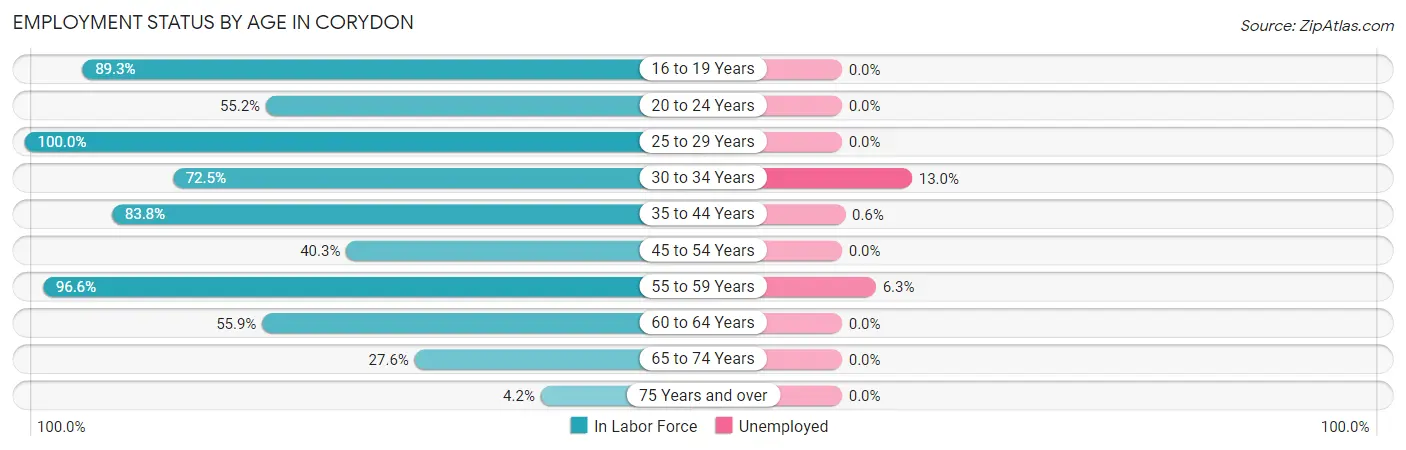
| Age Bracket | In Labor Force | Unemployed |
| 16 to 19 Years | 142 (89.3%) | 0 (0.0%) |
| 20 to 24 Years | 85 (55.2%) | 0 (0.0%) |
| 25 to 29 Years | 131 (100.0%) | 0 (0.0%) |
| 30 to 34 Years | 100 (72.5%) | 13 (13.0%) |
| 35 to 44 Years | 500 (83.8%) | 3 (0.6%) |
| 45 to 54 Years | 196 (40.3%) | 0 (0.0%) |
| 55 to 59 Years | 112 (96.6%) | 7 (6.3%) |
| 60 to 64 Years | 19 (55.9%) | 0 (0.0%) |
| 65 to 74 Years | 119 (27.6%) | 0 (0.0%) |
| 75 Years and over | 13 (4.2%) | 0 (0.0%) |
| Total | 1,418 (55.5%) | 23 (1.6%) |
Employment Status by Educational Attainment in Corydon
According to labor force statistics for Corydon, 70.4% of individuals (1,057) out of the total population between 25 and 64 years of age (1,502) are in the labor force, with 2.2% or 23 of them being unemployed. The group with the highest labor force participation rate are those with the educational attainment of bachelor's degree or higher, with 100.0% or 377 individuals in the labor force. Within the labor force, individuals with college / associate degree education have the highest percentage of unemployment, with 11.6% or 23 of them being unemployed.
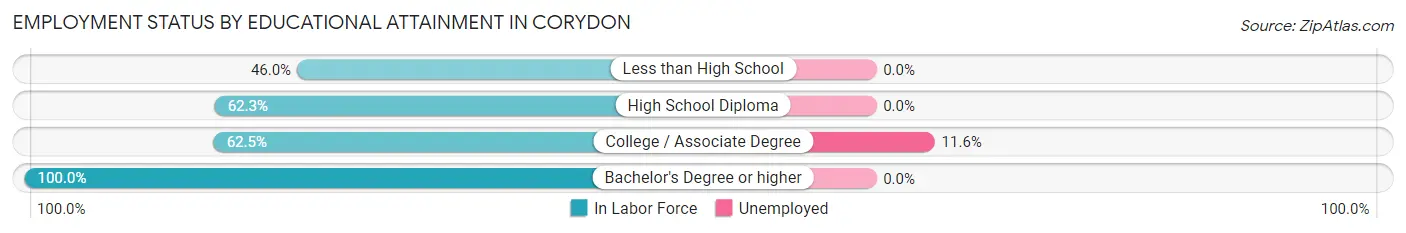
| Educational Attainment | In Labor Force | Unemployed |
| Less than High School | 57 (46.0%) | 0 (0.0%) |
| High School Diploma | 426 (62.3%) | 0 (0.0%) |
| College / Associate Degree | 198 (62.5%) | 37 (11.6%) |
| Bachelor's Degree or higher | 377 (100.0%) | 0 (0.0%) |
| Total | 1,057 (70.4%) | 33 (2.2%) |
Employment Occupations by Sex in Corydon
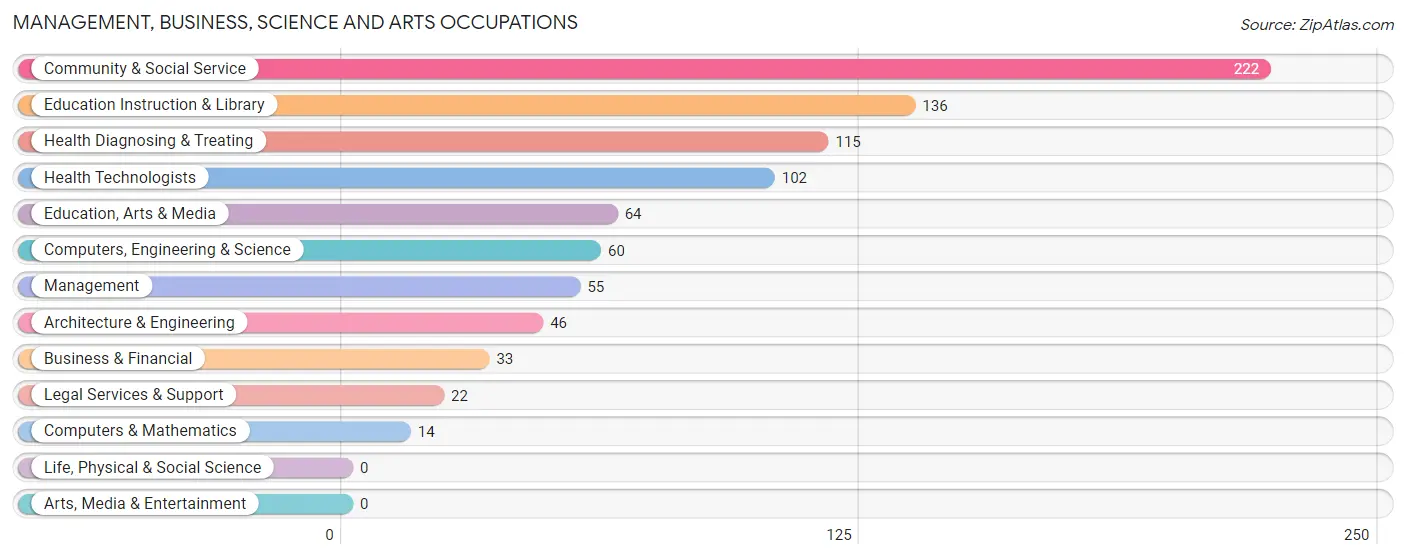
Management, Business, Science and Arts Occupations
The most common Management, Business, Science and Arts occupations in Corydon are Community & Social Service (222 | 15.9%), Education Instruction & Library (136 | 9.8%), Health Diagnosing & Treating (115 | 8.3%), Health Technologists (102 | 7.3%), and Education, Arts & Media (64 | 4.6%).
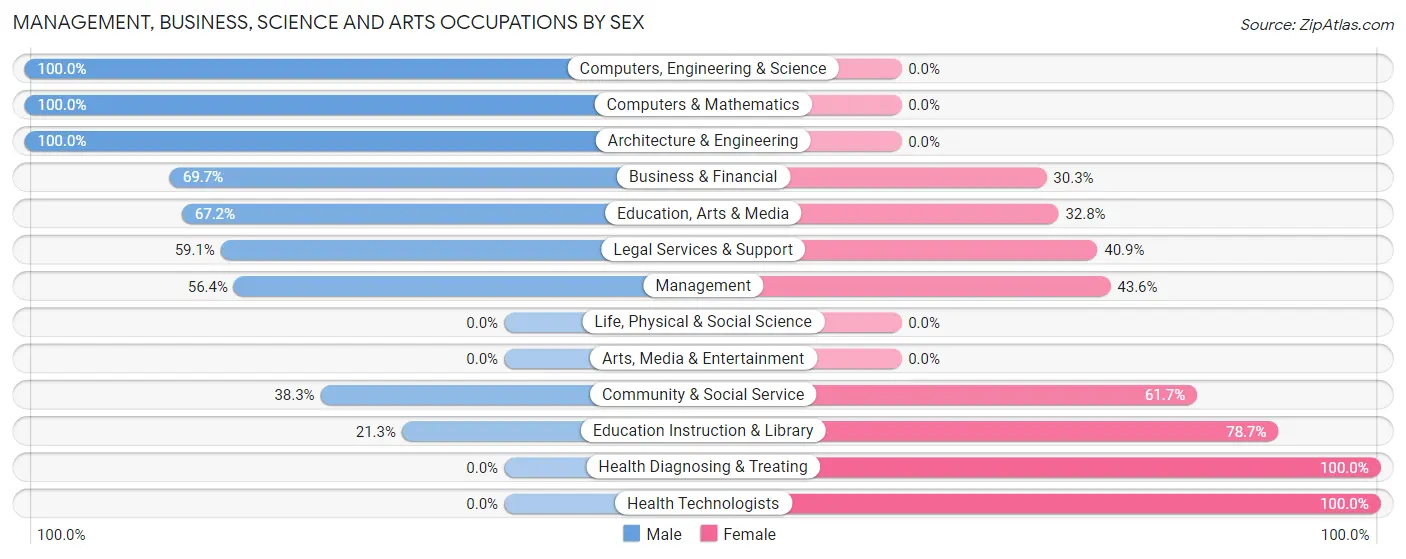
Management, Business, Science and Arts Occupations by Sex
Within the Management, Business, Science and Arts occupations in Corydon, the most male-oriented occupations are Computers, Engineering & Science (100.0%), Computers & Mathematics (100.0%), and Architecture & Engineering (100.0%), while the most female-oriented occupations are Health Diagnosing & Treating (100.0%), Health Technologists (100.0%), and Education Instruction & Library (78.7%).
| Occupation | Male | Female |
| Management | 31 (56.4%) | 24 (43.6%) |
| Business & Financial | 23 (69.7%) | 10 (30.3%) |
| Computers, Engineering & Science | 60 (100.0%) | 0 (0.0%) |
| Computers & Mathematics | 14 (100.0%) | 0 (0.0%) |
| Architecture & Engineering | 46 (100.0%) | 0 (0.0%) |
| Life, Physical & Social Science | 0 (0.0%) | 0 (0.0%) |
| Community & Social Service | 85 (38.3%) | 137 (61.7%) |
| Education, Arts & Media | 43 (67.2%) | 21 (32.8%) |
| Legal Services & Support | 13 (59.1%) | 9 (40.9%) |
| Education Instruction & Library | 29 (21.3%) | 107 (78.7%) |
| Arts, Media & Entertainment | 0 (0.0%) | 0 (0.0%) |
| Health Diagnosing & Treating | 0 (0.0%) | 115 (100.0%) |
| Health Technologists | 0 (0.0%) | 102 (100.0%) |
| Total (Category) | 199 (41.0%) | 286 (59.0%) |
| Total (Overall) | 675 (48.4%) | 719 (51.6%) |
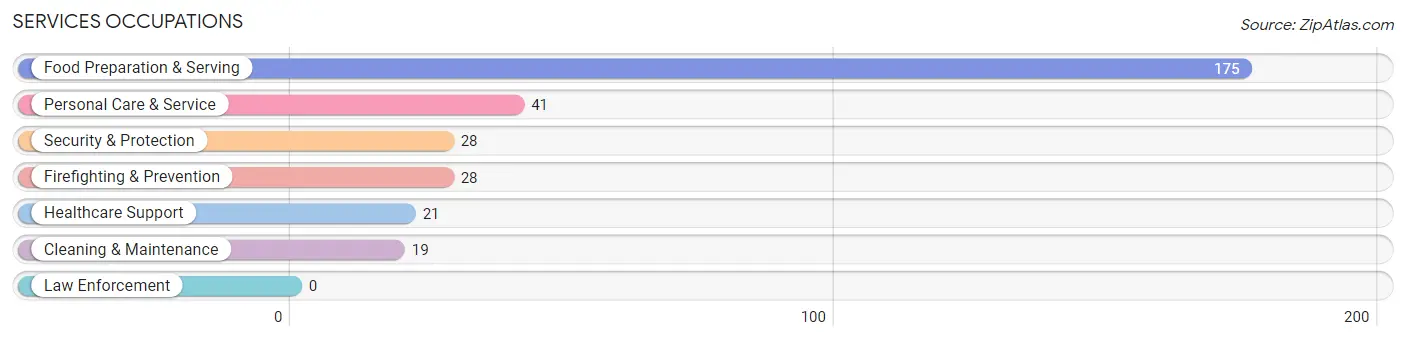
Services Occupations
The most common Services occupations in Corydon are Food Preparation & Serving (175 | 12.6%), Personal Care & Service (41 | 2.9%), Security & Protection (28 | 2.0%), Firefighting & Prevention (28 | 2.0%), and Healthcare Support (21 | 1.5%).
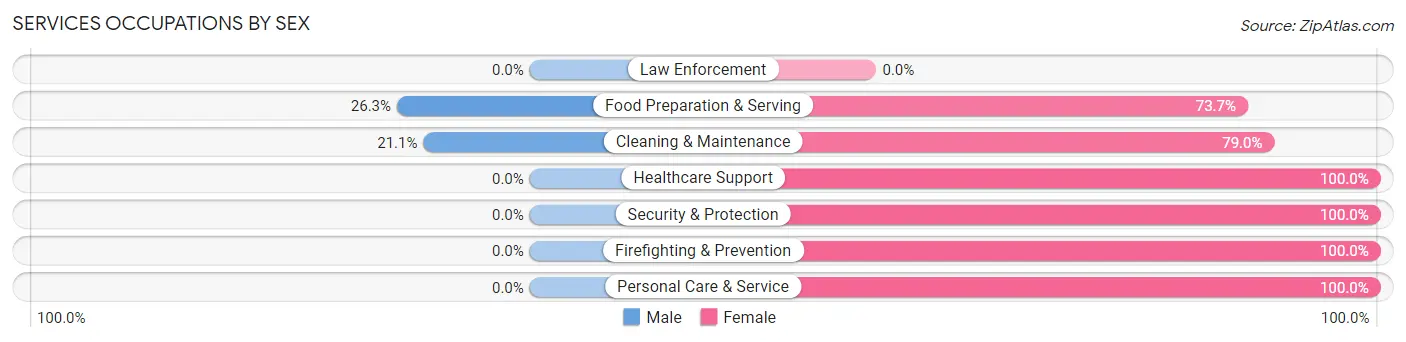
Services Occupations by Sex
Within the Services occupations in Corydon, the most male-oriented occupations are Food Preparation & Serving (26.3%), and Cleaning & Maintenance (21.0%), while the most female-oriented occupations are Healthcare Support (100.0%), Security & Protection (100.0%), and Firefighting & Prevention (100.0%).
| Occupation | Male | Female |
| Healthcare Support | 0 (0.0%) | 21 (100.0%) |
| Security & Protection | 0 (0.0%) | 28 (100.0%) |
| Firefighting & Prevention | 0 (0.0%) | 28 (100.0%) |
| Law Enforcement | 0 (0.0%) | 0 (0.0%) |
| Food Preparation & Serving | 46 (26.3%) | 129 (73.7%) |
| Cleaning & Maintenance | 4 (21.0%) | 15 (78.9%) |
| Personal Care & Service | 0 (0.0%) | 41 (100.0%) |
| Total (Category) | 50 (17.6%) | 234 (82.4%) |
| Total (Overall) | 675 (48.4%) | 719 (51.6%) |
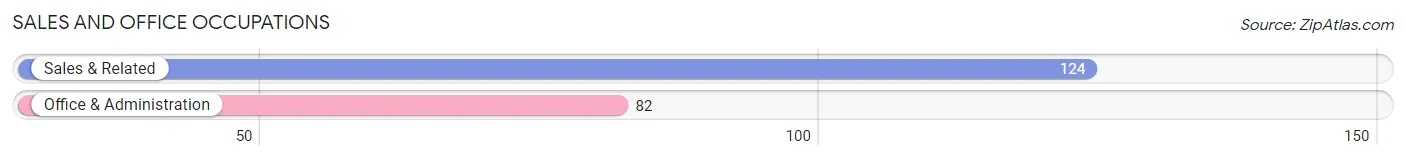
Sales and Office Occupations
The most common Sales and Office occupations in Corydon are Sales & Related (124 | 8.9%), and Office & Administration (82 | 5.9%).
Sales and Office Occupations by Sex
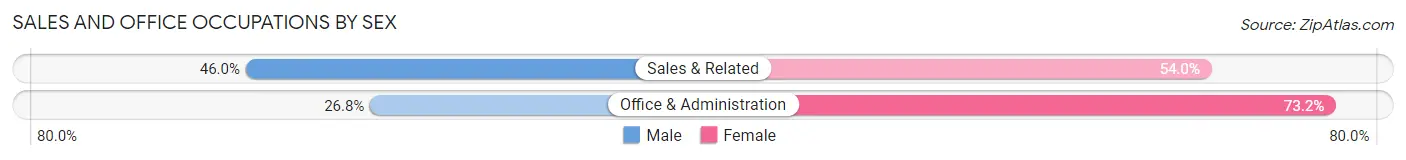
| Occupation | Male | Female |
| Sales & Related | 57 (46.0%) | 67 (54.0%) |
| Office & Administration | 22 (26.8%) | 60 (73.2%) |
| Total (Category) | 79 (38.4%) | 127 (61.7%) |
| Total (Overall) | 675 (48.4%) | 719 (51.6%) |
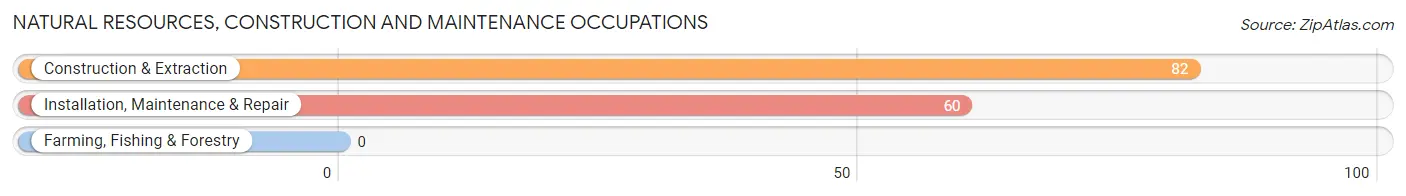
Natural Resources, Construction and Maintenance Occupations
The most common Natural Resources, Construction and Maintenance occupations in Corydon are Construction & Extraction (82 | 5.9%), and Installation, Maintenance & Repair (60 | 4.3%).
Natural Resources, Construction and Maintenance Occupations by Sex
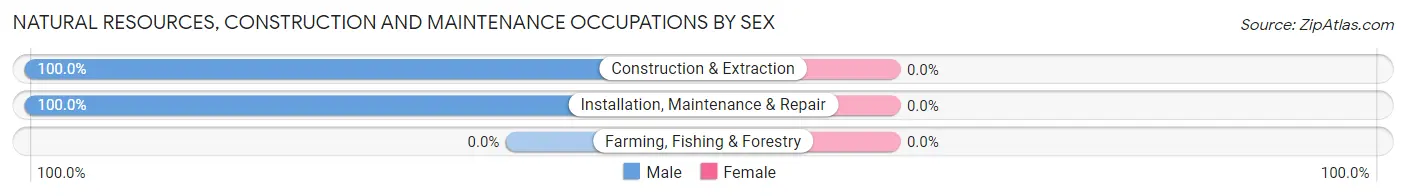
| Occupation | Male | Female |
| Farming, Fishing & Forestry | 0 (0.0%) | 0 (0.0%) |
| Construction & Extraction | 82 (100.0%) | 0 (0.0%) |
| Installation, Maintenance & Repair | 60 (100.0%) | 0 (0.0%) |
| Total (Category) | 142 (100.0%) | 0 (0.0%) |
| Total (Overall) | 675 (48.4%) | 719 (51.6%) |
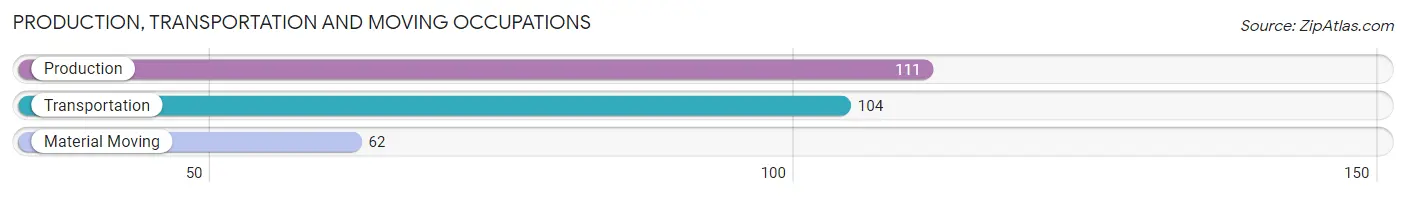
Production, Transportation and Moving Occupations
The most common Production, Transportation and Moving occupations in Corydon are Production (111 | 8.0%), Transportation (104 | 7.5%), and Material Moving (62 | 4.4%).
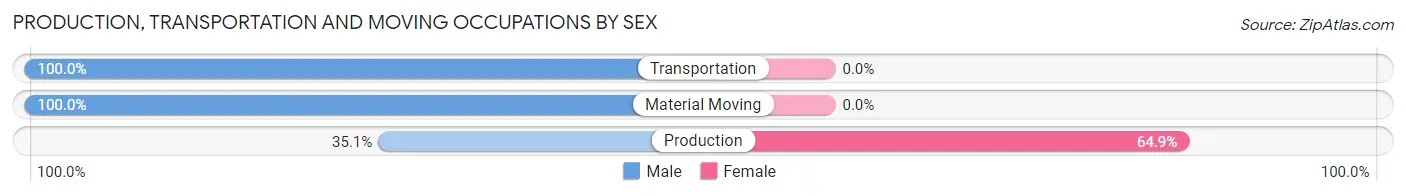
Production, Transportation and Moving Occupations by Sex
| Occupation | Male | Female |
| Production | 39 (35.1%) | 72 (64.9%) |
| Transportation | 104 (100.0%) | 0 (0.0%) |
| Material Moving | 62 (100.0%) | 0 (0.0%) |
| Total (Category) | 205 (74.0%) | 72 (26.0%) |
| Total (Overall) | 675 (48.4%) | 719 (51.6%) |
Employment Industries by Sex in Corydon
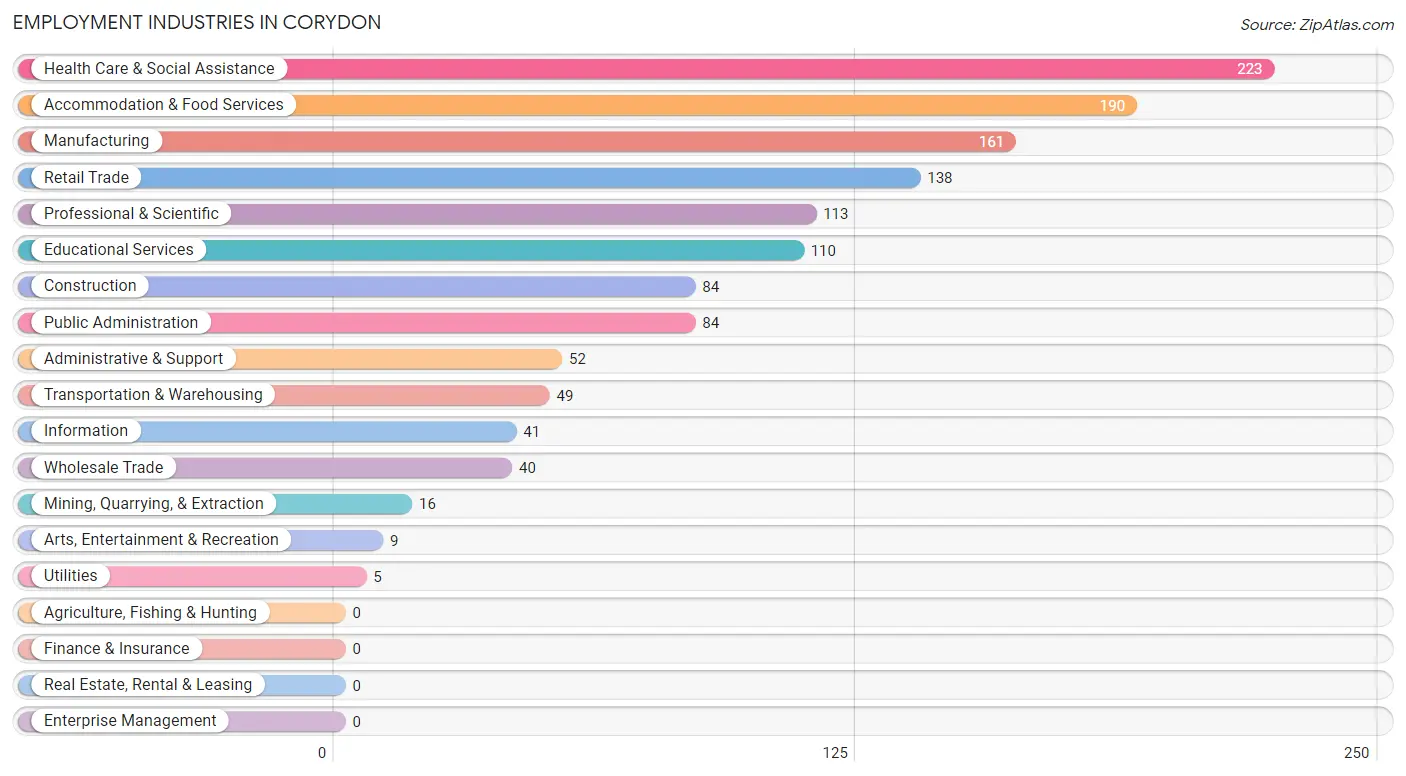
Employment Industries in Corydon
The major employment industries in Corydon include Health Care & Social Assistance (223 | 16.0%), Accommodation & Food Services (190 | 13.6%), Manufacturing (161 | 11.6%), Retail Trade (138 | 9.9%), and Professional & Scientific (113 | 8.1%).
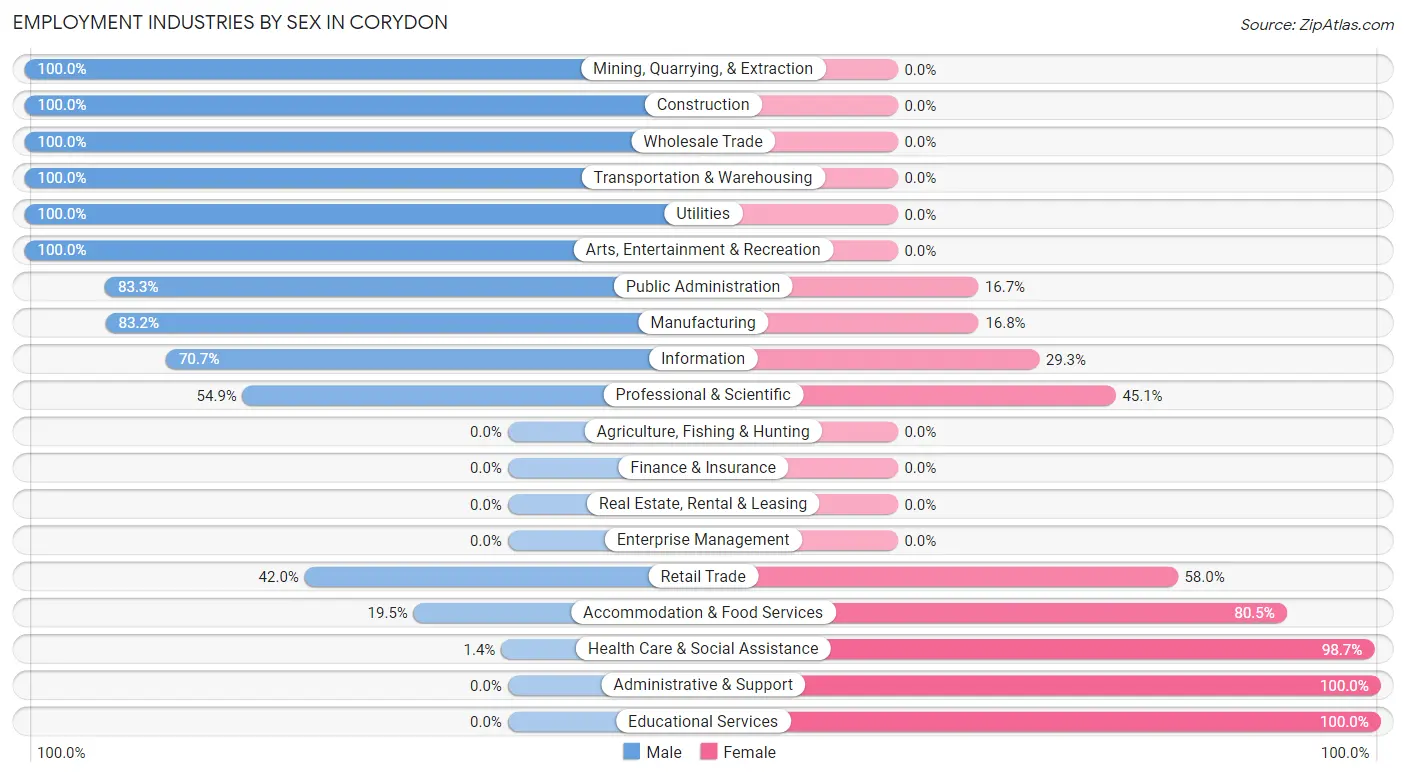
Employment Industries by Sex in Corydon
The Corydon industries that see more men than women are Mining, Quarrying, & Extraction (100.0%), Construction (100.0%), and Wholesale Trade (100.0%), whereas the industries that tend to have a higher number of women are Administrative & Support (100.0%), Educational Services (100.0%), and Health Care & Social Assistance (98.7%).
| Industry | Male | Female |
| Agriculture, Fishing & Hunting | 0 (0.0%) | 0 (0.0%) |
| Mining, Quarrying, & Extraction | 16 (100.0%) | 0 (0.0%) |
| Construction | 84 (100.0%) | 0 (0.0%) |
| Manufacturing | 134 (83.2%) | 27 (16.8%) |
| Wholesale Trade | 40 (100.0%) | 0 (0.0%) |
| Retail Trade | 58 (42.0%) | 80 (58.0%) |
| Transportation & Warehousing | 49 (100.0%) | 0 (0.0%) |
| Utilities | 5 (100.0%) | 0 (0.0%) |
| Information | 29 (70.7%) | 12 (29.3%) |
| Finance & Insurance | 0 (0.0%) | 0 (0.0%) |
| Real Estate, Rental & Leasing | 0 (0.0%) | 0 (0.0%) |
| Professional & Scientific | 62 (54.9%) | 51 (45.1%) |
| Enterprise Management | 0 (0.0%) | 0 (0.0%) |
| Administrative & Support | 0 (0.0%) | 52 (100.0%) |
| Educational Services | 0 (0.0%) | 110 (100.0%) |
| Health Care & Social Assistance | 3 (1.3%) | 220 (98.7%) |
| Arts, Entertainment & Recreation | 9 (100.0%) | 0 (0.0%) |
| Accommodation & Food Services | 37 (19.5%) | 153 (80.5%) |
| Public Administration | 70 (83.3%) | 14 (16.7%) |
| Total | 675 (48.4%) | 719 (51.6%) |
Education in Corydon
School Enrollment in Corydon
The most common levels of schooling among the 642 students in Corydon are high school (224 | 34.9%), middle school (125 | 19.5%), and elementary school (108 | 16.8%).
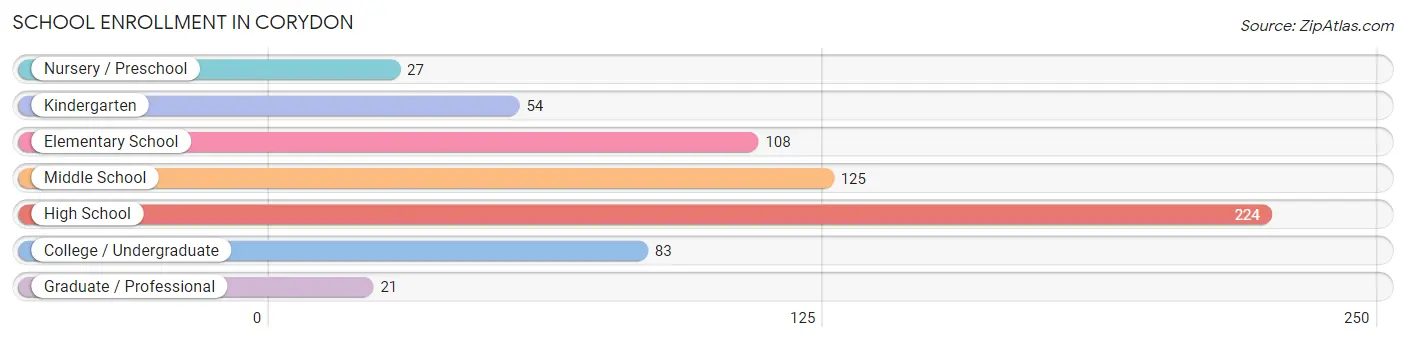
| School Level | # Students | % Students |
| Nursery / Preschool | 27 | 4.2% |
| Kindergarten | 54 | 8.4% |
| Elementary School | 108 | 16.8% |
| Middle School | 125 | 19.5% |
| High School | 224 | 34.9% |
| College / Undergraduate | 83 | 12.9% |
| Graduate / Professional | 21 | 3.3% |
| Total | 642 | 100.0% |
School Enrollment by Age by Funding Source in Corydon
Out of a total of 642 students who are enrolled in schools in Corydon, 174 (27.1%) attend a private institution, while the remaining 468 (72.9%) are enrolled in public schools. The age group of 3 to 4 year olds has the highest likelihood of being enrolled in private schools, with 27 (100.0% in the age bracket) enrolled. Conversely, the age group of 20 to 24 year olds has the lowest likelihood of being enrolled in a private school, with 21 (100.0% in the age bracket) attending a public institution.
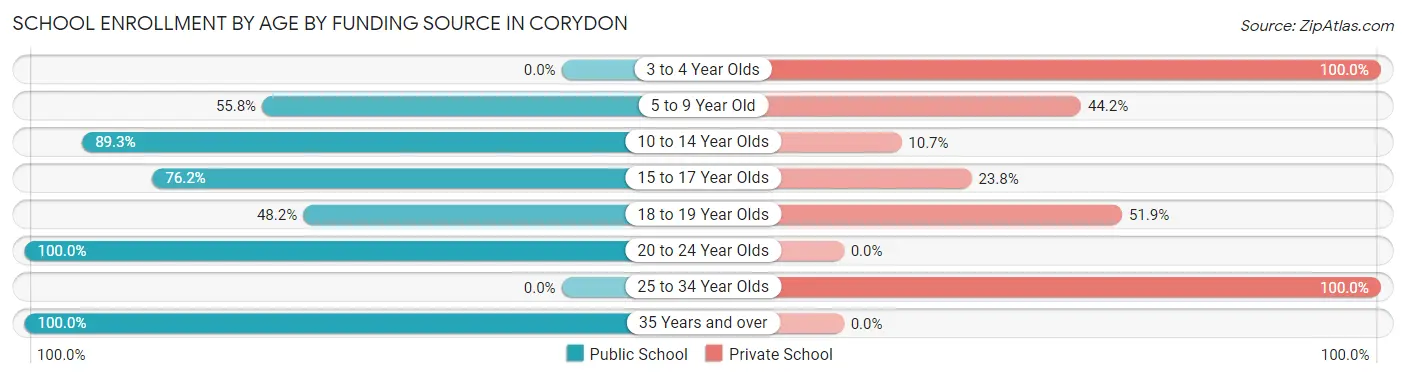
| Age Bracket | Public School | Private School |
| 3 to 4 Year Olds | 0 (0.0%) | 27 (100.0%) |
| 5 to 9 Year Old | 53 (55.8%) | 42 (44.2%) |
| 10 to 14 Year Olds | 216 (89.3%) | 26 (10.7%) |
| 15 to 17 Year Olds | 96 (76.2%) | 30 (23.8%) |
| 18 to 19 Year Olds | 26 (48.1%) | 28 (51.8%) |
| 20 to 24 Year Olds | 21 (100.0%) | 0 (0.0%) |
| 25 to 34 Year Olds | 0 (0.0%) | 21 (100.0%) |
| 35 Years and over | 56 (100.0%) | 0 (0.0%) |
| Total | 468 (72.9%) | 174 (27.1%) |
Educational Attainment by Field of Study in Corydon
Science & technology (94 | 20.0%), business (88 | 18.7%), education (81 | 17.2%), liberal arts & history (56 | 11.9%), and communications (51 | 10.8%) are the most common fields of study among 470 individuals in Corydon who have obtained a bachelor's degree or higher.
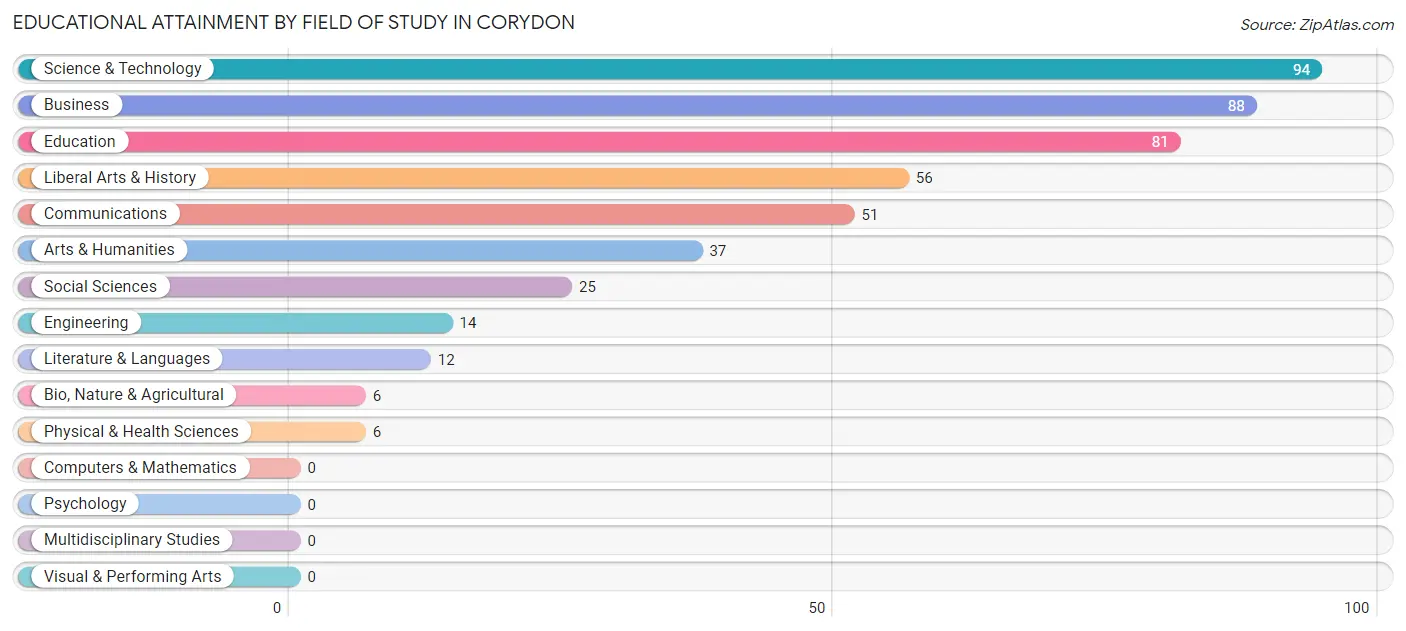
| Field of Study | # Graduates | % Graduates |
| Computers & Mathematics | 0 | 0.0% |
| Bio, Nature & Agricultural | 6 | 1.3% |
| Physical & Health Sciences | 6 | 1.3% |
| Psychology | 0 | 0.0% |
| Social Sciences | 25 | 5.3% |
| Engineering | 14 | 3.0% |
| Multidisciplinary Studies | 0 | 0.0% |
| Science & Technology | 94 | 20.0% |
| Business | 88 | 18.7% |
| Education | 81 | 17.2% |
| Literature & Languages | 12 | 2.5% |
| Liberal Arts & History | 56 | 11.9% |
| Visual & Performing Arts | 0 | 0.0% |
| Communications | 51 | 10.8% |
| Arts & Humanities | 37 | 7.9% |
| Total | 470 | 100.0% |
Transportation & Commute in Corydon
Vehicle Availability by Sex in Corydon
The most prevalent vehicle ownership categories in Corydon are males with 3 vehicles (225, accounting for 38.9%) and females with 3 vehicles (357, making up 31.3%).
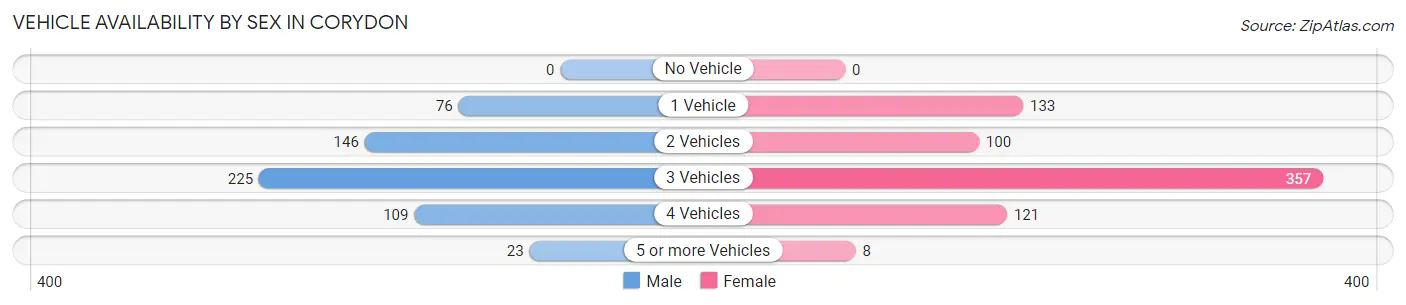
| Vehicles Available | Male | Female |
| No Vehicle | 0 (0.0%) | 0 (0.0%) |
| 1 Vehicle | 76 (13.1%) | 133 (18.5%) |
| 2 Vehicles | 146 (25.2%) | 100 (13.9%) |
| 3 Vehicles | 225 (38.9%) | 357 (49.6%) |
| 4 Vehicles | 109 (18.8%) | 121 (16.8%) |
| 5 or more Vehicles | 23 (4.0%) | 8 (1.1%) |
| Total | 579 (100.0%) | 719 (100.0%) |
Commute Time in Corydon
The most frequently occuring commute durations in Corydon are 5 to 9 minutes (304 commuters, 24.2%), 10 to 14 minutes (157 commuters, 12.5%), and 30 to 34 minutes (155 commuters, 12.3%).
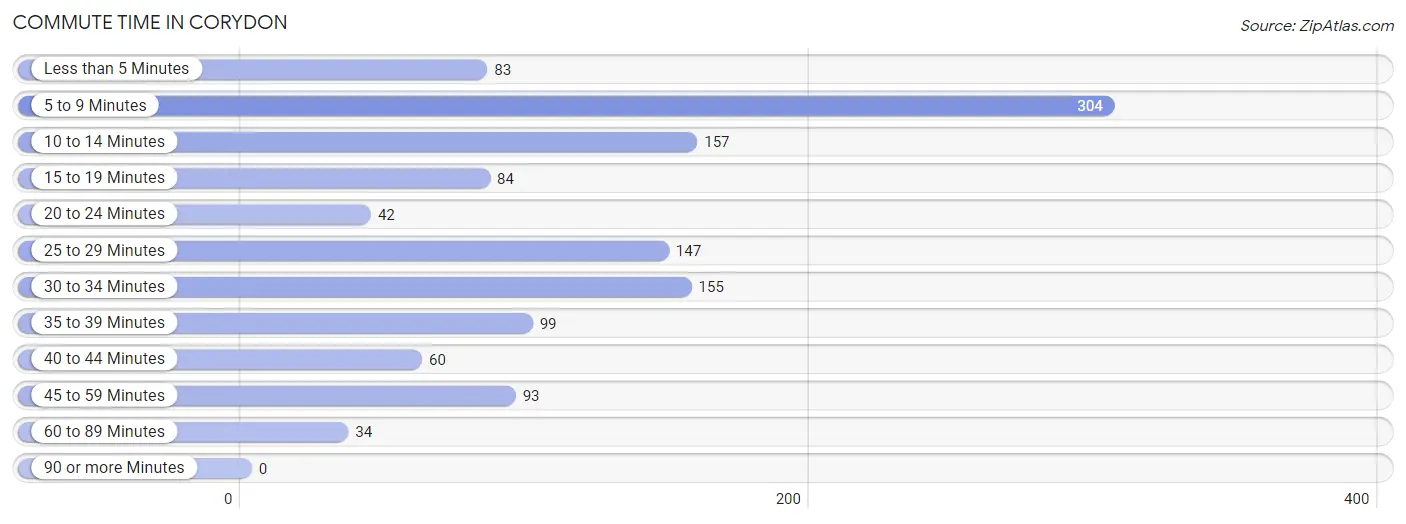
| Commute Time | # Commuters | % Commuters |
| Less than 5 Minutes | 83 | 6.6% |
| 5 to 9 Minutes | 304 | 24.2% |
| 10 to 14 Minutes | 157 | 12.5% |
| 15 to 19 Minutes | 84 | 6.7% |
| 20 to 24 Minutes | 42 | 3.3% |
| 25 to 29 Minutes | 147 | 11.7% |
| 30 to 34 Minutes | 155 | 12.3% |
| 35 to 39 Minutes | 99 | 7.9% |
| 40 to 44 Minutes | 60 | 4.8% |
| 45 to 59 Minutes | 93 | 7.4% |
| 60 to 89 Minutes | 34 | 2.7% |
| 90 or more Minutes | 0 | 0.0% |
Commute Time by Sex in Corydon
The most common commute times in Corydon are 5 to 9 minutes (121 commuters, 21.0%) for males and 5 to 9 minutes (183 commuters, 26.8%) for females.
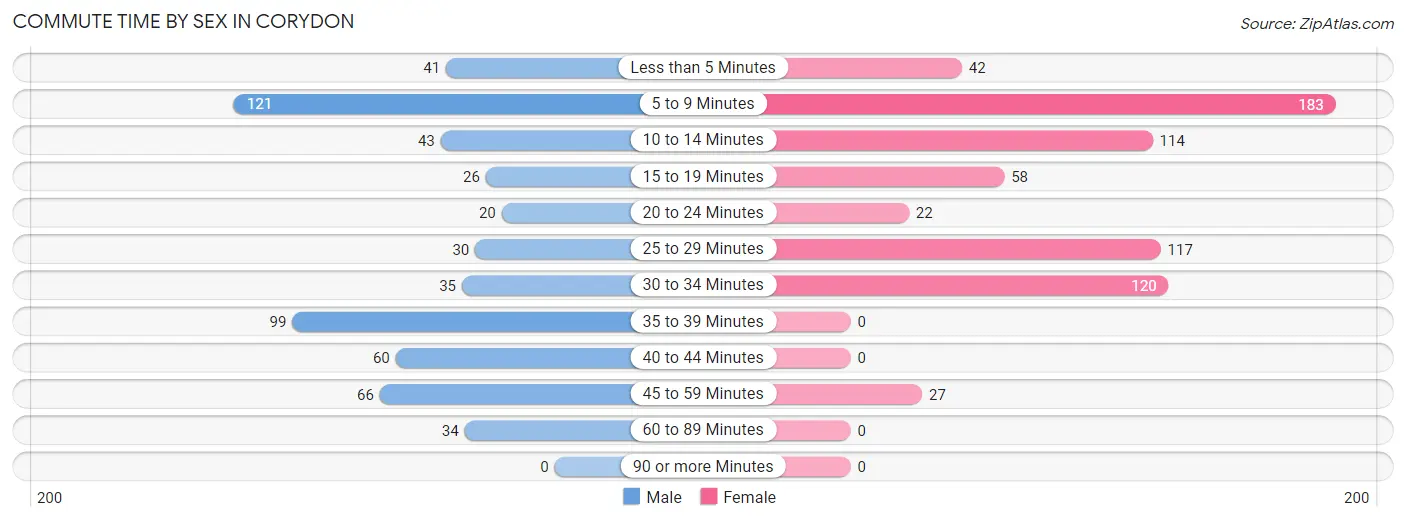
| Commute Time | Male | Female |
| Less than 5 Minutes | 41 (7.1%) | 42 (6.1%) |
| 5 to 9 Minutes | 121 (21.0%) | 183 (26.8%) |
| 10 to 14 Minutes | 43 (7.5%) | 114 (16.7%) |
| 15 to 19 Minutes | 26 (4.5%) | 58 (8.5%) |
| 20 to 24 Minutes | 20 (3.5%) | 22 (3.2%) |
| 25 to 29 Minutes | 30 (5.2%) | 117 (17.1%) |
| 30 to 34 Minutes | 35 (6.1%) | 120 (17.6%) |
| 35 to 39 Minutes | 99 (17.2%) | 0 (0.0%) |
| 40 to 44 Minutes | 60 (10.4%) | 0 (0.0%) |
| 45 to 59 Minutes | 66 (11.5%) | 27 (4.0%) |
| 60 to 89 Minutes | 34 (5.9%) | 0 (0.0%) |
| 90 or more Minutes | 0 (0.0%) | 0 (0.0%) |
Time of Departure to Work by Sex in Corydon
The most frequent times of departure to work in Corydon are 12:00 AM to 4:59 AM (94, 16.4%) for males and 7:30 AM to 7:59 AM (131, 19.2%) for females.
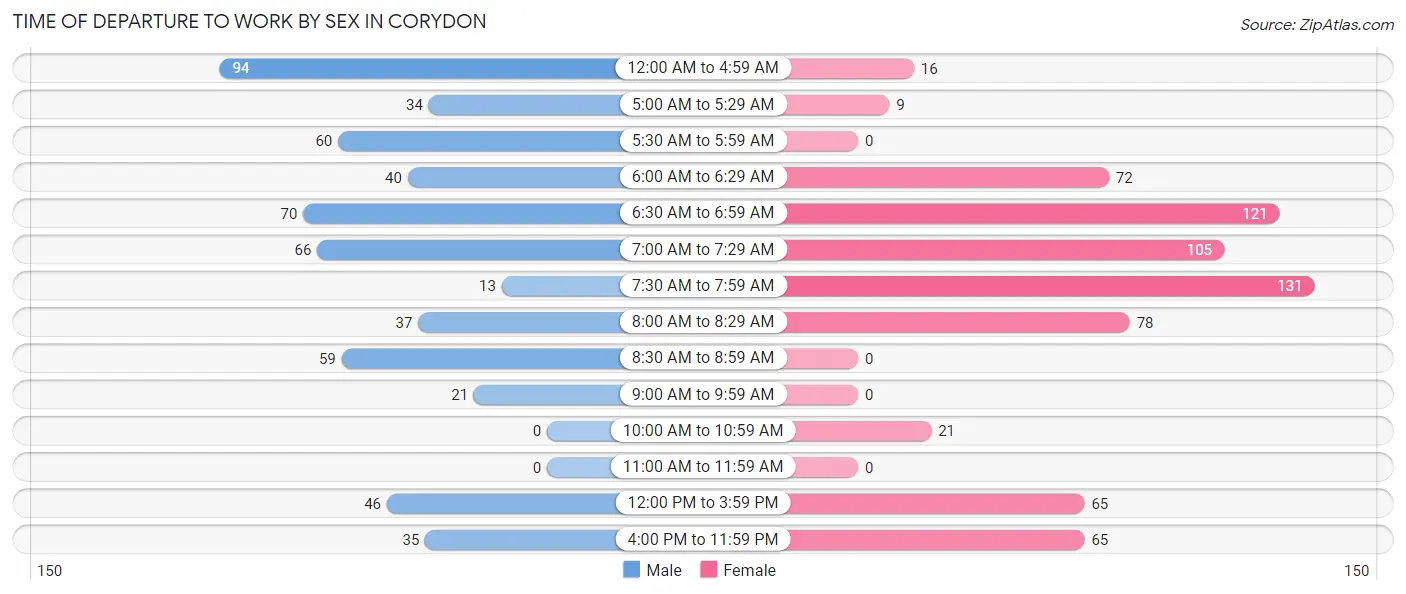
| Time of Departure | Male | Female |
| 12:00 AM to 4:59 AM | 94 (16.4%) | 16 (2.3%) |
| 5:00 AM to 5:29 AM | 34 (5.9%) | 9 (1.3%) |
| 5:30 AM to 5:59 AM | 60 (10.4%) | 0 (0.0%) |
| 6:00 AM to 6:29 AM | 40 (7.0%) | 72 (10.5%) |
| 6:30 AM to 6:59 AM | 70 (12.2%) | 121 (17.7%) |
| 7:00 AM to 7:29 AM | 66 (11.5%) | 105 (15.4%) |
| 7:30 AM to 7:59 AM | 13 (2.3%) | 131 (19.2%) |
| 8:00 AM to 8:29 AM | 37 (6.4%) | 78 (11.4%) |
| 8:30 AM to 8:59 AM | 59 (10.3%) | 0 (0.0%) |
| 9:00 AM to 9:59 AM | 21 (3.6%) | 0 (0.0%) |
| 10:00 AM to 10:59 AM | 0 (0.0%) | 21 (3.1%) |
| 11:00 AM to 11:59 AM | 0 (0.0%) | 0 (0.0%) |
| 12:00 PM to 3:59 PM | 46 (8.0%) | 65 (9.5%) |
| 4:00 PM to 11:59 PM | 35 (6.1%) | 65 (9.5%) |
| Total | 575 (100.0%) | 683 (100.0%) |
Housing Occupancy in Corydon
Occupancy by Ownership in Corydon
Of the total 1,315 dwellings in Corydon, owner-occupied units account for 822 (62.5%), while renter-occupied units make up 493 (37.5%).
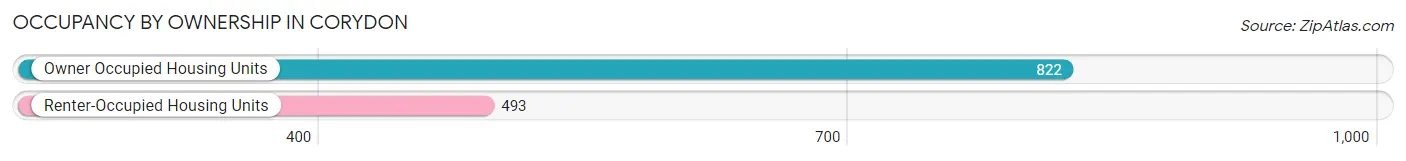
| Occupancy | # Housing Units | % Housing Units |
| Owner Occupied Housing Units | 822 | 62.5% |
| Renter-Occupied Housing Units | 493 | 37.5% |
| Total Occupied Housing Units | 1,315 | 100.0% |
Occupancy by Household Size in Corydon
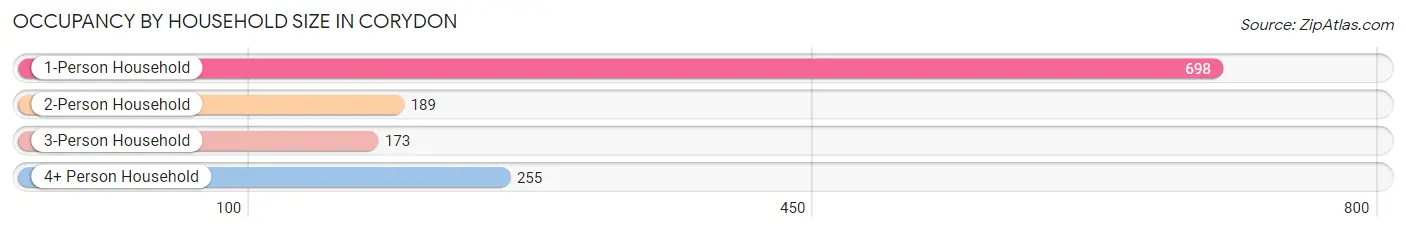
| Household Size | # Housing Units | % Housing Units |
| 1-Person Household | 698 | 53.1% |
| 2-Person Household | 189 | 14.4% |
| 3-Person Household | 173 | 13.2% |
| 4+ Person Household | 255 | 19.4% |
| Total Housing Units | 1,315 | 100.0% |
Occupancy by Ownership by Household Size in Corydon
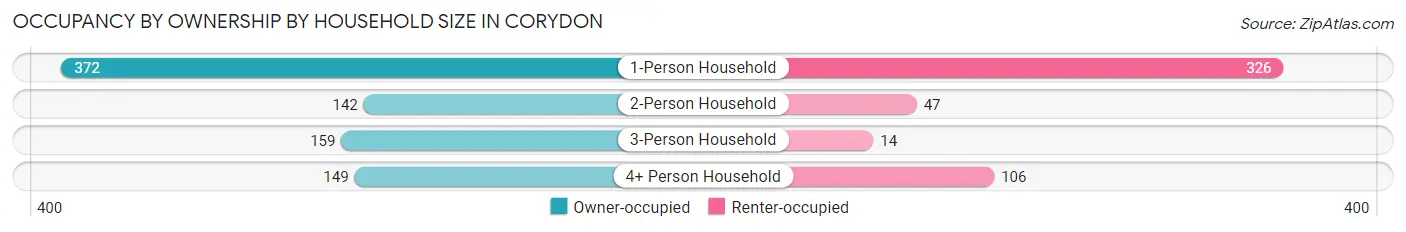
| Household Size | Owner-occupied | Renter-occupied |
| 1-Person Household | 372 (53.3%) | 326 (46.7%) |
| 2-Person Household | 142 (75.1%) | 47 (24.9%) |
| 3-Person Household | 159 (91.9%) | 14 (8.1%) |
| 4+ Person Household | 149 (58.4%) | 106 (41.6%) |
| Total Housing Units | 822 (62.5%) | 493 (37.5%) |
Occupancy by Educational Attainment in Corydon
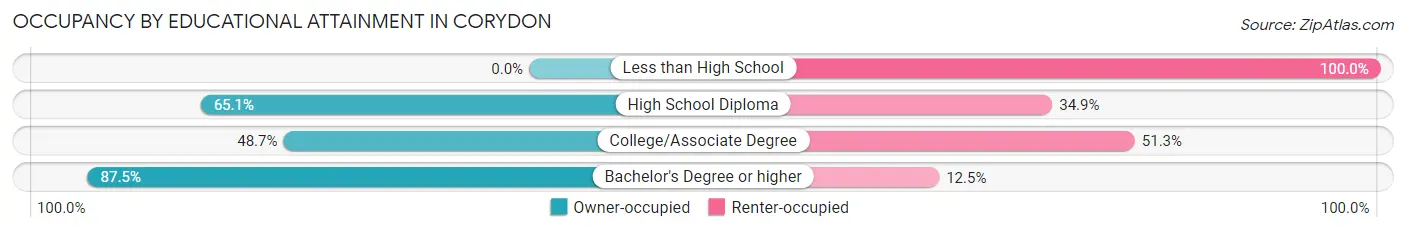
| Household Size | Owner-occupied | Renter-occupied |
| Less than High School | 0 (0.0%) | 52 (100.0%) |
| High School Diploma | 341 (65.1%) | 183 (34.9%) |
| College/Associate Degree | 208 (48.7%) | 219 (51.3%) |
| Bachelor's Degree or higher | 273 (87.5%) | 39 (12.5%) |
Occupancy by Age of Householder in Corydon
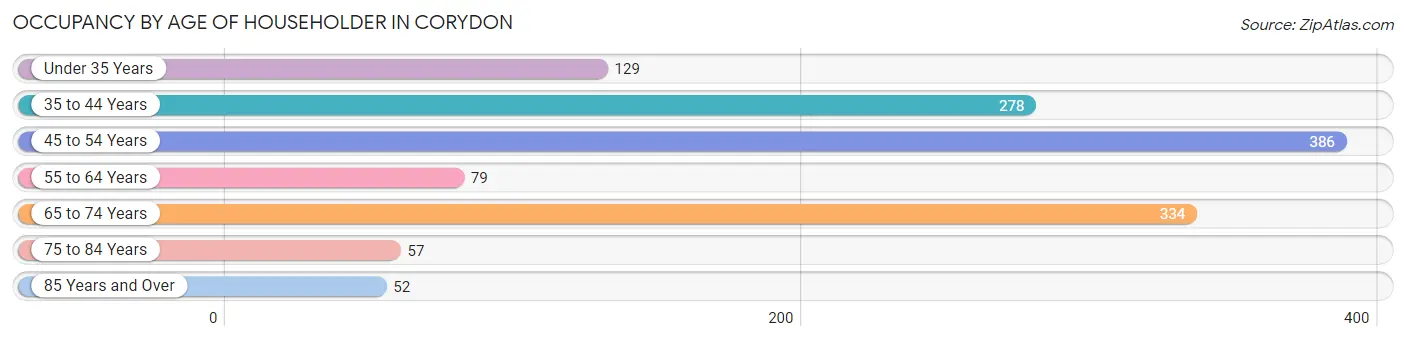
| Age Bracket | # Households | % Households |
| Under 35 Years | 129 | 9.8% |
| 35 to 44 Years | 278 | 21.1% |
| 45 to 54 Years | 386 | 29.3% |
| 55 to 64 Years | 79 | 6.0% |
| 65 to 74 Years | 334 | 25.4% |
| 75 to 84 Years | 57 | 4.3% |
| 85 Years and Over | 52 | 4.0% |
| Total | 1,315 | 100.0% |
Housing Finances in Corydon
Median Income by Occupancy in Corydon
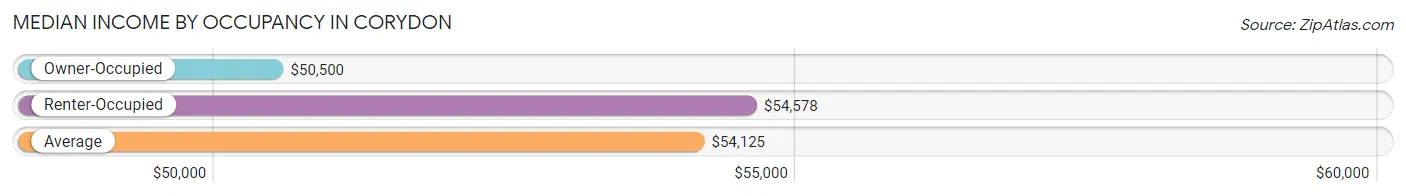
| Occupancy Type | # Households | Median Income |
| Owner-Occupied | 822 (62.5%) | $50,500 |
| Renter-Occupied | 493 (37.5%) | $54,578 |
| Average | 1,315 (100.0%) | $54,125 |
Occupancy by Householder Income Bracket in Corydon
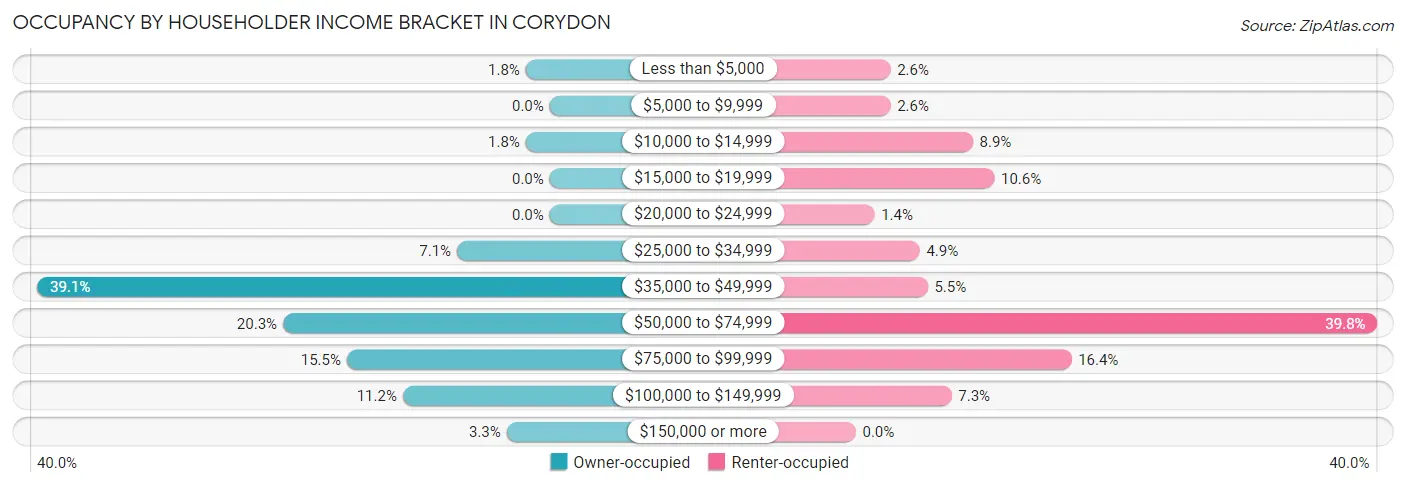
| Income Bracket | Owner-occupied | Renter-occupied |
| Less than $5,000 | 15 (1.8%) | 13 (2.6%) |
| $5,000 to $9,999 | 0 (0.0%) | 13 (2.6%) |
| $10,000 to $14,999 | 15 (1.8%) | 44 (8.9%) |
| $15,000 to $19,999 | 0 (0.0%) | 52 (10.5%) |
| $20,000 to $24,999 | 0 (0.0%) | 7 (1.4%) |
| $25,000 to $34,999 | 58 (7.1%) | 24 (4.9%) |
| $35,000 to $49,999 | 321 (39.1%) | 27 (5.5%) |
| $50,000 to $74,999 | 167 (20.3%) | 196 (39.8%) |
| $75,000 to $99,999 | 127 (15.4%) | 81 (16.4%) |
| $100,000 to $149,999 | 92 (11.2%) | 36 (7.3%) |
| $150,000 or more | 27 (3.3%) | 0 (0.0%) |
| Total | 822 (100.0%) | 493 (100.0%) |
Monthly Housing Cost Tiers in Corydon
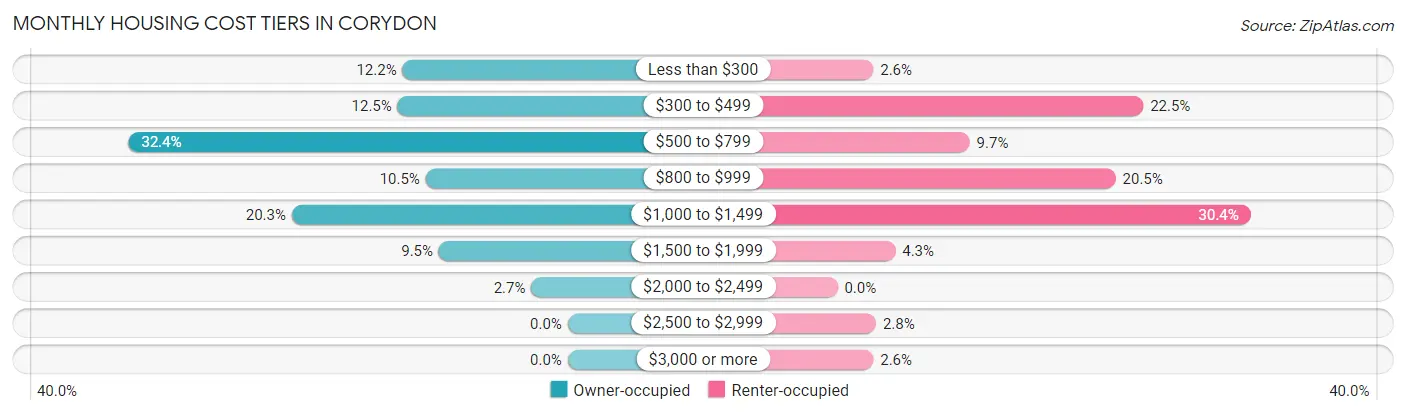
| Monthly Cost | Owner-occupied | Renter-occupied |
| Less than $300 | 100 (12.2%) | 13 (2.6%) |
| $300 to $499 | 103 (12.5%) | 111 (22.5%) |
| $500 to $799 | 266 (32.4%) | 48 (9.7%) |
| $800 to $999 | 86 (10.5%) | 101 (20.5%) |
| $1,000 to $1,499 | 167 (20.3%) | 150 (30.4%) |
| $1,500 to $1,999 | 78 (9.5%) | 21 (4.3%) |
| $2,000 to $2,499 | 22 (2.7%) | 0 (0.0%) |
| $2,500 to $2,999 | 0 (0.0%) | 14 (2.8%) |
| $3,000 or more | 0 (0.0%) | 13 (2.6%) |
| Total | 822 (100.0%) | 493 (100.0%) |
Physical Housing Characteristics in Corydon
Housing Structures in Corydon
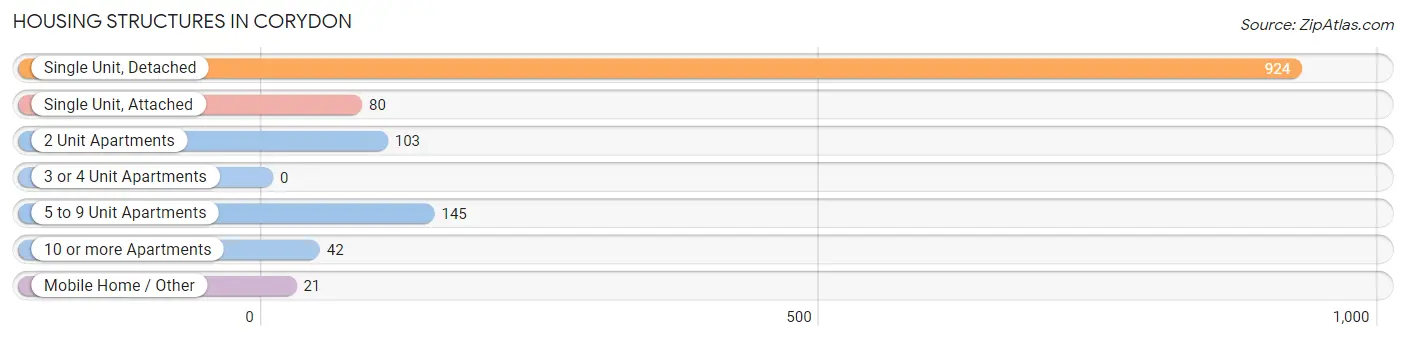
| Structure Type | # Housing Units | % Housing Units |
| Single Unit, Detached | 924 | 70.3% |
| Single Unit, Attached | 80 | 6.1% |
| 2 Unit Apartments | 103 | 7.8% |
| 3 or 4 Unit Apartments | 0 | 0.0% |
| 5 to 9 Unit Apartments | 145 | 11.0% |
| 10 or more Apartments | 42 | 3.2% |
| Mobile Home / Other | 21 | 1.6% |
| Total | 1,315 | 100.0% |
Housing Structures by Occupancy in Corydon
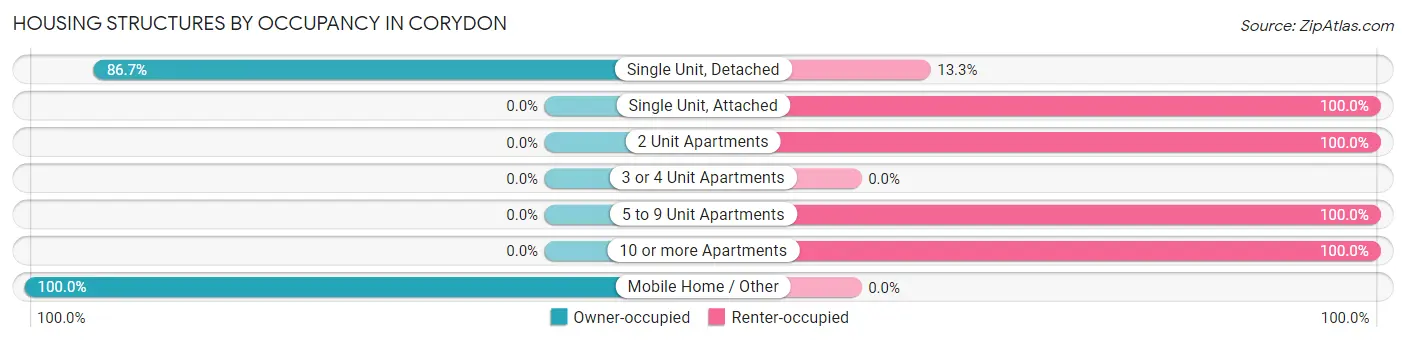
| Structure Type | Owner-occupied | Renter-occupied |
| Single Unit, Detached | 801 (86.7%) | 123 (13.3%) |
| Single Unit, Attached | 0 (0.0%) | 80 (100.0%) |
| 2 Unit Apartments | 0 (0.0%) | 103 (100.0%) |
| 3 or 4 Unit Apartments | 0 (0.0%) | 0 (0.0%) |
| 5 to 9 Unit Apartments | 0 (0.0%) | 145 (100.0%) |
| 10 or more Apartments | 0 (0.0%) | 42 (100.0%) |
| Mobile Home / Other | 21 (100.0%) | 0 (0.0%) |
| Total | 822 (62.5%) | 493 (37.5%) |
Housing Structures by Number of Rooms in Corydon
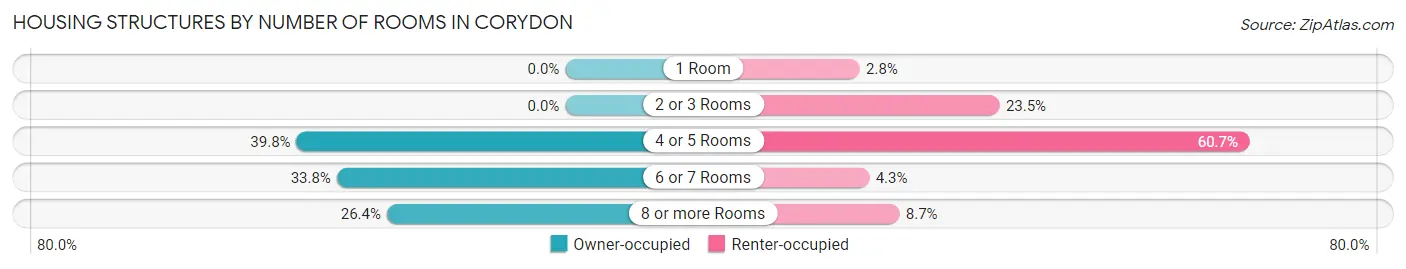
| Number of Rooms | Owner-occupied | Renter-occupied |
| 1 Room | 0 (0.0%) | 14 (2.8%) |
| 2 or 3 Rooms | 0 (0.0%) | 116 (23.5%) |
| 4 or 5 Rooms | 327 (39.8%) | 299 (60.7%) |
| 6 or 7 Rooms | 278 (33.8%) | 21 (4.3%) |
| 8 or more Rooms | 217 (26.4%) | 43 (8.7%) |
| Total | 822 (100.0%) | 493 (100.0%) |
Housing Structure by Heating Type in Corydon
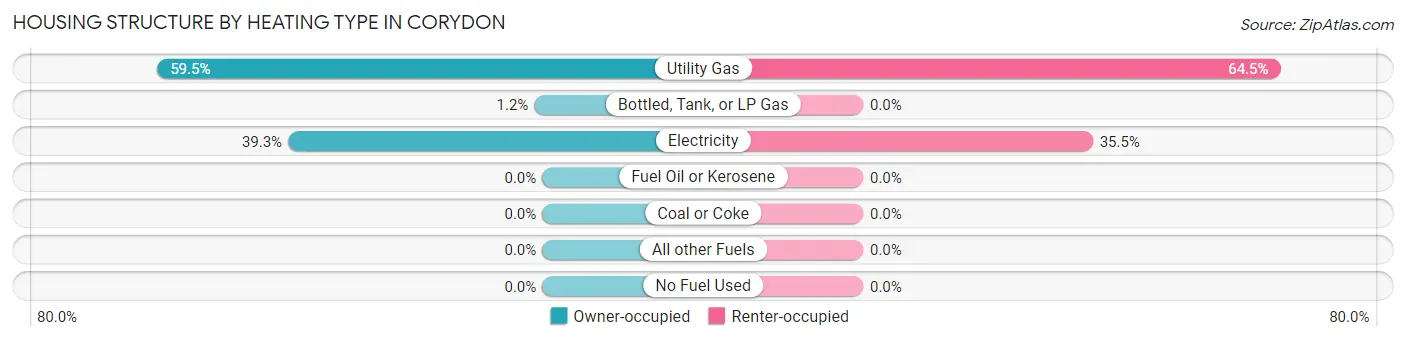
| Heating Type | Owner-occupied | Renter-occupied |
| Utility Gas | 489 (59.5%) | 318 (64.5%) |
| Bottled, Tank, or LP Gas | 10 (1.2%) | 0 (0.0%) |
| Electricity | 323 (39.3%) | 175 (35.5%) |
| Fuel Oil or Kerosene | 0 (0.0%) | 0 (0.0%) |
| Coal or Coke | 0 (0.0%) | 0 (0.0%) |
| All other Fuels | 0 (0.0%) | 0 (0.0%) |
| No Fuel Used | 0 (0.0%) | 0 (0.0%) |
| Total | 822 (100.0%) | 493 (100.0%) |
Household Vehicle Usage in Corydon
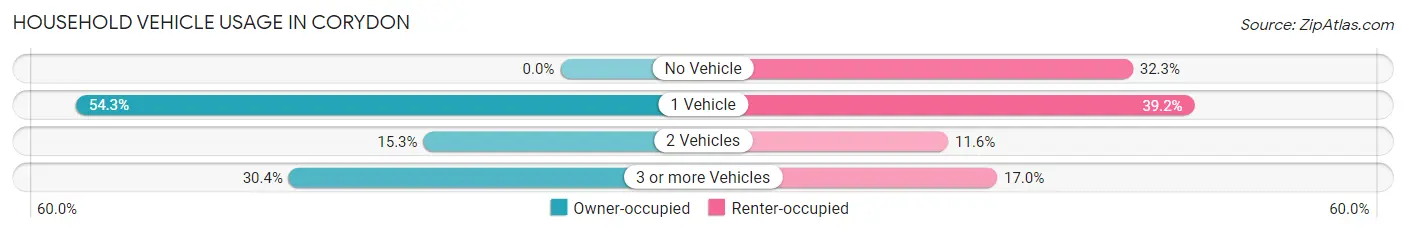
| Vehicles per Household | Owner-occupied | Renter-occupied |
| No Vehicle | 0 (0.0%) | 159 (32.3%) |
| 1 Vehicle | 446 (54.3%) | 193 (39.2%) |
| 2 Vehicles | 126 (15.3%) | 57 (11.6%) |
| 3 or more Vehicles | 250 (30.4%) | 84 (17.0%) |
| Total | 822 (100.0%) | 493 (100.0%) |
Real Estate & Mortgages in Corydon
Real Estate and Mortgage Overview in Corydon
| Characteristic | Without Mortgage | With Mortgage |
| Housing Units | 228 | 594 |
| Median Property Value | $82,800 | $133,200 |
| Median Household Income | $46,161 | $27 |
| Monthly Housing Costs | $333 | $0 |
| Real Estate Taxes | $437 | $12 |
Property Value by Mortgage Status in Corydon
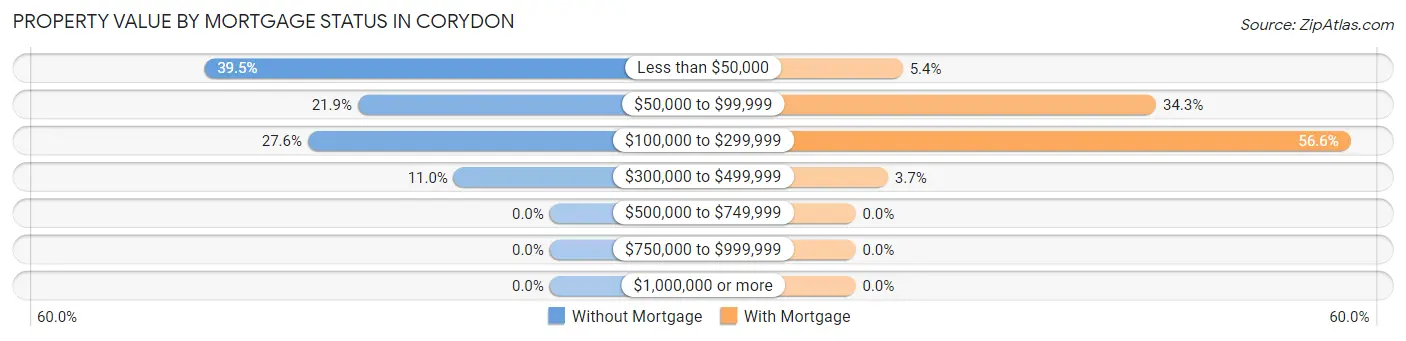
| Property Value | Without Mortgage | With Mortgage |
| Less than $50,000 | 90 (39.5%) | 32 (5.4%) |
| $50,000 to $99,999 | 50 (21.9%) | 204 (34.3%) |
| $100,000 to $299,999 | 63 (27.6%) | 336 (56.6%) |
| $300,000 to $499,999 | 25 (11.0%) | 22 (3.7%) |
| $500,000 to $749,999 | 0 (0.0%) | 0 (0.0%) |
| $750,000 to $999,999 | 0 (0.0%) | 0 (0.0%) |
| $1,000,000 or more | 0 (0.0%) | 0 (0.0%) |
| Total | 228 (100.0%) | 594 (100.0%) |
Household Income by Mortgage Status in Corydon
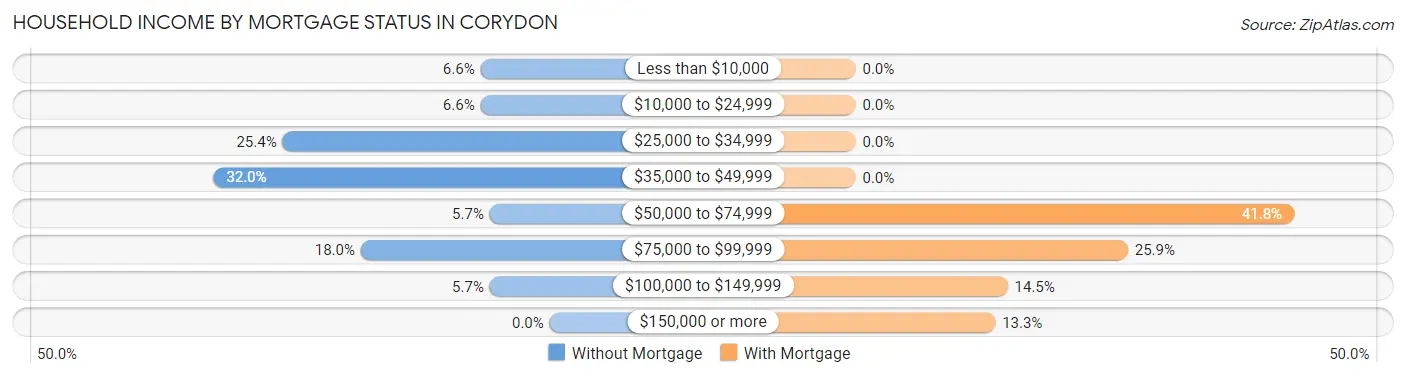
| Household Income | Without Mortgage | With Mortgage |
| Less than $10,000 | 15 (6.6%) | 0 (0.0%) |
| $10,000 to $24,999 | 15 (6.6%) | 0 (0.0%) |
| $25,000 to $34,999 | 58 (25.4%) | 0 (0.0%) |
| $35,000 to $49,999 | 73 (32.0%) | 0 (0.0%) |
| $50,000 to $74,999 | 13 (5.7%) | 248 (41.7%) |
| $75,000 to $99,999 | 41 (18.0%) | 154 (25.9%) |
| $100,000 to $149,999 | 13 (5.7%) | 86 (14.5%) |
| $150,000 or more | 0 (0.0%) | 79 (13.3%) |
| Total | 228 (100.0%) | 594 (100.0%) |
Property Value to Household Income Ratio in Corydon
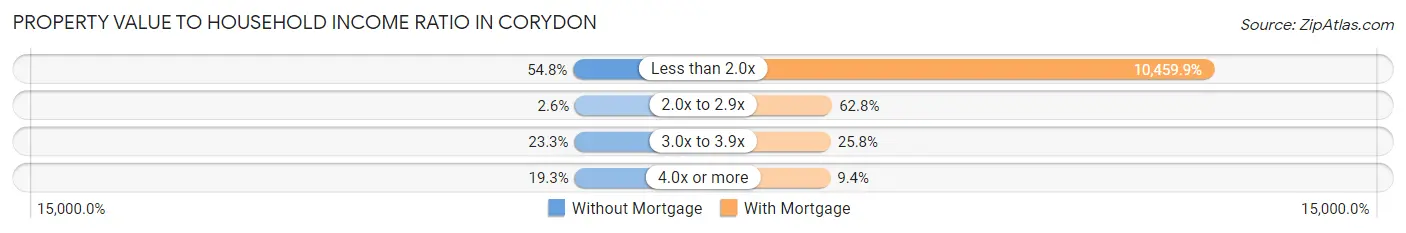
| Value-to-Income Ratio | Without Mortgage | With Mortgage |
| Less than 2.0x | 125 (54.8%) | 62,132 (10,459.9%) |
| 2.0x to 2.9x | 6 (2.6%) | 373 (62.8%) |
| 3.0x to 3.9x | 53 (23.3%) | 153 (25.8%) |
| 4.0x or more | 44 (19.3%) | 56 (9.4%) |
| Total | 228 (100.0%) | 594 (100.0%) |
Real Estate Taxes by Mortgage Status in Corydon
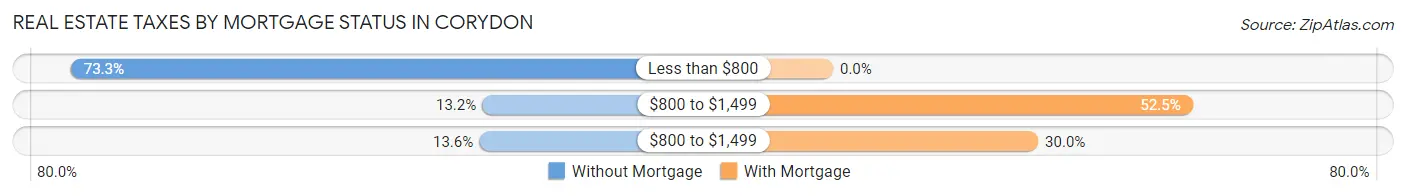
| Property Taxes | Without Mortgage | With Mortgage |
| Less than $800 | 167 (73.3%) | 0 (0.0%) |
| $800 to $1,499 | 30 (13.2%) | 312 (52.5%) |
| $800 to $1,499 | 31 (13.6%) | 178 (30.0%) |
| Total | 228 (100.0%) | 594 (100.0%) |
Health & Disability in Corydon
Health Insurance Coverage by Age in Corydon
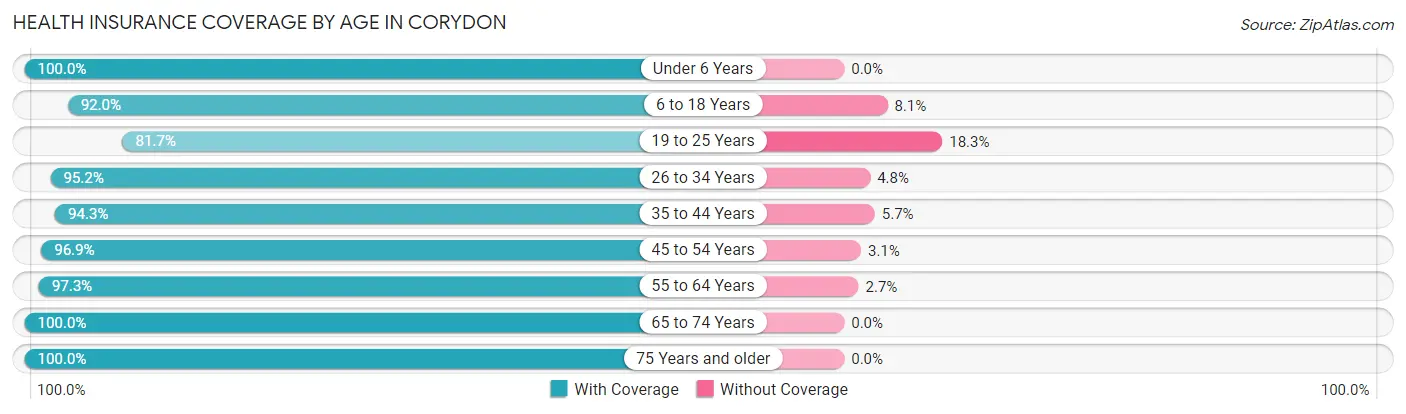
| Age Bracket | With Coverage | Without Coverage |
| Under 6 Years | 252 (100.0%) | 0 (0.0%) |
| 6 to 18 Years | 411 (91.9%) | 36 (8.1%) |
| 19 to 25 Years | 170 (81.7%) | 38 (18.3%) |
| 26 to 34 Years | 256 (95.2%) | 13 (4.8%) |
| 35 to 44 Years | 563 (94.3%) | 34 (5.7%) |
| 45 to 54 Years | 466 (96.9%) | 15 (3.1%) |
| 55 to 64 Years | 146 (97.3%) | 4 (2.7%) |
| 65 to 74 Years | 410 (100.0%) | 0 (0.0%) |
| 75 Years and older | 131 (100.0%) | 0 (0.0%) |
| Total | 2,805 (95.3%) | 140 (4.8%) |
Health Insurance Coverage by Citizenship Status in Corydon
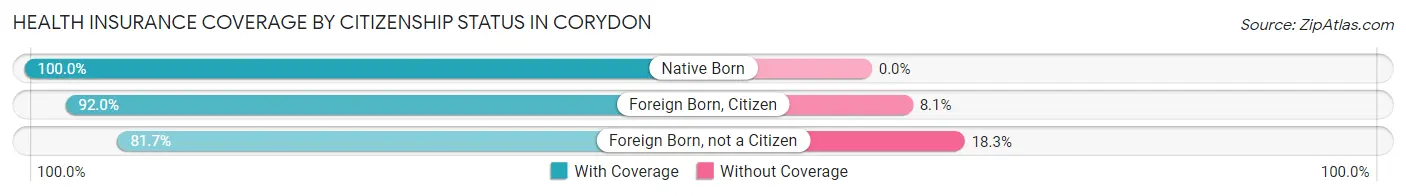
| Citizenship Status | With Coverage | Without Coverage |
| Native Born | 252 (100.0%) | 0 (0.0%) |
| Foreign Born, Citizen | 411 (91.9%) | 36 (8.1%) |
| Foreign Born, not a Citizen | 170 (81.7%) | 38 (18.3%) |
Health Insurance Coverage by Household Income in Corydon
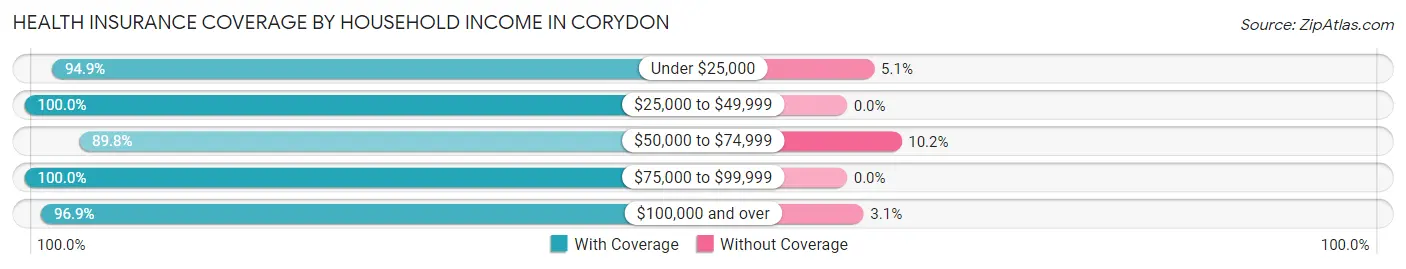
| Household Income | With Coverage | Without Coverage |
| Under $25,000 | 185 (94.9%) | 10 (5.1%) |
| $25,000 to $49,999 | 594 (100.0%) | 0 (0.0%) |
| $50,000 to $74,999 | 818 (89.8%) | 93 (10.2%) |
| $75,000 to $99,999 | 524 (100.0%) | 0 (0.0%) |
| $100,000 and over | 655 (96.9%) | 21 (3.1%) |
Public vs Private Health Insurance Coverage by Age in Corydon
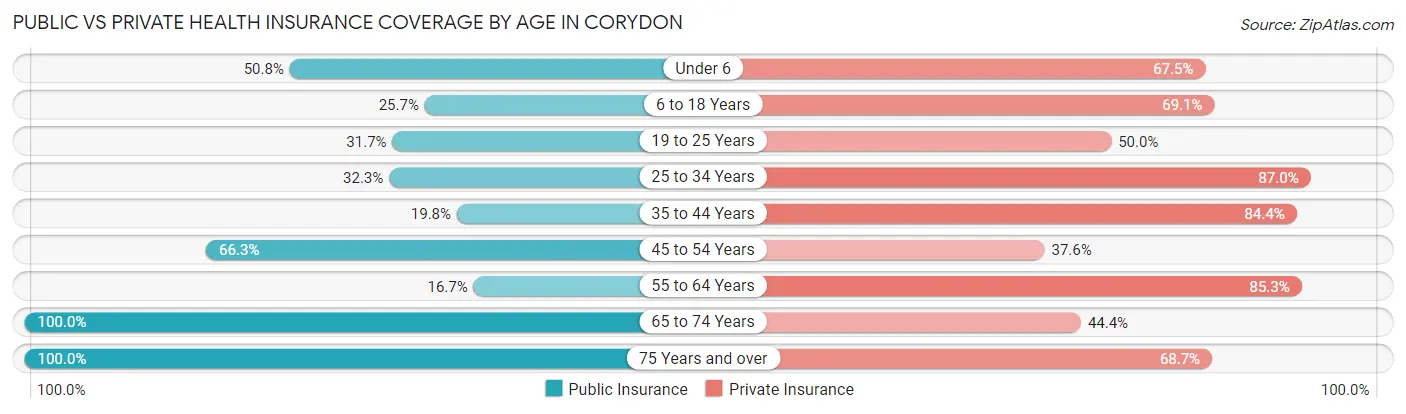
| Age Bracket | Public Insurance | Private Insurance |
| Under 6 | 128 (50.8%) | 170 (67.5%) |
| 6 to 18 Years | 115 (25.7%) | 309 (69.1%) |
| 19 to 25 Years | 66 (31.7%) | 104 (50.0%) |
| 25 to 34 Years | 87 (32.3%) | 234 (87.0%) |
| 35 to 44 Years | 118 (19.8%) | 504 (84.4%) |
| 45 to 54 Years | 319 (66.3%) | 181 (37.6%) |
| 55 to 64 Years | 25 (16.7%) | 128 (85.3%) |
| 65 to 74 Years | 410 (100.0%) | 182 (44.4%) |
| 75 Years and over | 131 (100.0%) | 90 (68.7%) |
| Total | 1,399 (47.5%) | 1,902 (64.6%) |
Disability Status by Sex by Age in Corydon
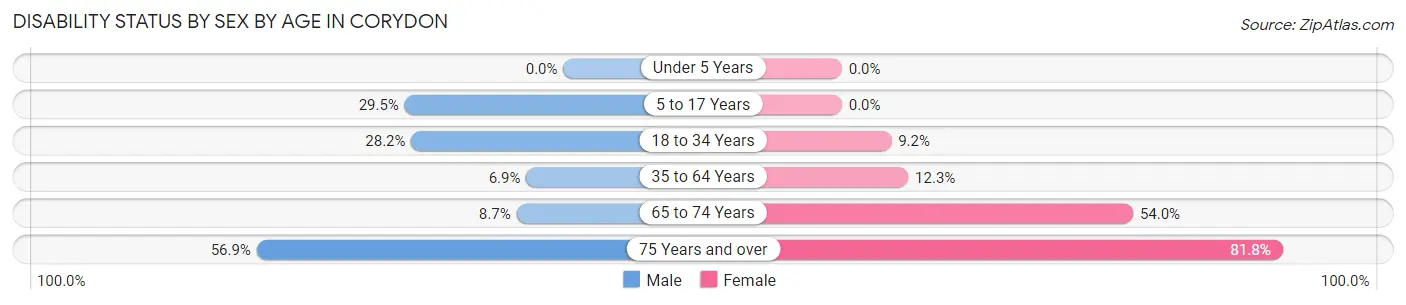
| Age Bracket | Male | Female |
| Under 5 Years | 0 (0.0%) | 0 (0.0%) |
| 5 to 17 Years | 81 (29.4%) | 0 (0.0%) |
| 18 to 34 Years | 77 (28.2%) | 21 (9.2%) |
| 35 to 64 Years | 47 (6.9%) | 67 (12.3%) |
| 65 to 74 Years | 12 (8.7%) | 147 (54.0%) |
| 75 Years and over | 37 (56.9%) | 54 (81.8%) |
Disability Class by Sex by Age in Corydon
Disability Class: Hearing Difficulty
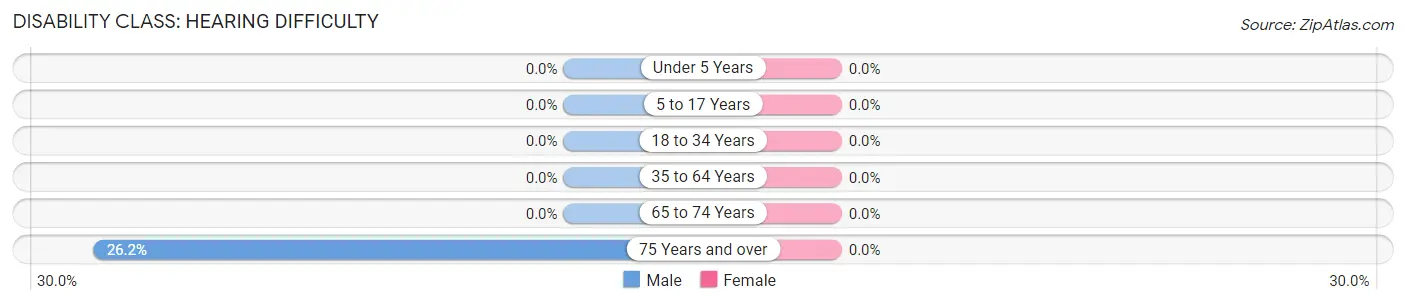
| Age Bracket | Male | Female |
| Under 5 Years | 0 (0.0%) | 0 (0.0%) |
| 5 to 17 Years | 0 (0.0%) | 0 (0.0%) |
| 18 to 34 Years | 0 (0.0%) | 0 (0.0%) |
| 35 to 64 Years | 0 (0.0%) | 0 (0.0%) |
| 65 to 74 Years | 0 (0.0%) | 0 (0.0%) |
| 75 Years and over | 17 (26.2%) | 0 (0.0%) |
Disability Class: Vision Difficulty
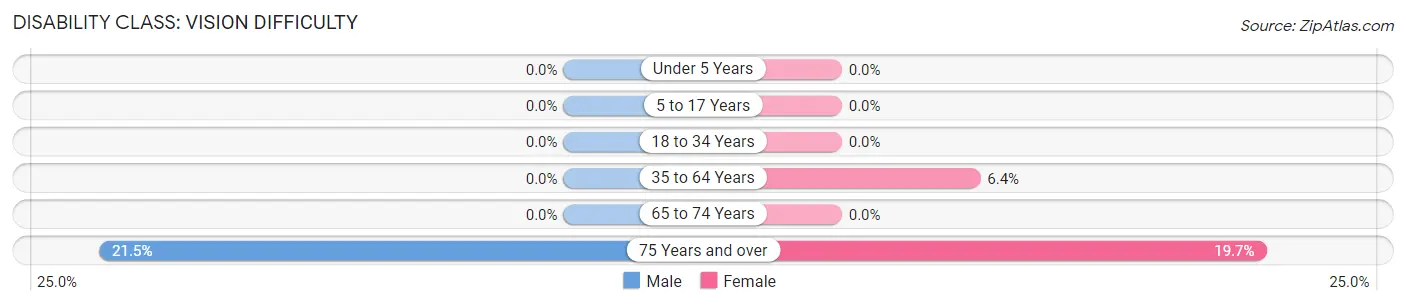
| Age Bracket | Male | Female |
| Under 5 Years | 0 (0.0%) | 0 (0.0%) |
| 5 to 17 Years | 0 (0.0%) | 0 (0.0%) |
| 18 to 34 Years | 0 (0.0%) | 0 (0.0%) |
| 35 to 64 Years | 0 (0.0%) | 35 (6.4%) |
| 65 to 74 Years | 0 (0.0%) | 0 (0.0%) |
| 75 Years and over | 14 (21.5%) | 13 (19.7%) |
Disability Class: Cognitive Difficulty
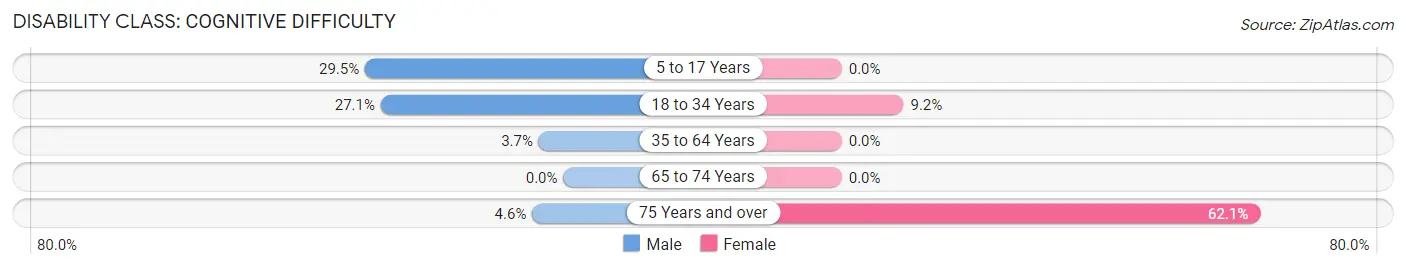
| Age Bracket | Male | Female |
| 5 to 17 Years | 81 (29.4%) | 0 (0.0%) |
| 18 to 34 Years | 74 (27.1%) | 21 (9.2%) |
| 35 to 64 Years | 25 (3.6%) | 0 (0.0%) |
| 65 to 74 Years | 0 (0.0%) | 0 (0.0%) |
| 75 Years and over | 3 (4.6%) | 41 (62.1%) |
Disability Class: Ambulatory Difficulty
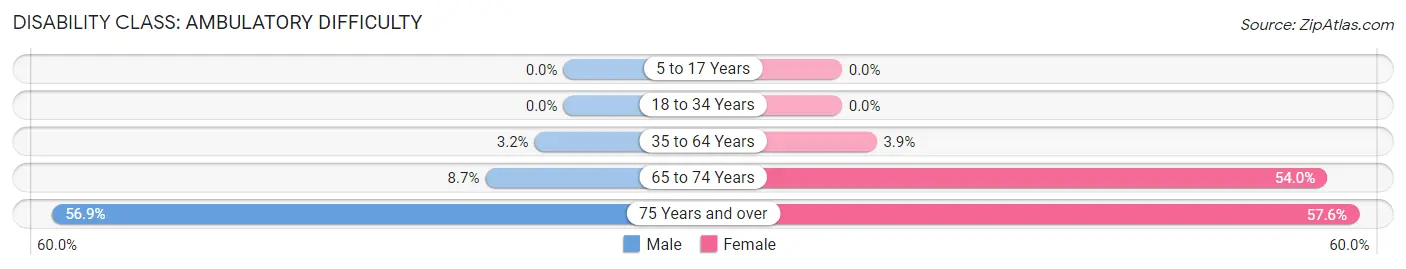
| Age Bracket | Male | Female |
| 5 to 17 Years | 0 (0.0%) | 0 (0.0%) |
| 18 to 34 Years | 0 (0.0%) | 0 (0.0%) |
| 35 to 64 Years | 22 (3.2%) | 21 (3.9%) |
| 65 to 74 Years | 12 (8.7%) | 147 (54.0%) |
| 75 Years and over | 37 (56.9%) | 38 (57.6%) |
Disability Class: Self-Care Difficulty
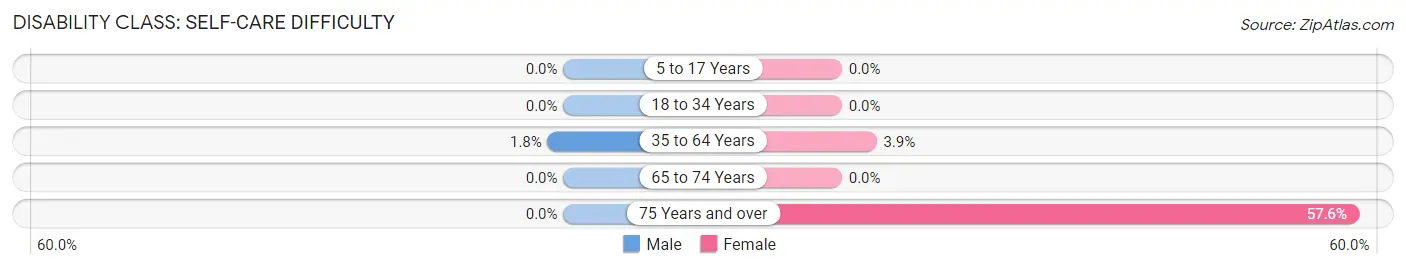
| Age Bracket | Male | Female |
| 5 to 17 Years | 0 (0.0%) | 0 (0.0%) |
| 18 to 34 Years | 0 (0.0%) | 0 (0.0%) |
| 35 to 64 Years | 12 (1.8%) | 21 (3.9%) |
| 65 to 74 Years | 0 (0.0%) | 0 (0.0%) |
| 75 Years and over | 0 (0.0%) | 38 (57.6%) |
Technology Access in Corydon
Computing Device Access in Corydon
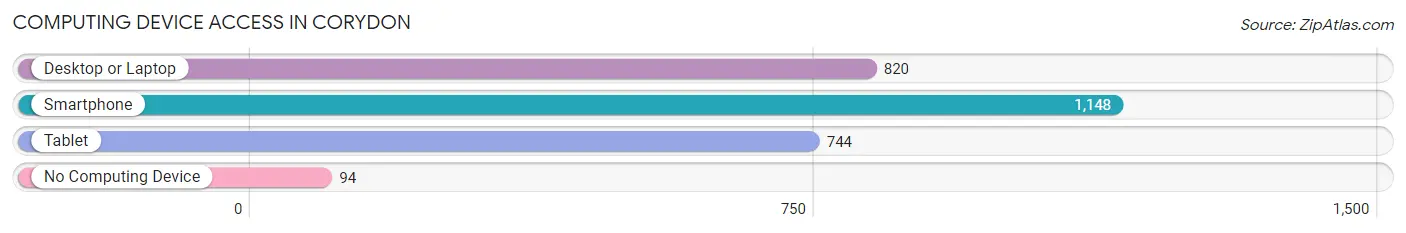
| Device Type | # Households | % Households |
| Desktop or Laptop | 820 | 62.4% |
| Smartphone | 1,148 | 87.3% |
| Tablet | 744 | 56.6% |
| No Computing Device | 94 | 7.1% |
| Total | 1,315 | 100.0% |
Internet Access in Corydon
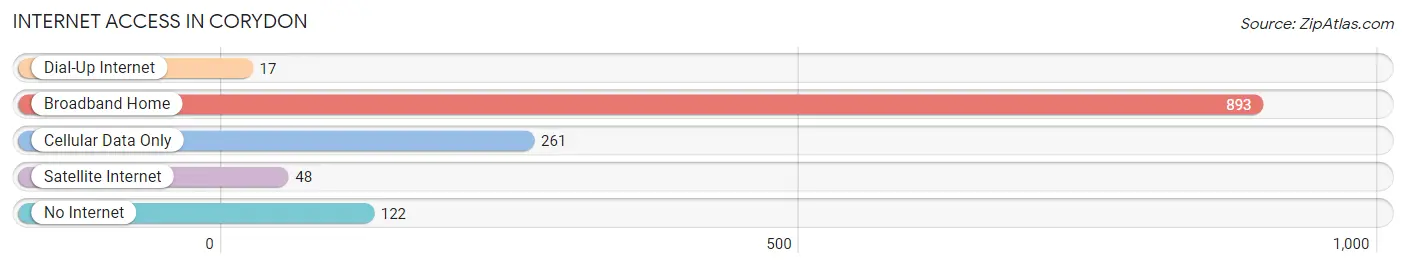
| Internet Type | # Households | % Households |
| Dial-Up Internet | 17 | 1.3% |
| Broadband Home | 893 | 67.9% |
| Cellular Data Only | 261 | 19.9% |
| Satellite Internet | 48 | 3.6% |
| No Internet | 122 | 9.3% |
| Total | 1,315 | 100.0% |
Corydon Summary
Corydon is a small town located in Harrison County, Indiana, United States. It is the county seat of Harrison County and is located about 30 miles northwest of Louisville, Kentucky. The population was 2,946 at the 2010 census.
History
Corydon was founded in 1808 by General John Tipton and named after the Greek poet Theocritus's pastoral poem, "Idylls of Corydon". It was the first capital of the Indiana Territory from 1813 to 1816, and the first state capital of Indiana from 1816 to 1825. During the American Civil War, Corydon was the site of the Battle of Corydon, the only official pitched battle fought in Indiana during the war.
Geography
Corydon is located at 38°10′17″N 86°7′15″W (38.171445, -86.120845). According to the 2010 census, Corydon has a total area of 2.1 square miles (5.4 km2), all land.
Economy
Corydon's economy is largely based on tourism, with many visitors coming to the town to visit its historic sites. The town is also home to several small businesses, including a winery, a brewery, and a distillery.
Demographics
As of the census of 2010, there were 2,946 people, 1,220 households, and 745 families residing in the town. The population density was 1,400.7 people per square mile (541.3/km2). There were 1,320 housing units at an average density of 622.9 per square mile (240.3/km2). The racial makeup of the town was 97.2% White, 0.7% African American, 0.2% Native American, 0.3% Asian, 0.2% from other races, and 1.4% from two or more races. Hispanic or Latino of any race were 1.2% of the population.
There were 1,220 households, out of which 28.2% had children under the age of 18 living with them, 46.2% were married couples living together, 12.3% had a female householder with no husband present, and 37.2% were non-families. 32.2% of all households were made up of individuals, and 14.7% had someone living alone who was 65 years of age or older. The average household size was 2.30 and the average family size was 2.90.
In the town, the population was spread out, with 23.2% under the age of 18, 8.2% from 18 to 24, 25.7% from 25 to 44, 24.3% from 45 to 64, and 18.6% who were 65 years of age or older. The median age was 40 years. For every 100 females, there were 87.7 males. For every 100 females age 18 and over, there were 83.2 males.
The median income for a household in the town was $37,917, and the median income for a family was $45,938. Males had a median income of $31,917 versus $22,917 for females. The per capita income for the town was $19,945. About 8.2% of families and 11.2% of the population were below the poverty line, including 15.2% of those under age 18 and 8.2% of those age 65 or over.
Common Questions
What is Per Capita Income in Corydon?
Per Capita income in Corydon is $28,410.
What is the Median Family Income in Corydon?
Median Family Income in Corydon is $69,115.
What is the Median Household income in Corydon?
Median Household Income in Corydon is $54,125.
What is Income or Wage Gap in Corydon?
Income or Wage Gap in Corydon is 45.6%.
Women in Corydon earn 54.4 cents for every dollar earned by a man.
What is Inequality or Gini Index in Corydon?
Inequality or Gini Index in Corydon is 0.31.
What is the Total Population of Corydon?
Total Population of Corydon is 3,153.
What is the Total Male Population of Corydon?
Total Male Population of Corydon is 1,643.
What is the Total Female Population of Corydon?
Total Female Population of Corydon is 1,510.
What is the Ratio of Males per 100 Females in Corydon?
There are 108.81 Males per 100 Females in Corydon.
What is the Ratio of Females per 100 Males in Corydon?
There are 91.91 Females per 100 Males in Corydon.
What is the Median Population Age in Corydon?
Median Population Age in Corydon is 41.7 Years.
What is the Average Family Size in Corydon
Average Family Size in Corydon is 3.5 People.
What is the Average Household Size in Corydon
Average Household Size in Corydon is 2.2 People.
How Large is the Labor Force in Corydon?
There are 1,418 People in the Labor Forcein in Corydon.
What is the Percentage of People in the Labor Force in Corydon?
55.5% of People are in the Labor Force in Corydon.
What is the Unemployment Rate in Corydon?
Unemployment Rate in Corydon is 1.6%.