Petersburg, IN Map & Demographics
Petersburg Map
Petersburg Overview
$29,466
PER CAPITA INCOME
$73,333
AVG FAMILY INCOME
$44,891
AVG HOUSEHOLD INCOME
46.0%
WAGE / INCOME GAP [ % ]
54.0¢/ $1
WAGE / INCOME GAP [ $ ]
0.44
INEQUALITY / GINI INDEX
2,126
TOTAL POPULATION
1,081
MALE POPULATION
1,045
FEMALE POPULATION
103.44
MALES / 100 FEMALES
96.67
FEMALES / 100 MALES
50.0
MEDIAN AGE
2.8
AVG FAMILY SIZE
1.9
AVG HOUSEHOLD SIZE
909
LABOR FORCE [ PEOPLE ]
49.9%
PERCENT IN LABOR FORCE
2.1%
UNEMPLOYMENT RATE
Petersburg Zip Codes
Petersburg Area Codes
Income in Petersburg
Income Overview in Petersburg
Per Capita Income in Petersburg is $29,466, while median incomes of families and households are $73,333 and $44,891 respectively.
| Characteristic | Number | Measure |
| Per Capita Income | 2,126 | $29,466 |
| Median Family Income | 516 | $73,333 |
| Mean Family Income | 516 | $84,537 |
| Median Household Income | 1,022 | $44,891 |
| Mean Household Income | 1,022 | $60,333 |
| Income Deficit | 516 | $0 |
| Wage / Income Gap (%) | 2,126 | 45.99% |
| Wage / Income Gap ($) | 2,126 | 54.01¢ per $1 |
| Gini / Inequality Index | 2,126 | 0.44 |
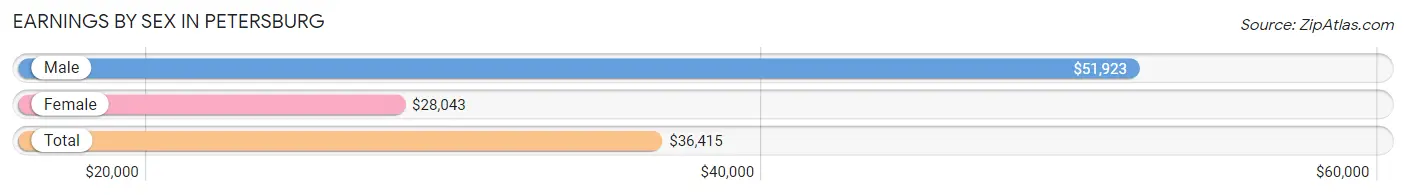
Earnings by Sex in Petersburg
Average Earnings in Petersburg are $36,415, $51,923 for men and $28,043 for women, a difference of 46.0%.
| Sex | Number | Average Earnings |
| Male | 508 (48.7%) | $51,923 |
| Female | 534 (51.2%) | $28,043 |
| Total | 1,042 (100.0%) | $36,415 |
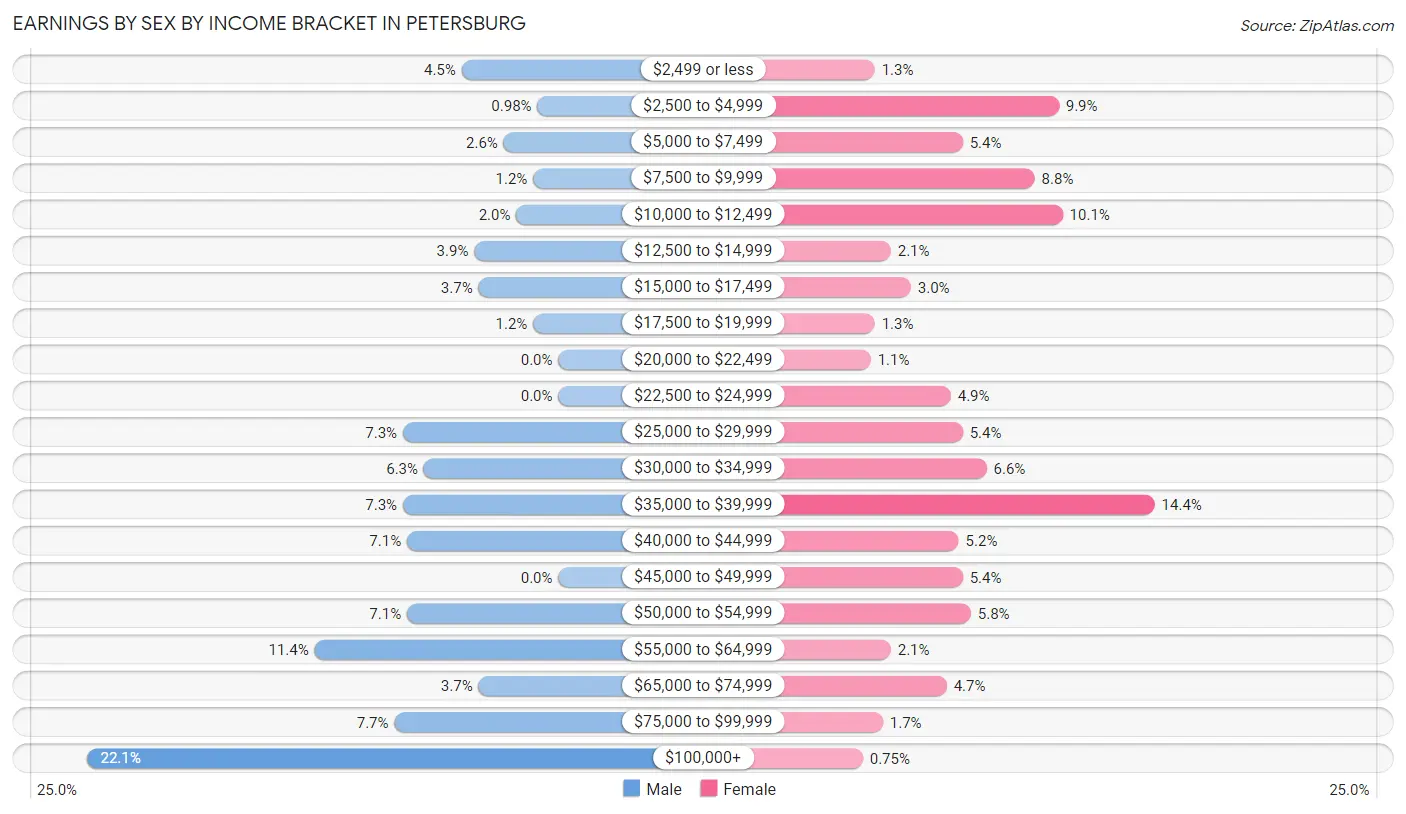
Earnings by Sex by Income Bracket in Petersburg
The most common earnings brackets in Petersburg are $100,000+ for men (112 | 22.1%) and $35,000 to $39,999 for women (77 | 14.4%).
| Income | Male | Female |
| $2,499 or less | 23 (4.5%) | 7 (1.3%) |
| $2,500 to $4,999 | 5 (1.0%) | 53 (9.9%) |
| $5,000 to $7,499 | 13 (2.6%) | 29 (5.4%) |
| $7,500 to $9,999 | 6 (1.2%) | 47 (8.8%) |
| $10,000 to $12,499 | 10 (2.0%) | 54 (10.1%) |
| $12,500 to $14,999 | 20 (3.9%) | 11 (2.1%) |
| $15,000 to $17,499 | 19 (3.7%) | 16 (3.0%) |
| $17,500 to $19,999 | 6 (1.2%) | 7 (1.3%) |
| $20,000 to $22,499 | 0 (0.0%) | 6 (1.1%) |
| $22,500 to $24,999 | 0 (0.0%) | 26 (4.9%) |
| $25,000 to $29,999 | 37 (7.3%) | 29 (5.4%) |
| $30,000 to $34,999 | 32 (6.3%) | 35 (6.6%) |
| $35,000 to $39,999 | 37 (7.3%) | 77 (14.4%) |
| $40,000 to $44,999 | 36 (7.1%) | 28 (5.2%) |
| $45,000 to $49,999 | 0 (0.0%) | 29 (5.4%) |
| $50,000 to $54,999 | 36 (7.1%) | 31 (5.8%) |
| $55,000 to $64,999 | 58 (11.4%) | 11 (2.1%) |
| $65,000 to $74,999 | 19 (3.7%) | 25 (4.7%) |
| $75,000 to $99,999 | 39 (7.7%) | 9 (1.7%) |
| $100,000+ | 112 (22.1%) | 4 (0.7%) |
| Total | 508 (100.0%) | 534 (100.0%) |
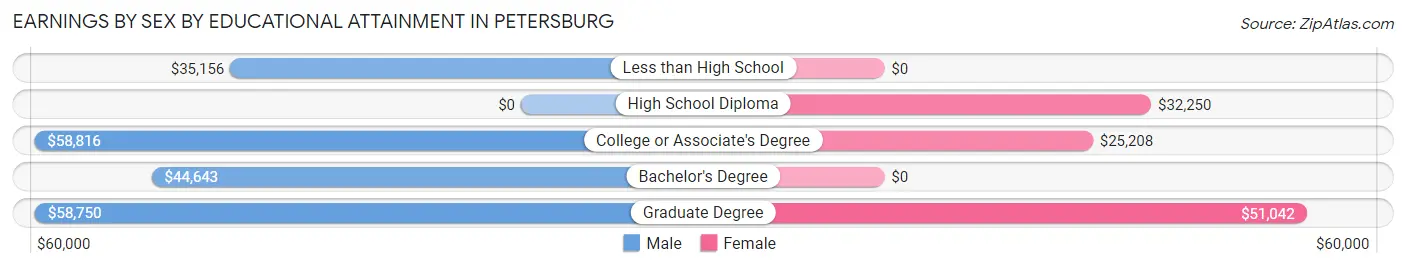
Earnings by Sex by Educational Attainment in Petersburg
Average earnings in Petersburg are $54,402 for men and $31,250 for women, a difference of 42.6%. Men with an educational attainment of college or associate's degree enjoy the highest average annual earnings of $58,816, while those with less than high school education earn the least with $35,156. Women with an educational attainment of graduate degree earn the most with the average annual earnings of $51,042, while those with college or associate's degree education have the smallest earnings of $25,208.
| Educational Attainment | Male Income | Female Income |
| Less than High School | $35,156 | $0 |
| High School Diploma | - | - |
| College or Associate's Degree | $58,816 | $25,208 |
| Bachelor's Degree | $44,643 | $0 |
| Graduate Degree | $58,750 | $51,042 |
| Total | $54,402 | $31,250 |
Family Income in Petersburg
Family Income Brackets in Petersburg
According to the Petersburg family income data, there are 118 families falling into the $50,000 to $74,999 income range, which is the most common income bracket and makes up 22.9% of all families. Conversely, the less than $10,000 income bracket is the least frequent group with only 5 families (1.0%) belonging to this category.
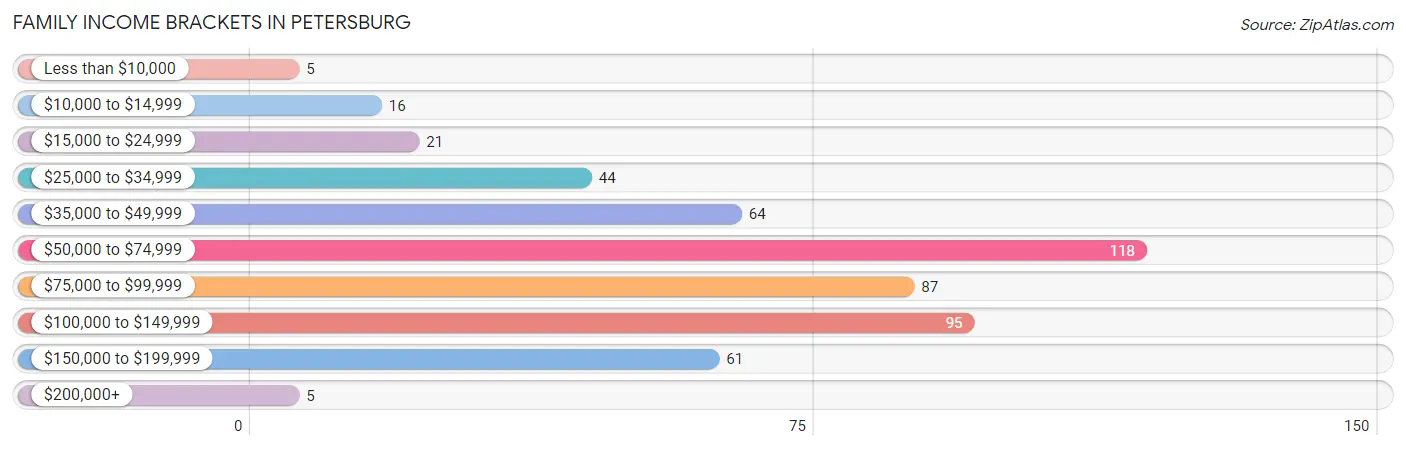
| Income Bracket | # Families | % Families |
| Less than $10,000 | 5 | 1.0% |
| $10,000 to $14,999 | 16 | 3.1% |
| $15,000 to $24,999 | 21 | 4.1% |
| $25,000 to $34,999 | 44 | 8.5% |
| $35,000 to $49,999 | 64 | 12.4% |
| $50,000 to $74,999 | 118 | 22.9% |
| $75,000 to $99,999 | 87 | 16.9% |
| $100,000 to $149,999 | 95 | 18.4% |
| $150,000 to $199,999 | 61 | 11.8% |
| $200,000+ | 5 | 1.0% |
Family Income by Famaliy Size in Petersburg
5-person families (55 | 10.7%) account for the highest median family income in Petersburg with $185,417 per family, while 5-person families (55 | 10.7%) have the highest median income of $37,083 per family member.
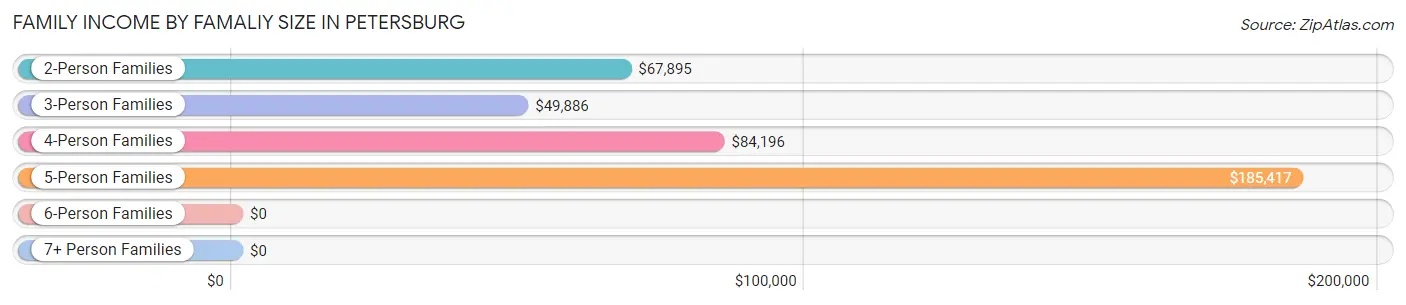
| Income Bracket | # Families | Median Income |
| 2-Person Families | 296 (57.4%) | $67,895 |
| 3-Person Families | 83 (16.1%) | $49,886 |
| 4-Person Families | 73 (14.1%) | $84,196 |
| 5-Person Families | 55 (10.7%) | $185,417 |
| 6-Person Families | 9 (1.7%) | $0 |
| 7+ Person Families | 0 (0.0%) | $0 |
| Total | 516 (100.0%) | $73,333 |
Family Income by Number of Earners in Petersburg
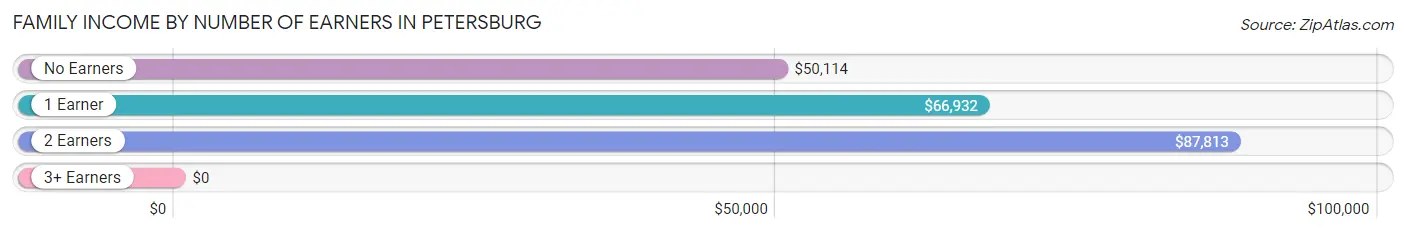
| Number of Earners | # Families | Median Income |
| No Earners | 110 (21.3%) | $50,114 |
| 1 Earner | 153 (29.6%) | $66,932 |
| 2 Earners | 220 (42.6%) | $87,813 |
| 3+ Earners | 33 (6.4%) | $0 |
| Total | 516 (100.0%) | $73,333 |
Household Income in Petersburg
Household Income Brackets in Petersburg
With 161 households falling in the category, the $25,000 to $34,999 income range is the most frequent in Petersburg, accounting for 15.8% of all households. In contrast, only 9 households (0.9%) fall into the $200,000+ income bracket, making it the least populous group.
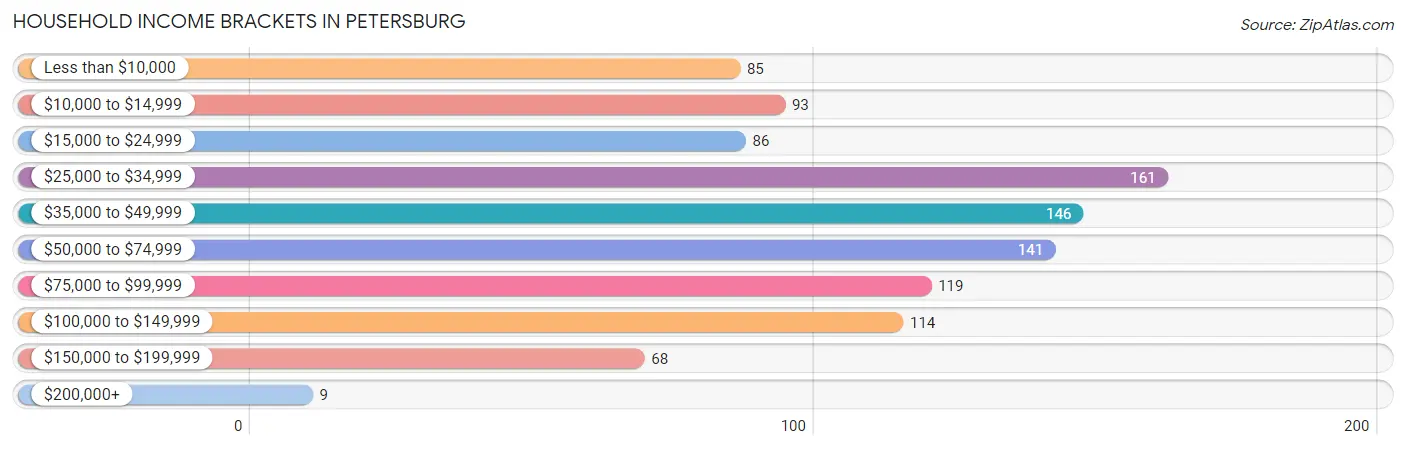
| Income Bracket | # Households | % Households |
| Less than $10,000 | 85 | 8.3% |
| $10,000 to $14,999 | 93 | 9.1% |
| $15,000 to $24,999 | 86 | 8.4% |
| $25,000 to $34,999 | 161 | 15.8% |
| $35,000 to $49,999 | 146 | 14.3% |
| $50,000 to $74,999 | 141 | 13.8% |
| $75,000 to $99,999 | 119 | 11.6% |
| $100,000 to $149,999 | 114 | 11.2% |
| $150,000 to $199,999 | 68 | 6.7% |
| $200,000+ | 9 | 0.9% |
Household Income by Householder Age in Petersburg
The median household income in Petersburg is $44,891, with the highest median household income of $71,786 found in the 25 to 44 years age bracket for the primary householder. A total of 268 households (26.2%) fall into this category. Meanwhile, the 15 to 24 years age bracket for the primary householder has the lowest median household income of $0, with 54 households (5.3%) in this group.
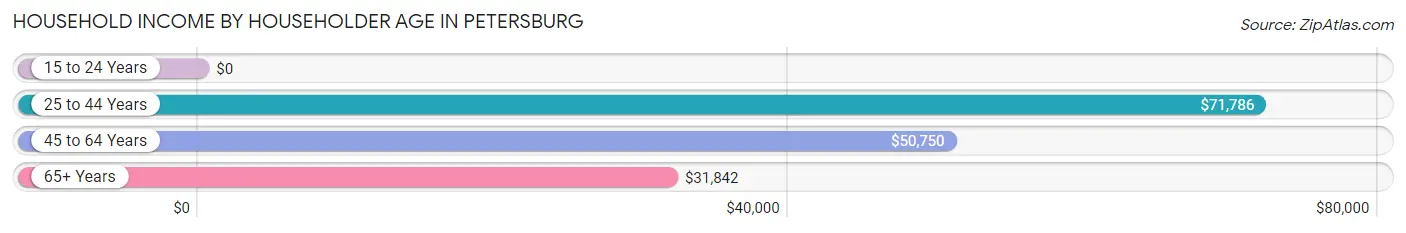
| Income Bracket | # Households | Median Income |
| 15 to 24 Years | 54 (5.3%) | $0 |
| 25 to 44 Years | 268 (26.2%) | $71,786 |
| 45 to 64 Years | 336 (32.9%) | $50,750 |
| 65+ Years | 364 (35.6%) | $31,842 |
| Total | 1,022 (100.0%) | $44,891 |
Poverty in Petersburg
Income Below Poverty by Sex and Age in Petersburg
With 17.2% poverty level for males and 18.3% for females among the residents of Petersburg, 16 and 17 year old males and 16 and 17 year old females are the most vulnerable to poverty, with 13 males (43.3%) and 14 females (100.0%) in their respective age groups living below the poverty level.
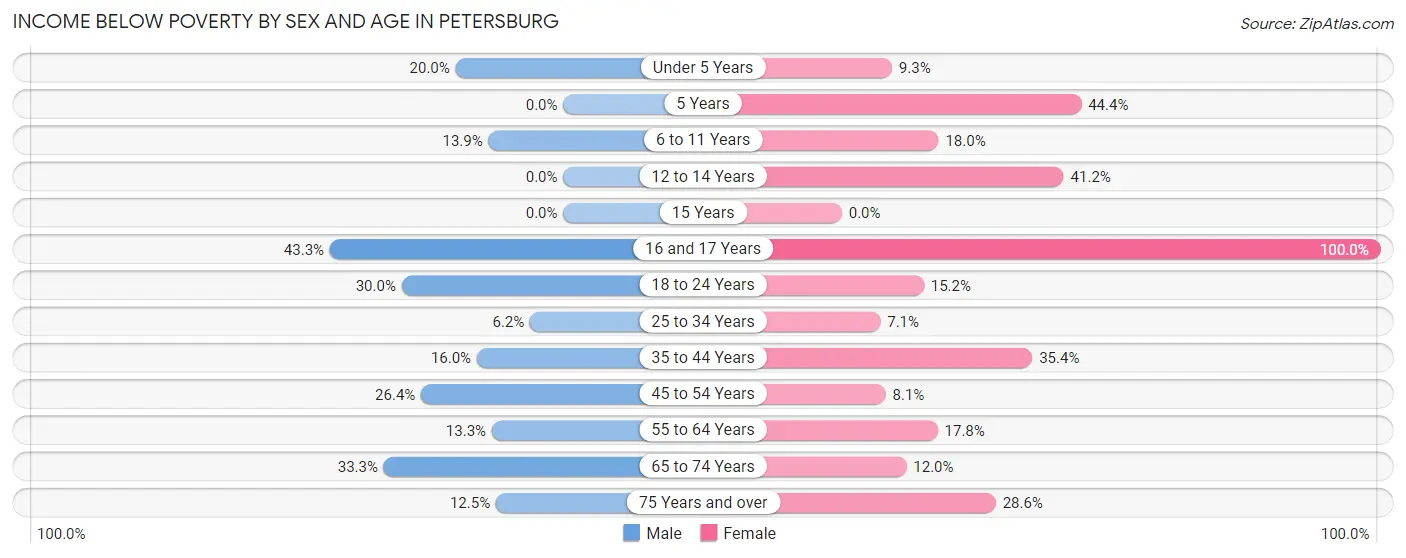
| Age Bracket | Male | Female |
| Under 5 Years | 17 (20.0%) | 4 (9.3%) |
| 5 Years | 0 (0.0%) | 4 (44.4%) |
| 6 to 11 Years | 10 (13.9%) | 7 (17.9%) |
| 12 to 14 Years | 0 (0.0%) | 7 (41.2%) |
| 15 Years | 0 (0.0%) | 0 (0.0%) |
| 16 and 17 Years | 13 (43.3%) | 14 (100.0%) |
| 18 to 24 Years | 15 (30.0%) | 7 (15.2%) |
| 25 to 34 Years | 10 (6.2%) | 9 (7.1%) |
| 35 to 44 Years | 17 (16.0%) | 35 (35.3%) |
| 45 to 54 Years | 19 (26.4%) | 10 (8.1%) |
| 55 to 64 Years | 24 (13.3%) | 32 (17.8%) |
| 65 to 74 Years | 37 (33.3%) | 23 (12.0%) |
| 75 Years and over | 15 (12.5%) | 28 (28.6%) |
| Total | 177 (17.2%) | 180 (18.3%) |
Income Above Poverty by Sex and Age in Petersburg
According to the poverty statistics in Petersburg, males aged 5 years and females aged 25 to 34 years are the age groups that are most secure financially, with 100.0% of males and 92.9% of females in these age groups living above the poverty line.
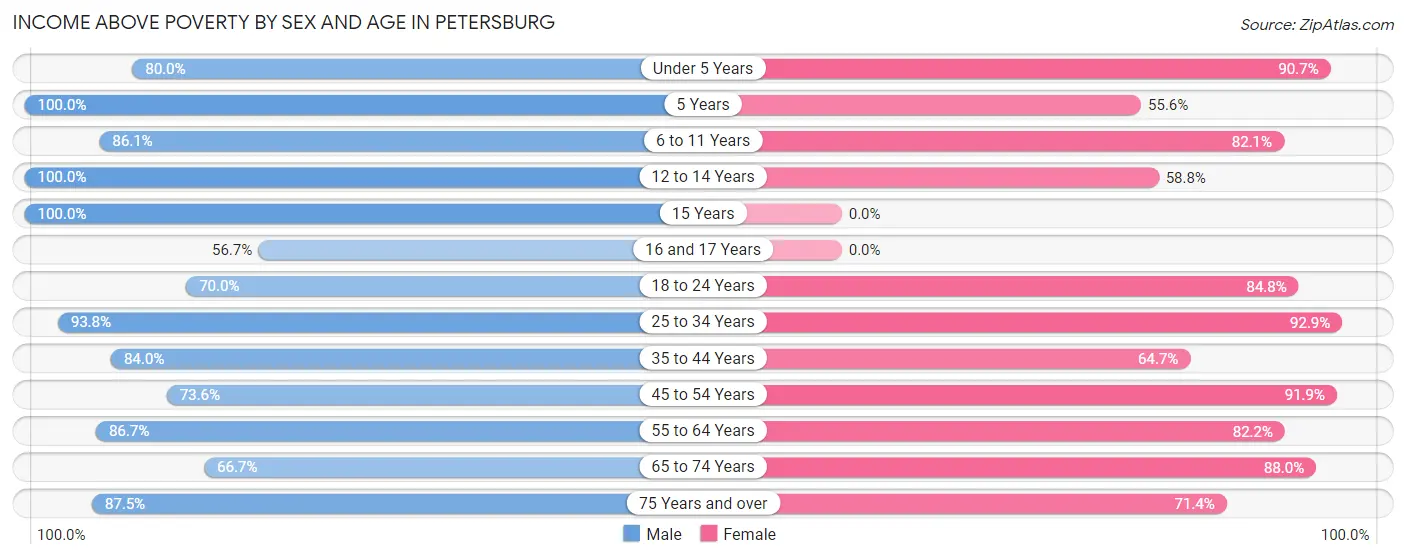
| Age Bracket | Male | Female |
| Under 5 Years | 68 (80.0%) | 39 (90.7%) |
| 5 Years | 7 (100.0%) | 5 (55.6%) |
| 6 to 11 Years | 62 (86.1%) | 32 (82.1%) |
| 12 to 14 Years | 26 (100.0%) | 10 (58.8%) |
| 15 Years | 7 (100.0%) | 0 (0.0%) |
| 16 and 17 Years | 17 (56.7%) | 0 (0.0%) |
| 18 to 24 Years | 35 (70.0%) | 39 (84.8%) |
| 25 to 34 Years | 152 (93.8%) | 117 (92.9%) |
| 35 to 44 Years | 89 (84.0%) | 64 (64.6%) |
| 45 to 54 Years | 53 (73.6%) | 113 (91.9%) |
| 55 to 64 Years | 157 (86.7%) | 148 (82.2%) |
| 65 to 74 Years | 74 (66.7%) | 169 (88.0%) |
| 75 Years and over | 105 (87.5%) | 70 (71.4%) |
| Total | 852 (82.8%) | 806 (81.7%) |
Income Below Poverty Among Married-Couple Families in Petersburg
The poverty statistics for married-couple families in Petersburg show that 8.8% or 39 of the total 443 families live below the poverty line. Families with 3 or 4 children have the highest poverty rate of 52.6%, comprising of 10 families. On the other hand, families with 1 or 2 children have the lowest poverty rate of 6.1%, which includes 7 families.
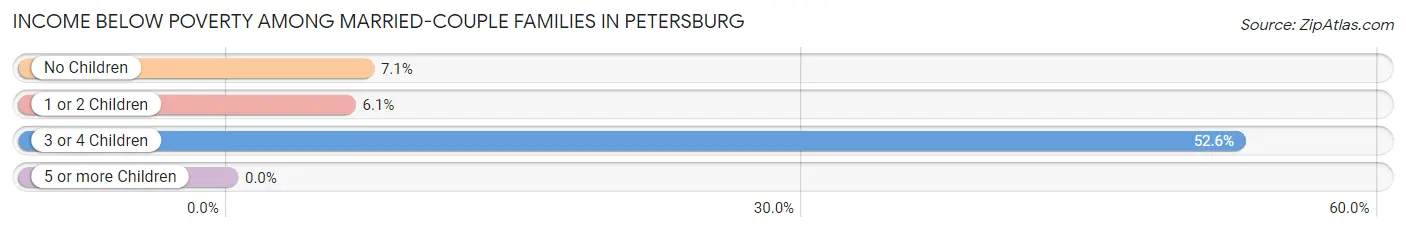
| Children | Above Poverty | Below Poverty |
| No Children | 288 (92.9%) | 22 (7.1%) |
| 1 or 2 Children | 107 (93.9%) | 7 (6.1%) |
| 3 or 4 Children | 9 (47.4%) | 10 (52.6%) |
| 5 or more Children | 0 (0.0%) | 0 (0.0%) |
| Total | 404 (91.2%) | 39 (8.8%) |
Income Below Poverty Among Single-Parent Households in Petersburg
According to the poverty data in Petersburg, 31.2% or 5 single-father households and 21.0% or 12 single-mother households are living below the poverty line. Among single-father households, those with 1 or 2 children have the highest poverty rate, with 5 households (41.7%) experiencing poverty. Likewise, among single-mother households, those with no children have the highest poverty rate, with 12 households (36.4%) falling below the poverty line.
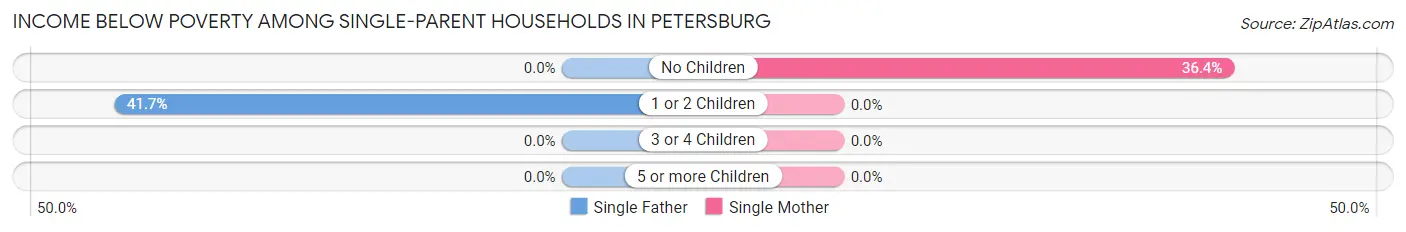
| Children | Single Father | Single Mother |
| No Children | 0 (0.0%) | 12 (36.4%) |
| 1 or 2 Children | 5 (41.7%) | 0 (0.0%) |
| 3 or 4 Children | 0 (0.0%) | 0 (0.0%) |
| 5 or more Children | 0 (0.0%) | 0 (0.0%) |
| Total | 5 (31.2%) | 12 (21.0%) |
Income Below Poverty Among Married-Couple vs Single-Parent Households in Petersburg
The poverty data for Petersburg shows that 39 of the married-couple family households (8.8%) and 17 of the single-parent households (23.3%) are living below the poverty level. Within the married-couple family households, those with 3 or 4 children have the highest poverty rate, with 10 households (52.6%) falling below the poverty line. Among the single-parent households, those with no children have the highest poverty rate, with 12 household (36.4%) living below poverty.
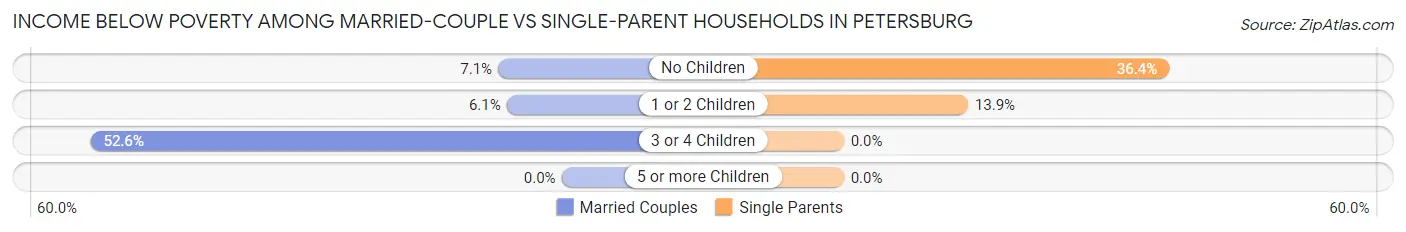
| Children | Married-Couple Families | Single-Parent Households |
| No Children | 22 (7.1%) | 12 (36.4%) |
| 1 or 2 Children | 7 (6.1%) | 5 (13.9%) |
| 3 or 4 Children | 10 (52.6%) | 0 (0.0%) |
| 5 or more Children | 0 (0.0%) | 0 (0.0%) |
| Total | 39 (8.8%) | 17 (23.3%) |
Race in Petersburg
The most populous races in Petersburg are White / Caucasian (2,059 | 96.9%), Two or more Races (37 | 1.7%), and Black / African American (28 | 1.3%).
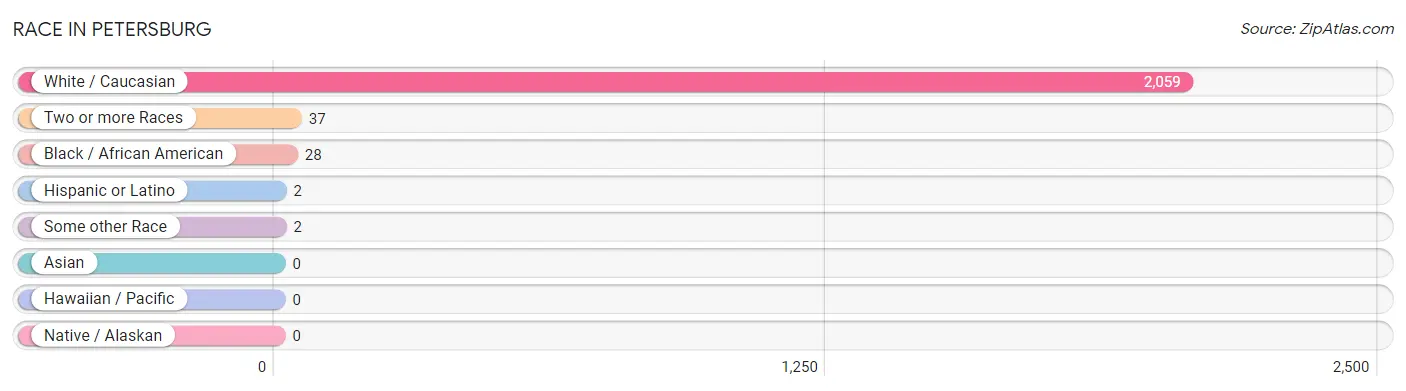
| Race | # Population | % Population |
| Asian | 0 | 0.0% |
| Black / African American | 28 | 1.3% |
| Hawaiian / Pacific | 0 | 0.0% |
| Hispanic or Latino | 2 | 0.1% |
| Native / Alaskan | 0 | 0.0% |
| White / Caucasian | 2,059 | 96.9% |
| Two or more Races | 37 | 1.7% |
| Some other Race | 2 | 0.1% |
| Total | 2,126 | 100.0% |
Ancestry in Petersburg
The most populous ancestries reported in Petersburg are English (564 | 26.5%), German (495 | 23.3%), Irish (375 | 17.6%), American (214 | 10.1%), and Scottish (80 | 3.8%), together accounting for 81.3% of all Petersburg residents.
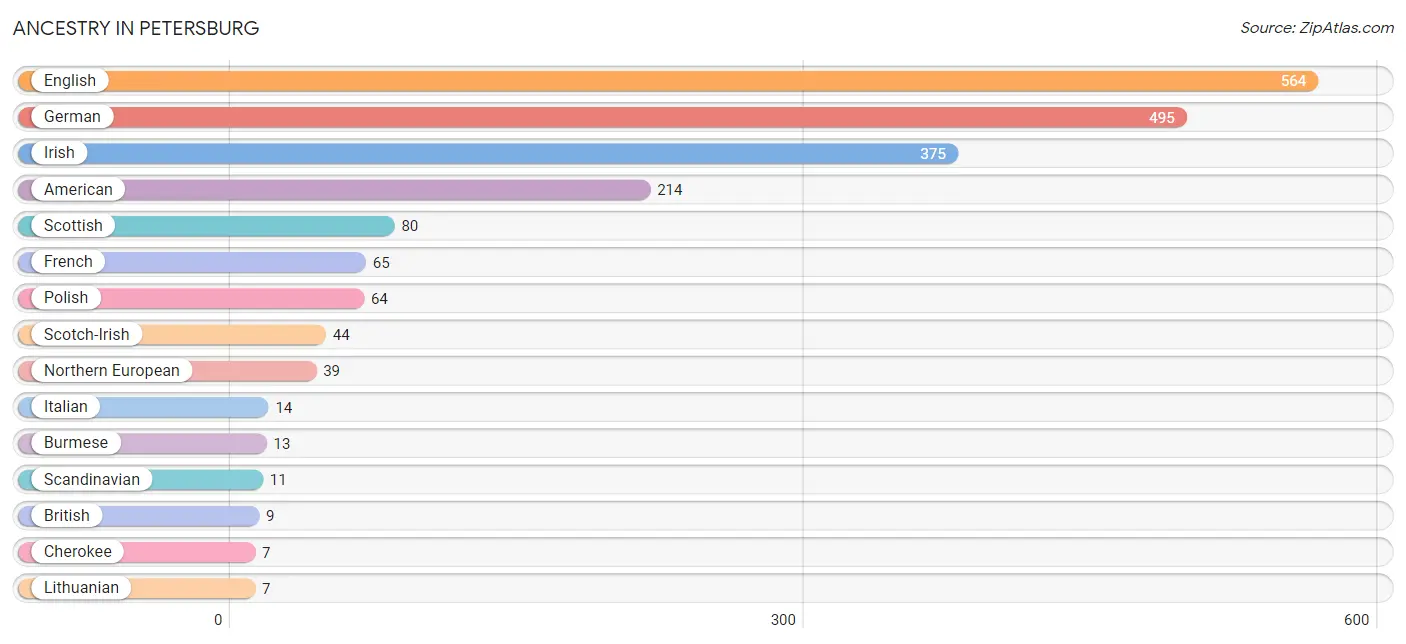
| Ancestry | # Population | % Population |
| American | 214 | 10.1% |
| British | 9 | 0.4% |
| Burmese | 13 | 0.6% |
| Cherokee | 7 | 0.3% |
| English | 564 | 26.5% |
| French | 65 | 3.1% |
| German | 495 | 23.3% |
| Irish | 375 | 17.6% |
| Italian | 14 | 0.7% |
| Lithuanian | 7 | 0.3% |
| Northern European | 39 | 1.8% |
| Polish | 64 | 3.0% |
| Puerto Rican | 2 | 0.1% |
| Scandinavian | 11 | 0.5% |
| Scotch-Irish | 44 | 2.1% |
| Scottish | 80 | 3.8% | View All 16 Rows |
Immigrants in Petersburg
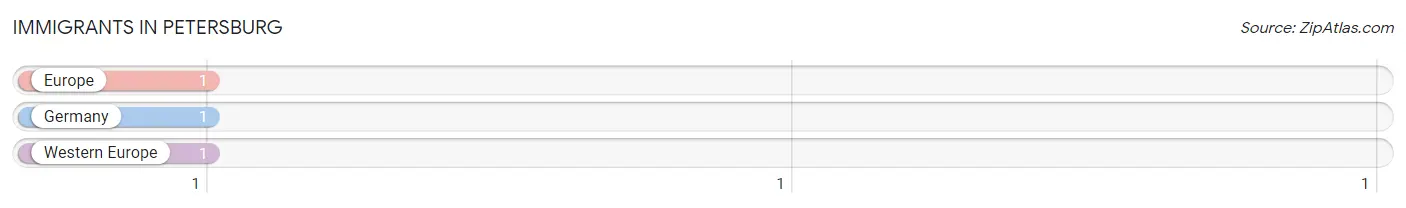
The most numerous immigrant groups reported in Petersburg came from Europe (1 | 0.1%), Germany (1 | 0.1%), and Western Europe (1 | 0.1%), together accounting for 0.2% of all Petersburg residents.
| Immigration Origin | # Population | % Population |
| Europe | 1 | 0.1% |
| Germany | 1 | 0.1% |
| Western Europe | 1 | 0.1% | View All 3 Rows |
Sex and Age in Petersburg
Sex and Age in Petersburg
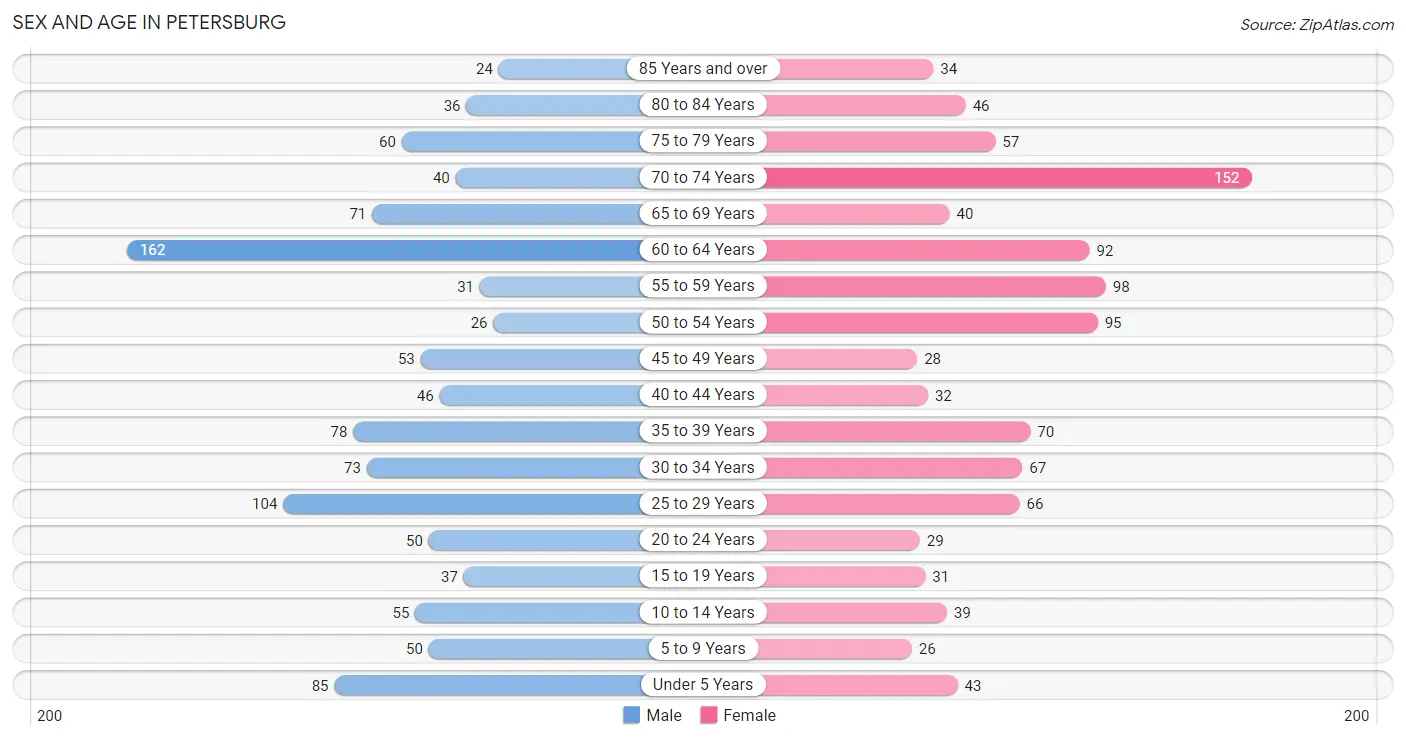
The most populous age groups in Petersburg are 60 to 64 Years (162 | 15.0%) for men and 70 to 74 Years (152 | 14.5%) for women.
| Age Bracket | Male | Female |
| Under 5 Years | 85 (7.9%) | 43 (4.1%) |
| 5 to 9 Years | 50 (4.6%) | 26 (2.5%) |
| 10 to 14 Years | 55 (5.1%) | 39 (3.7%) |
| 15 to 19 Years | 37 (3.4%) | 31 (3.0%) |
| 20 to 24 Years | 50 (4.6%) | 29 (2.8%) |
| 25 to 29 Years | 104 (9.6%) | 66 (6.3%) |
| 30 to 34 Years | 73 (6.8%) | 67 (6.4%) |
| 35 to 39 Years | 78 (7.2%) | 70 (6.7%) |
| 40 to 44 Years | 46 (4.3%) | 32 (3.1%) |
| 45 to 49 Years | 53 (4.9%) | 28 (2.7%) |
| 50 to 54 Years | 26 (2.4%) | 95 (9.1%) |
| 55 to 59 Years | 31 (2.9%) | 98 (9.4%) |
| 60 to 64 Years | 162 (15.0%) | 92 (8.8%) |
| 65 to 69 Years | 71 (6.6%) | 40 (3.8%) |
| 70 to 74 Years | 40 (3.7%) | 152 (14.5%) |
| 75 to 79 Years | 60 (5.6%) | 57 (5.4%) |
| 80 to 84 Years | 36 (3.3%) | 46 (4.4%) |
| 85 Years and over | 24 (2.2%) | 34 (3.3%) |
| Total | 1,081 (100.0%) | 1,045 (100.0%) |
Families and Households in Petersburg
Median Family Size in Petersburg
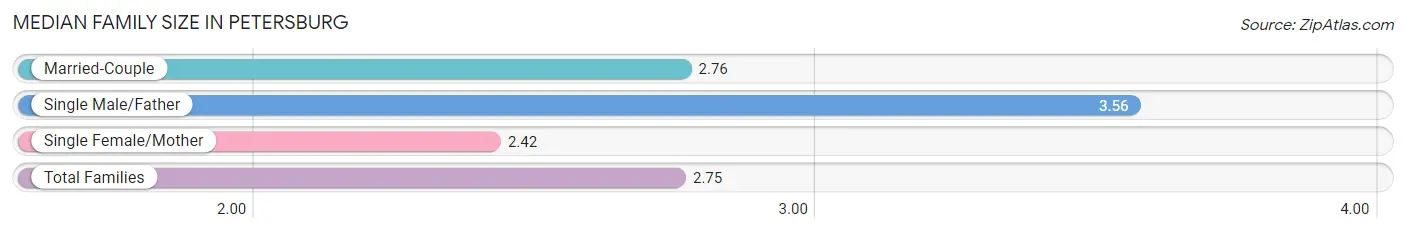
The median family size in Petersburg is 2.75 persons per family, with single male/father families (16 | 3.1%) accounting for the largest median family size of 3.56 persons per family. On the other hand, single female/mother families (57 | 11.1%) represent the smallest median family size with 2.42 persons per family.
| Family Type | # Families | Family Size |
| Married-Couple | 443 (85.9%) | 2.76 |
| Single Male/Father | 16 (3.1%) | 3.56 |
| Single Female/Mother | 57 (11.1%) | 2.42 |
| Total Families | 516 (100.0%) | 2.75 |
Median Household Size in Petersburg
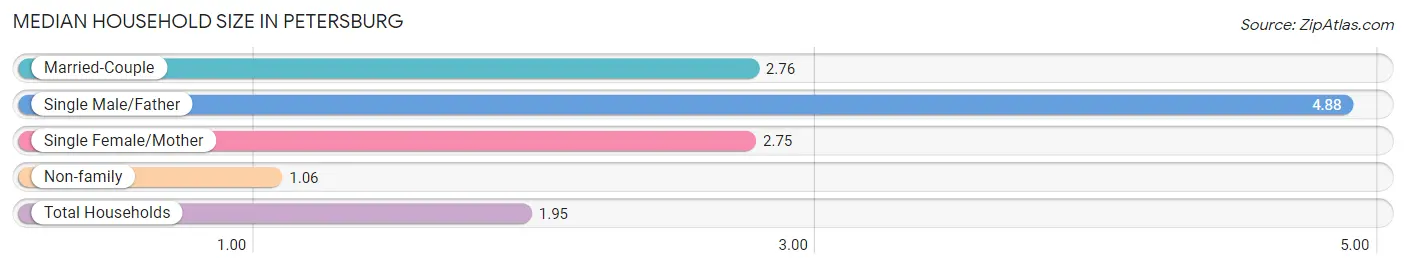
The median household size in Petersburg is 1.95 persons per household, with single male/father households (16 | 1.6%) accounting for the largest median household size of 4.88 persons per household. non-family households (506 | 49.5%) represent the smallest median household size with 1.06 persons per household.
| Household Type | # Households | Household Size |
| Married-Couple | 443 (43.3%) | 2.76 |
| Single Male/Father | 16 (1.6%) | 4.88 |
| Single Female/Mother | 57 (5.6%) | 2.75 |
| Non-family | 506 (49.5%) | 1.06 |
| Total Households | 1,022 (100.0%) | 1.95 |
Household Size by Marriage Status in Petersburg
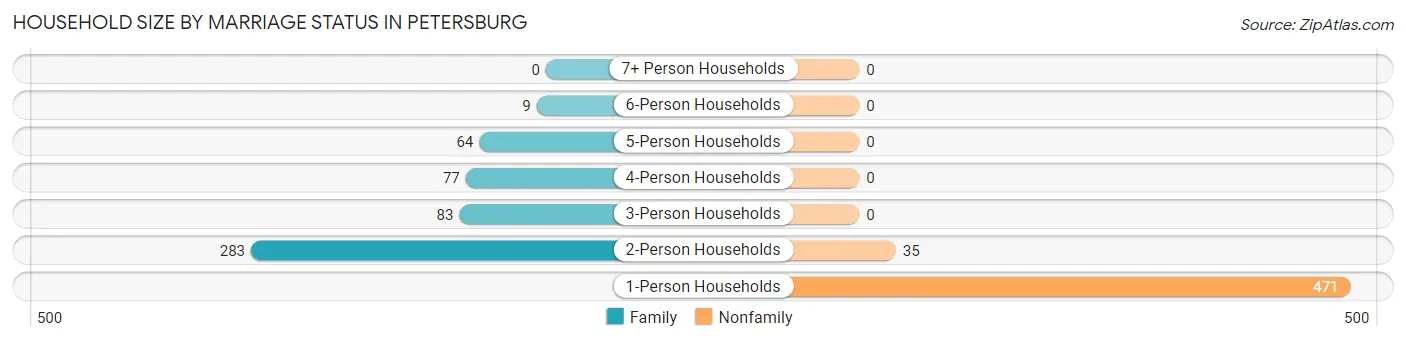
Out of a total of 1,022 households in Petersburg, 516 (50.5%) are family households, while 506 (49.5%) are nonfamily households. The most numerous type of family households are 2-person households, comprising 283, and the most common type of nonfamily households are 1-person households, comprising 471.
| Household Size | Family Households | Nonfamily Households |
| 1-Person Households | - | 471 (46.1%) |
| 2-Person Households | 283 (27.7%) | 35 (3.4%) |
| 3-Person Households | 83 (8.1%) | 0 (0.0%) |
| 4-Person Households | 77 (7.5%) | 0 (0.0%) |
| 5-Person Households | 64 (6.3%) | 0 (0.0%) |
| 6-Person Households | 9 (0.9%) | 0 (0.0%) |
| 7+ Person Households | 0 (0.0%) | 0 (0.0%) |
| Total | 516 (50.5%) | 506 (49.5%) |
Female Fertility in Petersburg
Fertility by Age in Petersburg
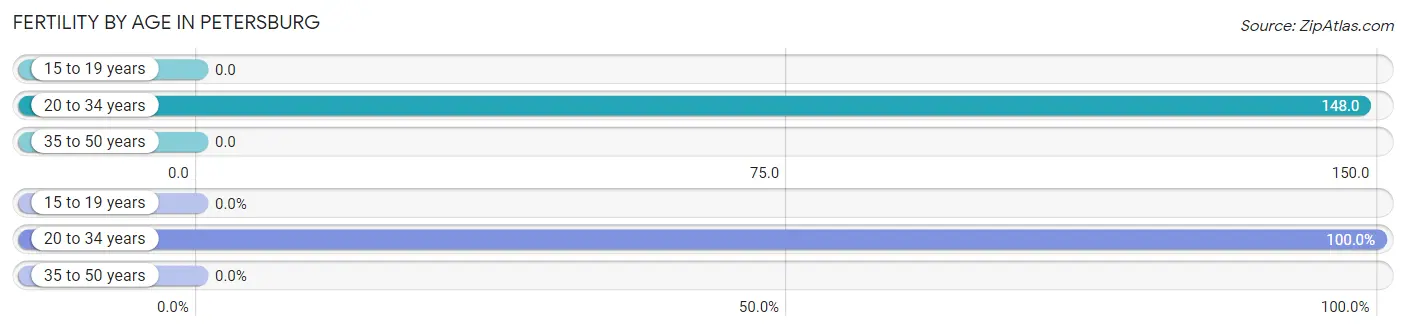
Average fertility rate in Petersburg is 67.0 births per 1,000 women. Women in the age bracket of 20 to 34 years have the highest fertility rate with 148.0 births per 1,000 women. Women in the age bracket of 20 to 34 years acount for 100.0% of all women with births.
| Age Bracket | Women with Births | Births / 1,000 Women |
| 15 to 19 years | 0 (0.0%) | 0.0 |
| 20 to 34 years | 24 (100.0%) | 148.0 |
| 35 to 50 years | 0 (0.0%) | 0.0 |
| Total | 24 (100.0%) | 67.0 |
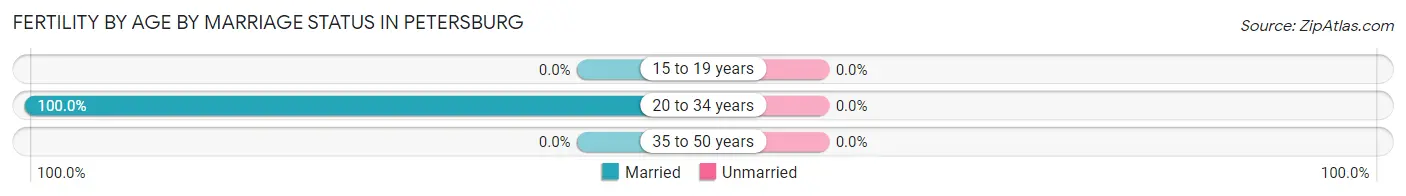
Fertility by Age by Marriage Status in Petersburg
| Age Bracket | Married | Unmarried |
| 15 to 19 years | 0 (0.0%) | 0 (0.0%) |
| 20 to 34 years | 24 (100.0%) | 0 (0.0%) |
| 35 to 50 years | 0 (0.0%) | 0 (0.0%) |
| Total | 24 (100.0%) | 0 (0.0%) |
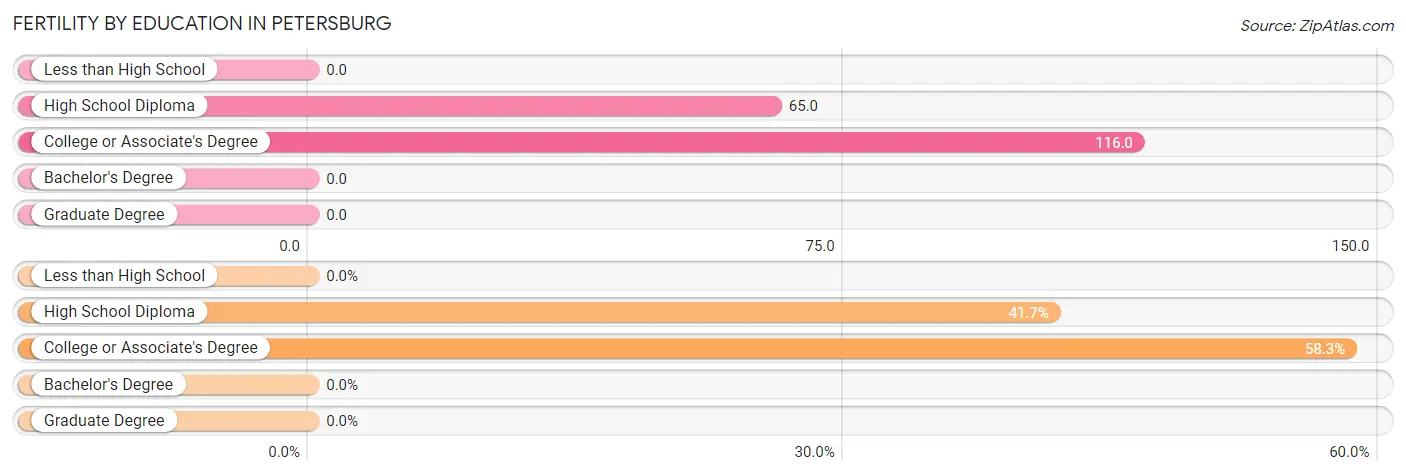
Fertility by Education in Petersburg
| Educational Attainment | Women with Births | Births / 1,000 Women |
| Less than High School | 0 (0.0%) | 0.0 |
| High School Diploma | 10 (41.7%) | 65.0 |
| College or Associate's Degree | 14 (58.3%) | 116.0 |
| Bachelor's Degree | 0 (0.0%) | 0.0 |
| Graduate Degree | 0 (0.0%) | 0.0 |
| Total | 24 (100.0%) | 67.0 |
Fertility by Education by Marriage Status in Petersburg
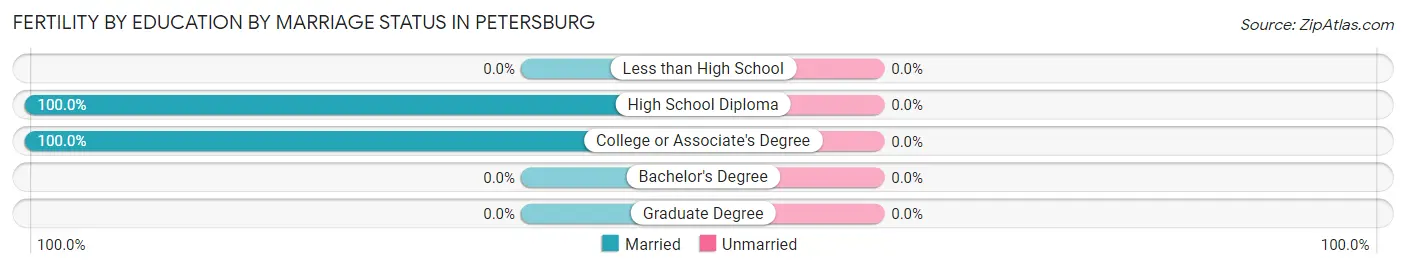
| Educational Attainment | Married | Unmarried |
| Less than High School | 0 (0.0%) | 0 (0.0%) |
| High School Diploma | 10 (100.0%) | 0 (0.0%) |
| College or Associate's Degree | 14 (100.0%) | 0 (0.0%) |
| Bachelor's Degree | 0 (0.0%) | 0 (0.0%) |
| Graduate Degree | 0 (0.0%) | 0 (0.0%) |
| Total | 24 (100.0%) | 0 (0.0%) |
Employment Characteristics in Petersburg
Employment by Class of Employer in Petersburg
Among the 876 employed individuals in Petersburg, private company employees (654 | 74.7%), not-for-profit organizations (68 | 7.8%), and local government employees (61 | 7.0%) make up the most common classes of employment.
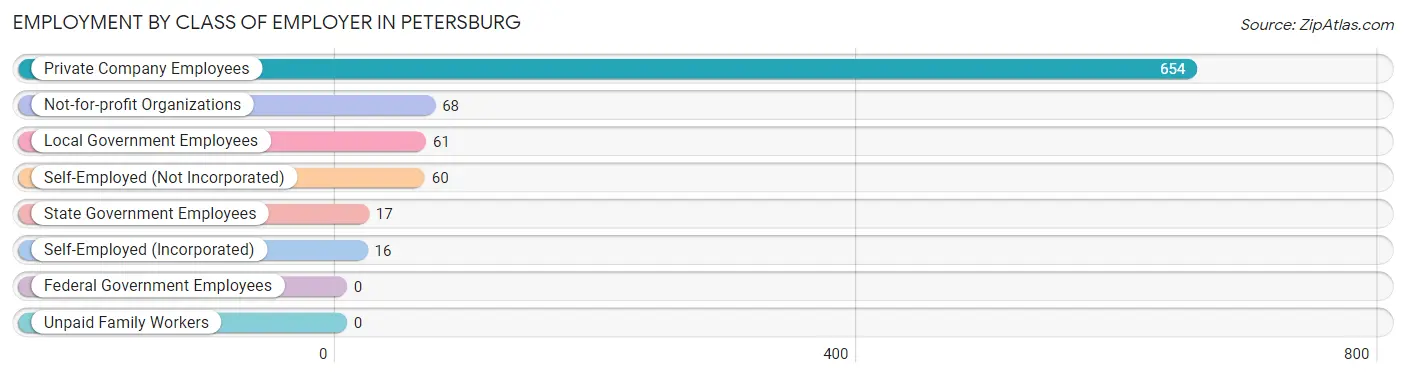
| Employer Class | # Employees | % Employees |
| Private Company Employees | 654 | 74.7% |
| Self-Employed (Incorporated) | 16 | 1.8% |
| Self-Employed (Not Incorporated) | 60 | 6.9% |
| Not-for-profit Organizations | 68 | 7.8% |
| Local Government Employees | 61 | 7.0% |
| State Government Employees | 17 | 1.9% |
| Federal Government Employees | 0 | 0.0% |
| Unpaid Family Workers | 0 | 0.0% |
| Total | 876 | 100.0% |
Employment Status by Age in Petersburg
According to the labor force statistics for Petersburg, out of the total population over 16 years of age (1,821), 49.9% or 909 individuals are in the labor force, with 2.1% or 19 of them unemployed. The age group with the highest labor force participation rate is 20 to 24 years, with 88.6% or 70 individuals in the labor force. Within the labor force, the 20 to 24 years age range has the highest percentage of unemployed individuals, with 27.1% or 19 of them being unemployed.
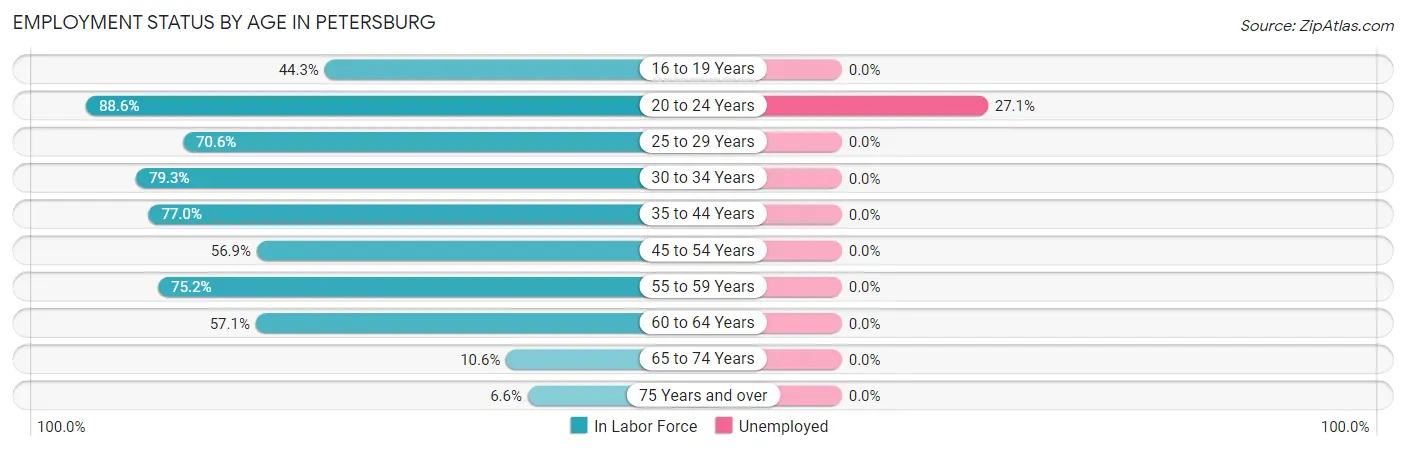
| Age Bracket | In Labor Force | Unemployed |
| 16 to 19 Years | 27 (44.3%) | 0 (0.0%) |
| 20 to 24 Years | 70 (88.6%) | 19 (27.1%) |
| 25 to 29 Years | 120 (70.6%) | 0 (0.0%) |
| 30 to 34 Years | 111 (79.3%) | 0 (0.0%) |
| 35 to 44 Years | 174 (77.0%) | 0 (0.0%) |
| 45 to 54 Years | 115 (56.9%) | 0 (0.0%) |
| 55 to 59 Years | 97 (75.2%) | 0 (0.0%) |
| 60 to 64 Years | 145 (57.1%) | 0 (0.0%) |
| 65 to 74 Years | 32 (10.6%) | 0 (0.0%) |
| 75 Years and over | 17 (6.6%) | 0 (0.0%) |
| Total | 909 (49.9%) | 19 (2.1%) |
Employment Status by Educational Attainment in Petersburg
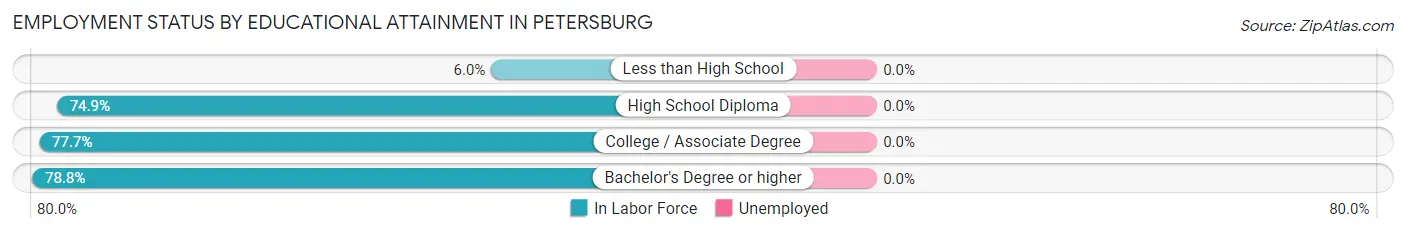
| Educational Attainment | In Labor Force | Unemployed |
| Less than High School | 8 (6.0%) | 0 (0.0%) |
| High School Diploma | 388 (74.9%) | 0 (0.0%) |
| College / Associate Degree | 251 (77.7%) | 0 (0.0%) |
| Bachelor's Degree or higher | 115 (78.8%) | 0 (0.0%) |
| Total | 762 (68.0%) | 0 (0.0%) |
Employment Occupations by Sex in Petersburg
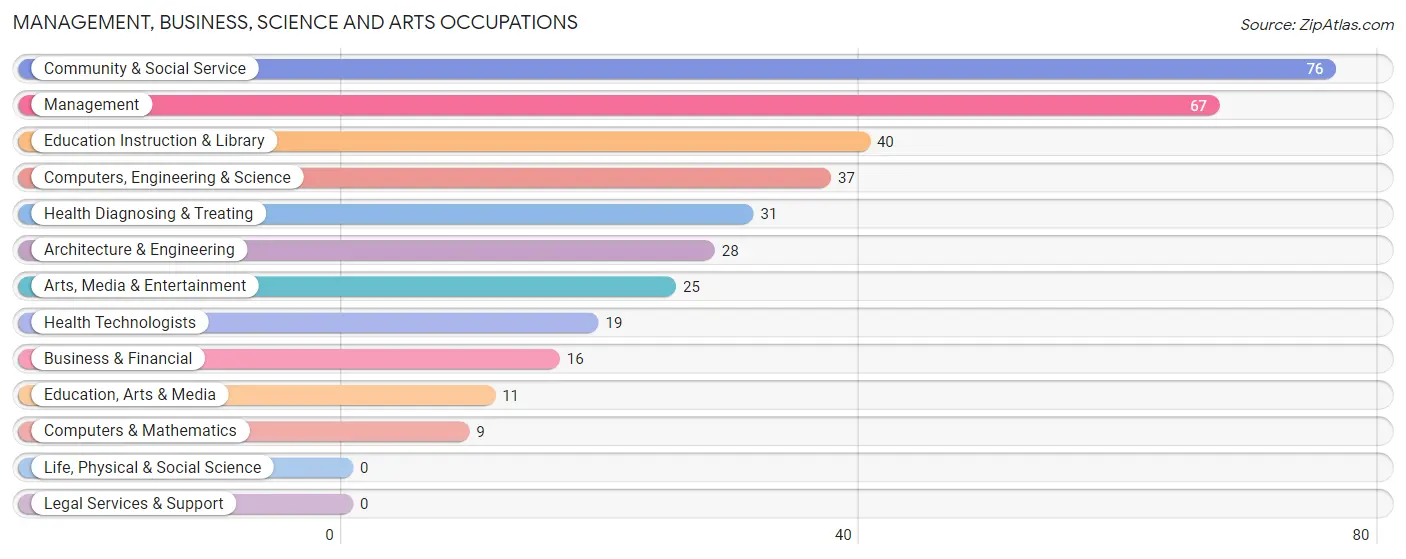
Management, Business, Science and Arts Occupations
The most common Management, Business, Science and Arts occupations in Petersburg are Community & Social Service (76 | 8.6%), Management (67 | 7.5%), Education Instruction & Library (40 | 4.5%), Computers, Engineering & Science (37 | 4.2%), and Health Diagnosing & Treating (31 | 3.5%).
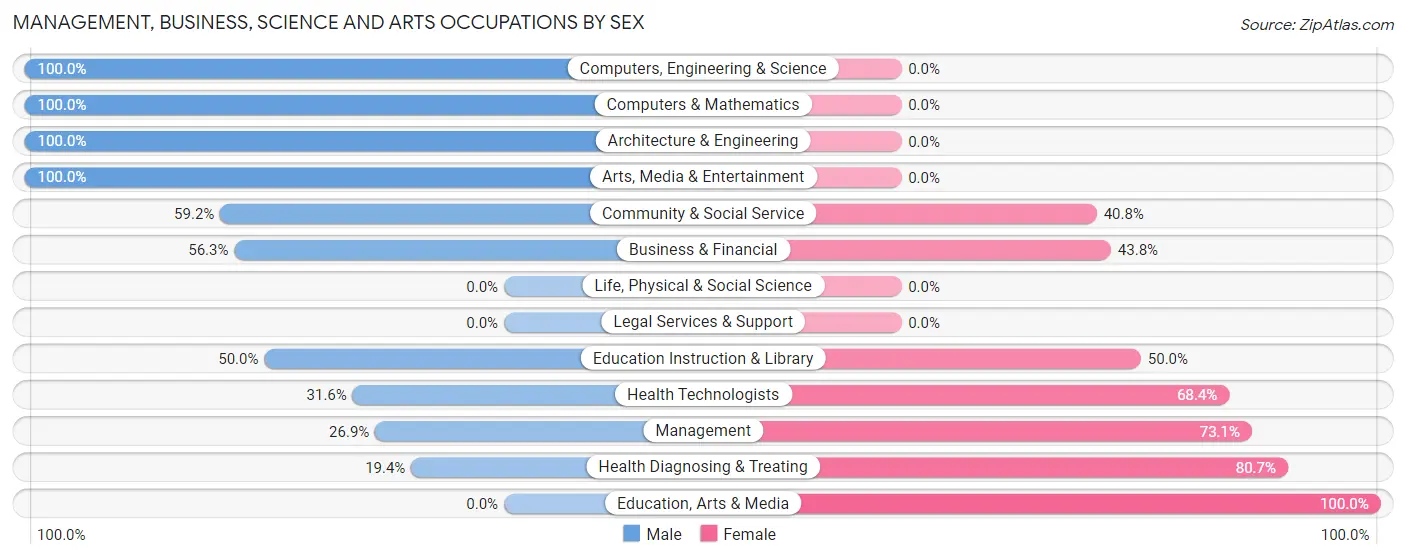
Management, Business, Science and Arts Occupations by Sex
Within the Management, Business, Science and Arts occupations in Petersburg, the most male-oriented occupations are Computers, Engineering & Science (100.0%), Computers & Mathematics (100.0%), and Architecture & Engineering (100.0%), while the most female-oriented occupations are Education, Arts & Media (100.0%), Health Diagnosing & Treating (80.6%), and Management (73.1%).
| Occupation | Male | Female |
| Management | 18 (26.9%) | 49 (73.1%) |
| Business & Financial | 9 (56.2%) | 7 (43.8%) |
| Computers, Engineering & Science | 37 (100.0%) | 0 (0.0%) |
| Computers & Mathematics | 9 (100.0%) | 0 (0.0%) |
| Architecture & Engineering | 28 (100.0%) | 0 (0.0%) |
| Life, Physical & Social Science | 0 (0.0%) | 0 (0.0%) |
| Community & Social Service | 45 (59.2%) | 31 (40.8%) |
| Education, Arts & Media | 0 (0.0%) | 11 (100.0%) |
| Legal Services & Support | 0 (0.0%) | 0 (0.0%) |
| Education Instruction & Library | 20 (50.0%) | 20 (50.0%) |
| Arts, Media & Entertainment | 25 (100.0%) | 0 (0.0%) |
| Health Diagnosing & Treating | 6 (19.4%) | 25 (80.6%) |
| Health Technologists | 6 (31.6%) | 13 (68.4%) |
| Total (Category) | 115 (50.7%) | 112 (49.3%) |
| Total (Overall) | 436 (49.0%) | 453 (51.0%) |
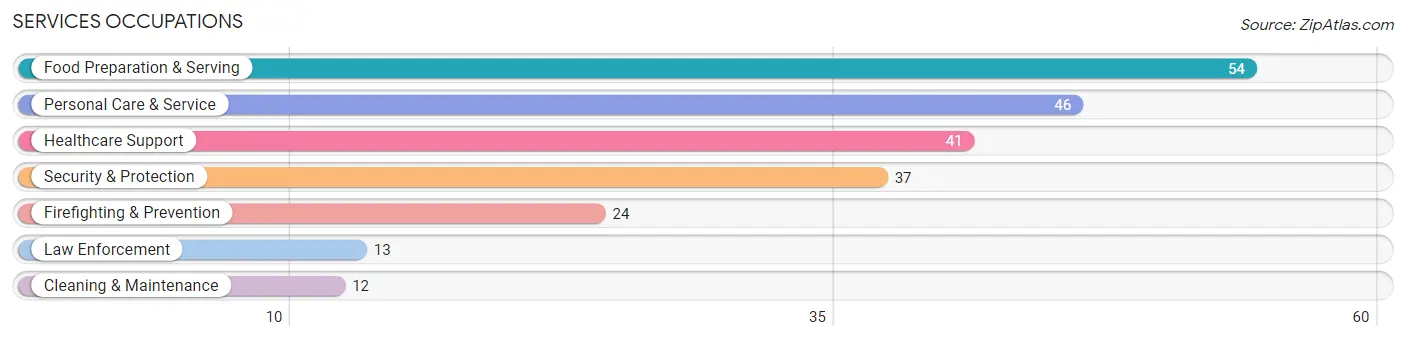
Services Occupations
The most common Services occupations in Petersburg are Food Preparation & Serving (54 | 6.1%), Personal Care & Service (46 | 5.2%), Healthcare Support (41 | 4.6%), Security & Protection (37 | 4.2%), and Firefighting & Prevention (24 | 2.7%).
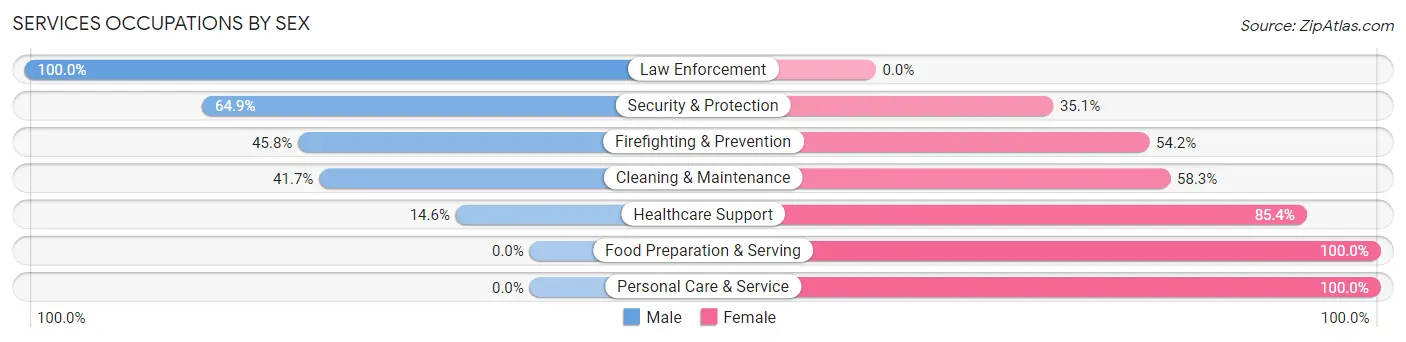
Services Occupations by Sex
Within the Services occupations in Petersburg, the most male-oriented occupations are Law Enforcement (100.0%), Security & Protection (64.9%), and Firefighting & Prevention (45.8%), while the most female-oriented occupations are Food Preparation & Serving (100.0%), Personal Care & Service (100.0%), and Healthcare Support (85.4%).
| Occupation | Male | Female |
| Healthcare Support | 6 (14.6%) | 35 (85.4%) |
| Security & Protection | 24 (64.9%) | 13 (35.1%) |
| Firefighting & Prevention | 11 (45.8%) | 13 (54.2%) |
| Law Enforcement | 13 (100.0%) | 0 (0.0%) |
| Food Preparation & Serving | 0 (0.0%) | 54 (100.0%) |
| Cleaning & Maintenance | 5 (41.7%) | 7 (58.3%) |
| Personal Care & Service | 0 (0.0%) | 46 (100.0%) |
| Total (Category) | 35 (18.4%) | 155 (81.6%) |
| Total (Overall) | 436 (49.0%) | 453 (51.0%) |
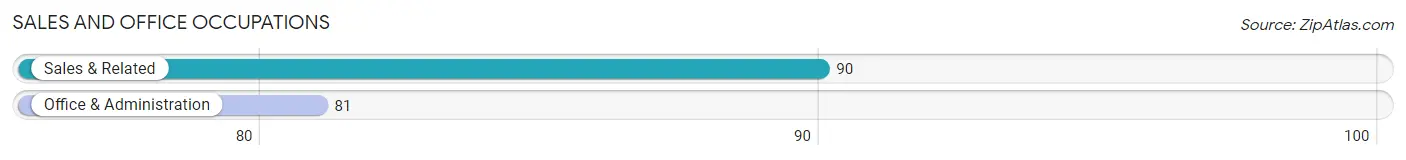
Sales and Office Occupations
The most common Sales and Office occupations in Petersburg are Sales & Related (90 | 10.1%), and Office & Administration (81 | 9.1%).
Sales and Office Occupations by Sex
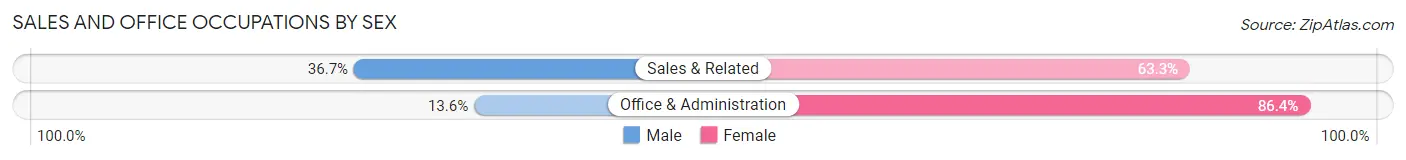
| Occupation | Male | Female |
| Sales & Related | 33 (36.7%) | 57 (63.3%) |
| Office & Administration | 11 (13.6%) | 70 (86.4%) |
| Total (Category) | 44 (25.7%) | 127 (74.3%) |
| Total (Overall) | 436 (49.0%) | 453 (51.0%) |
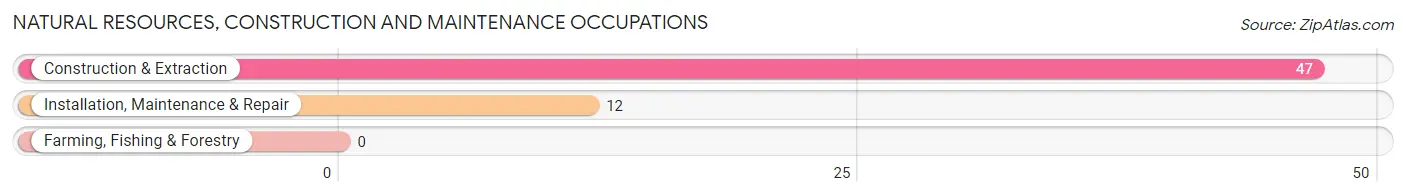
Natural Resources, Construction and Maintenance Occupations
The most common Natural Resources, Construction and Maintenance occupations in Petersburg are Construction & Extraction (47 | 5.3%), and Installation, Maintenance & Repair (12 | 1.3%).
Natural Resources, Construction and Maintenance Occupations by Sex
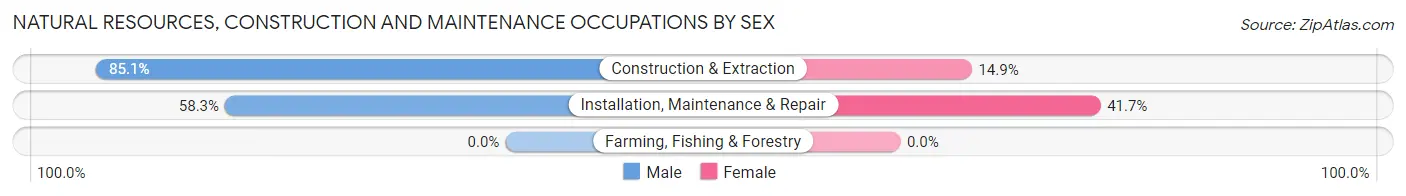
| Occupation | Male | Female |
| Farming, Fishing & Forestry | 0 (0.0%) | 0 (0.0%) |
| Construction & Extraction | 40 (85.1%) | 7 (14.9%) |
| Installation, Maintenance & Repair | 7 (58.3%) | 5 (41.7%) |
| Total (Category) | 47 (79.7%) | 12 (20.3%) |
| Total (Overall) | 436 (49.0%) | 453 (51.0%) |
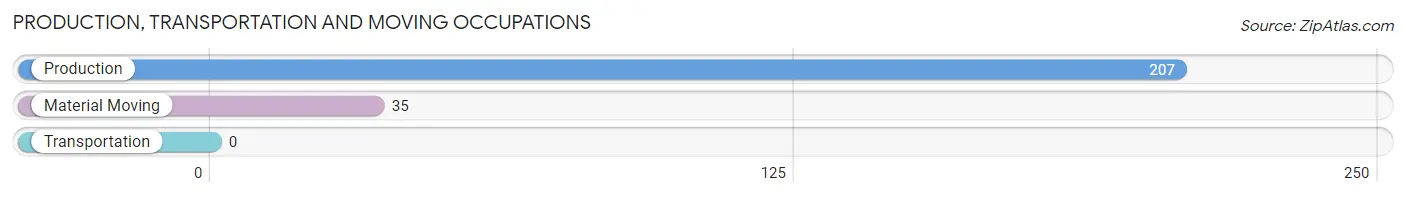
Production, Transportation and Moving Occupations
The most common Production, Transportation and Moving occupations in Petersburg are Production (207 | 23.3%), and Material Moving (35 | 3.9%).
Production, Transportation and Moving Occupations by Sex
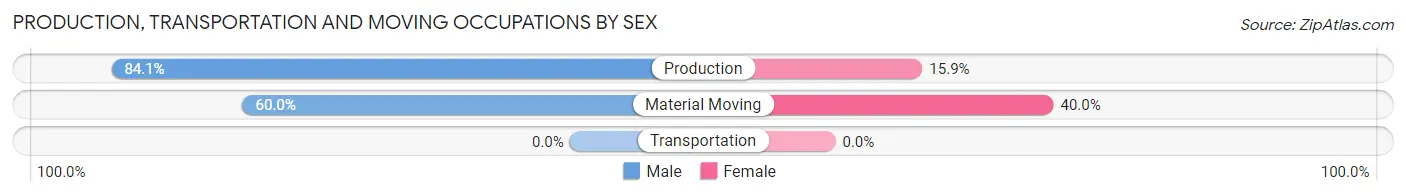
| Occupation | Male | Female |
| Production | 174 (84.1%) | 33 (15.9%) |
| Transportation | 0 (0.0%) | 0 (0.0%) |
| Material Moving | 21 (60.0%) | 14 (40.0%) |
| Total (Category) | 195 (80.6%) | 47 (19.4%) |
| Total (Overall) | 436 (49.0%) | 453 (51.0%) |
Employment Industries by Sex in Petersburg
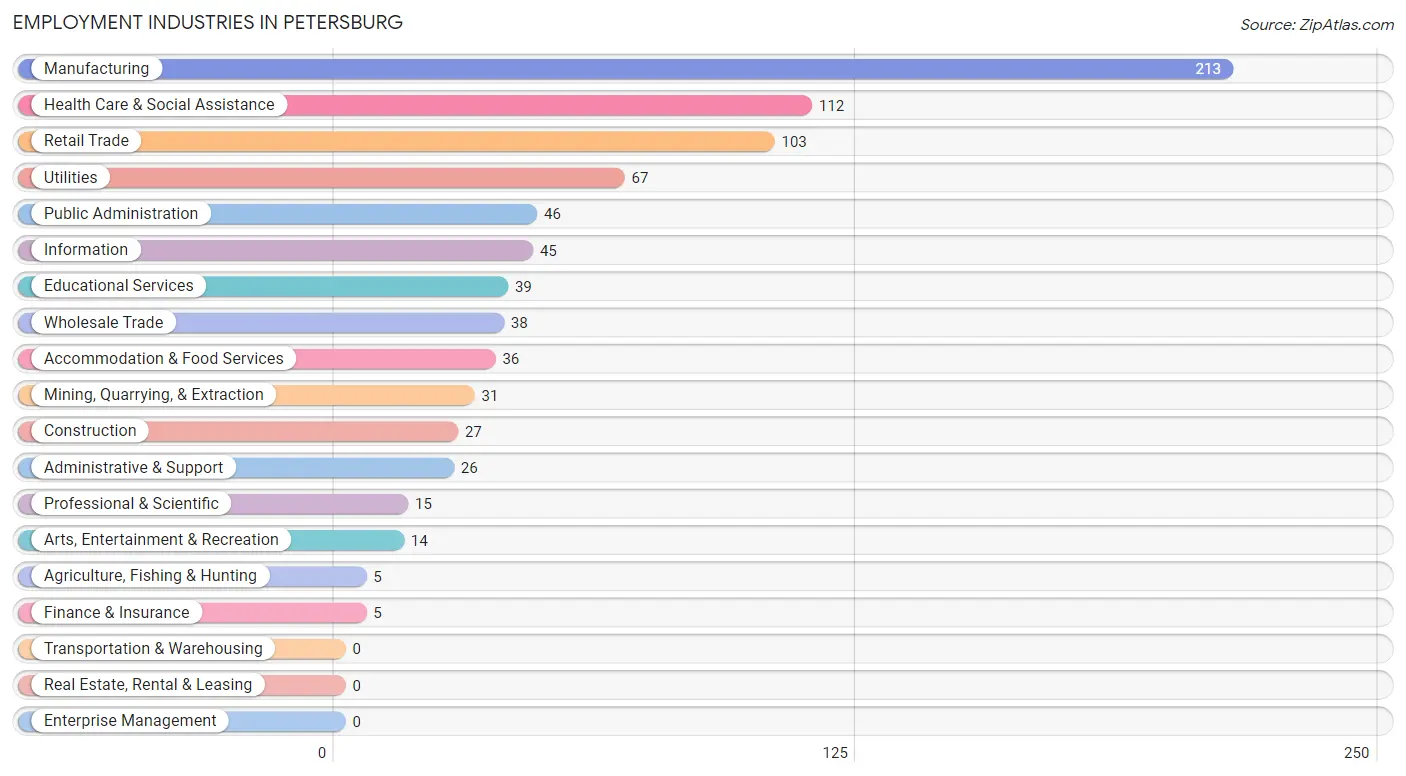
Employment Industries in Petersburg
The major employment industries in Petersburg include Manufacturing (213 | 24.0%), Health Care & Social Assistance (112 | 12.6%), Retail Trade (103 | 11.6%), Utilities (67 | 7.5%), and Public Administration (46 | 5.2%).
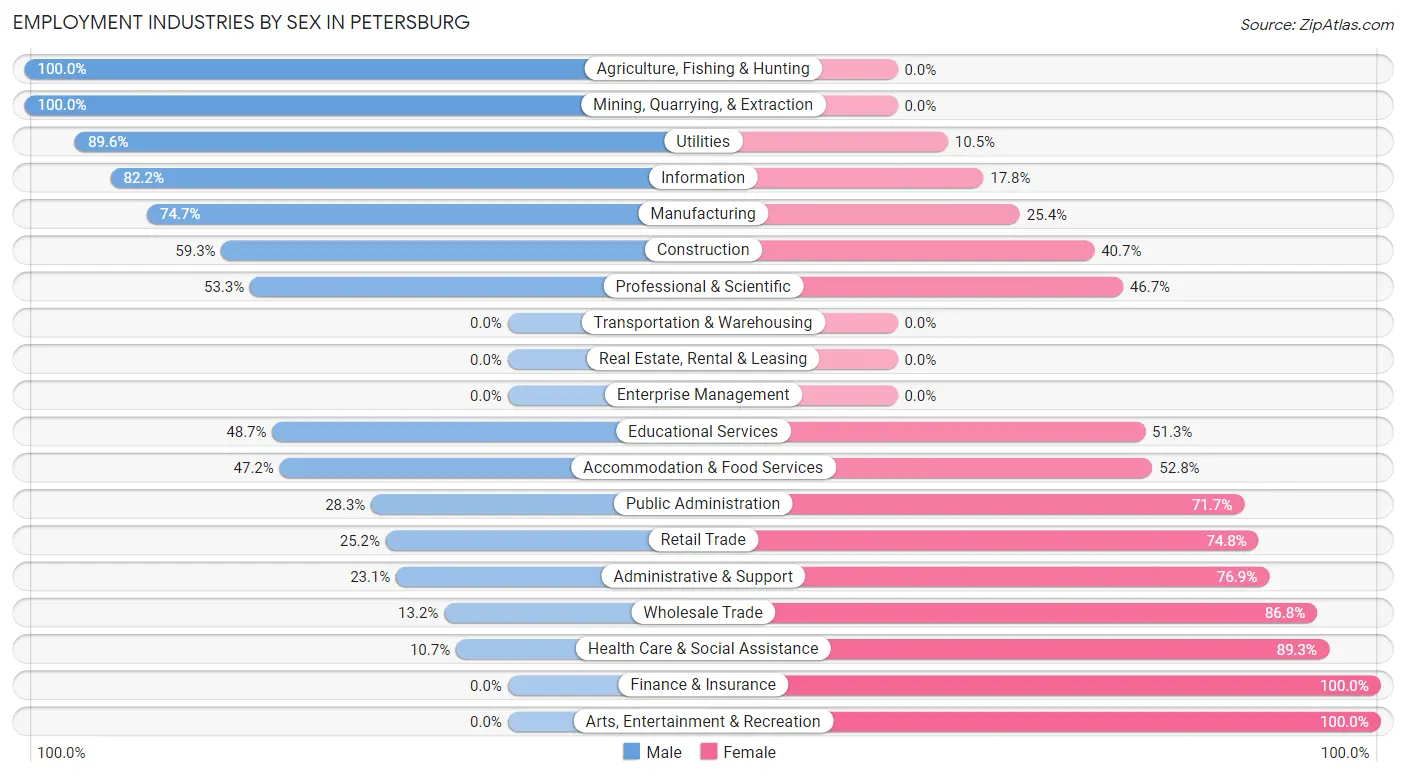
Employment Industries by Sex in Petersburg
The Petersburg industries that see more men than women are Agriculture, Fishing & Hunting (100.0%), Mining, Quarrying, & Extraction (100.0%), and Utilities (89.5%), whereas the industries that tend to have a higher number of women are Finance & Insurance (100.0%), Arts, Entertainment & Recreation (100.0%), and Health Care & Social Assistance (89.3%).
| Industry | Male | Female |
| Agriculture, Fishing & Hunting | 5 (100.0%) | 0 (0.0%) |
| Mining, Quarrying, & Extraction | 31 (100.0%) | 0 (0.0%) |
| Construction | 16 (59.3%) | 11 (40.7%) |
| Manufacturing | 159 (74.7%) | 54 (25.4%) |
| Wholesale Trade | 5 (13.2%) | 33 (86.8%) |
| Retail Trade | 26 (25.2%) | 77 (74.8%) |
| Transportation & Warehousing | 0 (0.0%) | 0 (0.0%) |
| Utilities | 60 (89.5%) | 7 (10.4%) |
| Information | 37 (82.2%) | 8 (17.8%) |
| Finance & Insurance | 0 (0.0%) | 5 (100.0%) |
| Real Estate, Rental & Leasing | 0 (0.0%) | 0 (0.0%) |
| Professional & Scientific | 8 (53.3%) | 7 (46.7%) |
| Enterprise Management | 0 (0.0%) | 0 (0.0%) |
| Administrative & Support | 6 (23.1%) | 20 (76.9%) |
| Educational Services | 19 (48.7%) | 20 (51.3%) |
| Health Care & Social Assistance | 12 (10.7%) | 100 (89.3%) |
| Arts, Entertainment & Recreation | 0 (0.0%) | 14 (100.0%) |
| Accommodation & Food Services | 17 (47.2%) | 19 (52.8%) |
| Public Administration | 13 (28.3%) | 33 (71.7%) |
| Total | 436 (49.0%) | 453 (51.0%) |
Education in Petersburg
School Enrollment in Petersburg
The most common levels of schooling among the 276 students in Petersburg are middle school (89 | 32.3%), high school (61 | 22.1%), and elementary school (43 | 15.6%).
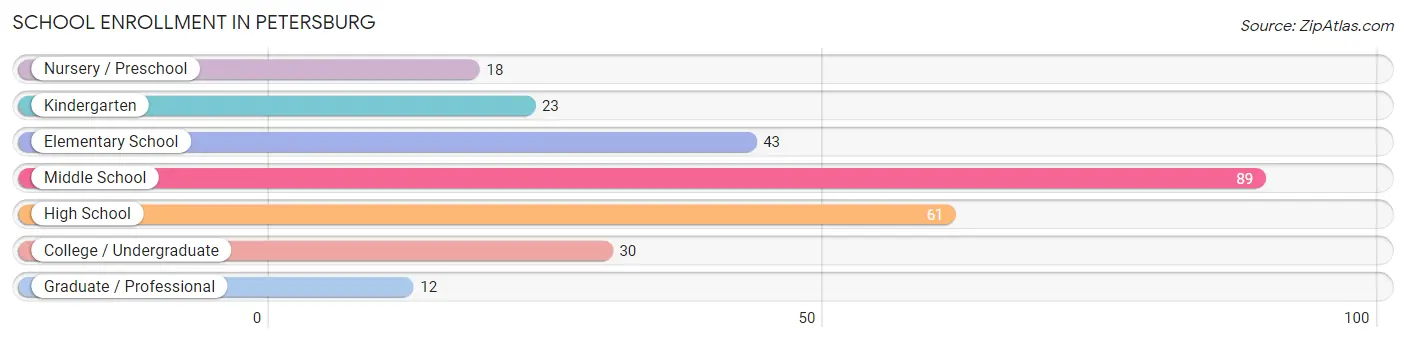
| School Level | # Students | % Students |
| Nursery / Preschool | 18 | 6.5% |
| Kindergarten | 23 | 8.3% |
| Elementary School | 43 | 15.6% |
| Middle School | 89 | 32.3% |
| High School | 61 | 22.1% |
| College / Undergraduate | 30 | 10.9% |
| Graduate / Professional | 12 | 4.3% |
| Total | 276 | 100.0% |
School Enrollment by Age by Funding Source in Petersburg
Out of a total of 276 students who are enrolled in schools in Petersburg, 11 (4.0%) attend a private institution, while the remaining 265 (96.0%) are enrolled in public schools. The age group of 5 to 9 year old has the highest likelihood of being enrolled in private schools, with 11 (15.5% in the age bracket) enrolled. Conversely, the age group of 3 to 4 year olds has the lowest likelihood of being enrolled in a private school, with 13 (100.0% in the age bracket) attending a public institution.
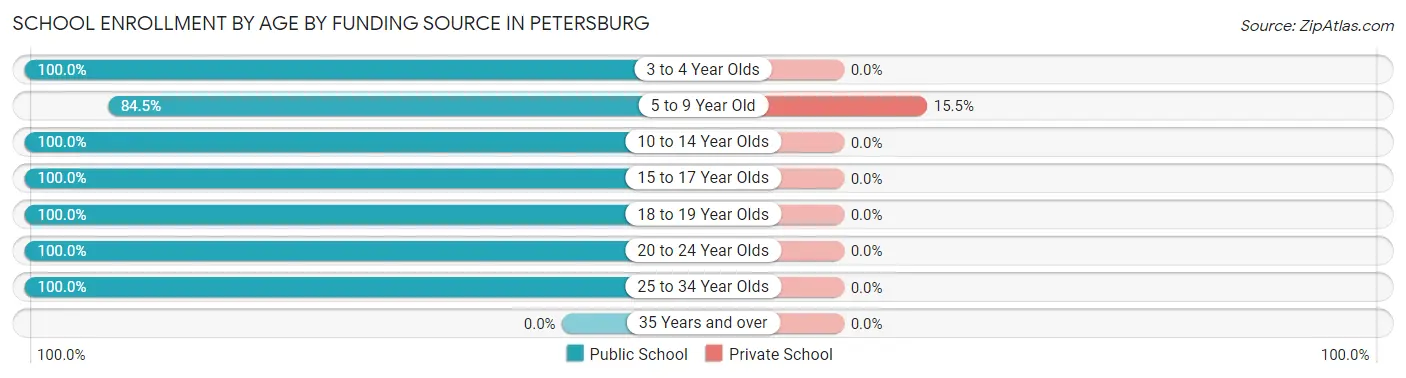
| Age Bracket | Public School | Private School |
| 3 to 4 Year Olds | 13 (100.0%) | 0 (0.0%) |
| 5 to 9 Year Old | 60 (84.5%) | 11 (15.5%) |
| 10 to 14 Year Olds | 82 (100.0%) | 0 (0.0%) |
| 15 to 17 Year Olds | 51 (100.0%) | 0 (0.0%) |
| 18 to 19 Year Olds | 17 (100.0%) | 0 (0.0%) |
| 20 to 24 Year Olds | 17 (100.0%) | 0 (0.0%) |
| 25 to 34 Year Olds | 25 (100.0%) | 0 (0.0%) |
| 35 Years and over | 0 (0.0%) | 0 (0.0%) |
| Total | 265 (96.0%) | 11 (4.0%) |
Educational Attainment by Field of Study in Petersburg
Education (48 | 17.8%), liberal arts & history (46 | 17.1%), science & technology (32 | 11.9%), business (31 | 11.5%), and engineering (29 | 10.8%) are the most common fields of study among 269 individuals in Petersburg who have obtained a bachelor's degree or higher.
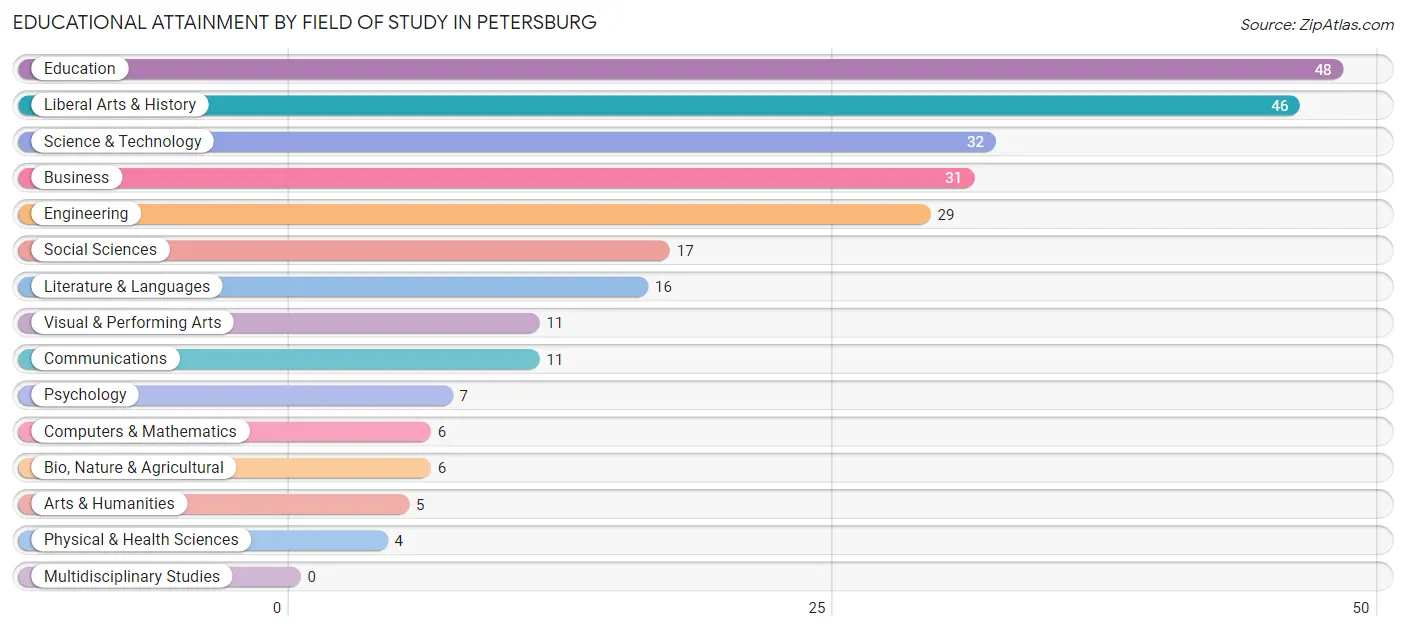
| Field of Study | # Graduates | % Graduates |
| Computers & Mathematics | 6 | 2.2% |
| Bio, Nature & Agricultural | 6 | 2.2% |
| Physical & Health Sciences | 4 | 1.5% |
| Psychology | 7 | 2.6% |
| Social Sciences | 17 | 6.3% |
| Engineering | 29 | 10.8% |
| Multidisciplinary Studies | 0 | 0.0% |
| Science & Technology | 32 | 11.9% |
| Business | 31 | 11.5% |
| Education | 48 | 17.8% |
| Literature & Languages | 16 | 5.9% |
| Liberal Arts & History | 46 | 17.1% |
| Visual & Performing Arts | 11 | 4.1% |
| Communications | 11 | 4.1% |
| Arts & Humanities | 5 | 1.9% |
| Total | 269 | 100.0% |
Transportation & Commute in Petersburg
Vehicle Availability by Sex in Petersburg
The most prevalent vehicle ownership categories in Petersburg are males with 2 vehicles (135, accounting for 32.3%) and females with 2 vehicles (110, making up 30.2%).
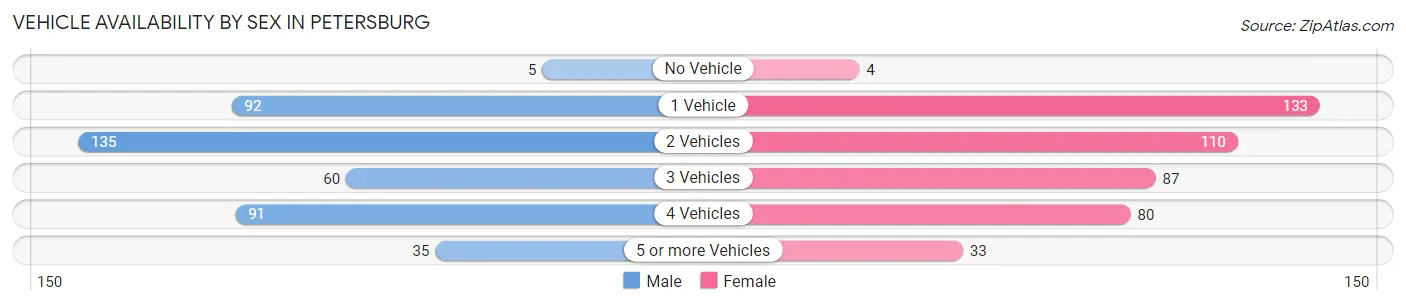
| Vehicles Available | Male | Female |
| No Vehicle | 5 (1.2%) | 4 (0.9%) |
| 1 Vehicle | 92 (22.0%) | 133 (29.7%) |
| 2 Vehicles | 135 (32.3%) | 110 (24.6%) |
| 3 Vehicles | 60 (14.3%) | 87 (19.5%) |
| 4 Vehicles | 91 (21.8%) | 80 (17.9%) |
| 5 or more Vehicles | 35 (8.4%) | 33 (7.4%) |
| Total | 418 (100.0%) | 447 (100.0%) |
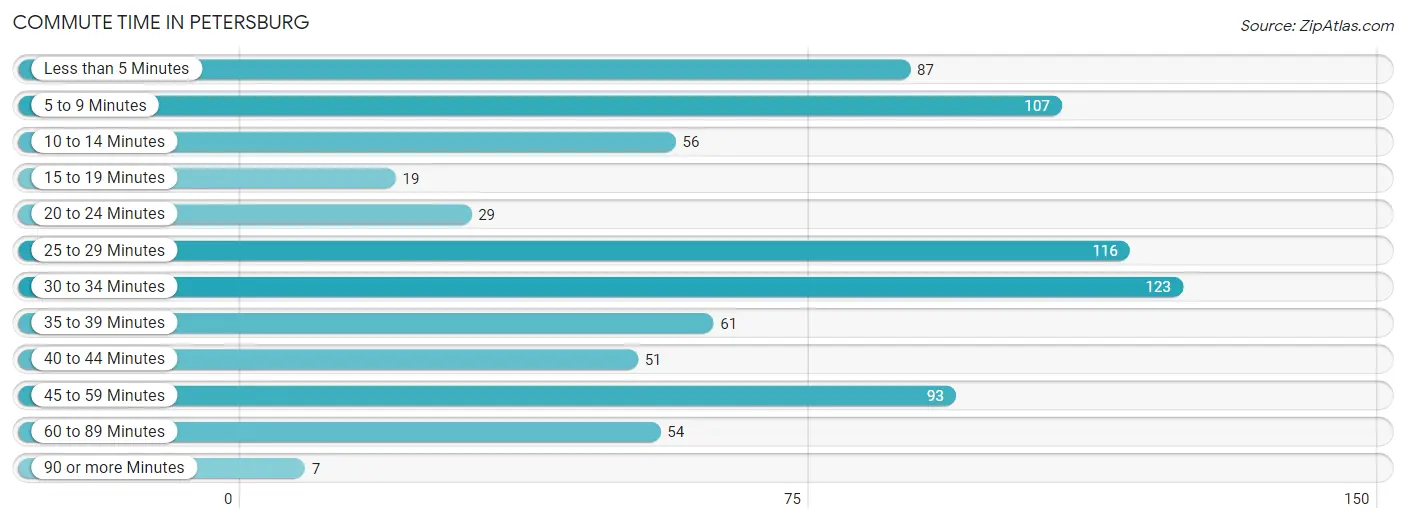
Commute Time in Petersburg
The most frequently occuring commute durations in Petersburg are 30 to 34 minutes (123 commuters, 15.3%), 25 to 29 minutes (116 commuters, 14.4%), and 5 to 9 minutes (107 commuters, 13.3%).
| Commute Time | # Commuters | % Commuters |
| Less than 5 Minutes | 87 | 10.8% |
| 5 to 9 Minutes | 107 | 13.3% |
| 10 to 14 Minutes | 56 | 7.0% |
| 15 to 19 Minutes | 19 | 2.4% |
| 20 to 24 Minutes | 29 | 3.6% |
| 25 to 29 Minutes | 116 | 14.4% |
| 30 to 34 Minutes | 123 | 15.3% |
| 35 to 39 Minutes | 61 | 7.6% |
| 40 to 44 Minutes | 51 | 6.4% |
| 45 to 59 Minutes | 93 | 11.6% |
| 60 to 89 Minutes | 54 | 6.7% |
| 90 or more Minutes | 7 | 0.9% |
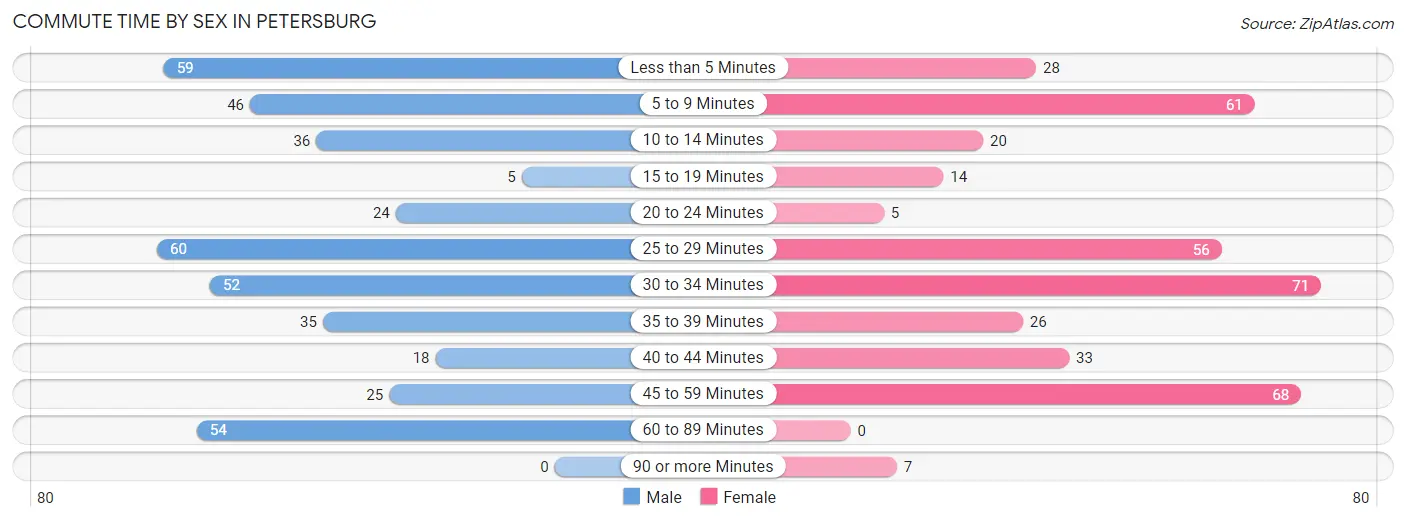
Commute Time by Sex in Petersburg
The most common commute times in Petersburg are 25 to 29 minutes (60 commuters, 14.5%) for males and 30 to 34 minutes (71 commuters, 18.2%) for females.
| Commute Time | Male | Female |
| Less than 5 Minutes | 59 (14.2%) | 28 (7.2%) |
| 5 to 9 Minutes | 46 (11.1%) | 61 (15.7%) |
| 10 to 14 Minutes | 36 (8.7%) | 20 (5.1%) |
| 15 to 19 Minutes | 5 (1.2%) | 14 (3.6%) |
| 20 to 24 Minutes | 24 (5.8%) | 5 (1.3%) |
| 25 to 29 Minutes | 60 (14.5%) | 56 (14.4%) |
| 30 to 34 Minutes | 52 (12.6%) | 71 (18.2%) |
| 35 to 39 Minutes | 35 (8.5%) | 26 (6.7%) |
| 40 to 44 Minutes | 18 (4.3%) | 33 (8.5%) |
| 45 to 59 Minutes | 25 (6.0%) | 68 (17.5%) |
| 60 to 89 Minutes | 54 (13.0%) | 0 (0.0%) |
| 90 or more Minutes | 0 (0.0%) | 7 (1.8%) |
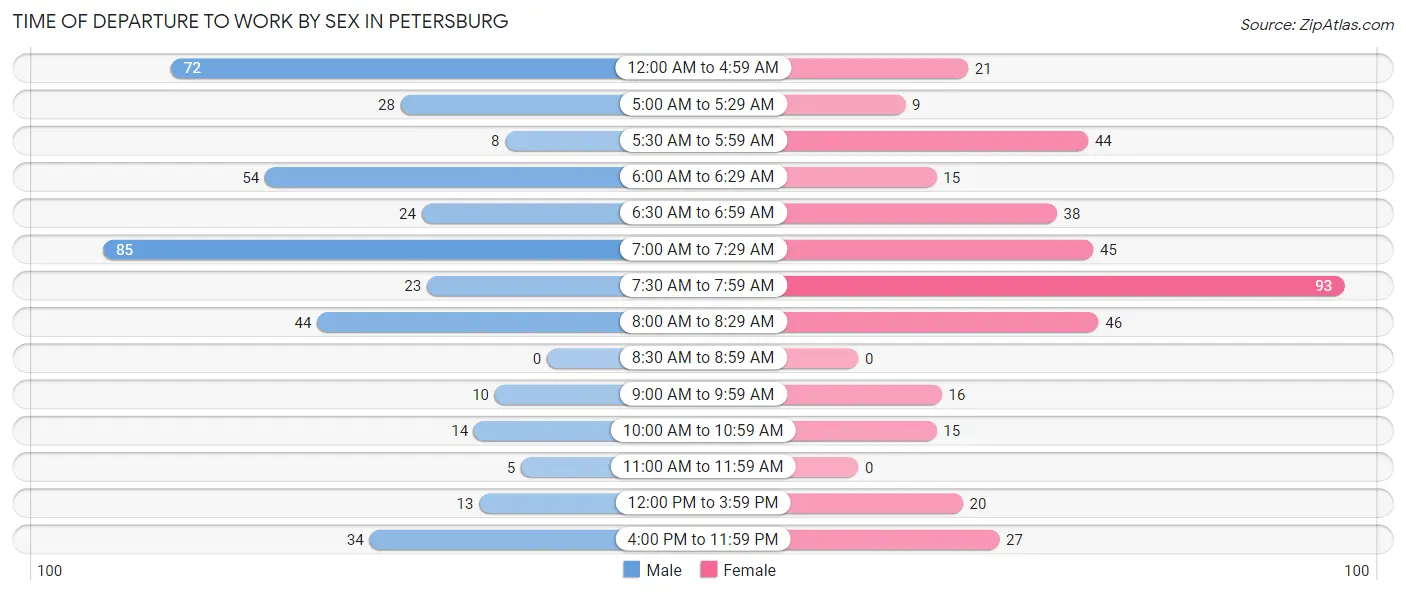
Time of Departure to Work by Sex in Petersburg
The most frequent times of departure to work in Petersburg are 7:00 AM to 7:29 AM (85, 20.5%) for males and 7:30 AM to 7:59 AM (93, 23.9%) for females.
| Time of Departure | Male | Female |
| 12:00 AM to 4:59 AM | 72 (17.4%) | 21 (5.4%) |
| 5:00 AM to 5:29 AM | 28 (6.8%) | 9 (2.3%) |
| 5:30 AM to 5:59 AM | 8 (1.9%) | 44 (11.3%) |
| 6:00 AM to 6:29 AM | 54 (13.0%) | 15 (3.9%) |
| 6:30 AM to 6:59 AM | 24 (5.8%) | 38 (9.8%) |
| 7:00 AM to 7:29 AM | 85 (20.5%) | 45 (11.6%) |
| 7:30 AM to 7:59 AM | 23 (5.6%) | 93 (23.9%) |
| 8:00 AM to 8:29 AM | 44 (10.6%) | 46 (11.8%) |
| 8:30 AM to 8:59 AM | 0 (0.0%) | 0 (0.0%) |
| 9:00 AM to 9:59 AM | 10 (2.4%) | 16 (4.1%) |
| 10:00 AM to 10:59 AM | 14 (3.4%) | 15 (3.9%) |
| 11:00 AM to 11:59 AM | 5 (1.2%) | 0 (0.0%) |
| 12:00 PM to 3:59 PM | 13 (3.1%) | 20 (5.1%) |
| 4:00 PM to 11:59 PM | 34 (8.2%) | 27 (6.9%) |
| Total | 414 (100.0%) | 389 (100.0%) |
Housing Occupancy in Petersburg
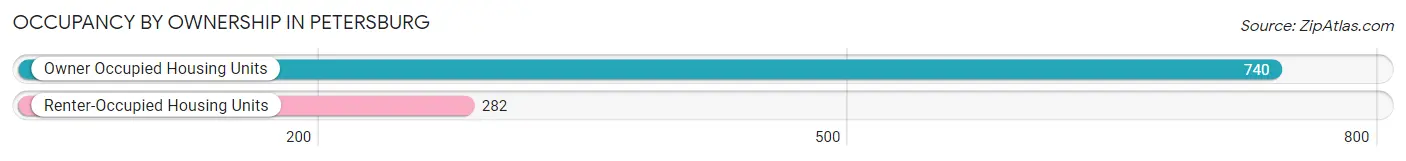
Occupancy by Ownership in Petersburg
Of the total 1,022 dwellings in Petersburg, owner-occupied units account for 740 (72.4%), while renter-occupied units make up 282 (27.6%).
| Occupancy | # Housing Units | % Housing Units |
| Owner Occupied Housing Units | 740 | 72.4% |
| Renter-Occupied Housing Units | 282 | 27.6% |
| Total Occupied Housing Units | 1,022 | 100.0% |
Occupancy by Household Size in Petersburg
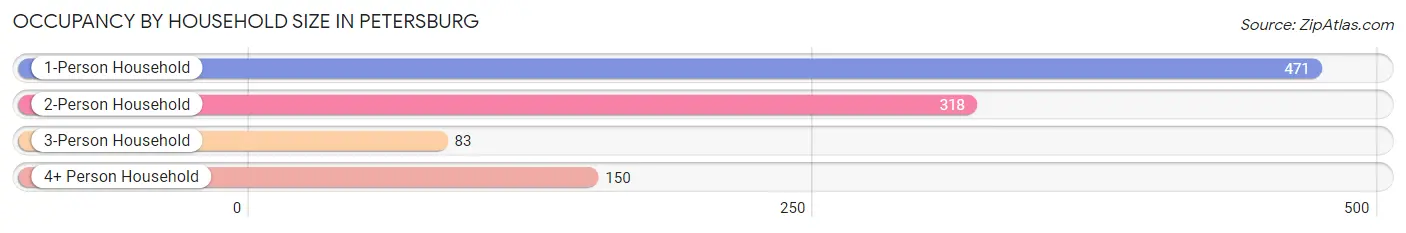
| Household Size | # Housing Units | % Housing Units |
| 1-Person Household | 471 | 46.1% |
| 2-Person Household | 318 | 31.1% |
| 3-Person Household | 83 | 8.1% |
| 4+ Person Household | 150 | 14.7% |
| Total Housing Units | 1,022 | 100.0% |
Occupancy by Ownership by Household Size in Petersburg
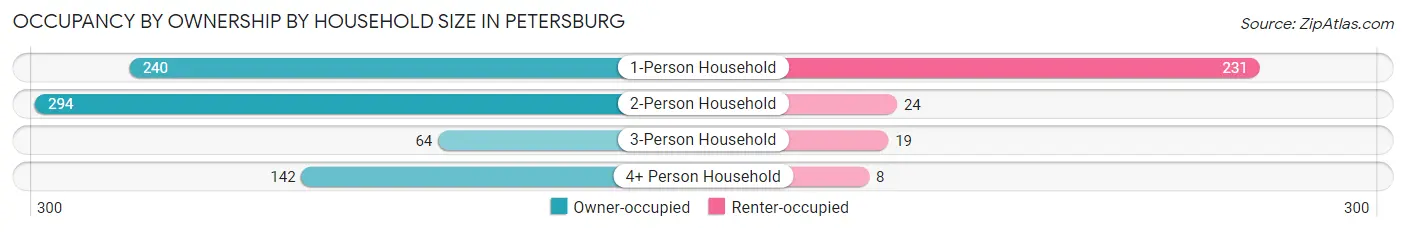
| Household Size | Owner-occupied | Renter-occupied |
| 1-Person Household | 240 (51.0%) | 231 (49.0%) |
| 2-Person Household | 294 (92.4%) | 24 (7.5%) |
| 3-Person Household | 64 (77.1%) | 19 (22.9%) |
| 4+ Person Household | 142 (94.7%) | 8 (5.3%) |
| Total Housing Units | 740 (72.4%) | 282 (27.6%) |
Occupancy by Educational Attainment in Petersburg
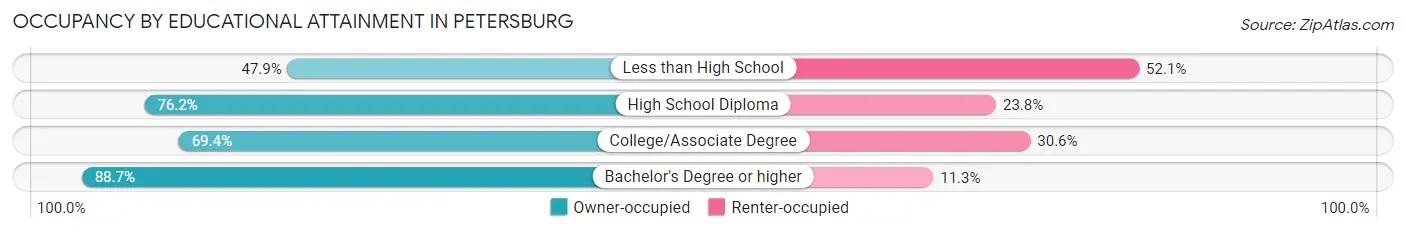
| Household Size | Owner-occupied | Renter-occupied |
| Less than High School | 67 (47.9%) | 73 (52.1%) |
| High School Diploma | 356 (76.2%) | 111 (23.8%) |
| College/Associate Degree | 184 (69.4%) | 81 (30.6%) |
| Bachelor's Degree or higher | 133 (88.7%) | 17 (11.3%) |
Occupancy by Age of Householder in Petersburg
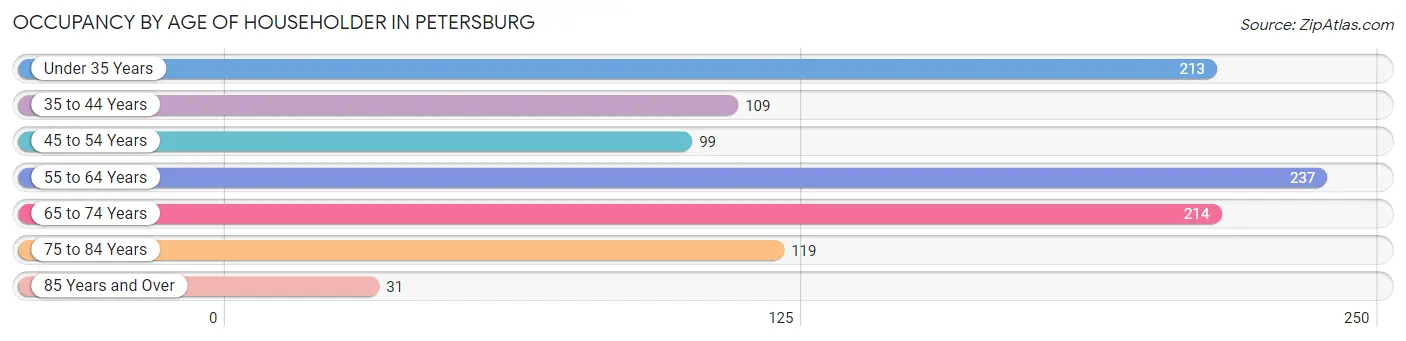
| Age Bracket | # Households | % Households |
| Under 35 Years | 213 | 20.8% |
| 35 to 44 Years | 109 | 10.7% |
| 45 to 54 Years | 99 | 9.7% |
| 55 to 64 Years | 237 | 23.2% |
| 65 to 74 Years | 214 | 20.9% |
| 75 to 84 Years | 119 | 11.6% |
| 85 Years and Over | 31 | 3.0% |
| Total | 1,022 | 100.0% |
Housing Finances in Petersburg
Median Income by Occupancy in Petersburg
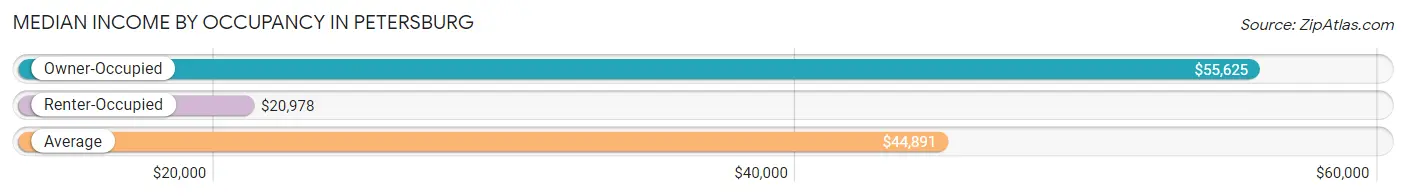
| Occupancy Type | # Households | Median Income |
| Owner-Occupied | 740 (72.4%) | $55,625 |
| Renter-Occupied | 282 (27.6%) | $20,978 |
| Average | 1,022 (100.0%) | $44,891 |
Occupancy by Householder Income Bracket in Petersburg
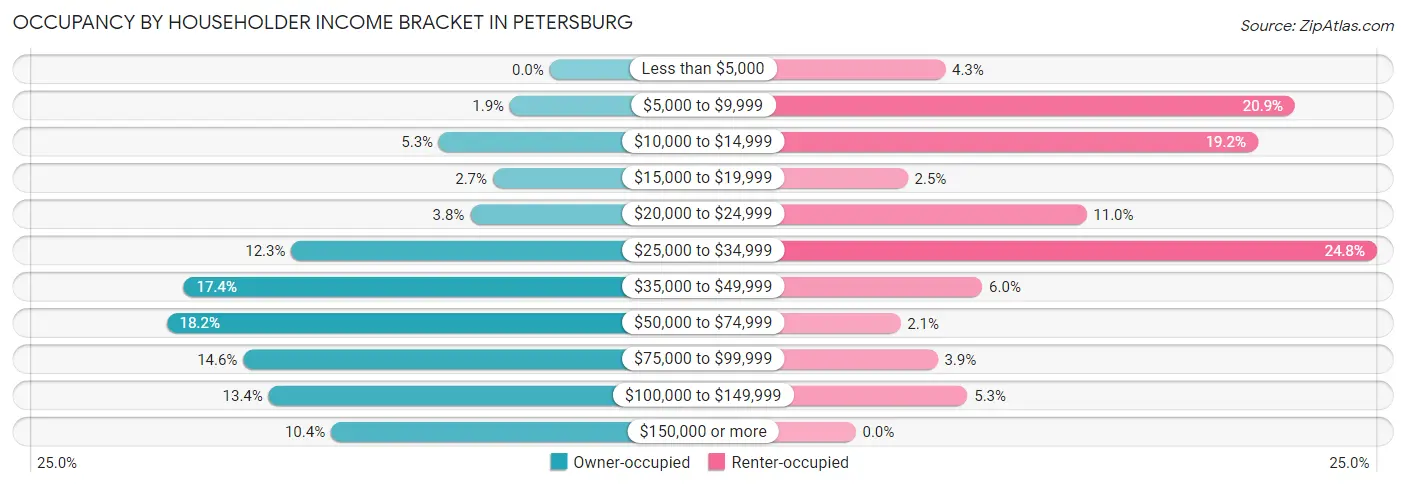
| Income Bracket | Owner-occupied | Renter-occupied |
| Less than $5,000 | 0 (0.0%) | 12 (4.3%) |
| $5,000 to $9,999 | 14 (1.9%) | 59 (20.9%) |
| $10,000 to $14,999 | 39 (5.3%) | 54 (19.2%) |
| $15,000 to $19,999 | 20 (2.7%) | 7 (2.5%) |
| $20,000 to $24,999 | 28 (3.8%) | 31 (11.0%) |
| $25,000 to $34,999 | 91 (12.3%) | 70 (24.8%) |
| $35,000 to $49,999 | 129 (17.4%) | 17 (6.0%) |
| $50,000 to $74,999 | 135 (18.2%) | 6 (2.1%) |
| $75,000 to $99,999 | 108 (14.6%) | 11 (3.9%) |
| $100,000 to $149,999 | 99 (13.4%) | 15 (5.3%) |
| $150,000 or more | 77 (10.4%) | 0 (0.0%) |
| Total | 740 (100.0%) | 282 (100.0%) |
Monthly Housing Cost Tiers in Petersburg
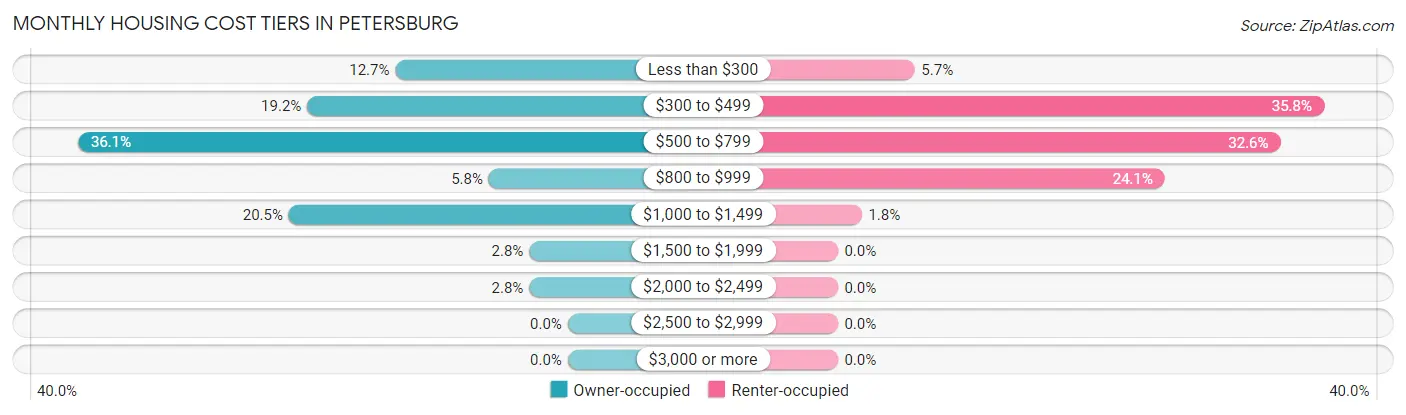
| Monthly Cost | Owner-occupied | Renter-occupied |
| Less than $300 | 94 (12.7%) | 16 (5.7%) |
| $300 to $499 | 142 (19.2%) | 101 (35.8%) |
| $500 to $799 | 267 (36.1%) | 92 (32.6%) |
| $800 to $999 | 43 (5.8%) | 68 (24.1%) |
| $1,000 to $1,499 | 152 (20.5%) | 5 (1.8%) |
| $1,500 to $1,999 | 21 (2.8%) | 0 (0.0%) |
| $2,000 to $2,499 | 21 (2.8%) | 0 (0.0%) |
| $2,500 to $2,999 | 0 (0.0%) | 0 (0.0%) |
| $3,000 or more | 0 (0.0%) | 0 (0.0%) |
| Total | 740 (100.0%) | 282 (100.0%) |
Physical Housing Characteristics in Petersburg
Housing Structures in Petersburg
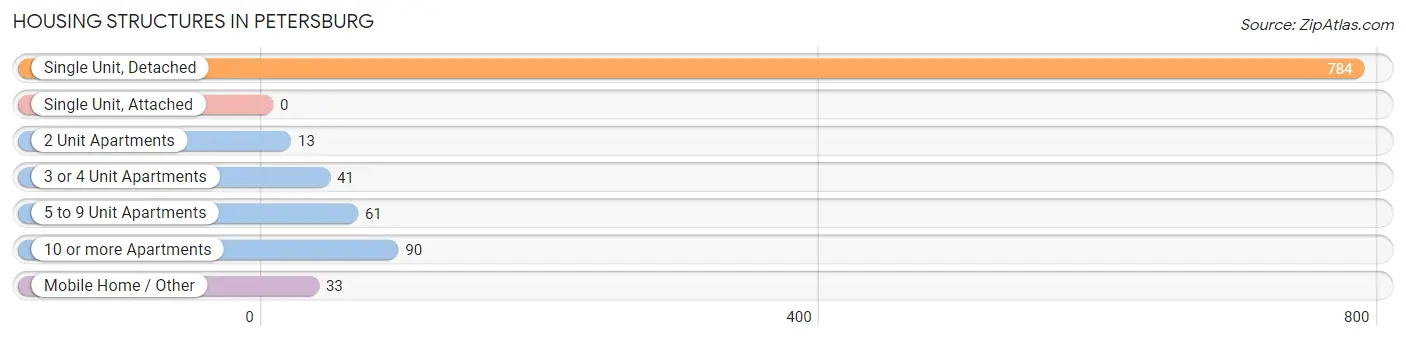
| Structure Type | # Housing Units | % Housing Units |
| Single Unit, Detached | 784 | 76.7% |
| Single Unit, Attached | 0 | 0.0% |
| 2 Unit Apartments | 13 | 1.3% |
| 3 or 4 Unit Apartments | 41 | 4.0% |
| 5 to 9 Unit Apartments | 61 | 6.0% |
| 10 or more Apartments | 90 | 8.8% |
| Mobile Home / Other | 33 | 3.2% |
| Total | 1,022 | 100.0% |
Housing Structures by Occupancy in Petersburg
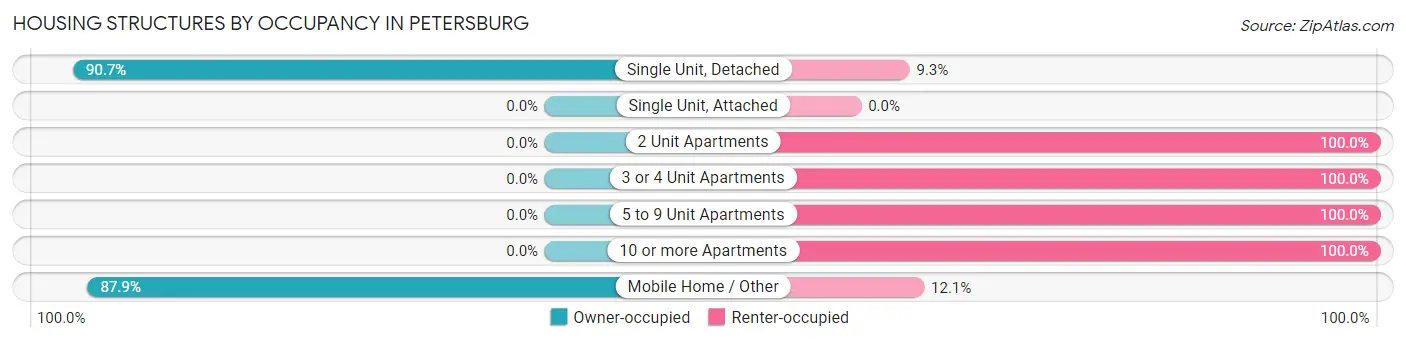
| Structure Type | Owner-occupied | Renter-occupied |
| Single Unit, Detached | 711 (90.7%) | 73 (9.3%) |
| Single Unit, Attached | 0 (0.0%) | 0 (0.0%) |
| 2 Unit Apartments | 0 (0.0%) | 13 (100.0%) |
| 3 or 4 Unit Apartments | 0 (0.0%) | 41 (100.0%) |
| 5 to 9 Unit Apartments | 0 (0.0%) | 61 (100.0%) |
| 10 or more Apartments | 0 (0.0%) | 90 (100.0%) |
| Mobile Home / Other | 29 (87.9%) | 4 (12.1%) |
| Total | 740 (72.4%) | 282 (27.6%) |
Housing Structures by Number of Rooms in Petersburg
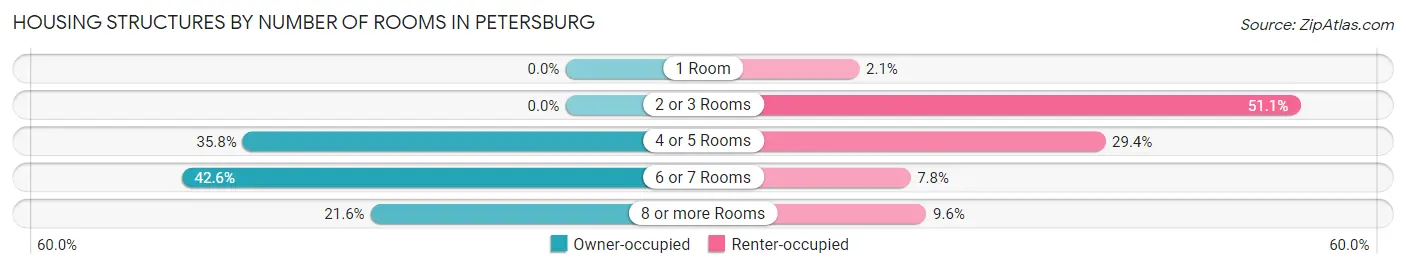
| Number of Rooms | Owner-occupied | Renter-occupied |
| 1 Room | 0 (0.0%) | 6 (2.1%) |
| 2 or 3 Rooms | 0 (0.0%) | 144 (51.1%) |
| 4 or 5 Rooms | 265 (35.8%) | 83 (29.4%) |
| 6 or 7 Rooms | 315 (42.6%) | 22 (7.8%) |
| 8 or more Rooms | 160 (21.6%) | 27 (9.6%) |
| Total | 740 (100.0%) | 282 (100.0%) |
Housing Structure by Heating Type in Petersburg
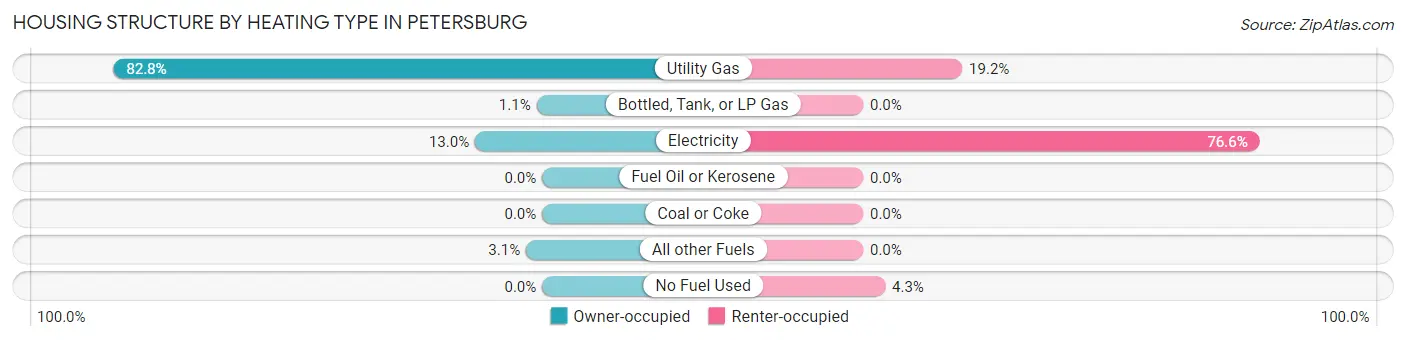
| Heating Type | Owner-occupied | Renter-occupied |
| Utility Gas | 613 (82.8%) | 54 (19.2%) |
| Bottled, Tank, or LP Gas | 8 (1.1%) | 0 (0.0%) |
| Electricity | 96 (13.0%) | 216 (76.6%) |
| Fuel Oil or Kerosene | 0 (0.0%) | 0 (0.0%) |
| Coal or Coke | 0 (0.0%) | 0 (0.0%) |
| All other Fuels | 23 (3.1%) | 0 (0.0%) |
| No Fuel Used | 0 (0.0%) | 12 (4.3%) |
| Total | 740 (100.0%) | 282 (100.0%) |
Household Vehicle Usage in Petersburg
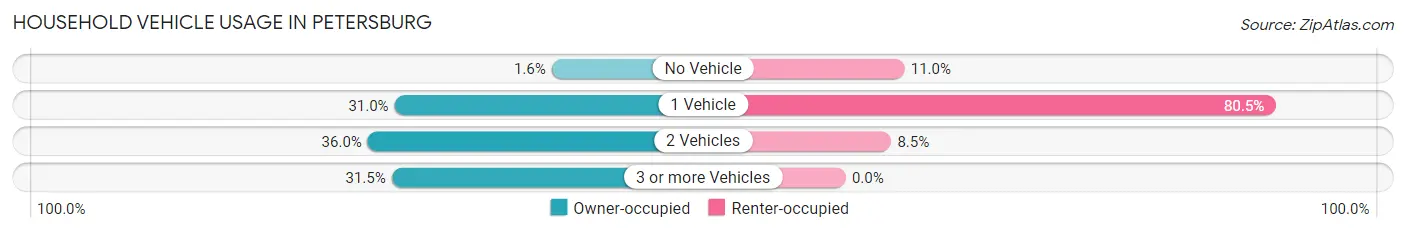
| Vehicles per Household | Owner-occupied | Renter-occupied |
| No Vehicle | 12 (1.6%) | 31 (11.0%) |
| 1 Vehicle | 229 (30.9%) | 227 (80.5%) |
| 2 Vehicles | 266 (35.9%) | 24 (8.5%) |
| 3 or more Vehicles | 233 (31.5%) | 0 (0.0%) |
| Total | 740 (100.0%) | 282 (100.0%) |
Real Estate & Mortgages in Petersburg
Real Estate and Mortgage Overview in Petersburg
| Characteristic | Without Mortgage | With Mortgage |
| Housing Units | 288 | 452 |
| Median Property Value | $87,800 | $89,900 |
| Median Household Income | $45,179 | $72 |
| Monthly Housing Costs | $341 | $0 |
| Real Estate Taxes | $676 | $6 |
Property Value by Mortgage Status in Petersburg
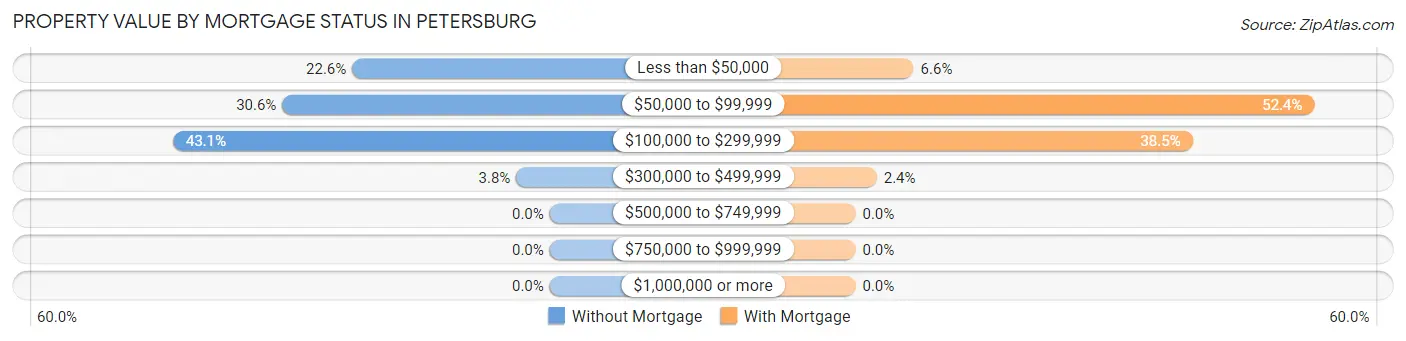
| Property Value | Without Mortgage | With Mortgage |
| Less than $50,000 | 65 (22.6%) | 30 (6.6%) |
| $50,000 to $99,999 | 88 (30.6%) | 237 (52.4%) |
| $100,000 to $299,999 | 124 (43.1%) | 174 (38.5%) |
| $300,000 to $499,999 | 11 (3.8%) | 11 (2.4%) |
| $500,000 to $749,999 | 0 (0.0%) | 0 (0.0%) |
| $750,000 to $999,999 | 0 (0.0%) | 0 (0.0%) |
| $1,000,000 or more | 0 (0.0%) | 0 (0.0%) |
| Total | 288 (100.0%) | 452 (100.0%) |
Household Income by Mortgage Status in Petersburg
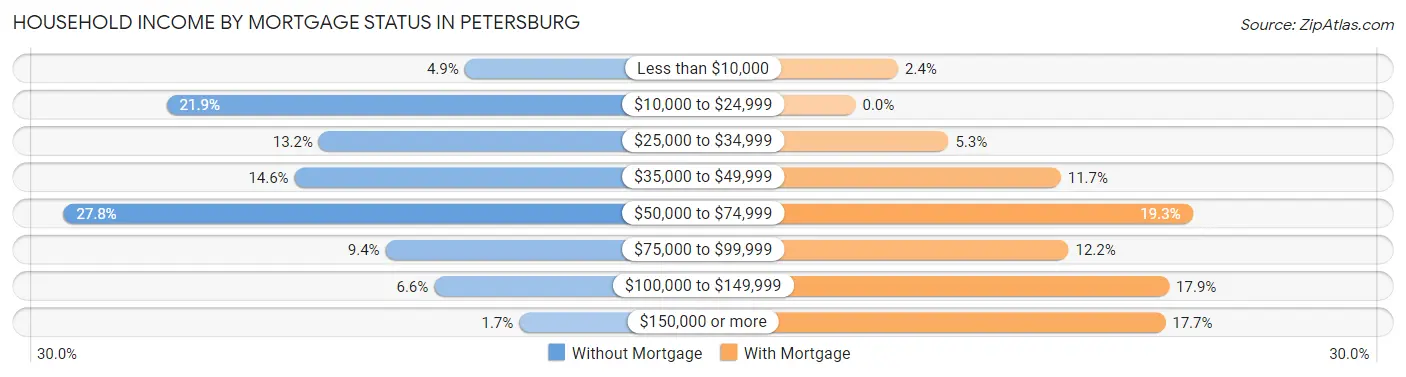
| Household Income | Without Mortgage | With Mortgage |
| Less than $10,000 | 14 (4.9%) | 11 (2.4%) |
| $10,000 to $24,999 | 63 (21.9%) | 0 (0.0%) |
| $25,000 to $34,999 | 38 (13.2%) | 24 (5.3%) |
| $35,000 to $49,999 | 42 (14.6%) | 53 (11.7%) |
| $50,000 to $74,999 | 80 (27.8%) | 87 (19.3%) |
| $75,000 to $99,999 | 27 (9.4%) | 55 (12.2%) |
| $100,000 to $149,999 | 19 (6.6%) | 81 (17.9%) |
| $150,000 or more | 5 (1.7%) | 80 (17.7%) |
| Total | 288 (100.0%) | 452 (100.0%) |
Property Value to Household Income Ratio in Petersburg
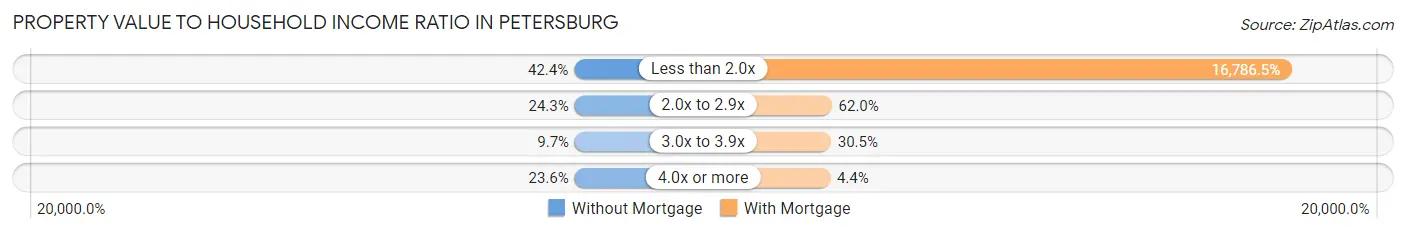
| Value-to-Income Ratio | Without Mortgage | With Mortgage |
| Less than 2.0x | 122 (42.4%) | 75,875 (16,786.5%) |
| 2.0x to 2.9x | 70 (24.3%) | 280 (62.0%) |
| 3.0x to 3.9x | 28 (9.7%) | 138 (30.5%) |
| 4.0x or more | 68 (23.6%) | 20 (4.4%) |
| Total | 288 (100.0%) | 452 (100.0%) |
Real Estate Taxes by Mortgage Status in Petersburg
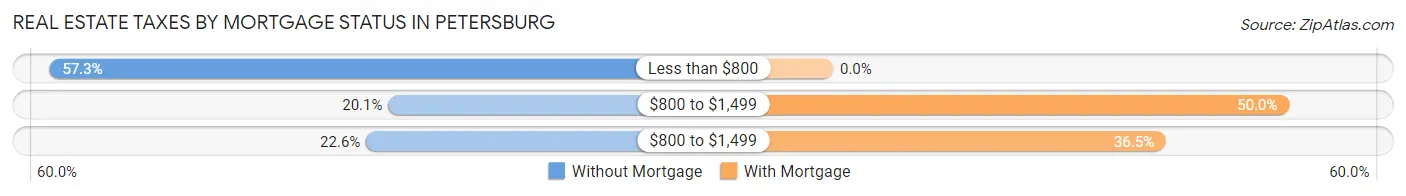
| Property Taxes | Without Mortgage | With Mortgage |
| Less than $800 | 165 (57.3%) | 0 (0.0%) |
| $800 to $1,499 | 58 (20.1%) | 226 (50.0%) |
| $800 to $1,499 | 65 (22.6%) | 165 (36.5%) |
| Total | 288 (100.0%) | 452 (100.0%) |
Health & Disability in Petersburg
Health Insurance Coverage by Age in Petersburg
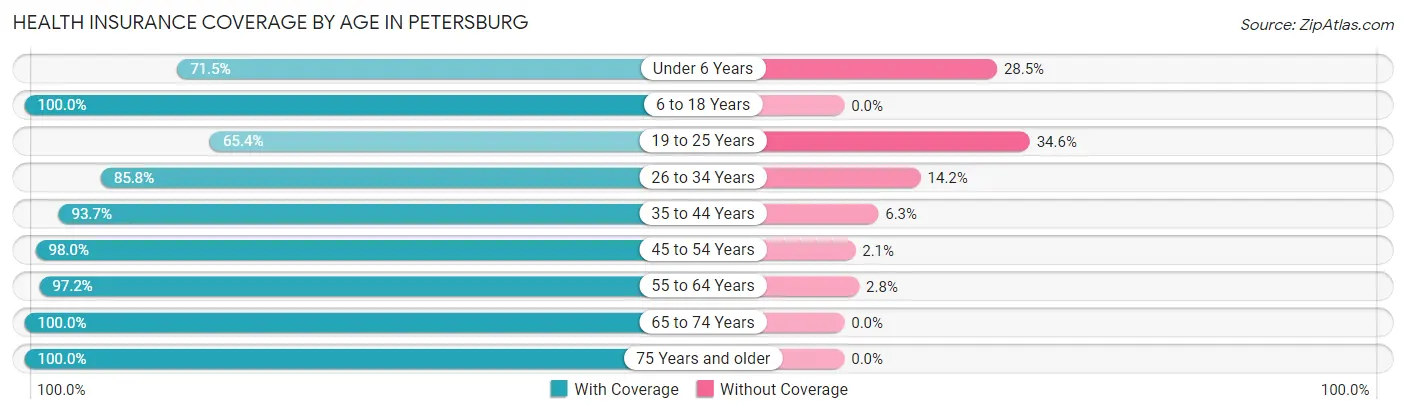
| Age Bracket | With Coverage | Without Coverage |
| Under 6 Years | 103 (71.5%) | 41 (28.5%) |
| 6 to 18 Years | 222 (100.0%) | 0 (0.0%) |
| 19 to 25 Years | 70 (65.4%) | 37 (34.6%) |
| 26 to 34 Years | 223 (85.8%) | 37 (14.2%) |
| 35 to 44 Years | 192 (93.7%) | 13 (6.3%) |
| 45 to 54 Years | 191 (98.0%) | 4 (2.1%) |
| 55 to 64 Years | 351 (97.2%) | 10 (2.8%) |
| 65 to 74 Years | 303 (100.0%) | 0 (0.0%) |
| 75 Years and older | 218 (100.0%) | 0 (0.0%) |
| Total | 1,873 (92.9%) | 142 (7.0%) |
Health Insurance Coverage by Citizenship Status in Petersburg
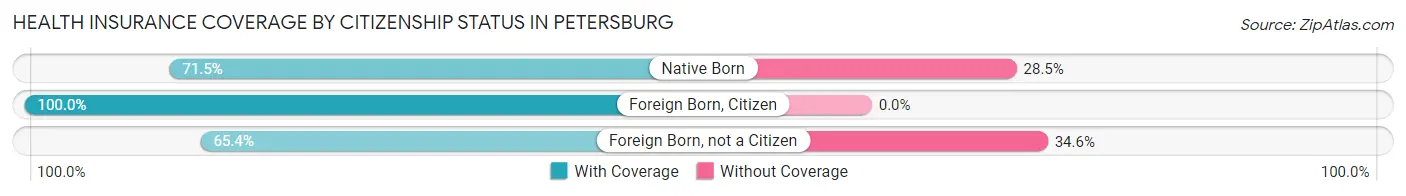
| Citizenship Status | With Coverage | Without Coverage |
| Native Born | 103 (71.5%) | 41 (28.5%) |
| Foreign Born, Citizen | 222 (100.0%) | 0 (0.0%) |
| Foreign Born, not a Citizen | 70 (65.4%) | 37 (34.6%) |
Health Insurance Coverage by Household Income in Petersburg
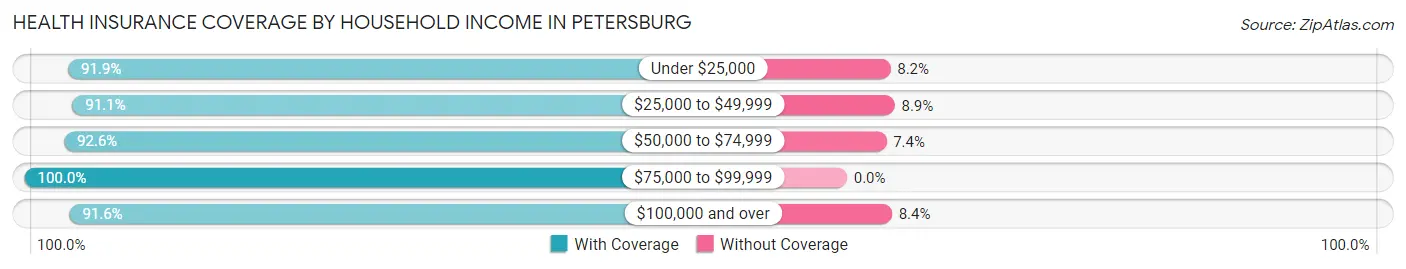
| Household Income | With Coverage | Without Coverage |
| Under $25,000 | 293 (91.8%) | 26 (8.2%) |
| $25,000 to $49,999 | 479 (91.1%) | 47 (8.9%) |
| $50,000 to $74,999 | 301 (92.6%) | 24 (7.4%) |
| $75,000 to $99,999 | 312 (100.0%) | 0 (0.0%) |
| $100,000 and over | 468 (91.6%) | 43 (8.4%) |
Public vs Private Health Insurance Coverage by Age in Petersburg
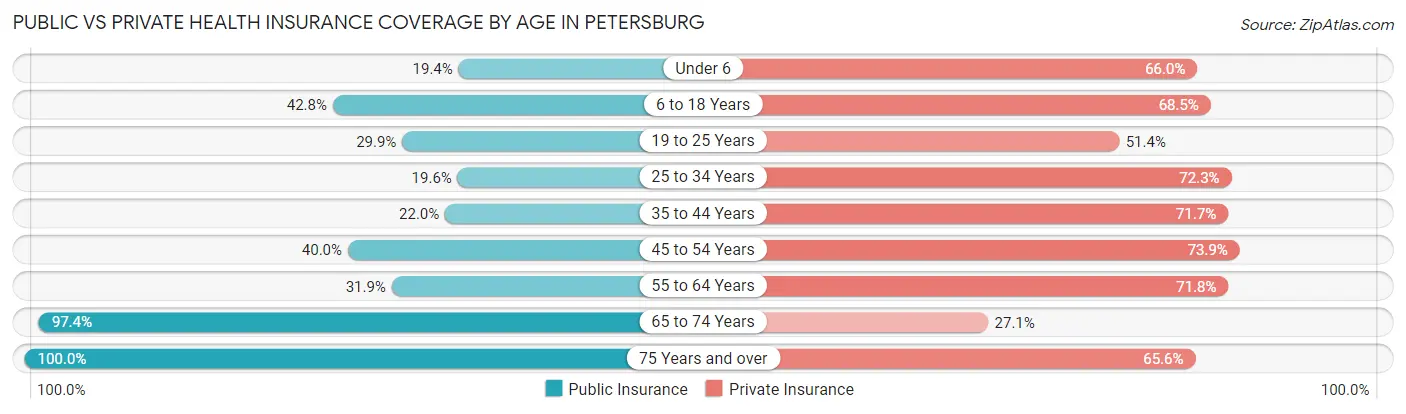
| Age Bracket | Public Insurance | Private Insurance |
| Under 6 | 28 (19.4%) | 95 (66.0%) |
| 6 to 18 Years | 95 (42.8%) | 152 (68.5%) |
| 19 to 25 Years | 32 (29.9%) | 55 (51.4%) |
| 25 to 34 Years | 51 (19.6%) | 188 (72.3%) |
| 35 to 44 Years | 45 (22.0%) | 147 (71.7%) |
| 45 to 54 Years | 78 (40.0%) | 144 (73.9%) |
| 55 to 64 Years | 115 (31.9%) | 259 (71.8%) |
| 65 to 74 Years | 295 (97.4%) | 82 (27.1%) |
| 75 Years and over | 218 (100.0%) | 143 (65.6%) |
| Total | 957 (47.5%) | 1,265 (62.8%) |
Disability Status by Sex by Age in Petersburg
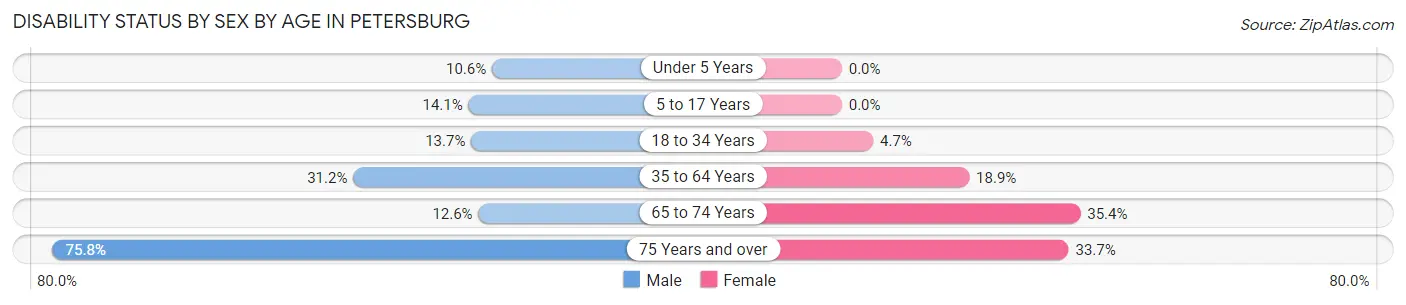
| Age Bracket | Male | Female |
| Under 5 Years | 9 (10.6%) | 0 (0.0%) |
| 5 to 17 Years | 20 (14.1%) | 0 (0.0%) |
| 18 to 34 Years | 29 (13.7%) | 8 (4.6%) |
| 35 to 64 Years | 112 (31.2%) | 76 (18.9%) |
| 65 to 74 Years | 14 (12.6%) | 68 (35.4%) |
| 75 Years and over | 91 (75.8%) | 33 (33.7%) |
Disability Class by Sex by Age in Petersburg
Disability Class: Hearing Difficulty
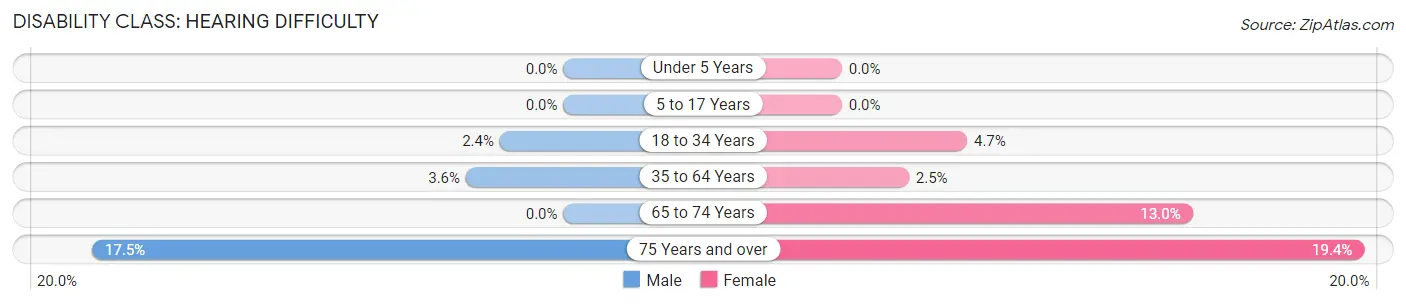
| Age Bracket | Male | Female |
| Under 5 Years | 0 (0.0%) | 0 (0.0%) |
| 5 to 17 Years | 0 (0.0%) | 0 (0.0%) |
| 18 to 34 Years | 5 (2.4%) | 8 (4.6%) |
| 35 to 64 Years | 13 (3.6%) | 10 (2.5%) |
| 65 to 74 Years | 0 (0.0%) | 25 (13.0%) |
| 75 Years and over | 21 (17.5%) | 19 (19.4%) |
Disability Class: Vision Difficulty
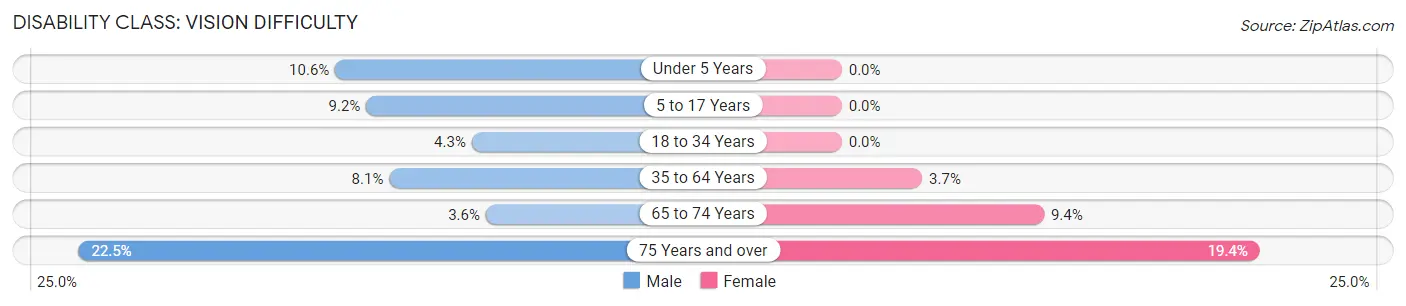
| Age Bracket | Male | Female |
| Under 5 Years | 9 (10.6%) | 0 (0.0%) |
| 5 to 17 Years | 13 (9.1%) | 0 (0.0%) |
| 18 to 34 Years | 9 (4.3%) | 0 (0.0%) |
| 35 to 64 Years | 29 (8.1%) | 15 (3.7%) |
| 65 to 74 Years | 4 (3.6%) | 18 (9.4%) |
| 75 Years and over | 27 (22.5%) | 19 (19.4%) |
Disability Class: Cognitive Difficulty
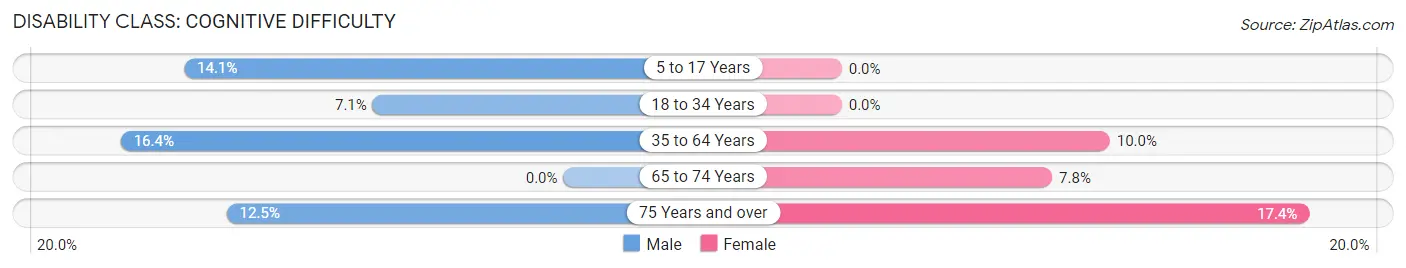
| Age Bracket | Male | Female |
| 5 to 17 Years | 20 (14.1%) | 0 (0.0%) |
| 18 to 34 Years | 15 (7.1%) | 0 (0.0%) |
| 35 to 64 Years | 59 (16.4%) | 40 (10.0%) |
| 65 to 74 Years | 0 (0.0%) | 15 (7.8%) |
| 75 Years and over | 15 (12.5%) | 17 (17.3%) |
Disability Class: Ambulatory Difficulty
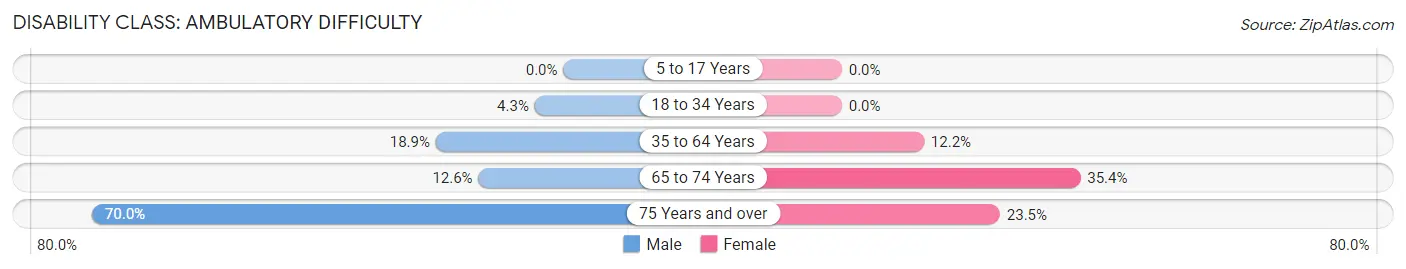
| Age Bracket | Male | Female |
| 5 to 17 Years | 0 (0.0%) | 0 (0.0%) |
| 18 to 34 Years | 9 (4.3%) | 0 (0.0%) |
| 35 to 64 Years | 68 (18.9%) | 49 (12.2%) |
| 65 to 74 Years | 14 (12.6%) | 68 (35.4%) |
| 75 Years and over | 84 (70.0%) | 23 (23.5%) |
Disability Class: Self-Care Difficulty
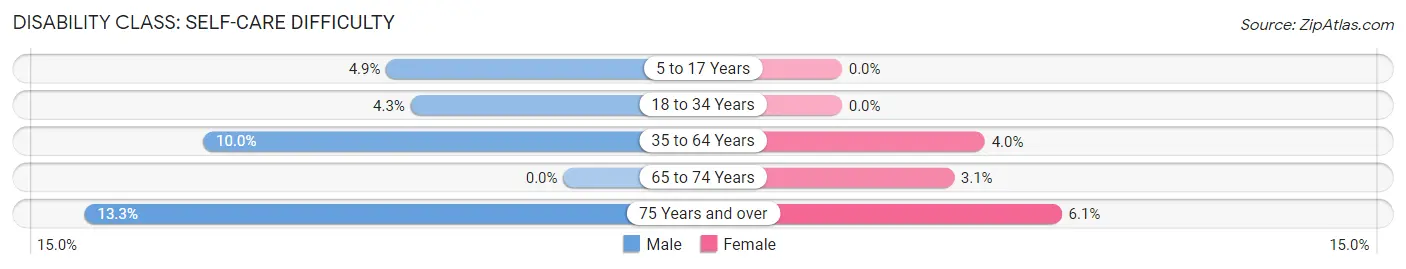
| Age Bracket | Male | Female |
| 5 to 17 Years | 7 (4.9%) | 0 (0.0%) |
| 18 to 34 Years | 9 (4.3%) | 0 (0.0%) |
| 35 to 64 Years | 36 (10.0%) | 16 (4.0%) |
| 65 to 74 Years | 0 (0.0%) | 6 (3.1%) |
| 75 Years and over | 16 (13.3%) | 6 (6.1%) |
Technology Access in Petersburg
Computing Device Access in Petersburg
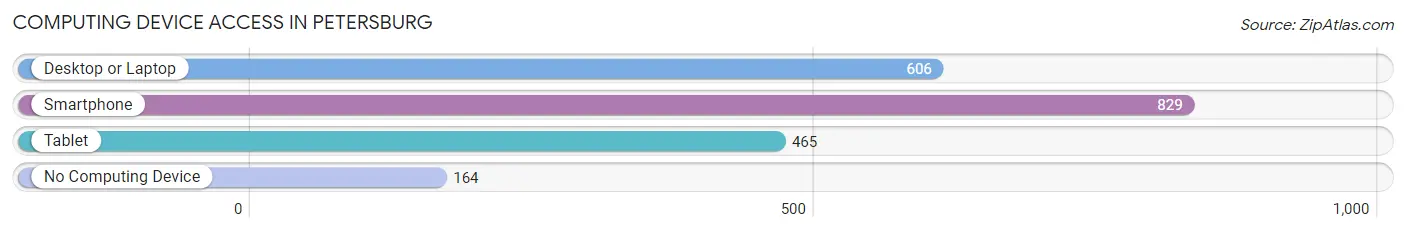
| Device Type | # Households | % Households |
| Desktop or Laptop | 606 | 59.3% |
| Smartphone | 829 | 81.1% |
| Tablet | 465 | 45.5% |
| No Computing Device | 164 | 16.1% |
| Total | 1,022 | 100.0% |
Internet Access in Petersburg
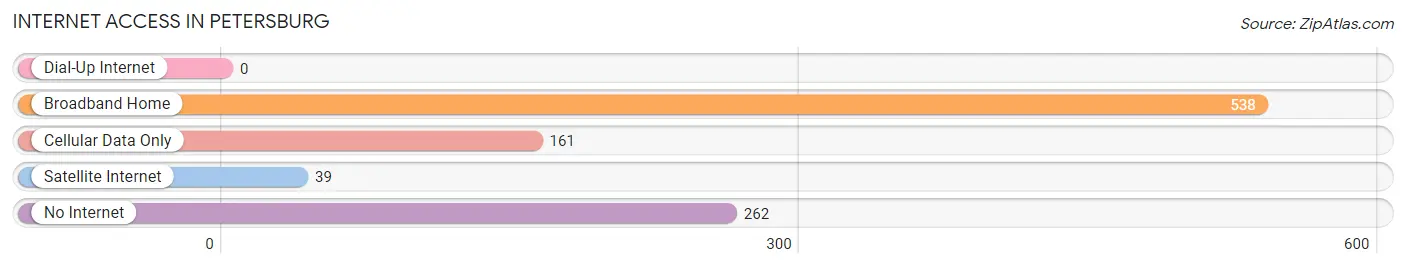
| Internet Type | # Households | % Households |
| Dial-Up Internet | 0 | 0.0% |
| Broadband Home | 538 | 52.6% |
| Cellular Data Only | 161 | 15.8% |
| Satellite Internet | 39 | 3.8% |
| No Internet | 262 | 25.6% |
| Total | 1,022 | 100.0% |
Petersburg Summary
Petersburg, Indiana is a small town located in Pike County, Indiana. It is situated on the banks of the Patoka River, about 30 miles south of Evansville. The town was founded in 1817 and has a population of 2,093 as of the 2010 census.
History
Petersburg was founded in 1817 by a group of settlers from North Carolina. The town was named after Peter Jones, one of the original settlers. The town was incorporated in 1837 and was the county seat of Pike County until 1876 when the county seat was moved to Petersburg.
The town was an important stop on the Underground Railroad, with many of the town's residents helping to hide and transport escaped slaves. During the Civil War, Petersburg was a major supply center for the Union Army.
Geography
Petersburg is located in the southwestern corner of Pike County, Indiana. It is situated on the banks of the Patoka River, about 30 miles south of Evansville. The town is surrounded by rolling hills and farmland. The climate is humid continental, with hot summers and cold winters.
Economy
The economy of Petersburg is largely based on agriculture and manufacturing. The town is home to several small businesses, including a feed mill, a lumber yard, and a furniture store. The town also has a few restaurants and bars.
The town is also home to a number of small manufacturing companies, including a plastics manufacturer, a metal fabricator, and a machine shop. The town is also home to a number of small farms, which produce corn, soybeans, and hay.
Demographics
As of the 2010 census, the population of Petersburg was 2,093. The racial makeup of the town was 97.3% White, 0.7% African American, 0.2% Native American, 0.2% Asian, 0.1% Pacific Islander, 0.7% from other races, and 0.9% from two or more races. Hispanic or Latino of any race were 1.3% of the population.
The median income for a household in the town was $37,917, and the median income for a family was $45,000. The per capita income for the town was $18,945. About 11.2% of families and 14.2% of the population were below the poverty line, including 18.2% of those under age 18 and 8.3% of those age 65 or over.
Conclusion
Petersburg, Indiana is a small town located in Pike County, Indiana. It was founded in 1817 and has a population of 2,093 as of the 2010 census. The town is situated on the banks of the Patoka River and is surrounded by rolling hills and farmland. The economy of Petersburg is largely based on agriculture and manufacturing, and the town is home to several small businesses. The racial makeup of the town is predominantly White, with a small percentage of African American, Native American, Asian, and Pacific Islander residents. The median income for a household in the town is $37,917, and the per capita income is $18,945.
Common Questions
What is Per Capita Income in Petersburg?
Per Capita income in Petersburg is $29,466.
What is the Median Family Income in Petersburg?
Median Family Income in Petersburg is $73,333.
What is the Median Household income in Petersburg?
Median Household Income in Petersburg is $44,891.
What is Income or Wage Gap in Petersburg?
Income or Wage Gap in Petersburg is 46.0%.
Women in Petersburg earn 54.0 cents for every dollar earned by a man.
What is Inequality or Gini Index in Petersburg?
Inequality or Gini Index in Petersburg is 0.44.
What is the Total Population of Petersburg?
Total Population of Petersburg is 2,126.
What is the Total Male Population of Petersburg?
Total Male Population of Petersburg is 1,081.
What is the Total Female Population of Petersburg?
Total Female Population of Petersburg is 1,045.
What is the Ratio of Males per 100 Females in Petersburg?
There are 103.44 Males per 100 Females in Petersburg.
What is the Ratio of Females per 100 Males in Petersburg?
There are 96.67 Females per 100 Males in Petersburg.
What is the Median Population Age in Petersburg?
Median Population Age in Petersburg is 50.0 Years.
What is the Average Family Size in Petersburg
Average Family Size in Petersburg is 2.8 People.
What is the Average Household Size in Petersburg
Average Household Size in Petersburg is 1.9 People.
How Large is the Labor Force in Petersburg?
There are 909 People in the Labor Forcein in Petersburg.
What is the Percentage of People in the Labor Force in Petersburg?
49.9% of People are in the Labor Force in Petersburg.
What is the Unemployment Rate in Petersburg?
Unemployment Rate in Petersburg is 2.1%.