Cities with the Highest Percentage of Population Employed in Arts, Entertainment & Recreation in Indiana
RELATED REPORTS & OPTIONS
Arts, Entertainment & Recreation
Indiana
Compare Cities
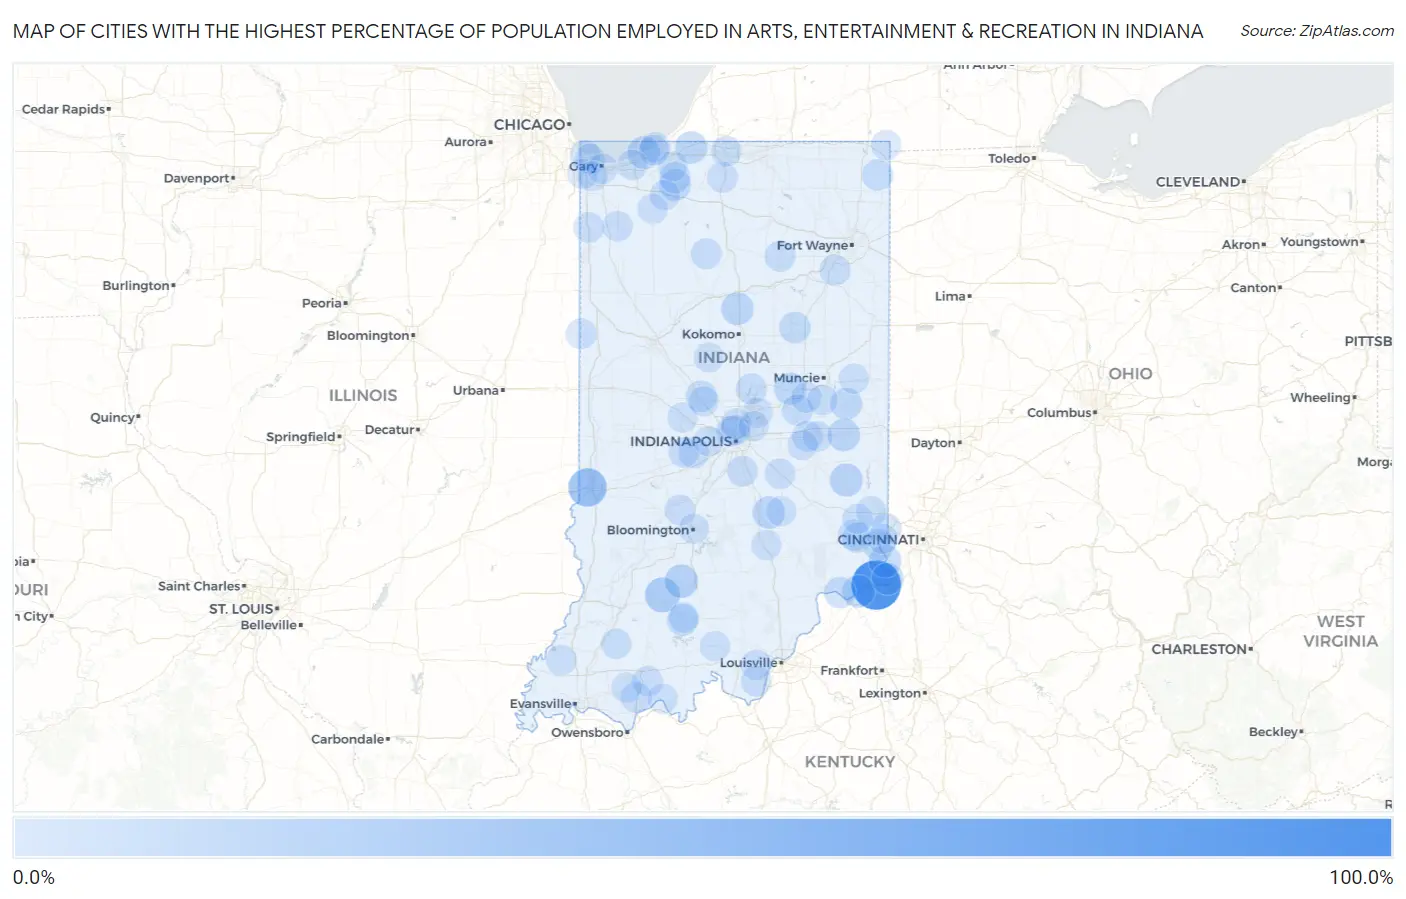
Map of Cities with the Highest Percentage of Population Employed in Arts, Entertainment & Recreation in Indiana
0.0%
100.0%
Cities with the Highest Percentage of Population Employed in Arts, Entertainment & Recreation in Indiana
| City | % Employed | vs State | vs National | |
| 1. | Florence | 85.0% | 1.6%(+83.4)#1 | 2.1%(+82.9)#13 |
| 2. | Toad Hop | 36.1% | 1.6%(+34.4)#2 | 2.1%(+34.0)#90 |
| 3. | Dover Hill | 22.0% | 1.6%(+20.3)#3 | 2.1%(+19.9)#230 |
| 4. | Mace | 20.0% | 1.6%(+18.4)#4 | 2.1%(+17.9)#272 |
| 5. | Walesboro | 17.8% | 1.6%(+16.1)#5 | 2.1%(+15.7)#336 |
| 6. | Philadelphia | 17.4% | 1.6%(+15.8)#6 | 2.1%(+15.3)#345 |
| 7. | Williams | 16.2% | 1.6%(+14.5)#7 | 2.1%(+14.1)#403 |
| 8. | Homer | 16.0% | 1.6%(+14.4)#8 | 2.1%(+14.0)#411 |
| 9. | Laurel | 14.4% | 1.6%(+12.8)#9 | 2.1%(+12.3)#495 |
| 10. | Rising Sun | 12.8% | 1.6%(+11.1)#10 | 2.1%(+10.7)#606 |
| 11. | Beverly Shores | 12.5% | 1.6%(+10.9)#11 | 2.1%(+10.4)#624 |
| 12. | Grissom Afb | 12.5% | 1.6%(+10.8)#12 | 2.1%(+10.4)#633 |
| 13. | Dublin | 12.2% | 1.6%(+10.6)#13 | 2.1%(+10.1)#652 |
| 14. | Vevay | 12.1% | 1.6%(+10.4)#14 | 2.1%(+10.0)#665 |
| 15. | Clifford | 11.8% | 1.6%(+10.2)#15 | 2.1%(+9.72)#688 |
| 16. | Hudson Lake | 11.2% | 1.6%(+9.58)#16 | 2.1%(+9.14)#746 |
| 17. | Patriot | 10.5% | 1.6%(+8.89)#17 | 2.1%(+8.44)#827 |
| 18. | Country Club Heights | 10.2% | 1.6%(+8.59)#18 | 2.1%(+8.14)#873 |
| 19. | Losantville | 9.6% | 1.6%(+7.99)#19 | 2.1%(+7.55)#980 |
| 20. | Kingsford Heights | 9.2% | 1.6%(+7.54)#20 | 2.1%(+7.10)#1,041 |
| 21. | Glezen | 9.1% | 1.6%(+7.45)#21 | 2.1%(+7.01)#1,053 |
| 22. | Marion | 8.7% | 1.6%(+7.06)#22 | 2.1%(+6.61)#1,128 |
| 23. | Benton | 8.7% | 1.6%(+7.02)#23 | 2.1%(+6.58)#1,143 |
| 24. | Ramsey | 8.4% | 1.6%(+6.72)#24 | 2.1%(+6.28)#1,208 |
| 25. | Cassville | 7.9% | 1.6%(+6.28)#25 | 2.1%(+5.84)#1,317 |
| 26. | French Lick | 7.9% | 1.6%(+6.26)#26 | 2.1%(+5.82)#1,322 |
| 27. | Aurora | 7.7% | 1.6%(+6.06)#27 | 2.1%(+5.62)#1,383 |
| 28. | Brooksburg | 7.7% | 1.6%(+6.05)#28 | 2.1%(+5.61)#1,398 |
| 29. | Ulen | 7.5% | 1.6%(+5.91)#29 | 2.1%(+5.46)#1,441 |
| 30. | Milan | 7.2% | 1.6%(+5.51)#30 | 2.1%(+5.07)#1,548 |
| 31. | Reddington | 7.1% | 1.6%(+5.42)#31 | 2.1%(+4.98)#1,576 |
| 32. | Markleville | 7.0% | 1.6%(+5.39)#32 | 2.1%(+4.95)#1,585 |
| 33. | Hamilton | 6.9% | 1.6%(+5.27)#33 | 2.1%(+4.82)#1,624 |
| 34. | Kingsbury | 6.7% | 1.6%(+5.03)#34 | 2.1%(+4.58)#1,695 |
| 35. | Clayton | 6.2% | 1.6%(+4.58)#35 | 2.1%(+4.14)#1,892 |
| 36. | Cicero | 6.0% | 1.6%(+4.38)#36 | 2.1%(+3.94)#1,967 |
| 37. | Knightstown | 6.0% | 1.6%(+4.37)#37 | 2.1%(+3.93)#1,975 |
| 38. | Moores Hill | 5.6% | 1.6%(+3.96)#38 | 2.1%(+3.52)#2,205 |
| 39. | Zanesville | 5.6% | 1.6%(+3.94)#39 | 2.1%(+3.50)#2,221 |
| 40. | Chrisney | 5.4% | 1.6%(+3.81)#40 | 2.1%(+3.36)#2,294 |
| 41. | Snow Lake | 5.4% | 1.6%(+3.78)#41 | 2.1%(+3.33)#2,315 |
| 42. | Kewanna | 5.2% | 1.6%(+3.61)#42 | 2.1%(+3.16)#2,422 |
| 43. | North Manchester | 5.2% | 1.6%(+3.58)#43 | 2.1%(+3.13)#2,444 |
| 44. | Stanford | 5.0% | 1.6%(+3.34)#44 | 2.1%(+2.89)#2,624 |
| 45. | New Whiteland | 4.9% | 1.6%(+3.31)#45 | 2.1%(+2.87)#2,644 |
| 46. | Shelbyville | 4.8% | 1.6%(+3.21)#46 | 2.1%(+2.77)#2,719 |
| 47. | Ambia | 4.8% | 1.6%(+3.18)#47 | 2.1%(+2.74)#2,744 |
| 48. | Lakeville | 4.8% | 1.6%(+3.17)#48 | 2.1%(+2.73)#2,754 |
| 49. | Hidden Valley | 4.8% | 1.6%(+3.11)#49 | 2.1%(+2.67)#2,799 |
| 50. | Santa Claus | 4.7% | 1.6%(+3.10)#50 | 2.1%(+2.65)#2,812 |
| 51. | Elizabeth | 4.6% | 1.6%(+2.98)#51 | 2.1%(+2.53)#2,905 |
| 52. | Whiting | 4.6% | 1.6%(+2.97)#52 | 2.1%(+2.53)#2,907 |
| 53. | Lanesville | 4.6% | 1.6%(+2.94)#53 | 2.1%(+2.49)#2,939 |
| 54. | Stinesville | 4.6% | 1.6%(+2.93)#54 | 2.1%(+2.49)#2,943 |
| 55. | De Motte | 4.5% | 1.6%(+2.88)#55 | 2.1%(+2.43)#3,014 |
| 56. | Haysville | 4.5% | 1.6%(+2.82)#56 | 2.1%(+2.37)#3,091 |
| 57. | Pleasant View | 4.4% | 1.6%(+2.76)#57 | 2.1%(+2.32)#3,148 |
| 58. | Schneider | 4.4% | 1.6%(+2.76)#58 | 2.1%(+2.31)#3,157 |
| 59. | Wynnedale | 4.3% | 1.6%(+2.71)#59 | 2.1%(+2.27)#3,211 |
| 60. | Pottawattamie Park | 4.3% | 1.6%(+2.68)#60 | 2.1%(+2.24)#3,238 |
| 61. | Middletown | 4.3% | 1.6%(+2.64)#61 | 2.1%(+2.20)#3,293 |
| 62. | Springport | 4.2% | 1.6%(+2.59)#62 | 2.1%(+2.14)#3,351 |
| 63. | Amo | 4.2% | 1.6%(+2.53)#63 | 2.1%(+2.08)#3,418 |
| 64. | Meridian Hills | 4.1% | 1.6%(+2.45)#64 | 2.1%(+2.01)#3,534 |
| 65. | Notre Dame | 3.8% | 1.6%(+2.14)#65 | 2.1%(+1.70)#3,923 |
| 66. | Michigan City | 3.7% | 1.6%(+2.07)#66 | 2.1%(+1.62)#4,041 |
| 67. | Hanna | 3.7% | 1.6%(+2.04)#67 | 2.1%(+1.60)#4,097 |
| 68. | St Leon | 3.7% | 1.6%(+2.04)#68 | 2.1%(+1.60)#4,104 |
| 69. | Chesterton | 3.7% | 1.6%(+2.02)#69 | 2.1%(+1.58)#4,135 |
| 70. | Rocky Ripple | 3.6% | 1.6%(+1.95)#70 | 2.1%(+1.51)#4,222 |
| 71. | Winslow | 3.6% | 1.6%(+1.94)#71 | 2.1%(+1.50)#4,240 |
| 72. | Troy | 3.5% | 1.6%(+1.88)#72 | 2.1%(+1.44)#4,362 |
| 73. | Bloomington | 3.5% | 1.6%(+1.87)#73 | 2.1%(+1.43)#4,366 |
| 74. | Dunreith | 3.4% | 1.6%(+1.77)#74 | 2.1%(+1.33)#4,574 |
| 75. | Owensville | 3.4% | 1.6%(+1.74)#75 | 2.1%(+1.29)#4,634 |
| 76. | Carthage | 3.3% | 1.6%(+1.69)#76 | 2.1%(+1.25)#4,720 |
| 77. | East Chicago | 3.3% | 1.6%(+1.67)#77 | 2.1%(+1.23)#4,771 |
| 78. | Marengo | 3.3% | 1.6%(+1.64)#78 | 2.1%(+1.20)#4,823 |
| 79. | La Crosse | 3.3% | 1.6%(+1.63)#79 | 2.1%(+1.18)#4,852 |
| 80. | Sunman | 3.2% | 1.6%(+1.57)#80 | 2.1%(+1.13)#4,945 |
| 81. | Farmland | 3.2% | 1.6%(+1.56)#81 | 2.1%(+1.11)#4,973 |
| 82. | Palestine | 3.2% | 1.6%(+1.54)#82 | 2.1%(+1.10)#5,006 |
| 83. | Fishers | 3.2% | 1.6%(+1.53)#83 | 2.1%(+1.09)#5,014 |
| 84. | Gilmer Park | 3.1% | 1.6%(+1.50)#84 | 2.1%(+1.06)#5,081 |
| 85. | Avon | 3.1% | 1.6%(+1.50)#85 | 2.1%(+1.06)#5,089 |
| 86. | Munster | 3.1% | 1.6%(+1.44)#86 | 2.1%(+0.995)#5,230 |
| 87. | Jamestown | 3.1% | 1.6%(+1.43)#87 | 2.1%(+0.984)#5,257 |
| 88. | Jonesville | 3.1% | 1.6%(+1.42)#88 | 2.1%(+0.979)#5,271 |
| 89. | Clear Lake | 3.0% | 1.6%(+1.41)#89 | 2.1%(+0.966)#5,300 |
| 90. | Lebanon | 3.0% | 1.6%(+1.40)#90 | 2.1%(+0.954)#5,320 |
| 91. | Tennyson | 3.0% | 1.6%(+1.35)#91 | 2.1%(+0.903)#5,428 |
| 92. | Gary | 3.0% | 1.6%(+1.34)#92 | 2.1%(+0.899)#5,435 |
| 93. | Griffith | 3.0% | 1.6%(+1.31)#93 | 2.1%(+0.870)#5,502 |
| 94. | Hope | 2.9% | 1.6%(+1.29)#94 | 2.1%(+0.845)#5,562 |
| 95. | West Baden Springs | 2.9% | 1.6%(+1.29)#95 | 2.1%(+0.844)#5,565 |
| 96. | Lawrenceburg | 2.9% | 1.6%(+1.26)#96 | 2.1%(+0.820)#5,621 |
| 97. | Ardmore | 2.9% | 1.6%(+1.22)#97 | 2.1%(+0.781)#5,724 |
| 98. | La Porte | 2.8% | 1.6%(+1.21)#98 | 2.1%(+0.765)#5,782 |
| 99. | Michigantown | 2.8% | 1.6%(+1.19)#99 | 2.1%(+0.751)#5,811 |
| 100. | Lawrence | 2.8% | 1.6%(+1.19)#100 | 2.1%(+0.751)#5,813 |
Common Questions
What are the Top 10 Cities with the Highest Percentage of Population Employed in Arts, Entertainment & Recreation in Indiana?
Top 10 Cities with the Highest Percentage of Population Employed in Arts, Entertainment & Recreation in Indiana are:
#1
85.0%
#2
36.1%
#3
22.0%
#4
16.2%
#5
14.4%
#6
12.8%
#7
12.5%
#8
12.5%
#9
12.2%
#10
12.1%
What city has the Highest Percentage of Population Employed in Arts, Entertainment & Recreation in Indiana?
Florence has the Highest Percentage of Population Employed in Arts, Entertainment & Recreation in Indiana with 85.0%.
What is the Percentage of Population Employed in Arts, Entertainment & Recreation in the State of Indiana?
Percentage of Population Employed in Arts, Entertainment & Recreation in Indiana is 1.6%.
What is the Percentage of Population Employed in Arts, Entertainment & Recreation in the United States?
Percentage of Population Employed in Arts, Entertainment & Recreation in the United States is 2.1%.