Rome City, IN Map & Demographics
Rome City Map
Rome City Overview
$40,565
PER CAPITA INCOME
$73,787
AVG FAMILY INCOME
$67,639
AVG HOUSEHOLD INCOME
46.5%
WAGE / INCOME GAP [ % ]
53.5¢/ $1
WAGE / INCOME GAP [ $ ]
0.48
INEQUALITY / GINI INDEX
1,341
TOTAL POPULATION
701
MALE POPULATION
640
FEMALE POPULATION
109.53
MALES / 100 FEMALES
91.30
FEMALES / 100 MALES
52.0
MEDIAN AGE
2.9
AVG FAMILY SIZE
2.4
AVG HOUSEHOLD SIZE
655
LABOR FORCE [ PEOPLE ]
55.7%
PERCENT IN LABOR FORCE
4.4%
UNEMPLOYMENT RATE
Rome City Zip Codes
Rome City Area Codes
Income in Rome City
Income Overview in Rome City
Per Capita Income in Rome City is $40,565, while median incomes of families and households are $73,787 and $67,639 respectively.
| Characteristic | Number | Measure |
| Per Capita Income | 1,341 | $40,565 |
| Median Family Income | 391 | $73,787 |
| Mean Family Income | 391 | $101,012 |
| Median Household Income | 556 | $67,639 |
| Mean Household Income | 556 | $93,371 |
| Income Deficit | 391 | $0 |
| Wage / Income Gap (%) | 1,341 | 46.49% |
| Wage / Income Gap ($) | 1,341 | 53.51¢ per $1 |
| Gini / Inequality Index | 1,341 | 0.48 |
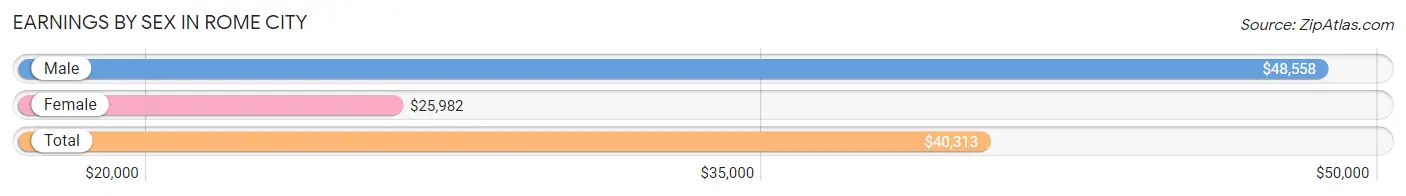
Earnings by Sex in Rome City
Average Earnings in Rome City are $40,313, $48,558 for men and $25,982 for women, a difference of 46.5%.
| Sex | Number | Average Earnings |
| Male | 411 (58.9%) | $48,558 |
| Female | 287 (41.1%) | $25,982 |
| Total | 698 (100.0%) | $40,313 |
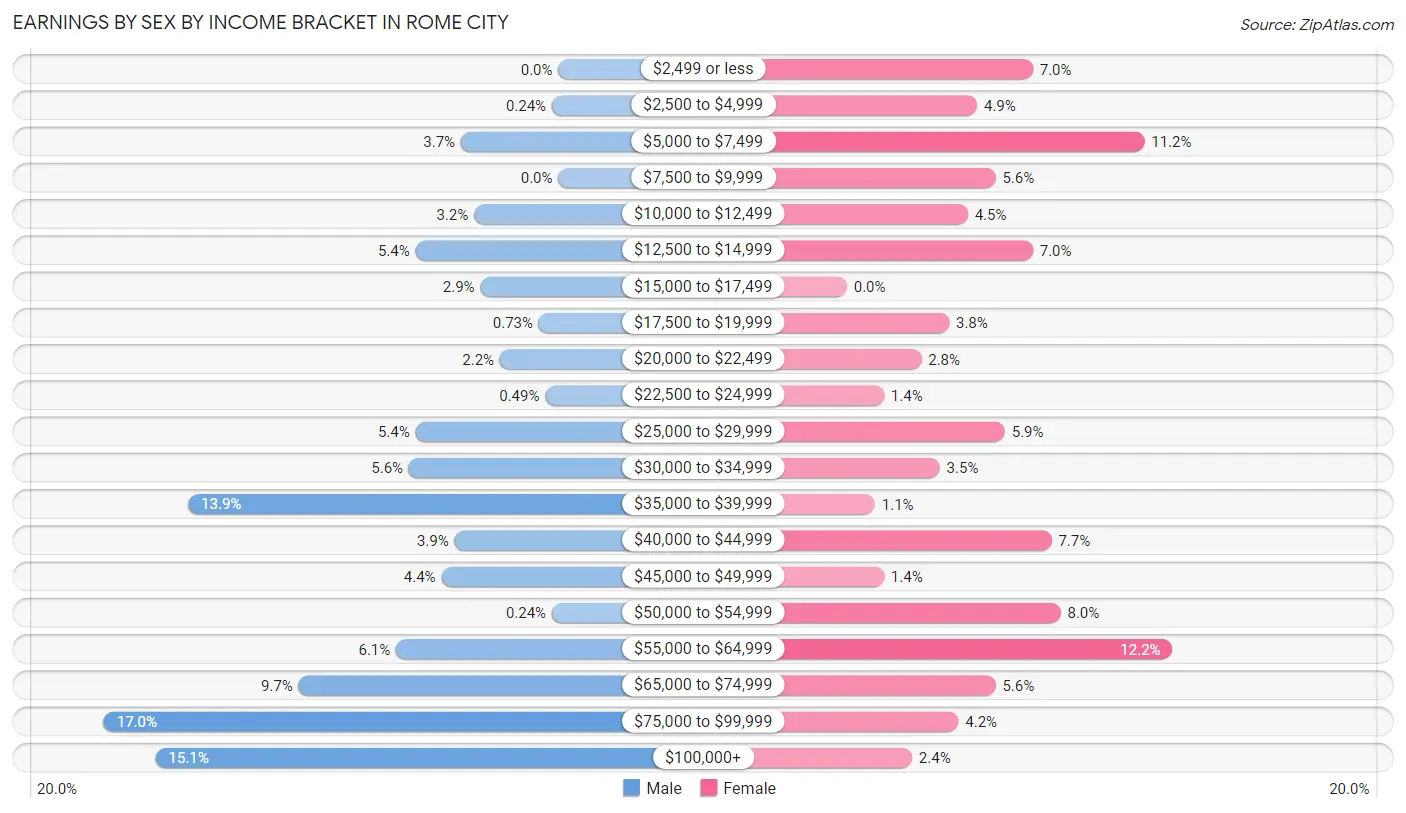
Earnings by Sex by Income Bracket in Rome City
The most common earnings brackets in Rome City are $75,000 to $99,999 for men (70 | 17.0%) and $55,000 to $64,999 for women (35 | 12.2%).
| Income | Male | Female |
| $2,499 or less | 0 (0.0%) | 20 (7.0%) |
| $2,500 to $4,999 | 1 (0.2%) | 14 (4.9%) |
| $5,000 to $7,499 | 15 (3.6%) | 32 (11.2%) |
| $7,500 to $9,999 | 0 (0.0%) | 16 (5.6%) |
| $10,000 to $12,499 | 13 (3.2%) | 13 (4.5%) |
| $12,500 to $14,999 | 22 (5.3%) | 20 (7.0%) |
| $15,000 to $17,499 | 12 (2.9%) | 0 (0.0%) |
| $17,500 to $19,999 | 3 (0.7%) | 11 (3.8%) |
| $20,000 to $22,499 | 9 (2.2%) | 8 (2.8%) |
| $22,500 to $24,999 | 2 (0.5%) | 4 (1.4%) |
| $25,000 to $29,999 | 22 (5.3%) | 17 (5.9%) |
| $30,000 to $34,999 | 23 (5.6%) | 10 (3.5%) |
| $35,000 to $39,999 | 57 (13.9%) | 3 (1.1%) |
| $40,000 to $44,999 | 16 (3.9%) | 22 (7.7%) |
| $45,000 to $49,999 | 18 (4.4%) | 4 (1.4%) |
| $50,000 to $54,999 | 1 (0.2%) | 23 (8.0%) |
| $55,000 to $64,999 | 25 (6.1%) | 35 (12.2%) |
| $65,000 to $74,999 | 40 (9.7%) | 16 (5.6%) |
| $75,000 to $99,999 | 70 (17.0%) | 12 (4.2%) |
| $100,000+ | 62 (15.1%) | 7 (2.4%) |
| Total | 411 (100.0%) | 287 (100.0%) |
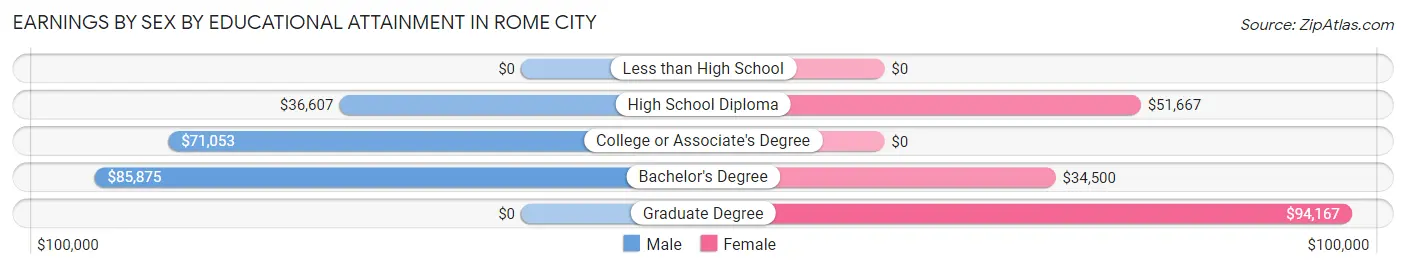
Earnings by Sex by Educational Attainment in Rome City
Average earnings in Rome City are $69,861 for men and $32,000 for women, a difference of 54.2%. Men with an educational attainment of bachelor's degree enjoy the highest average annual earnings of $85,875, while those with high school diploma education earn the least with $36,607. Women with an educational attainment of graduate degree earn the most with the average annual earnings of $94,167, while those with bachelor's degree education have the smallest earnings of $34,500.
| Educational Attainment | Male Income | Female Income |
| Less than High School | - | - |
| High School Diploma | $36,607 | $51,667 |
| College or Associate's Degree | $71,053 | $0 |
| Bachelor's Degree | $85,875 | $34,500 |
| Graduate Degree | - | - |
| Total | $69,861 | $32,000 |
Family Income in Rome City
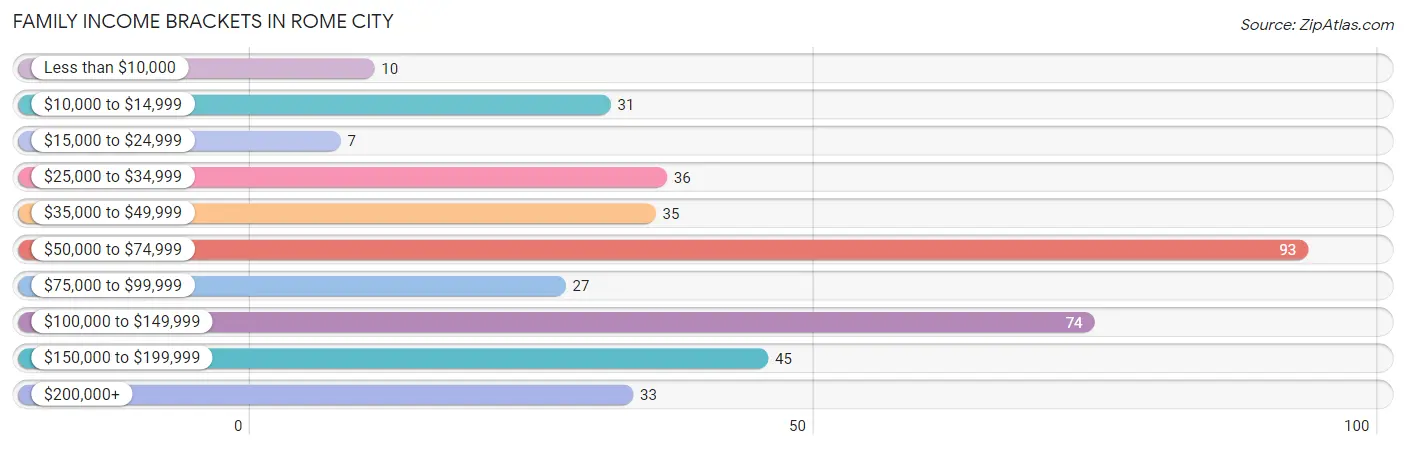
Family Income Brackets in Rome City
According to the Rome City family income data, there are 93 families falling into the $50,000 to $74,999 income range, which is the most common income bracket and makes up 23.8% of all families. Conversely, the $15,000 to $24,999 income bracket is the least frequent group with only 7 families (1.8%) belonging to this category.
| Income Bracket | # Families | % Families |
| Less than $10,000 | 10 | 2.6% |
| $10,000 to $14,999 | 31 | 7.9% |
| $15,000 to $24,999 | 7 | 1.8% |
| $25,000 to $34,999 | 36 | 9.2% |
| $35,000 to $49,999 | 35 | 9.0% |
| $50,000 to $74,999 | 93 | 23.8% |
| $75,000 to $99,999 | 27 | 6.9% |
| $100,000 to $149,999 | 74 | 18.9% |
| $150,000 to $199,999 | 45 | 11.5% |
| $200,000+ | 33 | 8.4% |
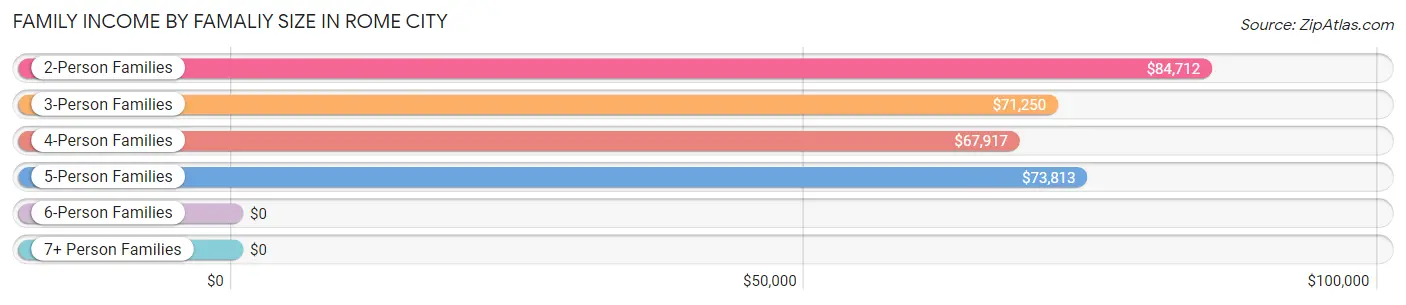
Family Income by Famaliy Size in Rome City
2-person families (247 | 63.2%) account for the highest median family income in Rome City with $84,712 per family, while 2-person families (247 | 63.2%) have the highest median income of $42,356 per family member.
| Income Bracket | # Families | Median Income |
| 2-Person Families | 247 (63.2%) | $84,712 |
| 3-Person Families | 83 (21.2%) | $71,250 |
| 4-Person Families | 18 (4.6%) | $67,917 |
| 5-Person Families | 43 (11.0%) | $73,813 |
| 6-Person Families | 0 (0.0%) | $0 |
| 7+ Person Families | 0 (0.0%) | $0 |
| Total | 391 (100.0%) | $73,787 |
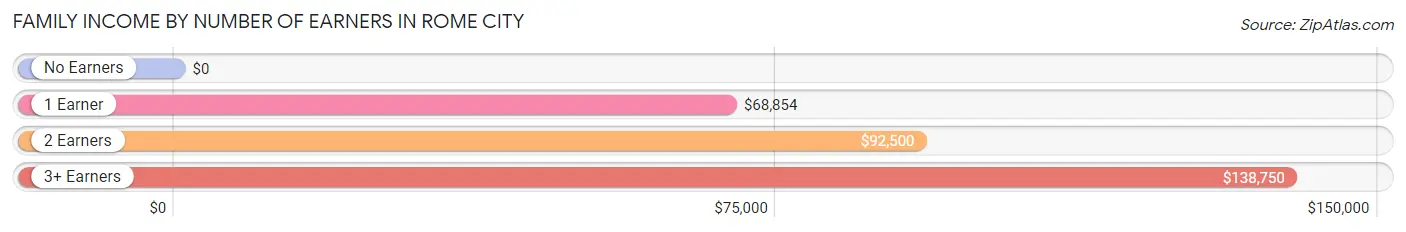
Family Income by Number of Earners in Rome City
| Number of Earners | # Families | Median Income |
| No Earners | 86 (22.0%) | $0 |
| 1 Earner | 131 (33.5%) | $68,854 |
| 2 Earners | 138 (35.3%) | $92,500 |
| 3+ Earners | 36 (9.2%) | $138,750 |
| Total | 391 (100.0%) | $73,787 |
Household Income in Rome City
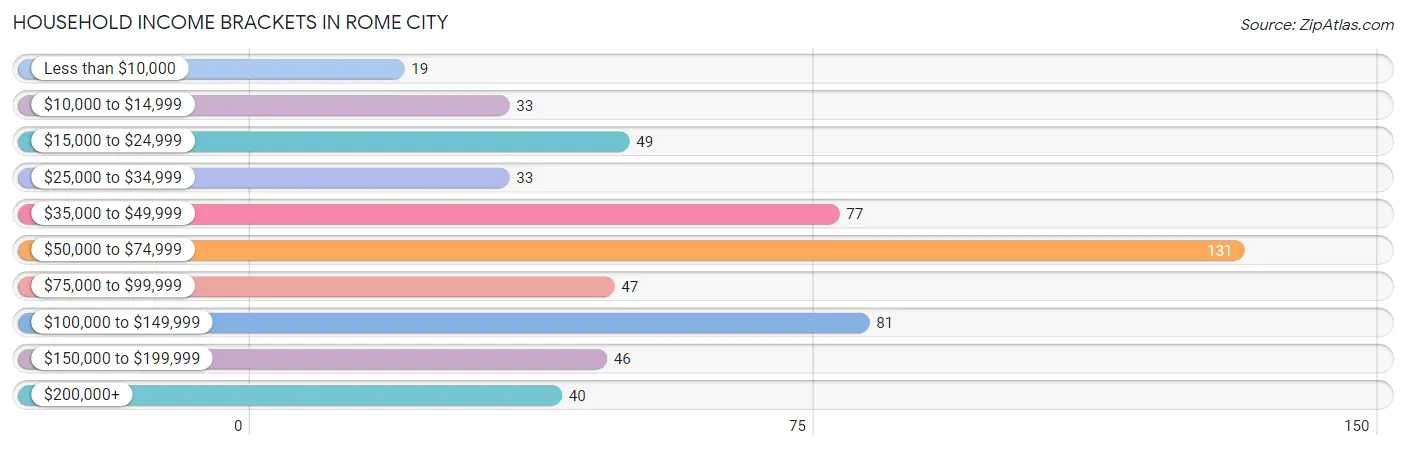
Household Income Brackets in Rome City
With 131 households falling in the category, the $50,000 to $74,999 income range is the most frequent in Rome City, accounting for 23.6% of all households. In contrast, only 19 households (3.4%) fall into the less than $10,000 income bracket, making it the least populous group.
| Income Bracket | # Households | % Households |
| Less than $10,000 | 19 | 3.4% |
| $10,000 to $14,999 | 33 | 5.9% |
| $15,000 to $24,999 | 49 | 8.8% |
| $25,000 to $34,999 | 33 | 5.9% |
| $35,000 to $49,999 | 77 | 13.8% |
| $50,000 to $74,999 | 131 | 23.6% |
| $75,000 to $99,999 | 47 | 8.5% |
| $100,000 to $149,999 | 81 | 14.6% |
| $150,000 to $199,999 | 46 | 8.3% |
| $200,000+ | 40 | 7.2% |
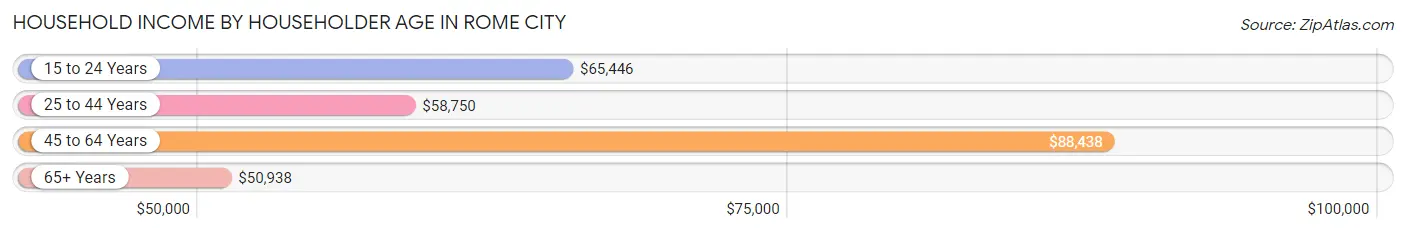
Household Income by Householder Age in Rome City
The median household income in Rome City is $67,639, with the highest median household income of $88,438 found in the 45 to 64 years age bracket for the primary householder. A total of 211 households (38.0%) fall into this category. Meanwhile, the 65+ years age bracket for the primary householder has the lowest median household income of $50,938, with 233 households (41.9%) in this group.
| Income Bracket | # Households | Median Income |
| 15 to 24 Years | 23 (4.1%) | $65,446 |
| 25 to 44 Years | 89 (16.0%) | $58,750 |
| 45 to 64 Years | 211 (38.0%) | $88,438 |
| 65+ Years | 233 (41.9%) | $50,938 |
| Total | 556 (100.0%) | $67,639 |
Poverty in Rome City
Income Below Poverty by Sex and Age in Rome City
With 5.7% poverty level for males and 15.0% for females among the residents of Rome City, 65 to 74 year old males and 16 and 17 year old females are the most vulnerable to poverty, with 22 males (17.7%) and 5 females (55.6%) in their respective age groups living below the poverty level.
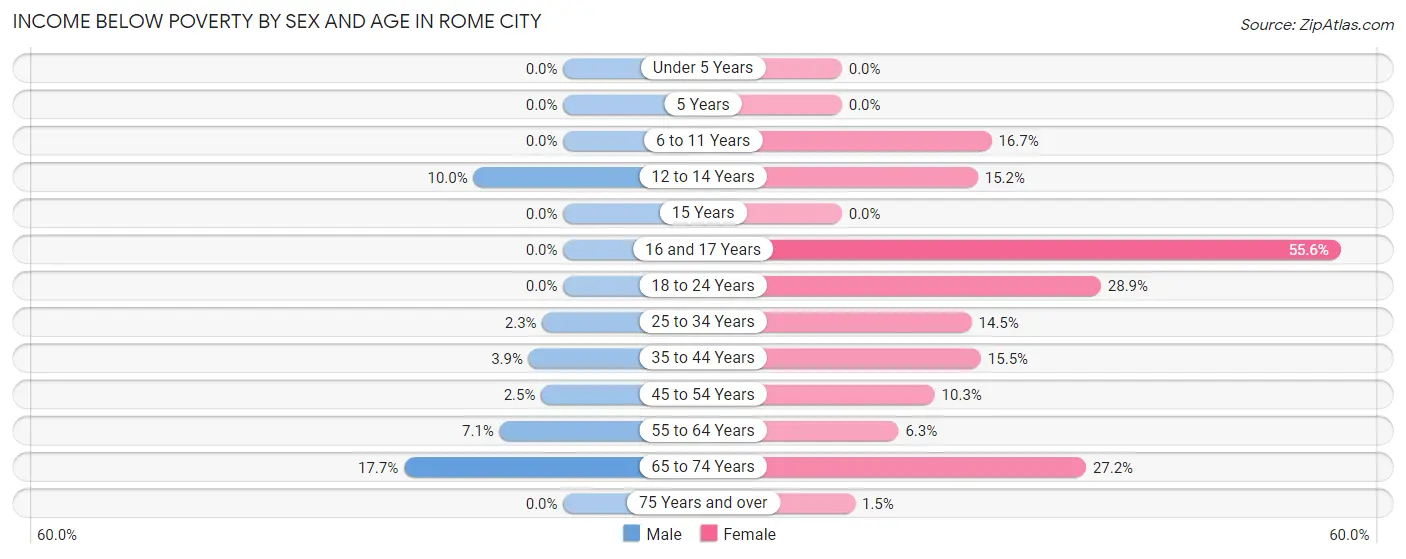
| Age Bracket | Male | Female |
| Under 5 Years | 0 (0.0%) | 0 (0.0%) |
| 5 Years | 0 (0.0%) | 0 (0.0%) |
| 6 to 11 Years | 0 (0.0%) | 3 (16.7%) |
| 12 to 14 Years | 3 (10.0%) | 5 (15.1%) |
| 15 Years | 0 (0.0%) | 0 (0.0%) |
| 16 and 17 Years | 0 (0.0%) | 5 (55.6%) |
| 18 to 24 Years | 0 (0.0%) | 15 (28.8%) |
| 25 to 34 Years | 1 (2.3%) | 12 (14.5%) |
| 35 to 44 Years | 2 (3.8%) | 11 (15.5%) |
| 45 to 54 Years | 3 (2.5%) | 6 (10.3%) |
| 55 to 64 Years | 9 (7.1%) | 7 (6.3%) |
| 65 to 74 Years | 22 (17.7%) | 31 (27.2%) |
| 75 Years and over | 0 (0.0%) | 1 (1.5%) |
| Total | 40 (5.7%) | 96 (15.0%) |
Income Above Poverty by Sex and Age in Rome City
According to the poverty statistics in Rome City, males aged under 5 years and females aged under 5 years are the age groups that are most secure financially, with 100.0% of males and 100.0% of females in these age groups living above the poverty line.
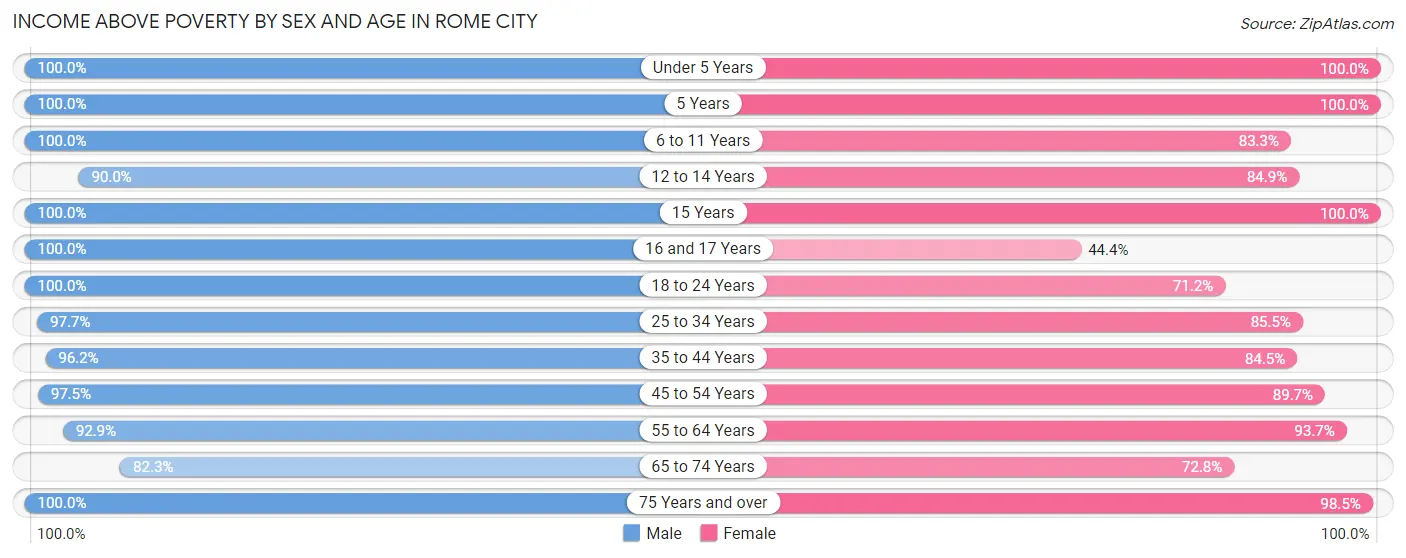
| Age Bracket | Male | Female |
| Under 5 Years | 21 (100.0%) | 18 (100.0%) |
| 5 Years | 13 (100.0%) | 3 (100.0%) |
| 6 to 11 Years | 23 (100.0%) | 15 (83.3%) |
| 12 to 14 Years | 27 (90.0%) | 28 (84.9%) |
| 15 Years | 4 (100.0%) | 2 (100.0%) |
| 16 and 17 Years | 3 (100.0%) | 4 (44.4%) |
| 18 to 24 Years | 103 (100.0%) | 37 (71.2%) |
| 25 to 34 Years | 42 (97.7%) | 71 (85.5%) |
| 35 to 44 Years | 50 (96.2%) | 60 (84.5%) |
| 45 to 54 Years | 119 (97.5%) | 52 (89.7%) |
| 55 to 64 Years | 118 (92.9%) | 104 (93.7%) |
| 65 to 74 Years | 102 (82.3%) | 83 (72.8%) |
| 75 Years and over | 36 (100.0%) | 67 (98.5%) |
| Total | 661 (94.3%) | 544 (85.0%) |
Income Below Poverty Among Married-Couple Families in Rome City
The poverty statistics for married-couple families in Rome City show that 9.7% or 28 of the total 290 families live below the poverty line. Families with no children have the highest poverty rate of 11.9%, comprising of 28 families. On the other hand, families with 1 or 2 children have the lowest poverty rate of 0.0%, which includes 0 families.
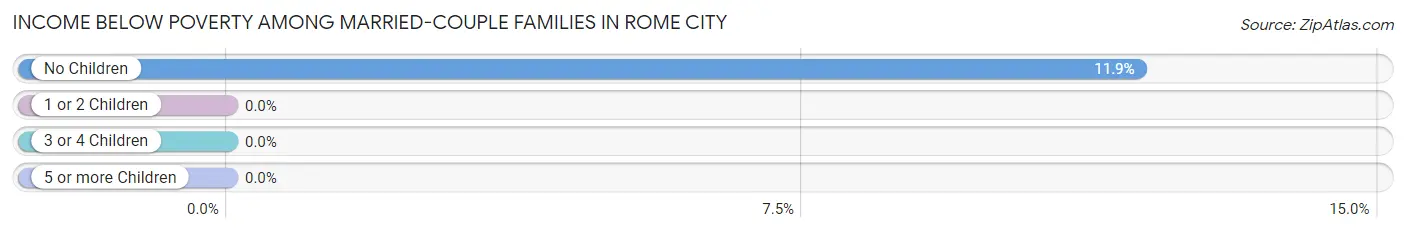
| Children | Above Poverty | Below Poverty |
| No Children | 208 (88.1%) | 28 (11.9%) |
| 1 or 2 Children | 29 (100.0%) | 0 (0.0%) |
| 3 or 4 Children | 25 (100.0%) | 0 (0.0%) |
| 5 or more Children | 0 (0.0%) | 0 (0.0%) |
| Total | 262 (90.3%) | 28 (9.7%) |
Income Below Poverty Among Single-Parent Households in Rome City
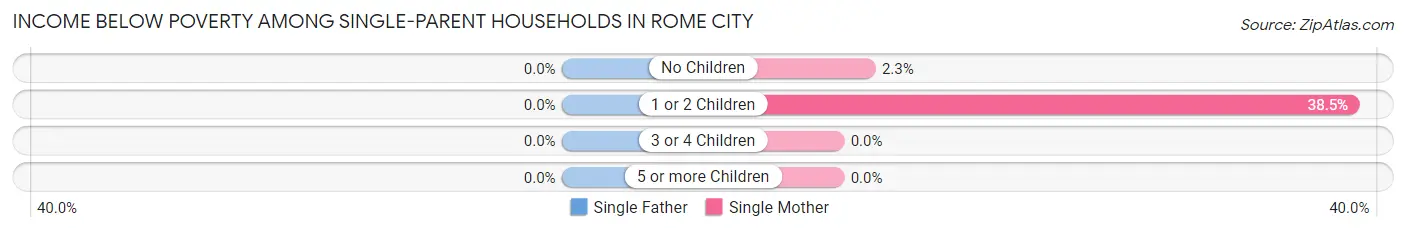
| Children | Single Father | Single Mother |
| No Children | 0 (0.0%) | 1 (2.3%) |
| 1 or 2 Children | 0 (0.0%) | 15 (38.5%) |
| 3 or 4 Children | 0 (0.0%) | 0 (0.0%) |
| 5 or more Children | 0 (0.0%) | 0 (0.0%) |
| Total | 0 (0.0%) | 16 (19.5%) |
Income Below Poverty Among Married-Couple vs Single-Parent Households in Rome City
The poverty data for Rome City shows that 28 of the married-couple family households (9.7%) and 16 of the single-parent households (15.8%) are living below the poverty level. Within the married-couple family households, those with no children have the highest poverty rate, with 28 households (11.9%) falling below the poverty line. Among the single-parent households, those with 1 or 2 children have the highest poverty rate, with 15 household (27.3%) living below poverty.
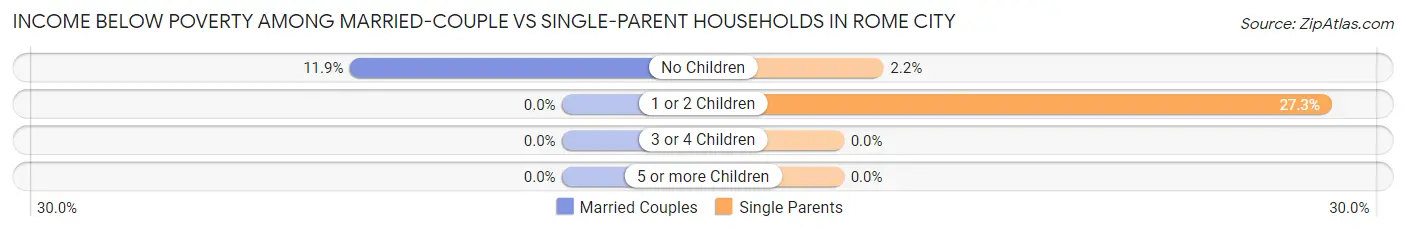
| Children | Married-Couple Families | Single-Parent Households |
| No Children | 28 (11.9%) | 1 (2.2%) |
| 1 or 2 Children | 0 (0.0%) | 15 (27.3%) |
| 3 or 4 Children | 0 (0.0%) | 0 (0.0%) |
| 5 or more Children | 0 (0.0%) | 0 (0.0%) |
| Total | 28 (9.7%) | 16 (15.8%) |
Race in Rome City
The most populous races in Rome City are White / Caucasian (1,314 | 98.0%), Hispanic or Latino (30 | 2.2%), and Two or more Races (16 | 1.2%).
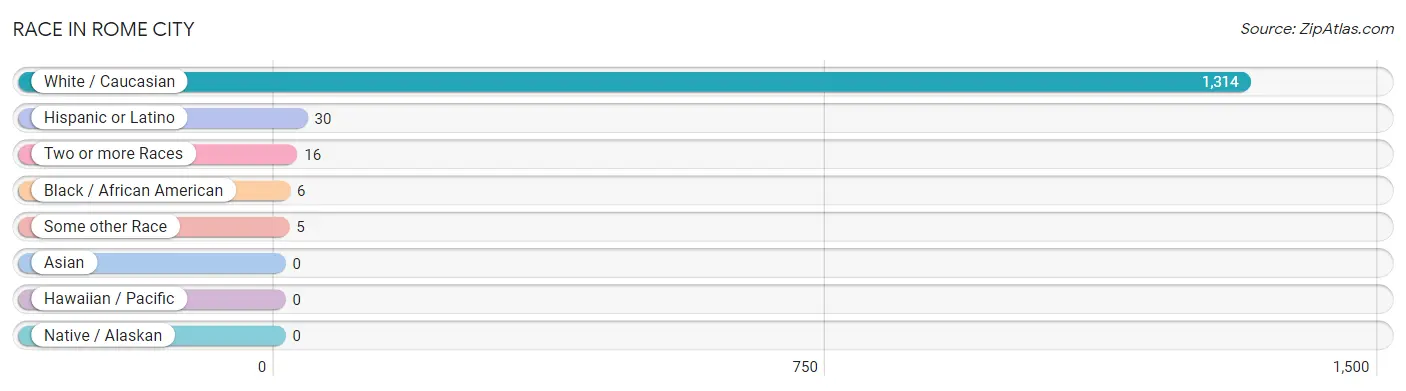
| Race | # Population | % Population |
| Asian | 0 | 0.0% |
| Black / African American | 6 | 0.4% |
| Hawaiian / Pacific | 0 | 0.0% |
| Hispanic or Latino | 30 | 2.2% |
| Native / Alaskan | 0 | 0.0% |
| White / Caucasian | 1,314 | 98.0% |
| Two or more Races | 16 | 1.2% |
| Some other Race | 5 | 0.4% |
| Total | 1,341 | 100.0% |
Ancestry in Rome City
The most populous ancestries reported in Rome City are German (324 | 24.2%), English (281 | 20.9%), European (154 | 11.5%), Irish (99 | 7.4%), and American (73 | 5.4%), together accounting for 69.4% of all Rome City residents.
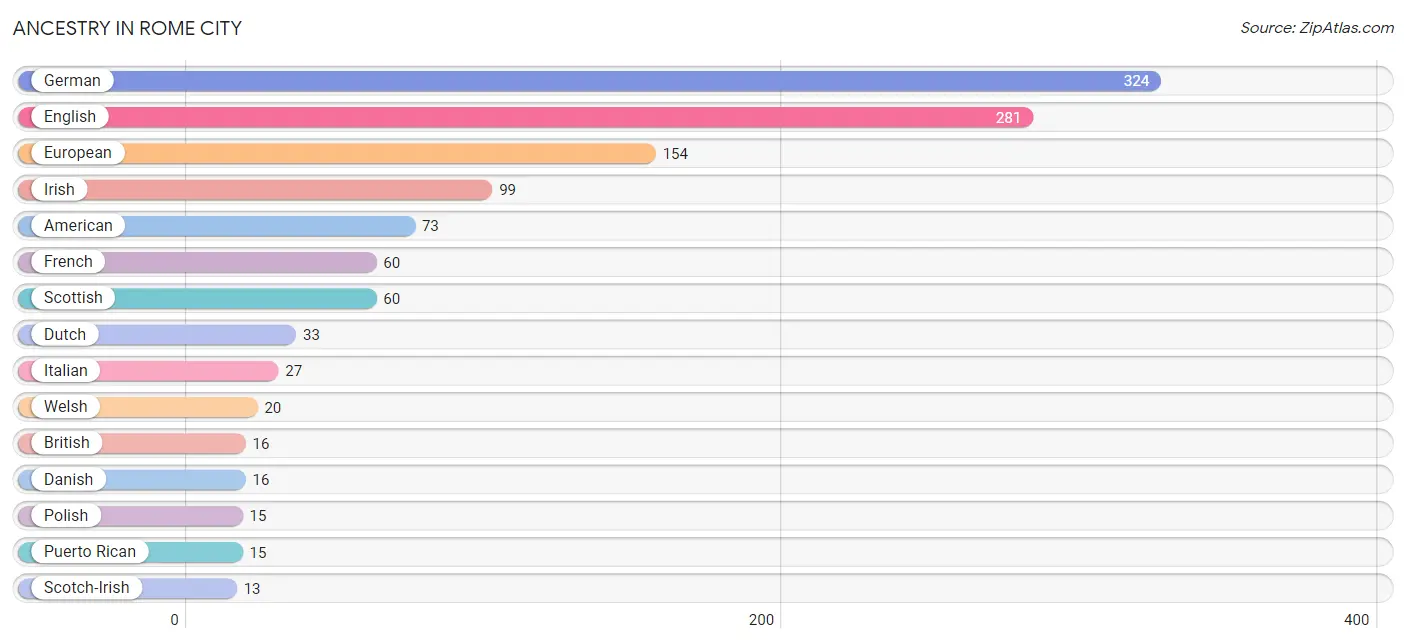
| Ancestry | # Population | % Population |
| American | 73 | 5.4% |
| Belgian | 5 | 0.4% |
| British | 16 | 1.2% |
| Cherokee | 10 | 0.7% |
| Cheyenne | 6 | 0.4% |
| Czech | 3 | 0.2% |
| Czechoslovakian | 4 | 0.3% |
| Danish | 16 | 1.2% |
| Dutch | 33 | 2.5% |
| English | 281 | 20.9% |
| European | 154 | 11.5% |
| French | 60 | 4.5% |
| French Canadian | 5 | 0.4% |
| German | 324 | 24.2% |
| Hungarian | 7 | 0.5% |
| Irish | 99 | 7.4% |
| Italian | 27 | 2.0% |
| Mexican | 11 | 0.8% |
| Norwegian | 2 | 0.2% |
| Polish | 15 | 1.1% |
| Portuguese | 2 | 0.2% |
| Puerto Rican | 15 | 1.1% |
| Romanian | 11 | 0.8% |
| Russian | 2 | 0.2% |
| Scotch-Irish | 13 | 1.0% |
| Scottish | 60 | 4.5% |
| Spaniard | 4 | 0.3% |
| Swiss | 2 | 0.2% |
| Welsh | 20 | 1.5% | View All 29 Rows |
Immigrants in Rome City

| Immigration Origin | # Population | % Population | View All 0 Rows |
Sex and Age in Rome City
Sex and Age in Rome City
The most populous age groups in Rome City are 20 to 24 Years (97 | 13.8%) for men and 65 to 69 Years (86 | 13.4%) for women.
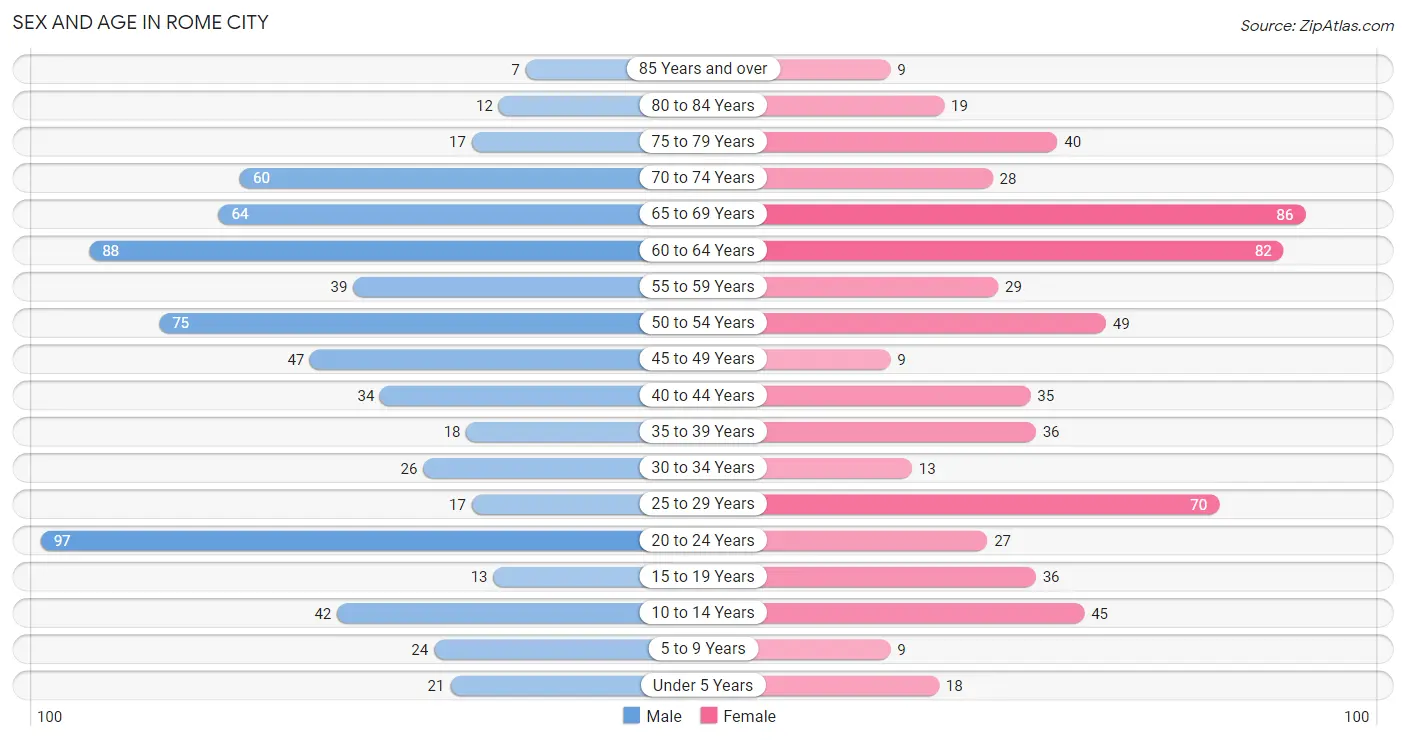
| Age Bracket | Male | Female |
| Under 5 Years | 21 (3.0%) | 18 (2.8%) |
| 5 to 9 Years | 24 (3.4%) | 9 (1.4%) |
| 10 to 14 Years | 42 (6.0%) | 45 (7.0%) |
| 15 to 19 Years | 13 (1.8%) | 36 (5.6%) |
| 20 to 24 Years | 97 (13.8%) | 27 (4.2%) |
| 25 to 29 Years | 17 (2.4%) | 70 (10.9%) |
| 30 to 34 Years | 26 (3.7%) | 13 (2.0%) |
| 35 to 39 Years | 18 (2.6%) | 36 (5.6%) |
| 40 to 44 Years | 34 (4.9%) | 35 (5.5%) |
| 45 to 49 Years | 47 (6.7%) | 9 (1.4%) |
| 50 to 54 Years | 75 (10.7%) | 49 (7.7%) |
| 55 to 59 Years | 39 (5.6%) | 29 (4.5%) |
| 60 to 64 Years | 88 (12.6%) | 82 (12.8%) |
| 65 to 69 Years | 64 (9.1%) | 86 (13.4%) |
| 70 to 74 Years | 60 (8.6%) | 28 (4.4%) |
| 75 to 79 Years | 17 (2.4%) | 40 (6.2%) |
| 80 to 84 Years | 12 (1.7%) | 19 (3.0%) |
| 85 Years and over | 7 (1.0%) | 9 (1.4%) |
| Total | 701 (100.0%) | 640 (100.0%) |
Families and Households in Rome City
Median Family Size in Rome City
The median family size in Rome City is 2.85 persons per family, with single male/father families (19 | 4.9%) accounting for the largest median family size of 5.53 persons per family. On the other hand, married-couple families (290 | 74.2%) represent the smallest median family size with 2.65 persons per family.
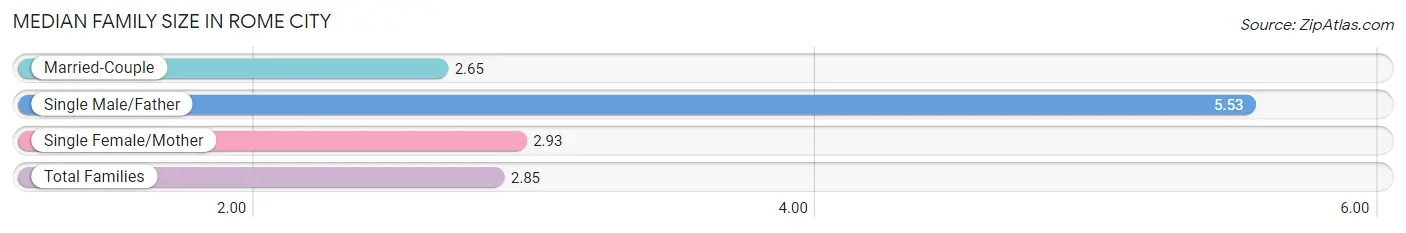
| Family Type | # Families | Family Size |
| Married-Couple | 290 (74.2%) | 2.65 |
| Single Male/Father | 19 (4.9%) | 5.53 |
| Single Female/Mother | 82 (21.0%) | 2.93 |
| Total Families | 391 (100.0%) | 2.85 |
Median Household Size in Rome City
The median household size in Rome City is 2.41 persons per household, with single male/father households (19 | 3.4%) accounting for the largest median household size of 6.89 persons per household. non-family households (165 | 29.7%) represent the smallest median household size with 1.10 persons per household.
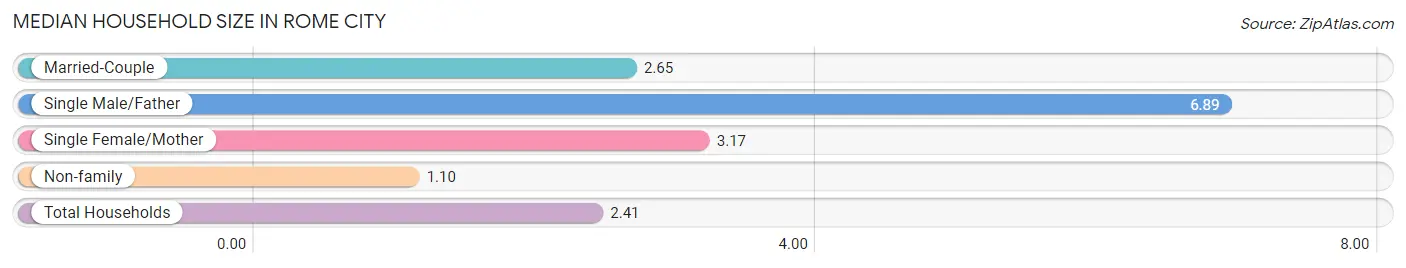
| Household Type | # Households | Household Size |
| Married-Couple | 290 (52.2%) | 2.65 |
| Single Male/Father | 19 (3.4%) | 6.89 |
| Single Female/Mother | 82 (14.7%) | 3.17 |
| Non-family | 165 (29.7%) | 1.10 |
| Total Households | 556 (100.0%) | 2.41 |
Household Size by Marriage Status in Rome City
Out of a total of 556 households in Rome City, 391 (70.3%) are family households, while 165 (29.7%) are nonfamily households. The most numerous type of family households are 2-person households, comprising 239, and the most common type of nonfamily households are 1-person households, comprising 145.
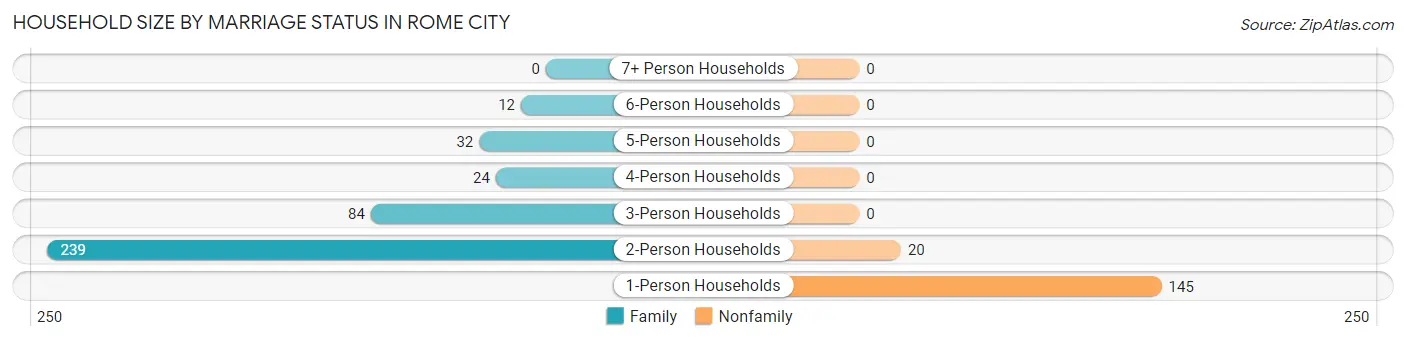
| Household Size | Family Households | Nonfamily Households |
| 1-Person Households | - | 145 (26.1%) |
| 2-Person Households | 239 (43.0%) | 20 (3.6%) |
| 3-Person Households | 84 (15.1%) | 0 (0.0%) |
| 4-Person Households | 24 (4.3%) | 0 (0.0%) |
| 5-Person Households | 32 (5.8%) | 0 (0.0%) |
| 6-Person Households | 12 (2.2%) | 0 (0.0%) |
| 7+ Person Households | 0 (0.0%) | 0 (0.0%) |
| Total | 391 (70.3%) | 165 (29.7%) |
Female Fertility in Rome City
Fertility by Age in Rome City
Average fertility rate in Rome City is 35.0 births per 1,000 women. Women in the age bracket of 20 to 34 years have the highest fertility rate with 73.0 births per 1,000 women. Women in the age bracket of 20 to 34 years acount for 100.0% of all women with births.
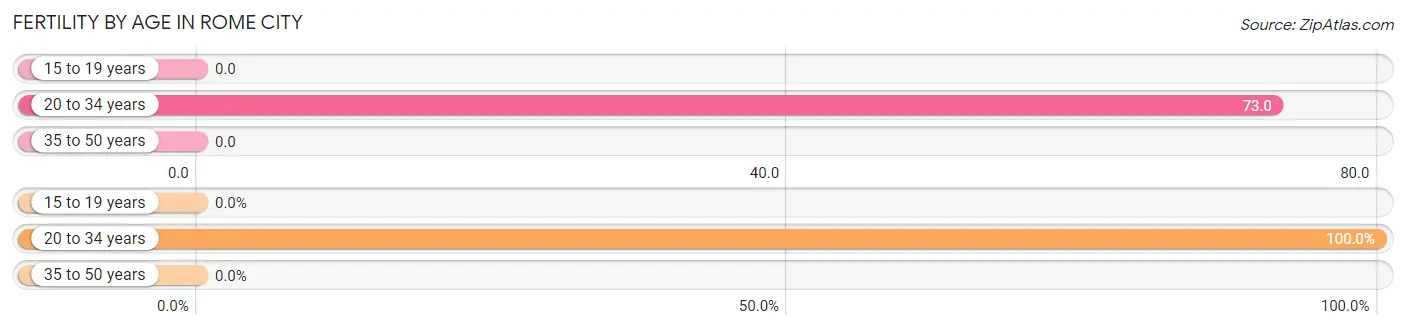
| Age Bracket | Women with Births | Births / 1,000 Women |
| 15 to 19 years | 0 (0.0%) | 0.0 |
| 20 to 34 years | 8 (100.0%) | 73.0 |
| 35 to 50 years | 0 (0.0%) | 0.0 |
| Total | 8 (100.0%) | 35.0 |
Fertility by Age by Marriage Status in Rome City
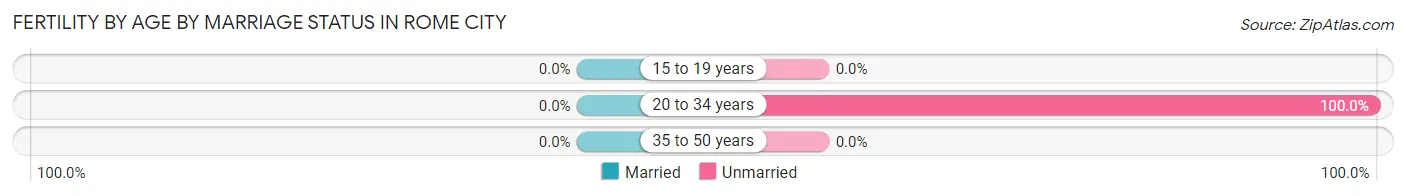
| Age Bracket | Married | Unmarried |
| 15 to 19 years | 0 (0.0%) | 0 (0.0%) |
| 20 to 34 years | 0 (0.0%) | 8 (100.0%) |
| 35 to 50 years | 0 (0.0%) | 0 (0.0%) |
| Total | 0 (0.0%) | 8 (100.0%) |
Fertility by Education in Rome City
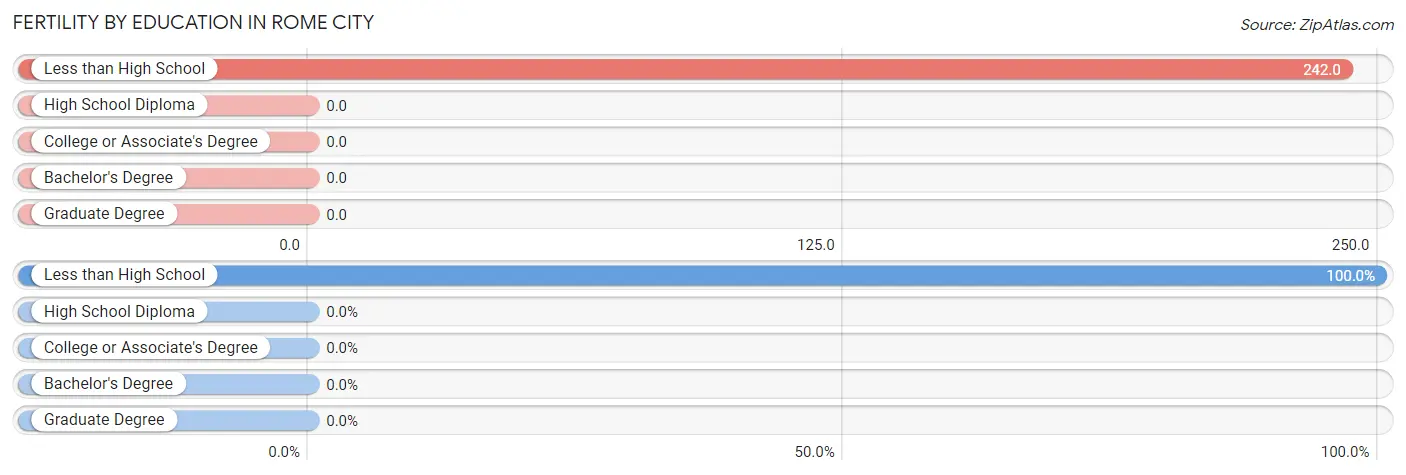
| Educational Attainment | Women with Births | Births / 1,000 Women |
| Less than High School | 8 (100.0%) | 242.0 |
| High School Diploma | 0 (0.0%) | 0.0 |
| College or Associate's Degree | 0 (0.0%) | 0.0 |
| Bachelor's Degree | 0 (0.0%) | 0.0 |
| Graduate Degree | 0 (0.0%) | 0.0 |
| Total | 8 (100.0%) | 35.0 |
Fertility by Education by Marriage Status in Rome City
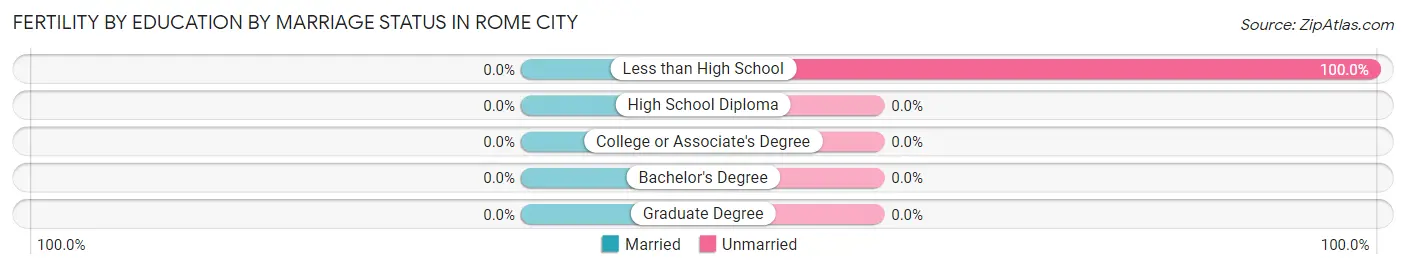
| Educational Attainment | Married | Unmarried |
| Less than High School | 0 (0.0%) | 8 (100.0%) |
| High School Diploma | 0 (0.0%) | 0 (0.0%) |
| College or Associate's Degree | 0 (0.0%) | 0 (0.0%) |
| Bachelor's Degree | 0 (0.0%) | 0 (0.0%) |
| Graduate Degree | 0 (0.0%) | 0 (0.0%) |
| Total | 0 (0.0%) | 8 (100.0%) |
Employment Characteristics in Rome City
Employment by Class of Employer in Rome City
Among the 621 employed individuals in Rome City, private company employees (452 | 72.8%), not-for-profit organizations (42 | 6.8%), and local government employees (34 | 5.5%) make up the most common classes of employment.
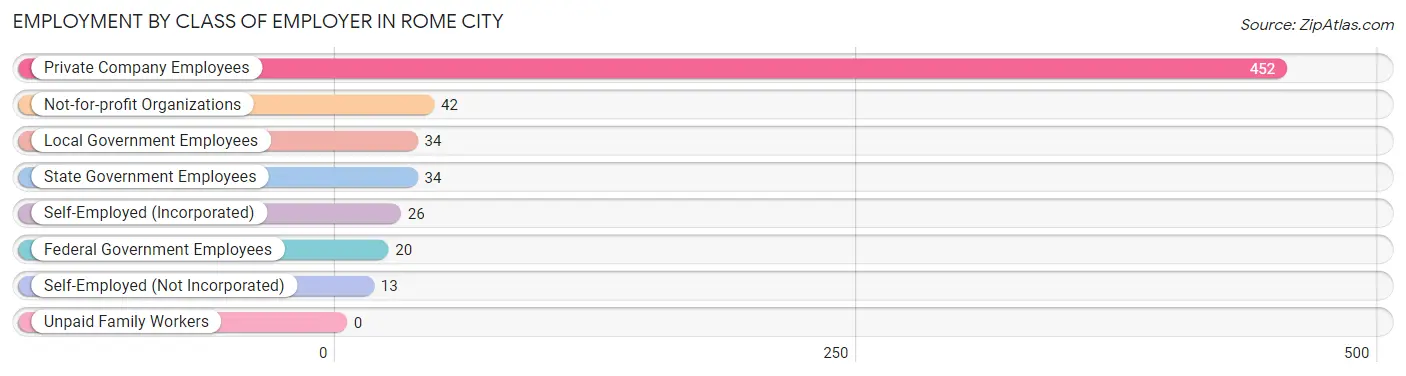
| Employer Class | # Employees | % Employees |
| Private Company Employees | 452 | 72.8% |
| Self-Employed (Incorporated) | 26 | 4.2% |
| Self-Employed (Not Incorporated) | 13 | 2.1% |
| Not-for-profit Organizations | 42 | 6.8% |
| Local Government Employees | 34 | 5.5% |
| State Government Employees | 34 | 5.5% |
| Federal Government Employees | 20 | 3.2% |
| Unpaid Family Workers | 0 | 0.0% |
| Total | 621 | 100.0% |
Employment Status by Age in Rome City
According to the labor force statistics for Rome City, out of the total population over 16 years of age (1,176), 55.7% or 655 individuals are in the labor force, with 4.4% or 29 of them unemployed. The age group with the highest labor force participation rate is 35 to 44 years, with 91.1% or 112 individuals in the labor force. Within the labor force, the 45 to 54 years age range has the highest percentage of unemployed individuals, with 13.5% or 21 of them being unemployed.
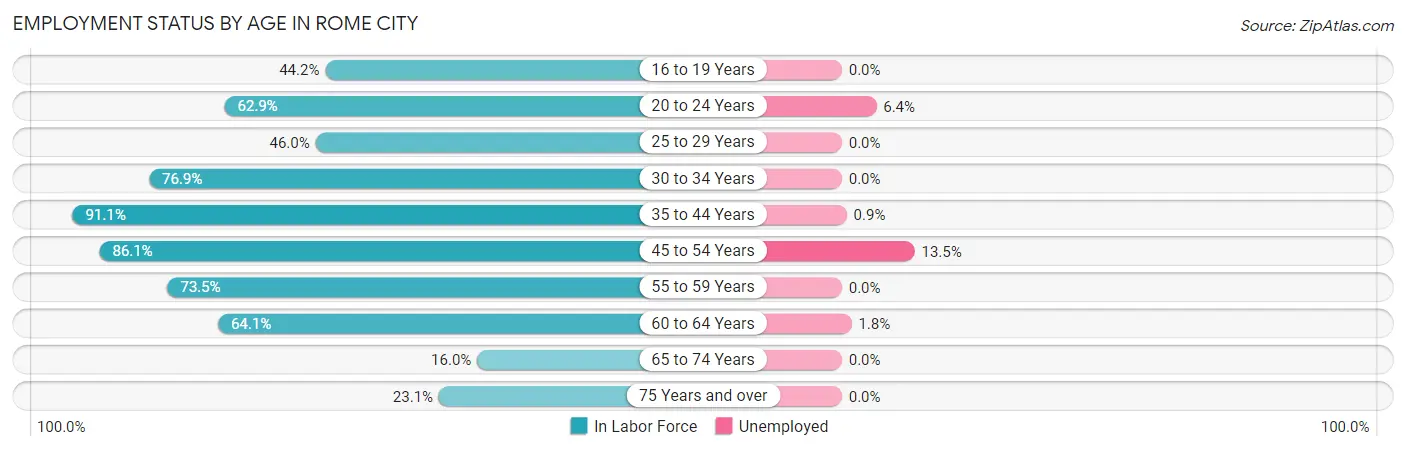
| Age Bracket | In Labor Force | Unemployed |
| 16 to 19 Years | 19 (44.2%) | 0 (0.0%) |
| 20 to 24 Years | 78 (62.9%) | 5 (6.4%) |
| 25 to 29 Years | 40 (46.0%) | 0 (0.0%) |
| 30 to 34 Years | 30 (76.9%) | 0 (0.0%) |
| 35 to 44 Years | 112 (91.1%) | 1 (0.9%) |
| 45 to 54 Years | 155 (86.1%) | 21 (13.5%) |
| 55 to 59 Years | 50 (73.5%) | 0 (0.0%) |
| 60 to 64 Years | 109 (64.1%) | 2 (1.8%) |
| 65 to 74 Years | 38 (16.0%) | 0 (0.0%) |
| 75 Years and over | 24 (23.1%) | 0 (0.0%) |
| Total | 655 (55.7%) | 29 (4.4%) |
Employment Status by Educational Attainment in Rome City
According to labor force statistics for Rome City, 74.4% of individuals (496) out of the total population between 25 and 64 years of age (667) are in the labor force, with 4.8% or 24 of them being unemployed. The group with the highest labor force participation rate are those with the educational attainment of bachelor's degree or higher, with 83.7% or 108 individuals in the labor force. Within the labor force, individuals with less than high school education have the highest percentage of unemployment, with 32.7% or 17 of them being unemployed.
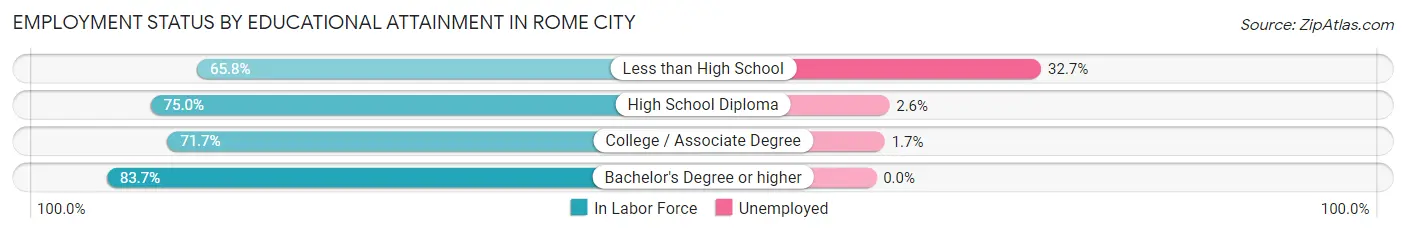
| Educational Attainment | In Labor Force | Unemployed |
| Less than High School | 52 (65.8%) | 26 (32.7%) |
| High School Diploma | 156 (75.0%) | 5 (2.6%) |
| College / Associate Degree | 180 (71.7%) | 4 (1.7%) |
| Bachelor's Degree or higher | 108 (83.7%) | 0 (0.0%) |
| Total | 496 (74.4%) | 32 (4.8%) |
Employment Occupations by Sex in Rome City
Management, Business, Science and Arts Occupations
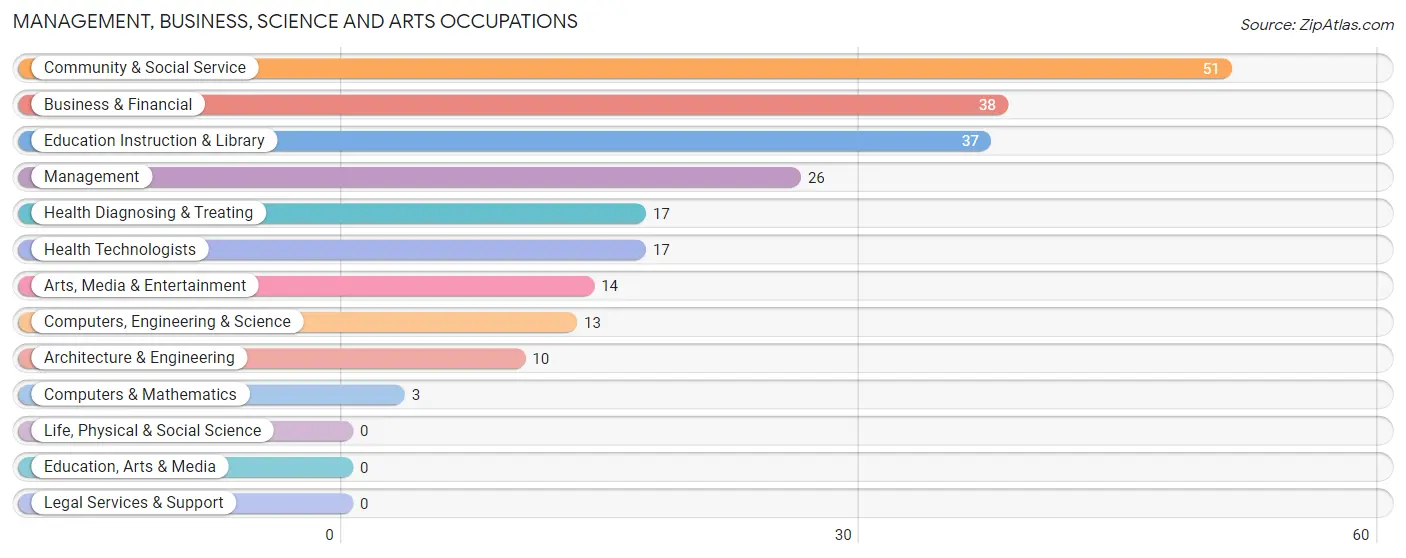
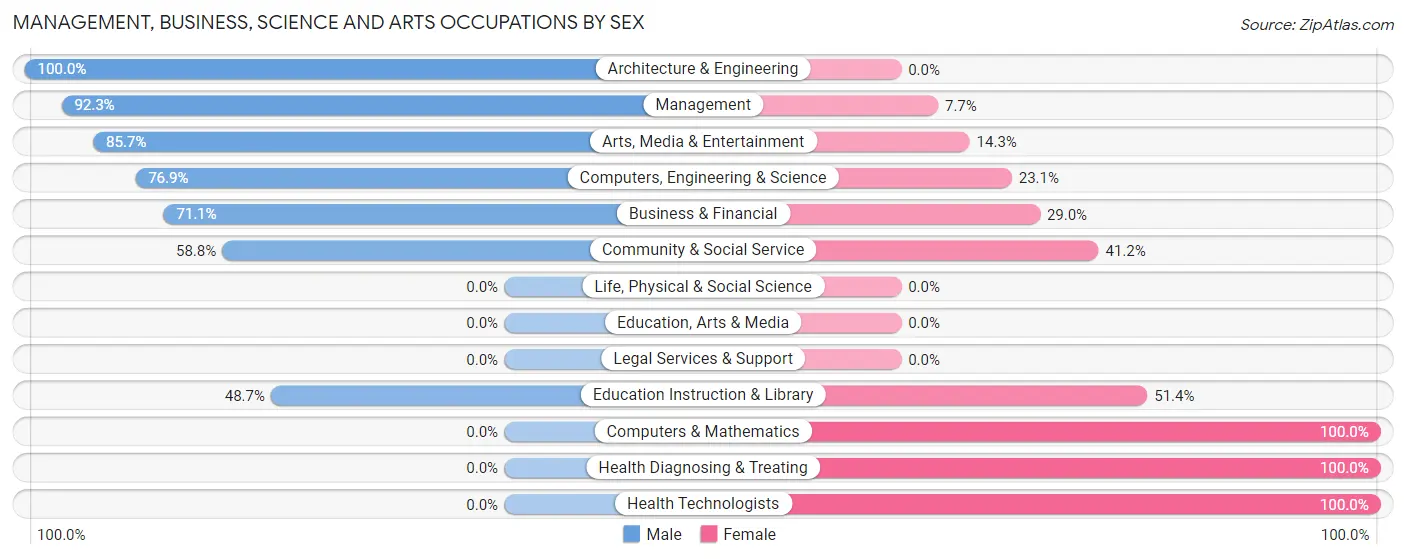
The most common Management, Business, Science and Arts occupations in Rome City are Community & Social Service (51 | 8.2%), Business & Financial (38 | 6.1%), Education Instruction & Library (37 | 5.9%), Management (26 | 4.2%), and Health Diagnosing & Treating (17 | 2.7%).
Management, Business, Science and Arts Occupations by Sex
Within the Management, Business, Science and Arts occupations in Rome City, the most male-oriented occupations are Architecture & Engineering (100.0%), Management (92.3%), and Arts, Media & Entertainment (85.7%), while the most female-oriented occupations are Computers & Mathematics (100.0%), Health Diagnosing & Treating (100.0%), and Health Technologists (100.0%).
| Occupation | Male | Female |
| Management | 24 (92.3%) | 2 (7.7%) |
| Business & Financial | 27 (71.1%) | 11 (28.9%) |
| Computers, Engineering & Science | 10 (76.9%) | 3 (23.1%) |
| Computers & Mathematics | 0 (0.0%) | 3 (100.0%) |
| Architecture & Engineering | 10 (100.0%) | 0 (0.0%) |
| Life, Physical & Social Science | 0 (0.0%) | 0 (0.0%) |
| Community & Social Service | 30 (58.8%) | 21 (41.2%) |
| Education, Arts & Media | 0 (0.0%) | 0 (0.0%) |
| Legal Services & Support | 0 (0.0%) | 0 (0.0%) |
| Education Instruction & Library | 18 (48.6%) | 19 (51.3%) |
| Arts, Media & Entertainment | 12 (85.7%) | 2 (14.3%) |
| Health Diagnosing & Treating | 0 (0.0%) | 17 (100.0%) |
| Health Technologists | 0 (0.0%) | 17 (100.0%) |
| Total (Category) | 91 (62.8%) | 54 (37.2%) |
| Total (Overall) | 352 (56.2%) | 274 (43.8%) |
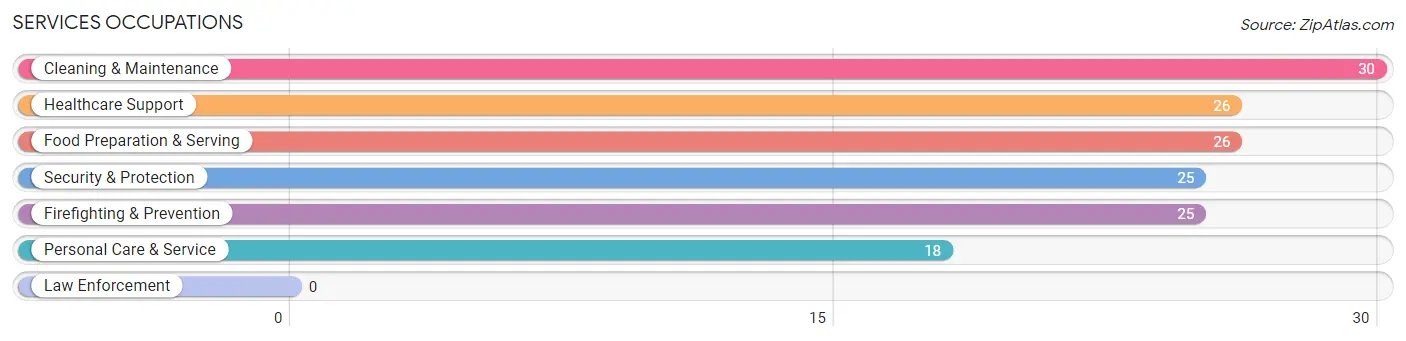
Services Occupations
The most common Services occupations in Rome City are Cleaning & Maintenance (30 | 4.8%), Healthcare Support (26 | 4.2%), Food Preparation & Serving (26 | 4.2%), Security & Protection (25 | 4.0%), and Firefighting & Prevention (25 | 4.0%).
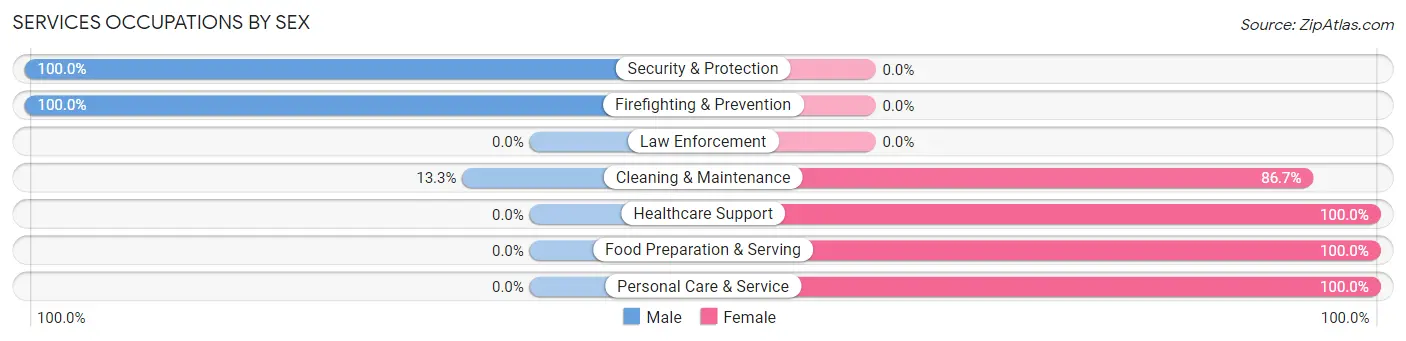
Services Occupations by Sex
Within the Services occupations in Rome City, the most male-oriented occupations are Security & Protection (100.0%), Firefighting & Prevention (100.0%), and Cleaning & Maintenance (13.3%), while the most female-oriented occupations are Healthcare Support (100.0%), Food Preparation & Serving (100.0%), and Personal Care & Service (100.0%).
| Occupation | Male | Female |
| Healthcare Support | 0 (0.0%) | 26 (100.0%) |
| Security & Protection | 25 (100.0%) | 0 (0.0%) |
| Firefighting & Prevention | 25 (100.0%) | 0 (0.0%) |
| Law Enforcement | 0 (0.0%) | 0 (0.0%) |
| Food Preparation & Serving | 0 (0.0%) | 26 (100.0%) |
| Cleaning & Maintenance | 4 (13.3%) | 26 (86.7%) |
| Personal Care & Service | 0 (0.0%) | 18 (100.0%) |
| Total (Category) | 29 (23.2%) | 96 (76.8%) |
| Total (Overall) | 352 (56.2%) | 274 (43.8%) |
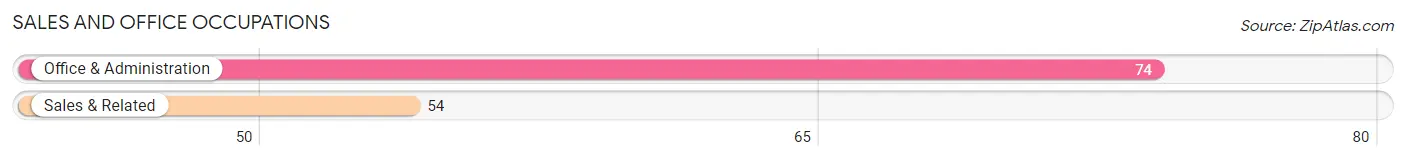
Sales and Office Occupations
The most common Sales and Office occupations in Rome City are Office & Administration (74 | 11.8%), and Sales & Related (54 | 8.6%).
Sales and Office Occupations by Sex
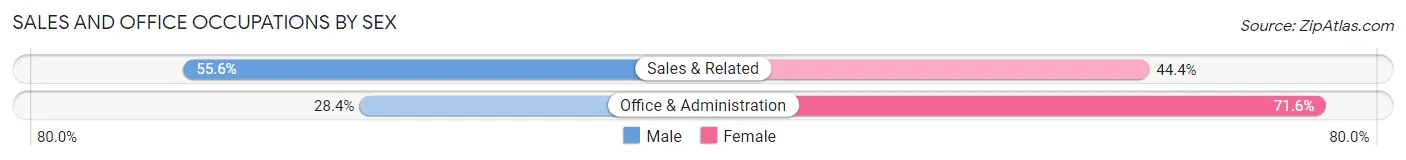
| Occupation | Male | Female |
| Sales & Related | 30 (55.6%) | 24 (44.4%) |
| Office & Administration | 21 (28.4%) | 53 (71.6%) |
| Total (Category) | 51 (39.8%) | 77 (60.2%) |
| Total (Overall) | 352 (56.2%) | 274 (43.8%) |
Natural Resources, Construction and Maintenance Occupations
The most common Natural Resources, Construction and Maintenance occupations in Rome City are Installation, Maintenance & Repair (24 | 3.8%), and Construction & Extraction (20 | 3.2%).
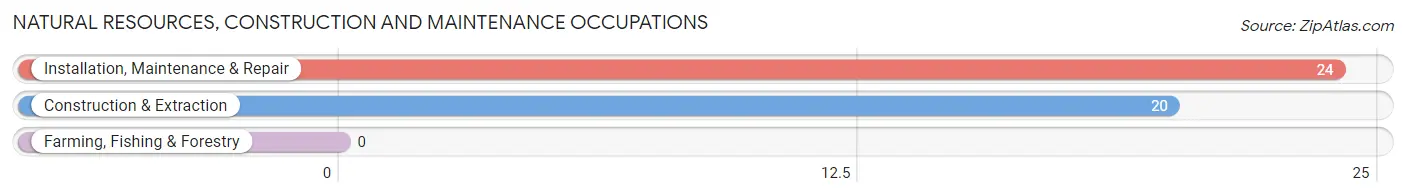
Natural Resources, Construction and Maintenance Occupations by Sex

| Occupation | Male | Female |
| Farming, Fishing & Forestry | 0 (0.0%) | 0 (0.0%) |
| Construction & Extraction | 18 (90.0%) | 2 (10.0%) |
| Installation, Maintenance & Repair | 24 (100.0%) | 0 (0.0%) |
| Total (Category) | 42 (95.5%) | 2 (4.5%) |
| Total (Overall) | 352 (56.2%) | 274 (43.8%) |
Production, Transportation and Moving Occupations
The most common Production, Transportation and Moving occupations in Rome City are Production (106 | 16.9%), Transportation (41 | 6.6%), and Material Moving (37 | 5.9%).
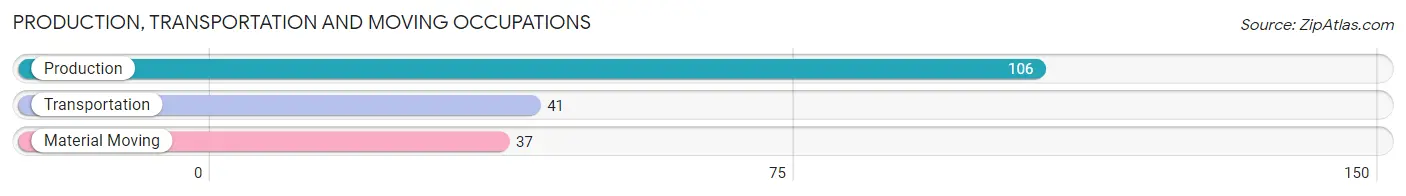
Production, Transportation and Moving Occupations by Sex
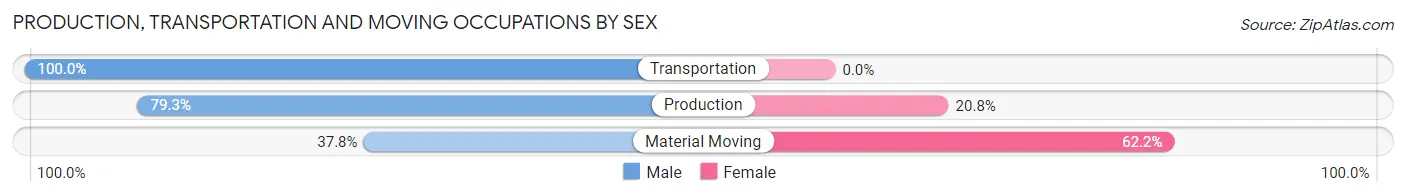
| Occupation | Male | Female |
| Production | 84 (79.2%) | 22 (20.7%) |
| Transportation | 41 (100.0%) | 0 (0.0%) |
| Material Moving | 14 (37.8%) | 23 (62.2%) |
| Total (Category) | 139 (75.5%) | 45 (24.5%) |
| Total (Overall) | 352 (56.2%) | 274 (43.8%) |
Employment Industries by Sex in Rome City
Employment Industries in Rome City
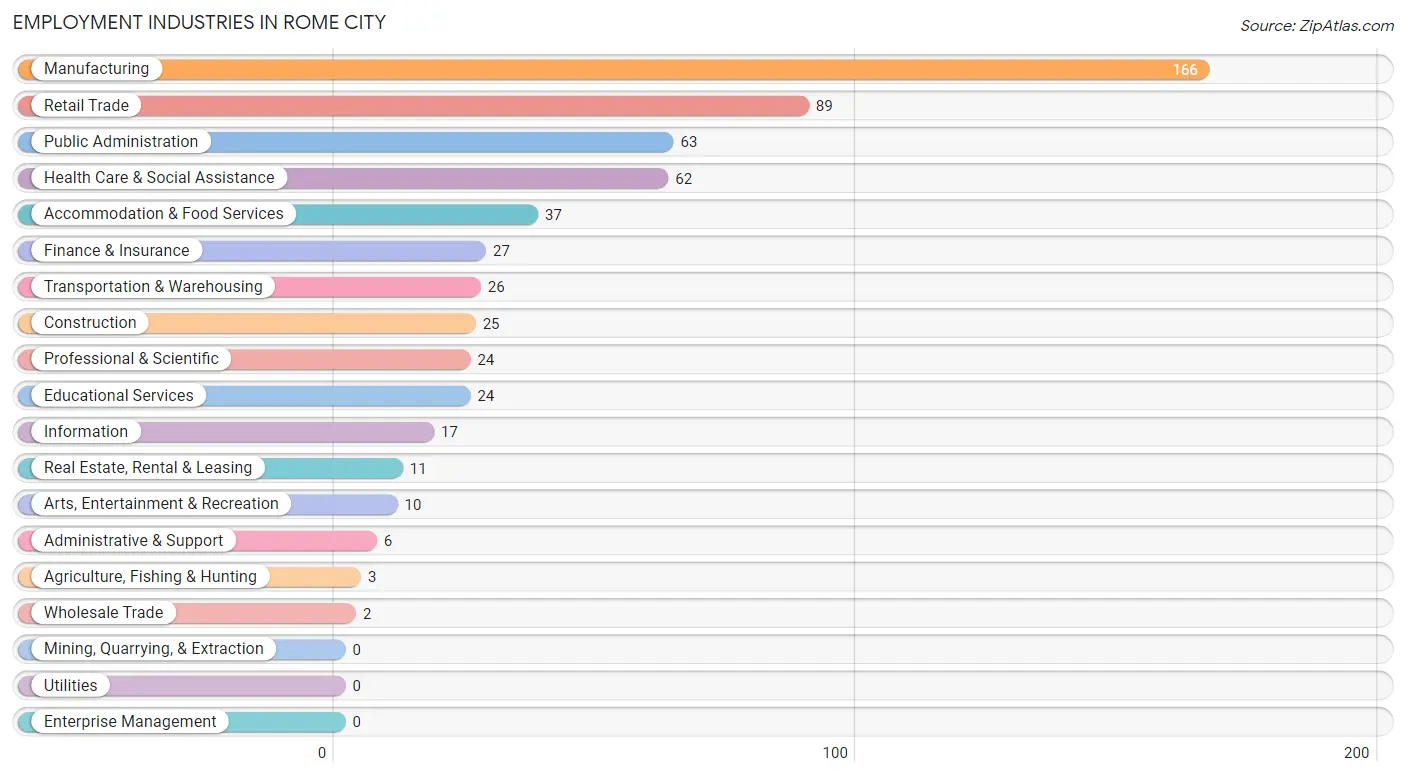
The major employment industries in Rome City include Manufacturing (166 | 26.5%), Retail Trade (89 | 14.2%), Public Administration (63 | 10.1%), Health Care & Social Assistance (62 | 9.9%), and Accommodation & Food Services (37 | 5.9%).
Employment Industries by Sex in Rome City
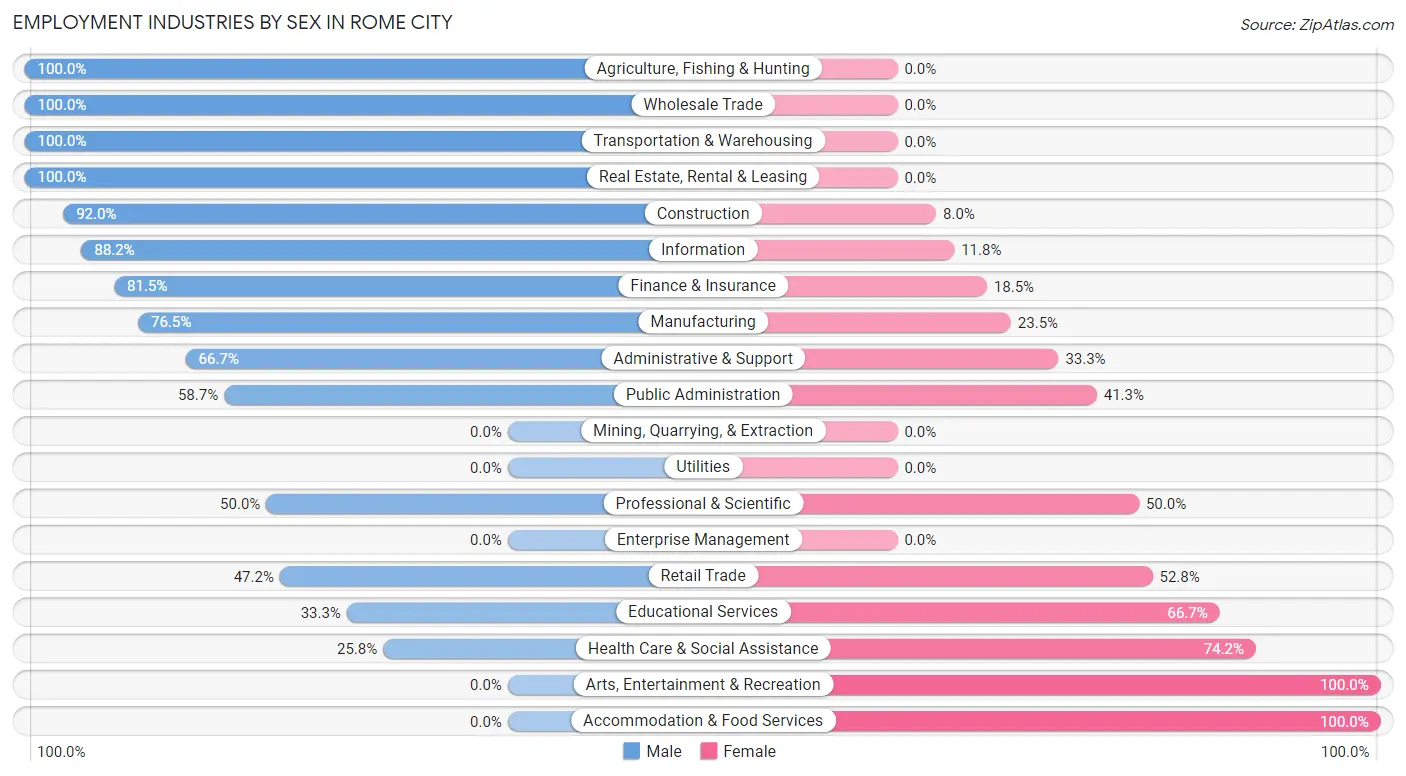
The Rome City industries that see more men than women are Agriculture, Fishing & Hunting (100.0%), Wholesale Trade (100.0%), and Transportation & Warehousing (100.0%), whereas the industries that tend to have a higher number of women are Arts, Entertainment & Recreation (100.0%), Accommodation & Food Services (100.0%), and Health Care & Social Assistance (74.2%).
| Industry | Male | Female |
| Agriculture, Fishing & Hunting | 3 (100.0%) | 0 (0.0%) |
| Mining, Quarrying, & Extraction | 0 (0.0%) | 0 (0.0%) |
| Construction | 23 (92.0%) | 2 (8.0%) |
| Manufacturing | 127 (76.5%) | 39 (23.5%) |
| Wholesale Trade | 2 (100.0%) | 0 (0.0%) |
| Retail Trade | 42 (47.2%) | 47 (52.8%) |
| Transportation & Warehousing | 26 (100.0%) | 0 (0.0%) |
| Utilities | 0 (0.0%) | 0 (0.0%) |
| Information | 15 (88.2%) | 2 (11.8%) |
| Finance & Insurance | 22 (81.5%) | 5 (18.5%) |
| Real Estate, Rental & Leasing | 11 (100.0%) | 0 (0.0%) |
| Professional & Scientific | 12 (50.0%) | 12 (50.0%) |
| Enterprise Management | 0 (0.0%) | 0 (0.0%) |
| Administrative & Support | 4 (66.7%) | 2 (33.3%) |
| Educational Services | 8 (33.3%) | 16 (66.7%) |
| Health Care & Social Assistance | 16 (25.8%) | 46 (74.2%) |
| Arts, Entertainment & Recreation | 0 (0.0%) | 10 (100.0%) |
| Accommodation & Food Services | 0 (0.0%) | 37 (100.0%) |
| Public Administration | 37 (58.7%) | 26 (41.3%) |
| Total | 352 (56.2%) | 274 (43.8%) |
Education in Rome City
School Enrollment in Rome City
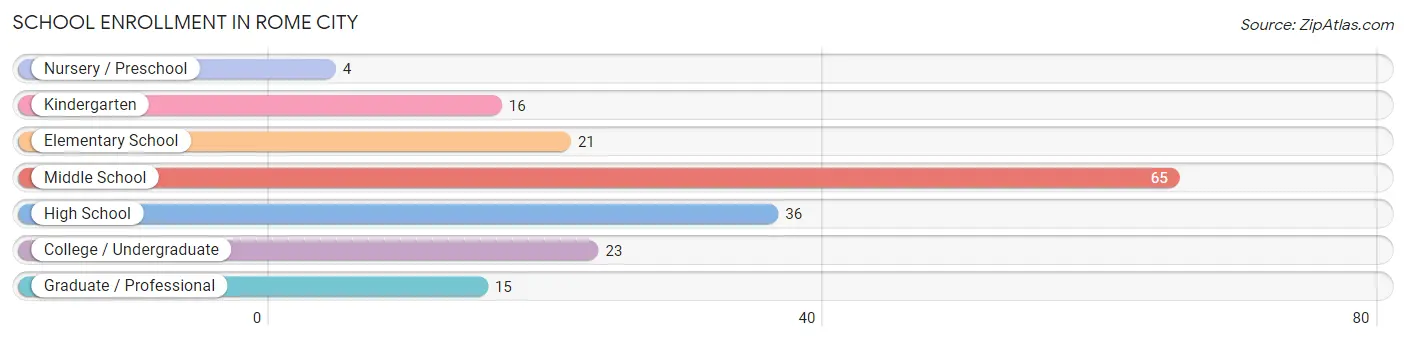
The most common levels of schooling among the 180 students in Rome City are middle school (65 | 36.1%), high school (36 | 20.0%), and college / undergraduate (23 | 12.8%).
| School Level | # Students | % Students |
| Nursery / Preschool | 4 | 2.2% |
| Kindergarten | 16 | 8.9% |
| Elementary School | 21 | 11.7% |
| Middle School | 65 | 36.1% |
| High School | 36 | 20.0% |
| College / Undergraduate | 23 | 12.8% |
| Graduate / Professional | 15 | 8.3% |
| Total | 180 | 100.0% |
School Enrollment by Age by Funding Source in Rome City
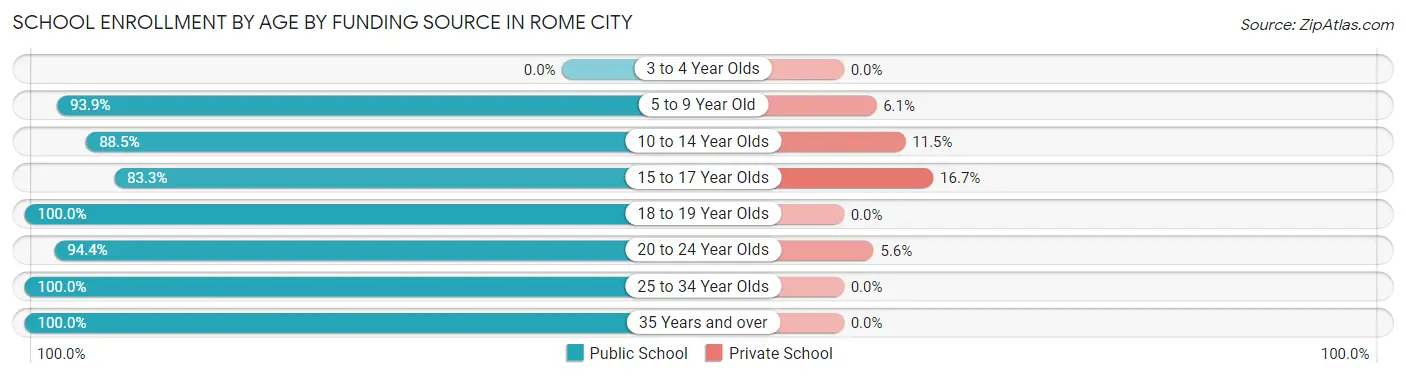
Out of a total of 180 students who are enrolled in schools in Rome City, 16 (8.9%) attend a private institution, while the remaining 164 (91.1%) are enrolled in public schools. The age group of 15 to 17 year olds has the highest likelihood of being enrolled in private schools, with 3 (16.7% in the age bracket) enrolled. Conversely, the age group of 18 to 19 year olds has the lowest likelihood of being enrolled in a private school, with 4 (100.0% in the age bracket) attending a public institution.
| Age Bracket | Public School | Private School |
| 3 to 4 Year Olds | 0 (0.0%) | 0 (0.0%) |
| 5 to 9 Year Old | 31 (93.9%) | 2 (6.1%) |
| 10 to 14 Year Olds | 77 (88.5%) | 10 (11.5%) |
| 15 to 17 Year Olds | 15 (83.3%) | 3 (16.7%) |
| 18 to 19 Year Olds | 4 (100.0%) | 0 (0.0%) |
| 20 to 24 Year Olds | 17 (94.4%) | 1 (5.6%) |
| 25 to 34 Year Olds | 5 (100.0%) | 0 (0.0%) |
| 35 Years and over | 15 (100.0%) | 0 (0.0%) |
| Total | 164 (91.1%) | 16 (8.9%) |
Educational Attainment by Field of Study in Rome City
Education (47 | 25.0%), business (30 | 16.0%), computers & mathematics (14 | 7.4%), science & technology (14 | 7.4%), and liberal arts & history (14 | 7.4%) are the most common fields of study among 188 individuals in Rome City who have obtained a bachelor's degree or higher.
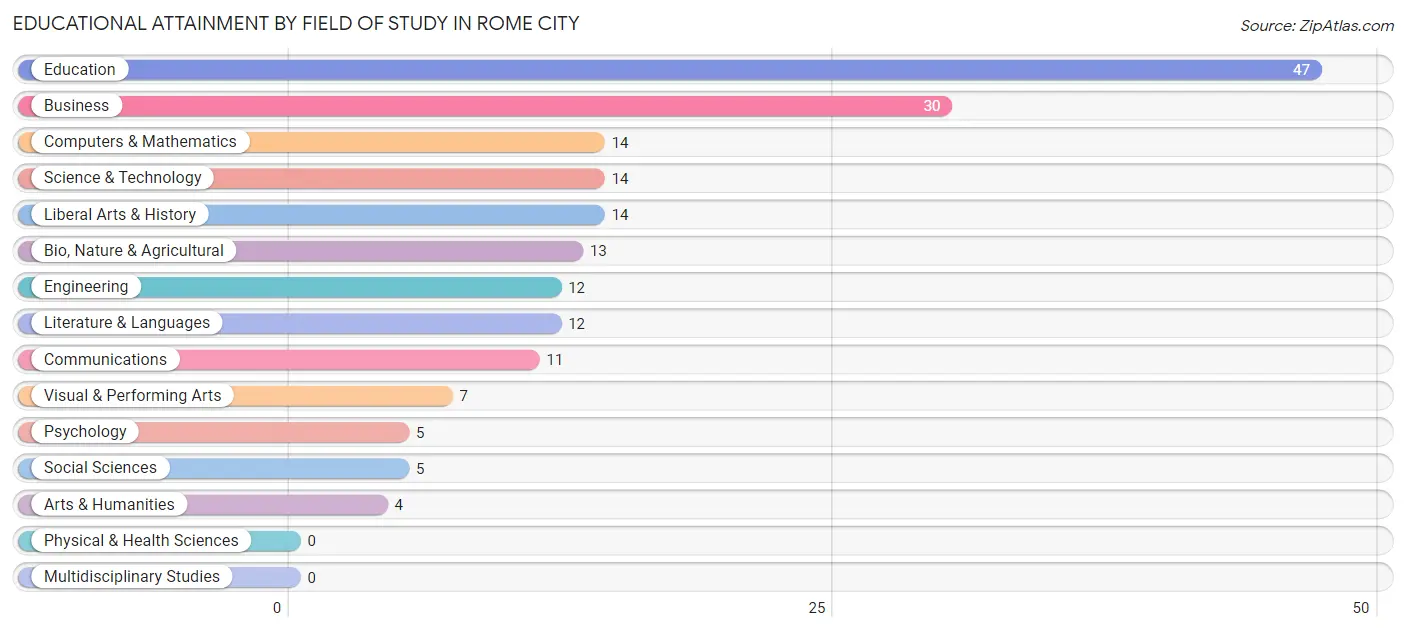
| Field of Study | # Graduates | % Graduates |
| Computers & Mathematics | 14 | 7.4% |
| Bio, Nature & Agricultural | 13 | 6.9% |
| Physical & Health Sciences | 0 | 0.0% |
| Psychology | 5 | 2.7% |
| Social Sciences | 5 | 2.7% |
| Engineering | 12 | 6.4% |
| Multidisciplinary Studies | 0 | 0.0% |
| Science & Technology | 14 | 7.4% |
| Business | 30 | 16.0% |
| Education | 47 | 25.0% |
| Literature & Languages | 12 | 6.4% |
| Liberal Arts & History | 14 | 7.4% |
| Visual & Performing Arts | 7 | 3.7% |
| Communications | 11 | 5.9% |
| Arts & Humanities | 4 | 2.1% |
| Total | 188 | 100.0% |
Transportation & Commute in Rome City
Vehicle Availability by Sex in Rome City
The most prevalent vehicle ownership categories in Rome City are males with 2 vehicles (116, accounting for 33.4%) and females with 2 vehicles (68, making up 42.3%).
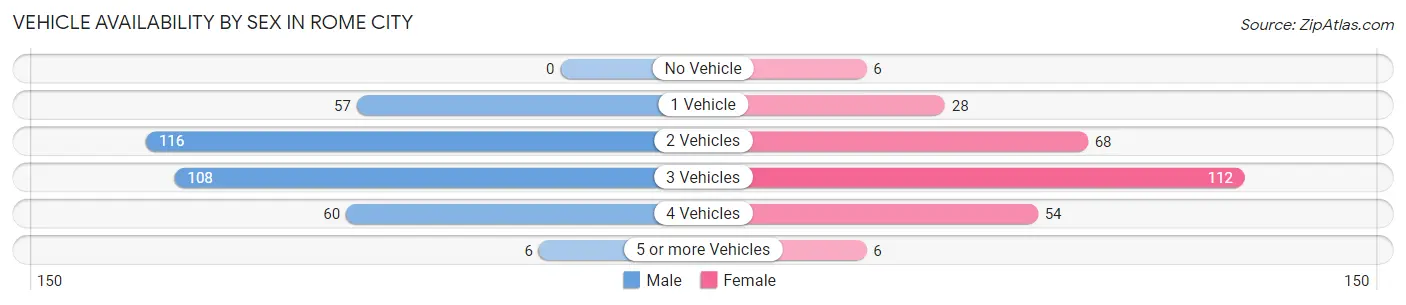
| Vehicles Available | Male | Female |
| No Vehicle | 0 (0.0%) | 6 (2.2%) |
| 1 Vehicle | 57 (16.4%) | 28 (10.2%) |
| 2 Vehicles | 116 (33.4%) | 68 (24.8%) |
| 3 Vehicles | 108 (31.1%) | 112 (40.9%) |
| 4 Vehicles | 60 (17.3%) | 54 (19.7%) |
| 5 or more Vehicles | 6 (1.7%) | 6 (2.2%) |
| Total | 347 (100.0%) | 274 (100.0%) |
Commute Time in Rome City
The most frequently occuring commute durations in Rome City are 20 to 24 minutes (135 commuters, 23.3%), 15 to 19 minutes (90 commuters, 15.5%), and 45 to 59 minutes (58 commuters, 10.0%).
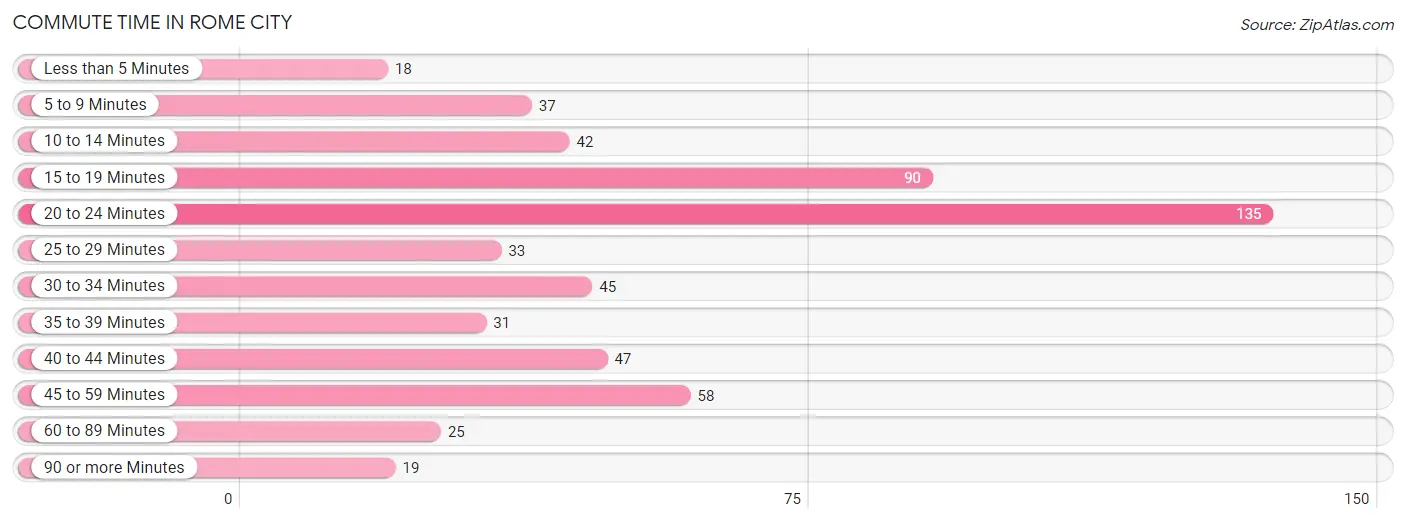
| Commute Time | # Commuters | % Commuters |
| Less than 5 Minutes | 18 | 3.1% |
| 5 to 9 Minutes | 37 | 6.4% |
| 10 to 14 Minutes | 42 | 7.2% |
| 15 to 19 Minutes | 90 | 15.5% |
| 20 to 24 Minutes | 135 | 23.3% |
| 25 to 29 Minutes | 33 | 5.7% |
| 30 to 34 Minutes | 45 | 7.8% |
| 35 to 39 Minutes | 31 | 5.3% |
| 40 to 44 Minutes | 47 | 8.1% |
| 45 to 59 Minutes | 58 | 10.0% |
| 60 to 89 Minutes | 25 | 4.3% |
| 90 or more Minutes | 19 | 3.3% |
Commute Time by Sex in Rome City
The most common commute times in Rome City are 20 to 24 minutes (87 commuters, 28.0%) for males and 20 to 24 minutes (48 commuters, 17.8%) for females.
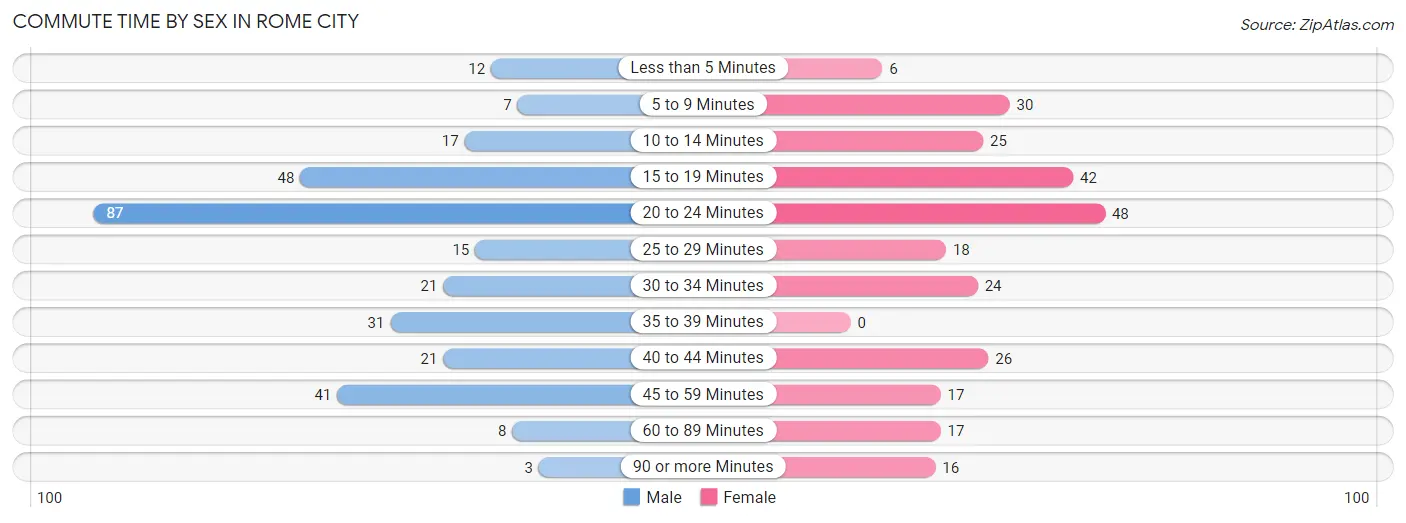
| Commute Time | Male | Female |
| Less than 5 Minutes | 12 (3.9%) | 6 (2.2%) |
| 5 to 9 Minutes | 7 (2.2%) | 30 (11.2%) |
| 10 to 14 Minutes | 17 (5.5%) | 25 (9.3%) |
| 15 to 19 Minutes | 48 (15.4%) | 42 (15.6%) |
| 20 to 24 Minutes | 87 (28.0%) | 48 (17.8%) |
| 25 to 29 Minutes | 15 (4.8%) | 18 (6.7%) |
| 30 to 34 Minutes | 21 (6.8%) | 24 (8.9%) |
| 35 to 39 Minutes | 31 (10.0%) | 0 (0.0%) |
| 40 to 44 Minutes | 21 (6.8%) | 26 (9.7%) |
| 45 to 59 Minutes | 41 (13.2%) | 17 (6.3%) |
| 60 to 89 Minutes | 8 (2.6%) | 17 (6.3%) |
| 90 or more Minutes | 3 (1.0%) | 16 (5.9%) |
Time of Departure to Work by Sex in Rome City
The most frequent times of departure to work in Rome City are 12:00 AM to 4:59 AM (77, 24.8%) for males and 7:30 AM to 7:59 AM (58, 21.6%) for females.
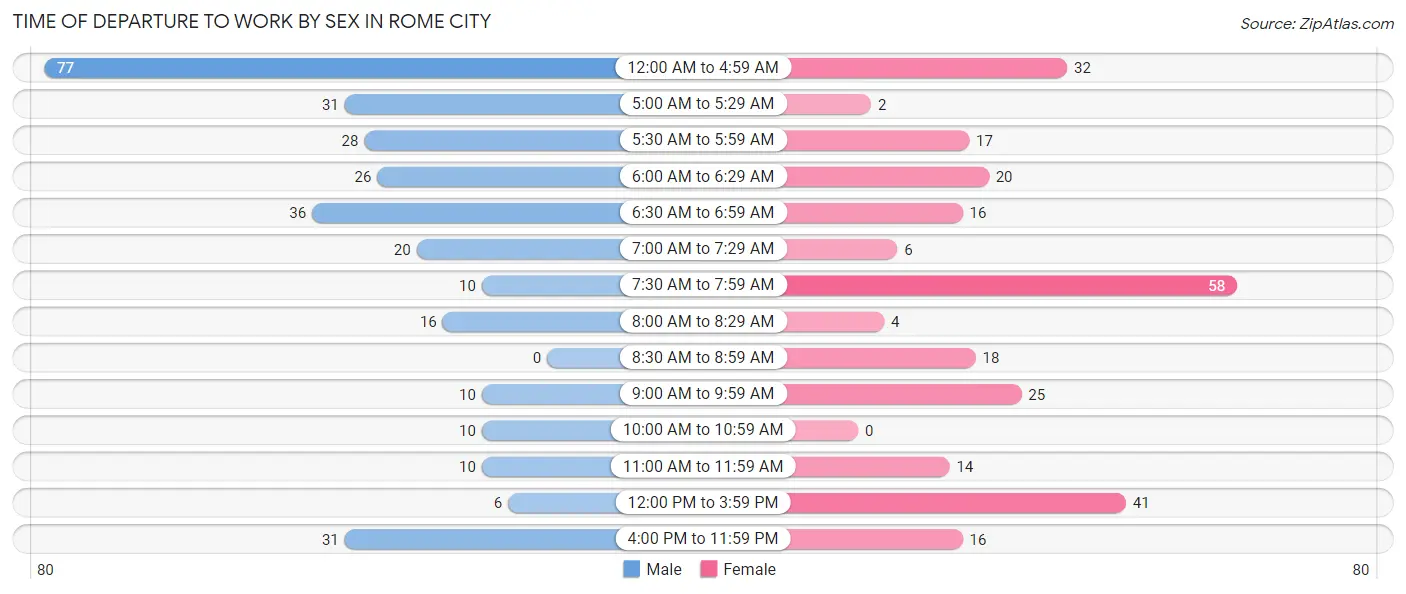
| Time of Departure | Male | Female |
| 12:00 AM to 4:59 AM | 77 (24.8%) | 32 (11.9%) |
| 5:00 AM to 5:29 AM | 31 (10.0%) | 2 (0.7%) |
| 5:30 AM to 5:59 AM | 28 (9.0%) | 17 (6.3%) |
| 6:00 AM to 6:29 AM | 26 (8.4%) | 20 (7.4%) |
| 6:30 AM to 6:59 AM | 36 (11.6%) | 16 (5.9%) |
| 7:00 AM to 7:29 AM | 20 (6.4%) | 6 (2.2%) |
| 7:30 AM to 7:59 AM | 10 (3.2%) | 58 (21.6%) |
| 8:00 AM to 8:29 AM | 16 (5.1%) | 4 (1.5%) |
| 8:30 AM to 8:59 AM | 0 (0.0%) | 18 (6.7%) |
| 9:00 AM to 9:59 AM | 10 (3.2%) | 25 (9.3%) |
| 10:00 AM to 10:59 AM | 10 (3.2%) | 0 (0.0%) |
| 11:00 AM to 11:59 AM | 10 (3.2%) | 14 (5.2%) |
| 12:00 PM to 3:59 PM | 6 (1.9%) | 41 (15.2%) |
| 4:00 PM to 11:59 PM | 31 (10.0%) | 16 (5.9%) |
| Total | 311 (100.0%) | 269 (100.0%) |
Housing Occupancy in Rome City
Occupancy by Ownership in Rome City
Of the total 556 dwellings in Rome City, owner-occupied units account for 459 (82.6%), while renter-occupied units make up 97 (17.4%).
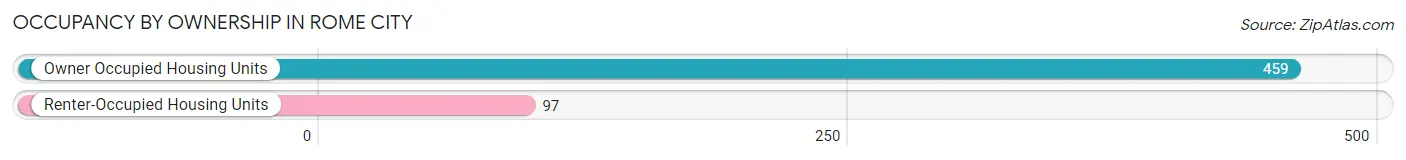
| Occupancy | # Housing Units | % Housing Units |
| Owner Occupied Housing Units | 459 | 82.6% |
| Renter-Occupied Housing Units | 97 | 17.4% |
| Total Occupied Housing Units | 556 | 100.0% |
Occupancy by Household Size in Rome City
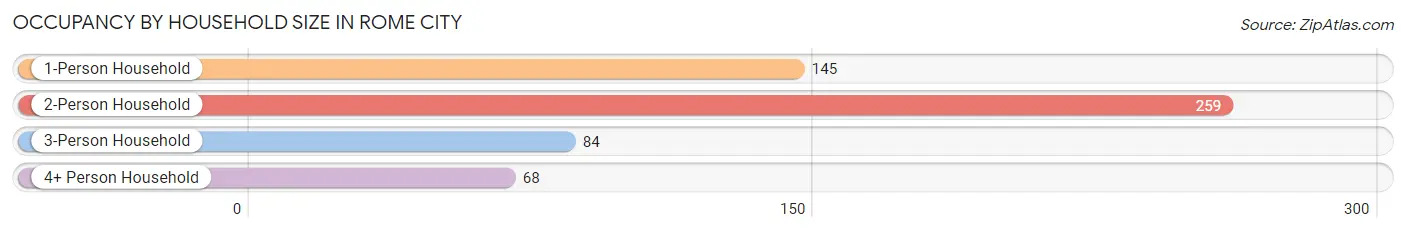
| Household Size | # Housing Units | % Housing Units |
| 1-Person Household | 145 | 26.1% |
| 2-Person Household | 259 | 46.6% |
| 3-Person Household | 84 | 15.1% |
| 4+ Person Household | 68 | 12.2% |
| Total Housing Units | 556 | 100.0% |
Occupancy by Ownership by Household Size in Rome City
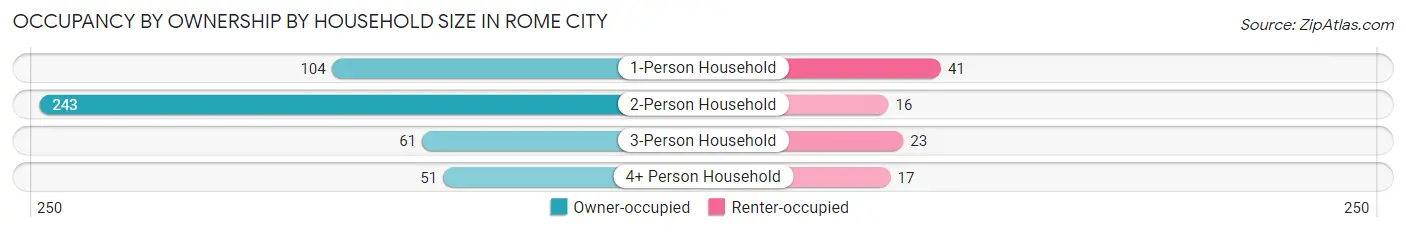
| Household Size | Owner-occupied | Renter-occupied |
| 1-Person Household | 104 (71.7%) | 41 (28.3%) |
| 2-Person Household | 243 (93.8%) | 16 (6.2%) |
| 3-Person Household | 61 (72.6%) | 23 (27.4%) |
| 4+ Person Household | 51 (75.0%) | 17 (25.0%) |
| Total Housing Units | 459 (82.6%) | 97 (17.4%) |
Occupancy by Educational Attainment in Rome City
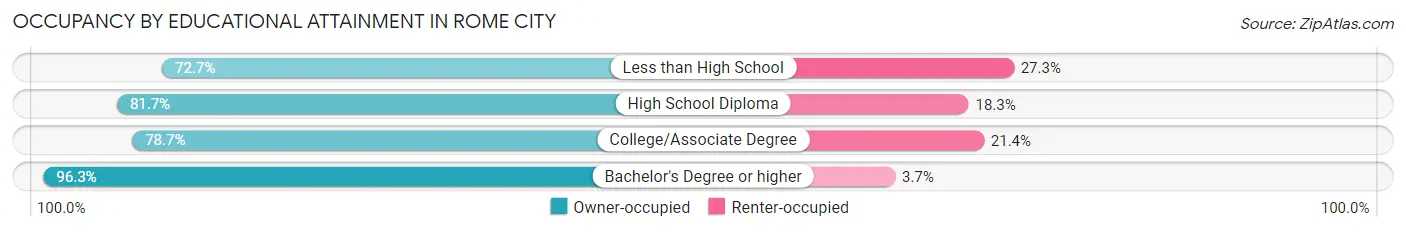
| Household Size | Owner-occupied | Renter-occupied |
| Less than High School | 40 (72.7%) | 15 (27.3%) |
| High School Diploma | 165 (81.7%) | 37 (18.3%) |
| College/Associate Degree | 151 (78.6%) | 41 (21.3%) |
| Bachelor's Degree or higher | 103 (96.3%) | 4 (3.7%) |
Occupancy by Age of Householder in Rome City
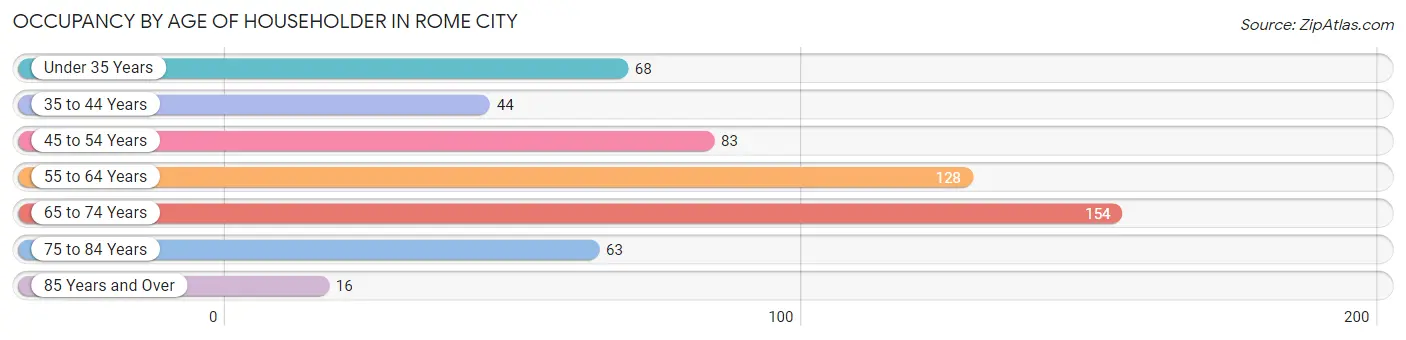
| Age Bracket | # Households | % Households |
| Under 35 Years | 68 | 12.2% |
| 35 to 44 Years | 44 | 7.9% |
| 45 to 54 Years | 83 | 14.9% |
| 55 to 64 Years | 128 | 23.0% |
| 65 to 74 Years | 154 | 27.7% |
| 75 to 84 Years | 63 | 11.3% |
| 85 Years and Over | 16 | 2.9% |
| Total | 556 | 100.0% |
Housing Finances in Rome City
Median Income by Occupancy in Rome City
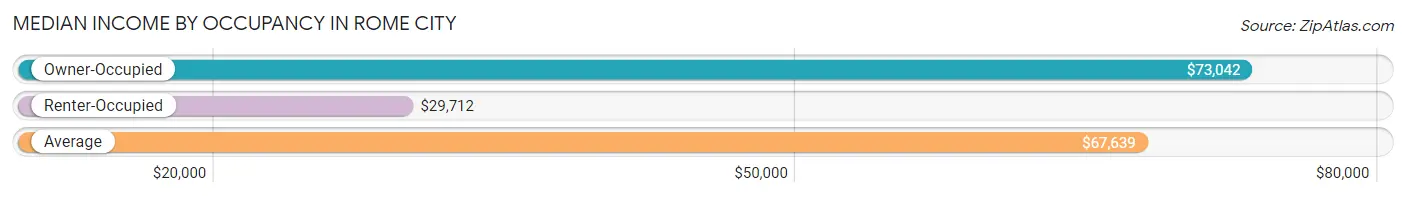
| Occupancy Type | # Households | Median Income |
| Owner-Occupied | 459 (82.6%) | $73,042 |
| Renter-Occupied | 97 (17.4%) | $29,712 |
| Average | 556 (100.0%) | $67,639 |
Occupancy by Householder Income Bracket in Rome City
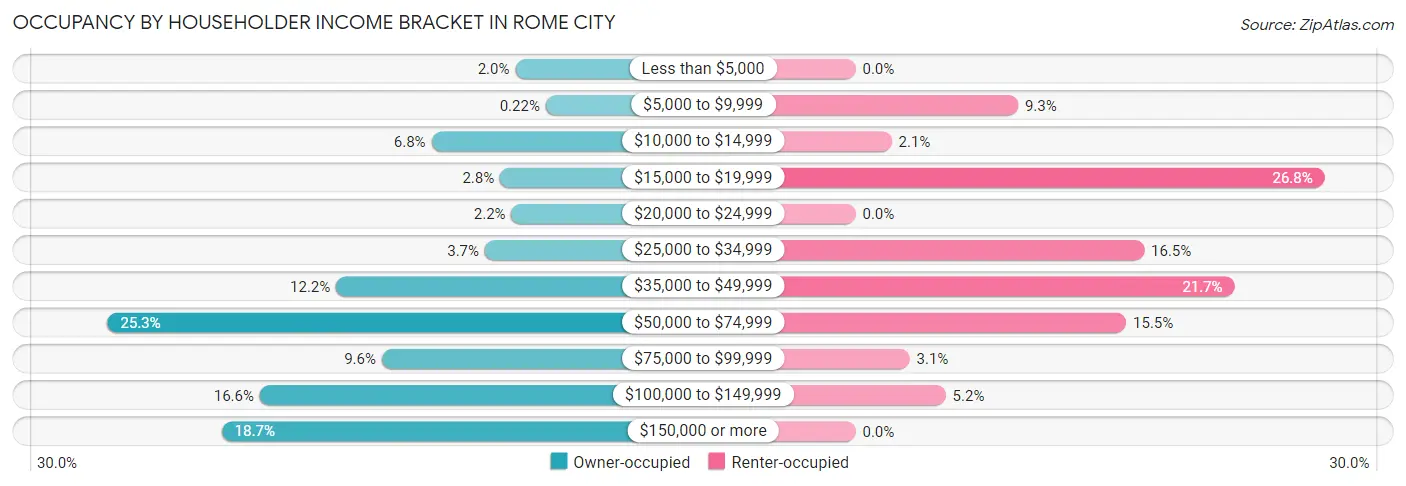
| Income Bracket | Owner-occupied | Renter-occupied |
| Less than $5,000 | 9 (2.0%) | 0 (0.0%) |
| $5,000 to $9,999 | 1 (0.2%) | 9 (9.3%) |
| $10,000 to $14,999 | 31 (6.8%) | 2 (2.1%) |
| $15,000 to $19,999 | 13 (2.8%) | 26 (26.8%) |
| $20,000 to $24,999 | 10 (2.2%) | 0 (0.0%) |
| $25,000 to $34,999 | 17 (3.7%) | 16 (16.5%) |
| $35,000 to $49,999 | 56 (12.2%) | 21 (21.6%) |
| $50,000 to $74,999 | 116 (25.3%) | 15 (15.5%) |
| $75,000 to $99,999 | 44 (9.6%) | 3 (3.1%) |
| $100,000 to $149,999 | 76 (16.6%) | 5 (5.1%) |
| $150,000 or more | 86 (18.7%) | 0 (0.0%) |
| Total | 459 (100.0%) | 97 (100.0%) |
Monthly Housing Cost Tiers in Rome City
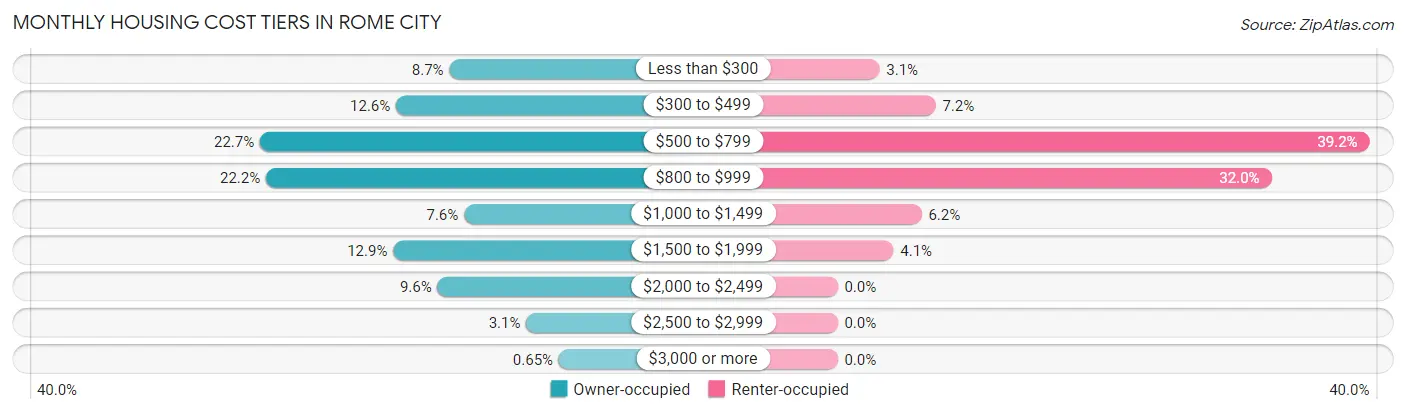
| Monthly Cost | Owner-occupied | Renter-occupied |
| Less than $300 | 40 (8.7%) | 3 (3.1%) |
| $300 to $499 | 58 (12.6%) | 7 (7.2%) |
| $500 to $799 | 104 (22.7%) | 38 (39.2%) |
| $800 to $999 | 102 (22.2%) | 31 (32.0%) |
| $1,000 to $1,499 | 35 (7.6%) | 6 (6.2%) |
| $1,500 to $1,999 | 59 (12.9%) | 4 (4.1%) |
| $2,000 to $2,499 | 44 (9.6%) | 0 (0.0%) |
| $2,500 to $2,999 | 14 (3.0%) | 0 (0.0%) |
| $3,000 or more | 3 (0.6%) | 0 (0.0%) |
| Total | 459 (100.0%) | 97 (100.0%) |
Physical Housing Characteristics in Rome City
Housing Structures in Rome City
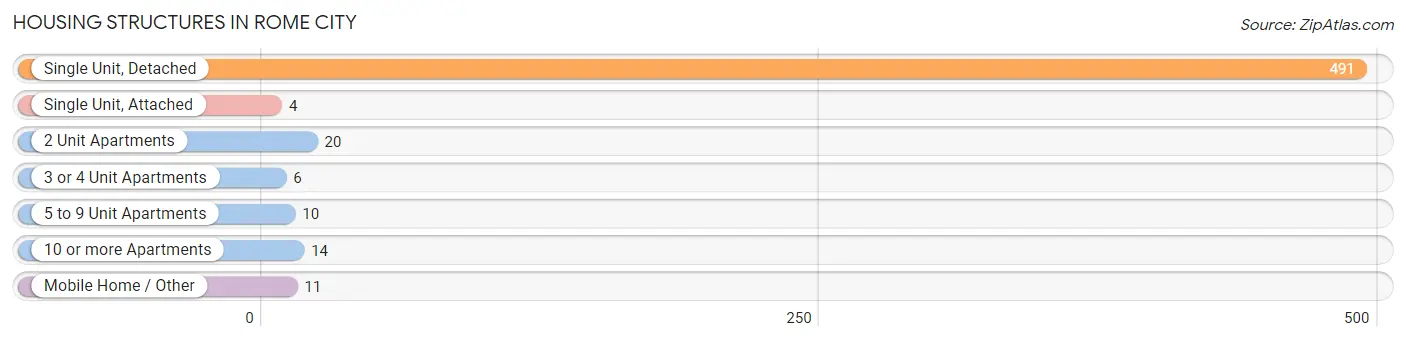
| Structure Type | # Housing Units | % Housing Units |
| Single Unit, Detached | 491 | 88.3% |
| Single Unit, Attached | 4 | 0.7% |
| 2 Unit Apartments | 20 | 3.6% |
| 3 or 4 Unit Apartments | 6 | 1.1% |
| 5 to 9 Unit Apartments | 10 | 1.8% |
| 10 or more Apartments | 14 | 2.5% |
| Mobile Home / Other | 11 | 2.0% |
| Total | 556 | 100.0% |
Housing Structures by Occupancy in Rome City
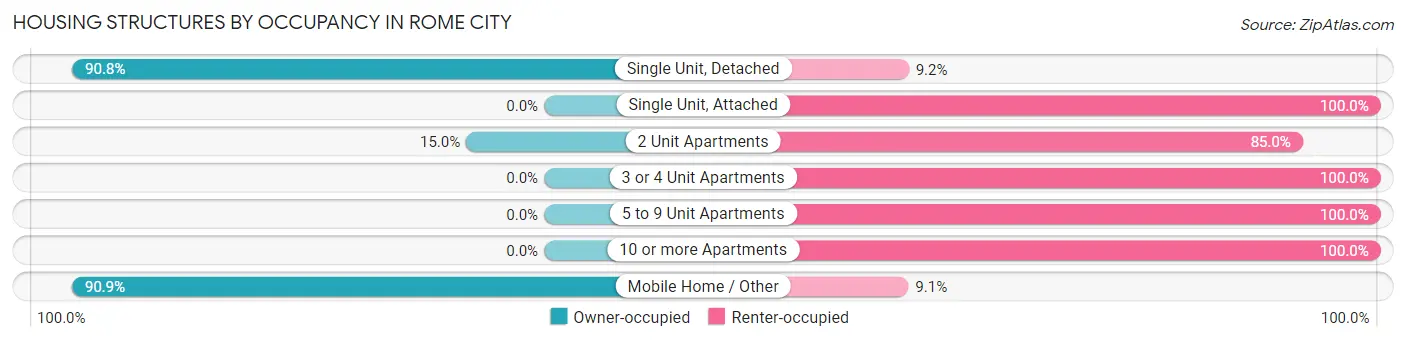
| Structure Type | Owner-occupied | Renter-occupied |
| Single Unit, Detached | 446 (90.8%) | 45 (9.2%) |
| Single Unit, Attached | 0 (0.0%) | 4 (100.0%) |
| 2 Unit Apartments | 3 (15.0%) | 17 (85.0%) |
| 3 or 4 Unit Apartments | 0 (0.0%) | 6 (100.0%) |
| 5 to 9 Unit Apartments | 0 (0.0%) | 10 (100.0%) |
| 10 or more Apartments | 0 (0.0%) | 14 (100.0%) |
| Mobile Home / Other | 10 (90.9%) | 1 (9.1%) |
| Total | 459 (82.6%) | 97 (17.4%) |
Housing Structures by Number of Rooms in Rome City
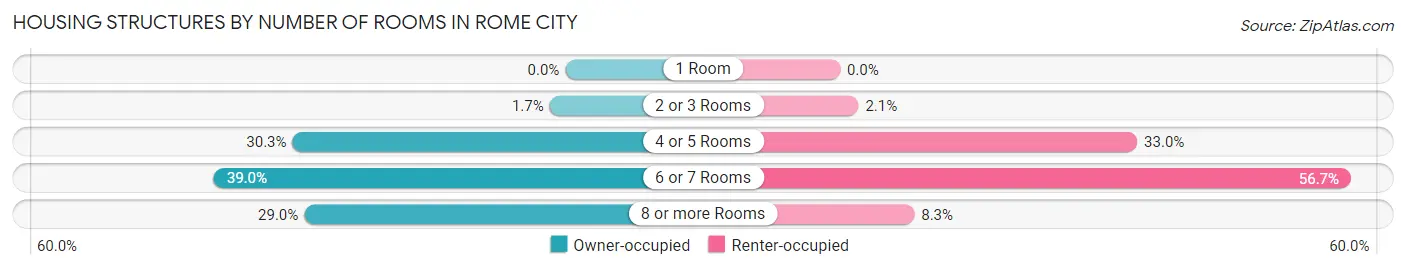
| Number of Rooms | Owner-occupied | Renter-occupied |
| 1 Room | 0 (0.0%) | 0 (0.0%) |
| 2 or 3 Rooms | 8 (1.7%) | 2 (2.1%) |
| 4 or 5 Rooms | 139 (30.3%) | 32 (33.0%) |
| 6 or 7 Rooms | 179 (39.0%) | 55 (56.7%) |
| 8 or more Rooms | 133 (29.0%) | 8 (8.3%) |
| Total | 459 (100.0%) | 97 (100.0%) |
Housing Structure by Heating Type in Rome City
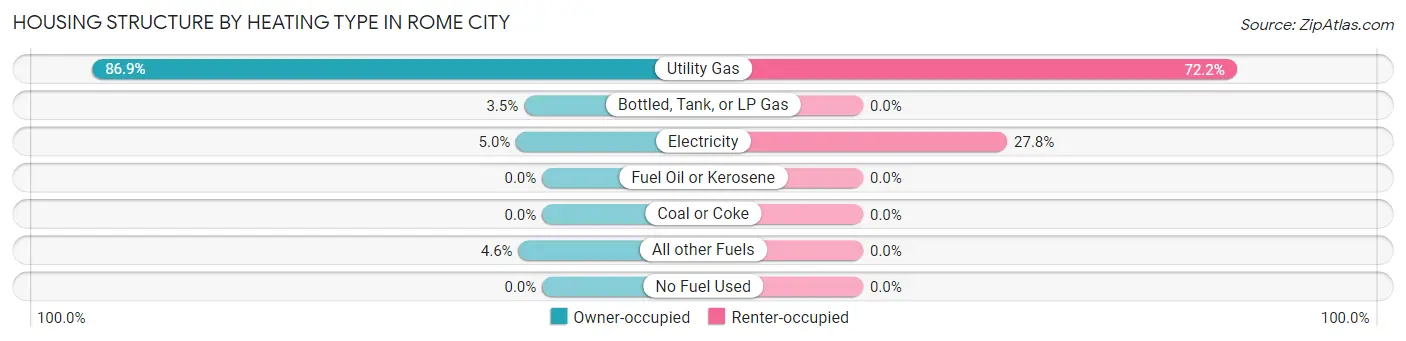
| Heating Type | Owner-occupied | Renter-occupied |
| Utility Gas | 399 (86.9%) | 70 (72.2%) |
| Bottled, Tank, or LP Gas | 16 (3.5%) | 0 (0.0%) |
| Electricity | 23 (5.0%) | 27 (27.8%) |
| Fuel Oil or Kerosene | 0 (0.0%) | 0 (0.0%) |
| Coal or Coke | 0 (0.0%) | 0 (0.0%) |
| All other Fuels | 21 (4.6%) | 0 (0.0%) |
| No Fuel Used | 0 (0.0%) | 0 (0.0%) |
| Total | 459 (100.0%) | 97 (100.0%) |
Household Vehicle Usage in Rome City
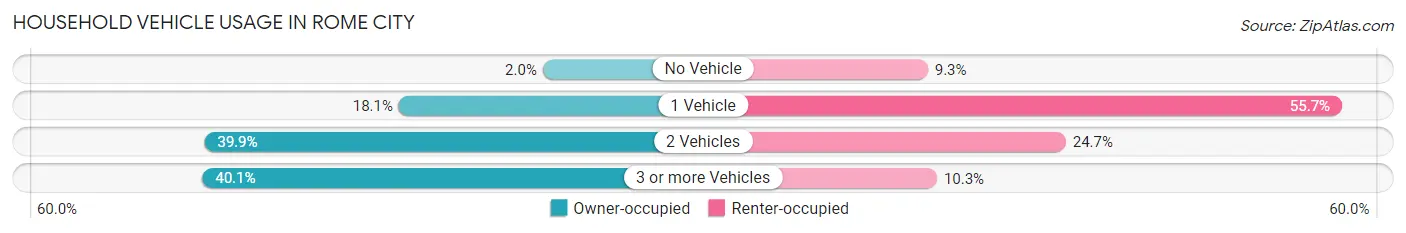
| Vehicles per Household | Owner-occupied | Renter-occupied |
| No Vehicle | 9 (2.0%) | 9 (9.3%) |
| 1 Vehicle | 83 (18.1%) | 54 (55.7%) |
| 2 Vehicles | 183 (39.9%) | 24 (24.7%) |
| 3 or more Vehicles | 184 (40.1%) | 10 (10.3%) |
| Total | 459 (100.0%) | 97 (100.0%) |
Real Estate & Mortgages in Rome City
Real Estate and Mortgage Overview in Rome City
| Characteristic | Without Mortgage | With Mortgage |
| Housing Units | 218 | 241 |
| Median Property Value | $173,100 | $241,700 |
| Median Household Income | $67,917 | $41 |
| Monthly Housing Costs | $527 | $3 |
| Real Estate Taxes | $1,220 | $0 |
Property Value by Mortgage Status in Rome City
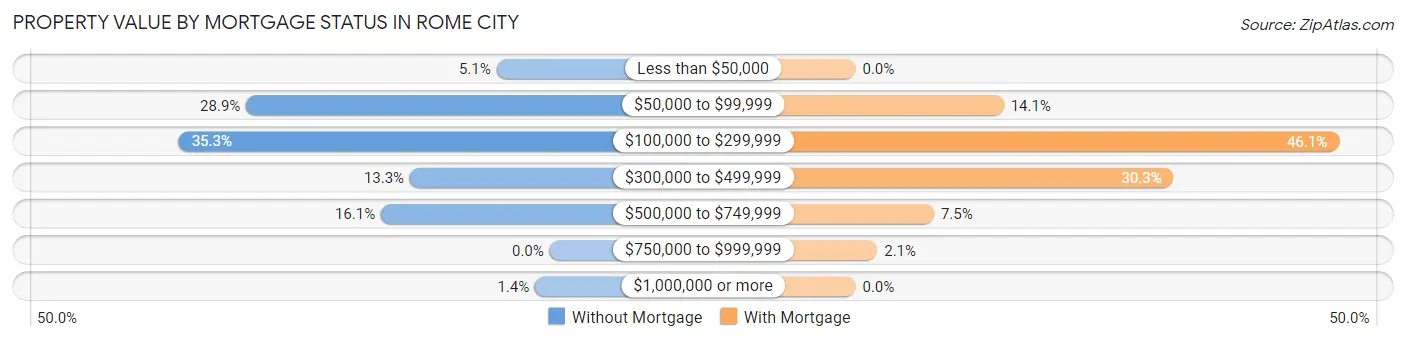
| Property Value | Without Mortgage | With Mortgage |
| Less than $50,000 | 11 (5.1%) | 0 (0.0%) |
| $50,000 to $99,999 | 63 (28.9%) | 34 (14.1%) |
| $100,000 to $299,999 | 77 (35.3%) | 111 (46.1%) |
| $300,000 to $499,999 | 29 (13.3%) | 73 (30.3%) |
| $500,000 to $749,999 | 35 (16.1%) | 18 (7.5%) |
| $750,000 to $999,999 | 0 (0.0%) | 5 (2.1%) |
| $1,000,000 or more | 3 (1.4%) | 0 (0.0%) |
| Total | 218 (100.0%) | 241 (100.0%) |
Household Income by Mortgage Status in Rome City
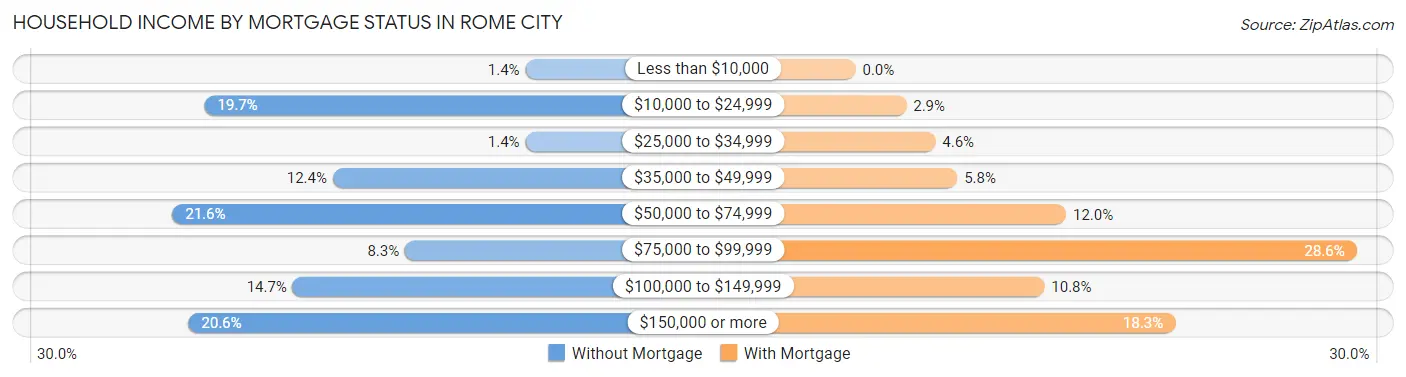
| Household Income | Without Mortgage | With Mortgage |
| Less than $10,000 | 3 (1.4%) | 0 (0.0%) |
| $10,000 to $24,999 | 43 (19.7%) | 7 (2.9%) |
| $25,000 to $34,999 | 3 (1.4%) | 11 (4.6%) |
| $35,000 to $49,999 | 27 (12.4%) | 14 (5.8%) |
| $50,000 to $74,999 | 47 (21.6%) | 29 (12.0%) |
| $75,000 to $99,999 | 18 (8.3%) | 69 (28.6%) |
| $100,000 to $149,999 | 32 (14.7%) | 26 (10.8%) |
| $150,000 or more | 45 (20.6%) | 44 (18.3%) |
| Total | 218 (100.0%) | 241 (100.0%) |
Property Value to Household Income Ratio in Rome City
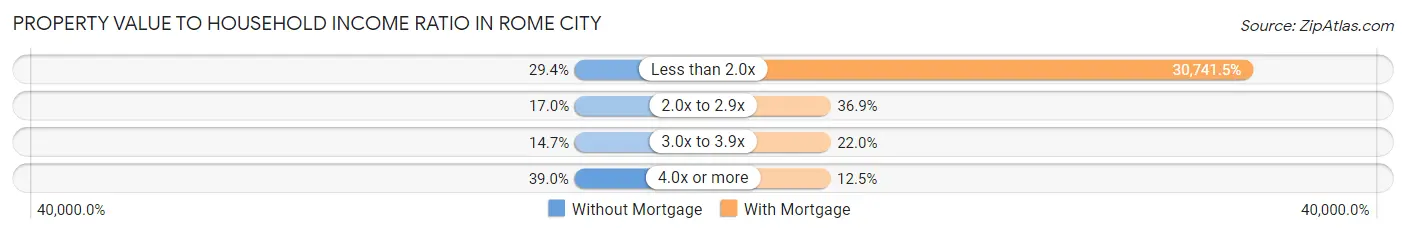
| Value-to-Income Ratio | Without Mortgage | With Mortgage |
| Less than 2.0x | 64 (29.4%) | 74,087 (30,741.5%) |
| 2.0x to 2.9x | 37 (17.0%) | 89 (36.9%) |
| 3.0x to 3.9x | 32 (14.7%) | 53 (22.0%) |
| 4.0x or more | 85 (39.0%) | 30 (12.4%) |
| Total | 218 (100.0%) | 241 (100.0%) |
Real Estate Taxes by Mortgage Status in Rome City
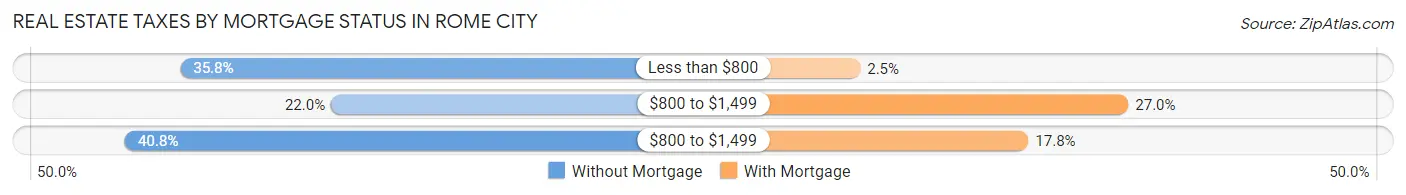
| Property Taxes | Without Mortgage | With Mortgage |
| Less than $800 | 78 (35.8%) | 6 (2.5%) |
| $800 to $1,499 | 48 (22.0%) | 65 (27.0%) |
| $800 to $1,499 | 89 (40.8%) | 43 (17.8%) |
| Total | 218 (100.0%) | 241 (100.0%) |
Health & Disability in Rome City
Health Insurance Coverage by Age in Rome City
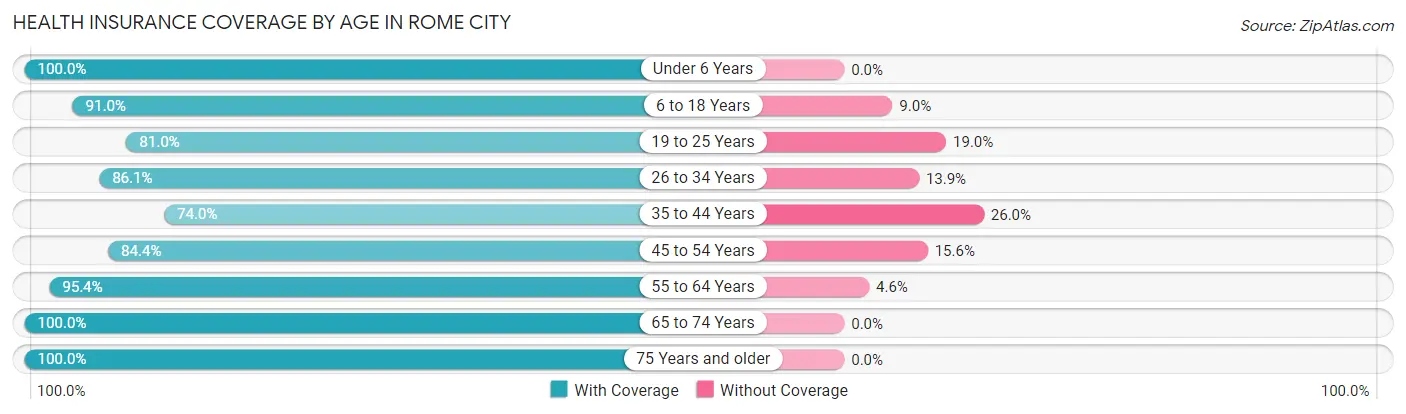
| Age Bracket | With Coverage | Without Coverage |
| Under 6 Years | 55 (100.0%) | 0 (0.0%) |
| 6 to 18 Years | 132 (91.0%) | 13 (9.0%) |
| 19 to 25 Years | 145 (81.0%) | 34 (19.0%) |
| 26 to 34 Years | 68 (86.1%) | 11 (13.9%) |
| 35 to 44 Years | 91 (74.0%) | 32 (26.0%) |
| 45 to 54 Years | 152 (84.4%) | 28 (15.6%) |
| 55 to 64 Years | 227 (95.4%) | 11 (4.6%) |
| 65 to 74 Years | 238 (100.0%) | 0 (0.0%) |
| 75 Years and older | 104 (100.0%) | 0 (0.0%) |
| Total | 1,212 (90.4%) | 129 (9.6%) |
Health Insurance Coverage by Citizenship Status in Rome City
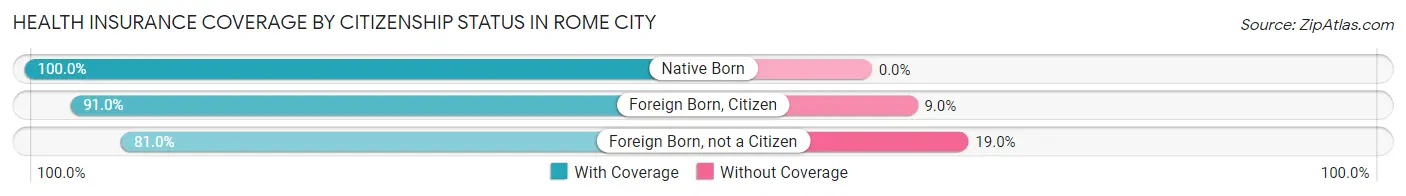
| Citizenship Status | With Coverage | Without Coverage |
| Native Born | 55 (100.0%) | 0 (0.0%) |
| Foreign Born, Citizen | 132 (91.0%) | 13 (9.0%) |
| Foreign Born, not a Citizen | 145 (81.0%) | 34 (19.0%) |
Health Insurance Coverage by Household Income in Rome City
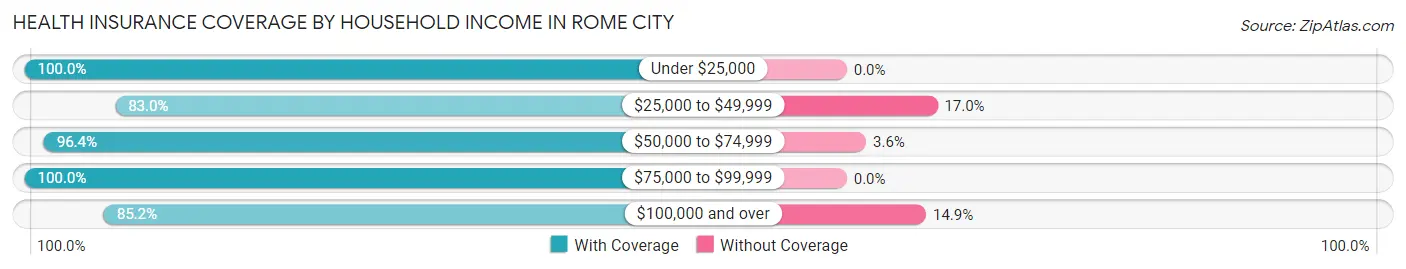
| Household Income | With Coverage | Without Coverage |
| Under $25,000 | 147 (100.0%) | 0 (0.0%) |
| $25,000 to $49,999 | 220 (83.0%) | 45 (17.0%) |
| $50,000 to $74,999 | 347 (96.4%) | 13 (3.6%) |
| $75,000 to $99,999 | 91 (100.0%) | 0 (0.0%) |
| $100,000 and over | 407 (85.2%) | 71 (14.8%) |
Public vs Private Health Insurance Coverage by Age in Rome City
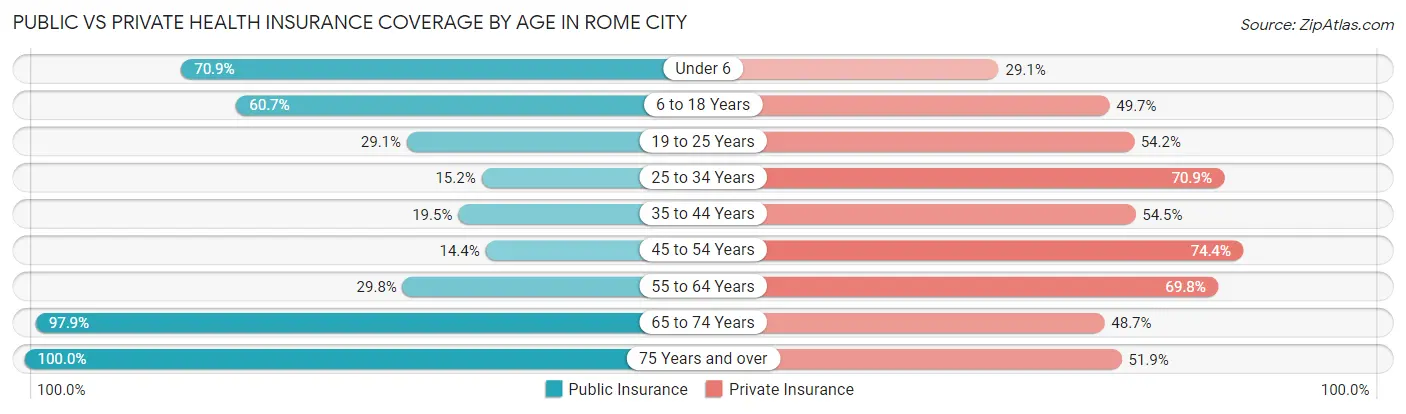
| Age Bracket | Public Insurance | Private Insurance |
| Under 6 | 39 (70.9%) | 16 (29.1%) |
| 6 to 18 Years | 88 (60.7%) | 72 (49.7%) |
| 19 to 25 Years | 52 (29.0%) | 97 (54.2%) |
| 25 to 34 Years | 12 (15.2%) | 56 (70.9%) |
| 35 to 44 Years | 24 (19.5%) | 67 (54.5%) |
| 45 to 54 Years | 26 (14.4%) | 134 (74.4%) |
| 55 to 64 Years | 71 (29.8%) | 166 (69.8%) |
| 65 to 74 Years | 233 (97.9%) | 116 (48.7%) |
| 75 Years and over | 104 (100.0%) | 54 (51.9%) |
| Total | 649 (48.4%) | 778 (58.0%) |
Disability Status by Sex by Age in Rome City
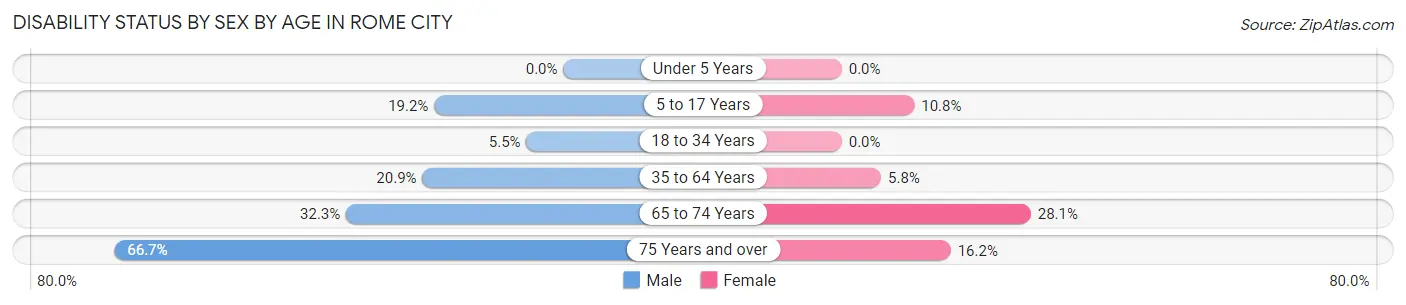
| Age Bracket | Male | Female |
| Under 5 Years | 0 (0.0%) | 0 (0.0%) |
| 5 to 17 Years | 14 (19.2%) | 7 (10.8%) |
| 18 to 34 Years | 8 (5.5%) | 0 (0.0%) |
| 35 to 64 Years | 63 (20.9%) | 14 (5.8%) |
| 65 to 74 Years | 40 (32.3%) | 32 (28.1%) |
| 75 Years and over | 24 (66.7%) | 11 (16.2%) |
Disability Class by Sex by Age in Rome City
Disability Class: Hearing Difficulty
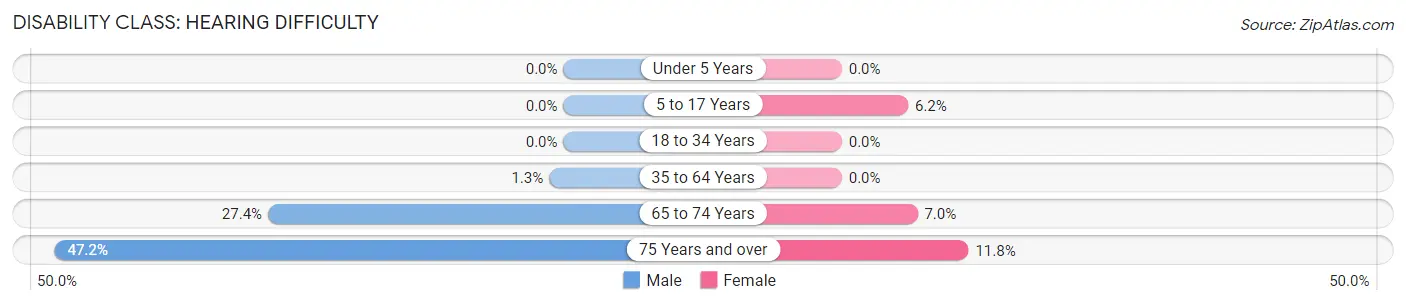
| Age Bracket | Male | Female |
| Under 5 Years | 0 (0.0%) | 0 (0.0%) |
| 5 to 17 Years | 0 (0.0%) | 4 (6.1%) |
| 18 to 34 Years | 0 (0.0%) | 0 (0.0%) |
| 35 to 64 Years | 4 (1.3%) | 0 (0.0%) |
| 65 to 74 Years | 34 (27.4%) | 8 (7.0%) |
| 75 Years and over | 17 (47.2%) | 8 (11.8%) |
Disability Class: Vision Difficulty
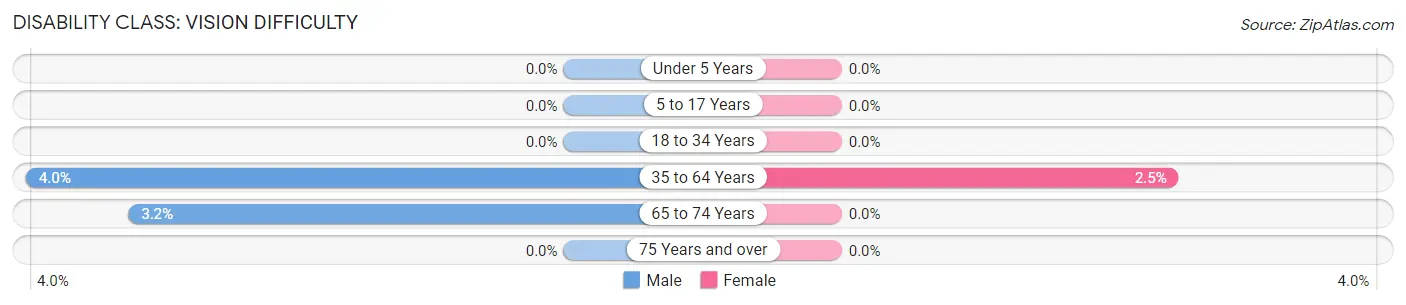
| Age Bracket | Male | Female |
| Under 5 Years | 0 (0.0%) | 0 (0.0%) |
| 5 to 17 Years | 0 (0.0%) | 0 (0.0%) |
| 18 to 34 Years | 0 (0.0%) | 0 (0.0%) |
| 35 to 64 Years | 12 (4.0%) | 6 (2.5%) |
| 65 to 74 Years | 4 (3.2%) | 0 (0.0%) |
| 75 Years and over | 0 (0.0%) | 0 (0.0%) |
Disability Class: Cognitive Difficulty
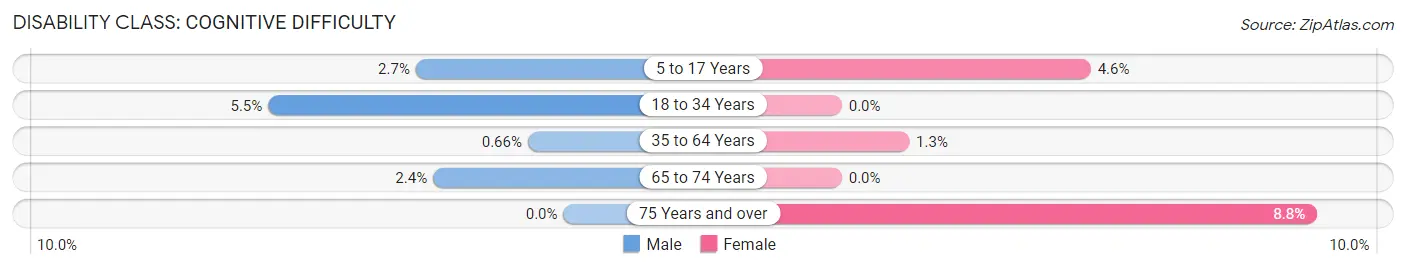
| Age Bracket | Male | Female |
| 5 to 17 Years | 2 (2.7%) | 3 (4.6%) |
| 18 to 34 Years | 8 (5.5%) | 0 (0.0%) |
| 35 to 64 Years | 2 (0.7%) | 3 (1.3%) |
| 65 to 74 Years | 3 (2.4%) | 0 (0.0%) |
| 75 Years and over | 0 (0.0%) | 6 (8.8%) |
Disability Class: Ambulatory Difficulty
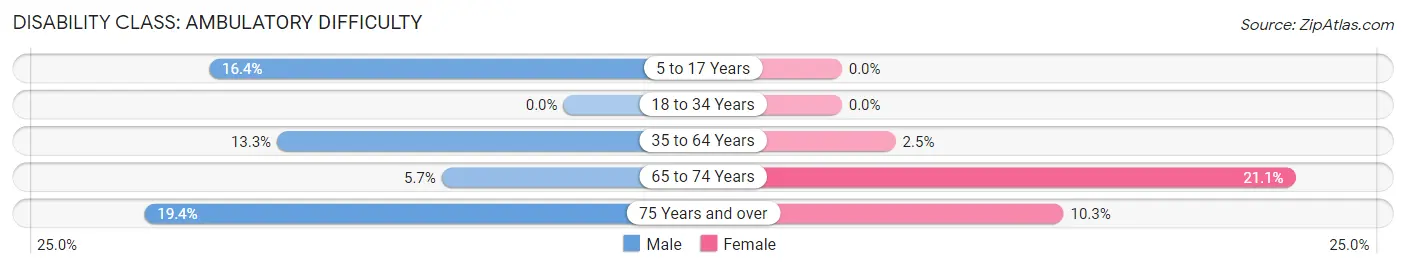
| Age Bracket | Male | Female |
| 5 to 17 Years | 12 (16.4%) | 0 (0.0%) |
| 18 to 34 Years | 0 (0.0%) | 0 (0.0%) |
| 35 to 64 Years | 40 (13.3%) | 6 (2.5%) |
| 65 to 74 Years | 7 (5.7%) | 24 (21.0%) |
| 75 Years and over | 7 (19.4%) | 7 (10.3%) |
Disability Class: Self-Care Difficulty
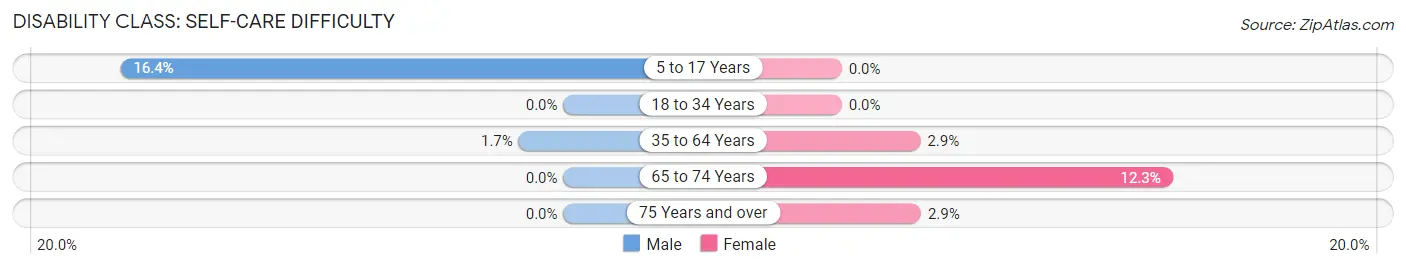
| Age Bracket | Male | Female |
| 5 to 17 Years | 12 (16.4%) | 0 (0.0%) |
| 18 to 34 Years | 0 (0.0%) | 0 (0.0%) |
| 35 to 64 Years | 5 (1.7%) | 7 (2.9%) |
| 65 to 74 Years | 0 (0.0%) | 14 (12.3%) |
| 75 Years and over | 0 (0.0%) | 2 (2.9%) |
Technology Access in Rome City
Computing Device Access in Rome City
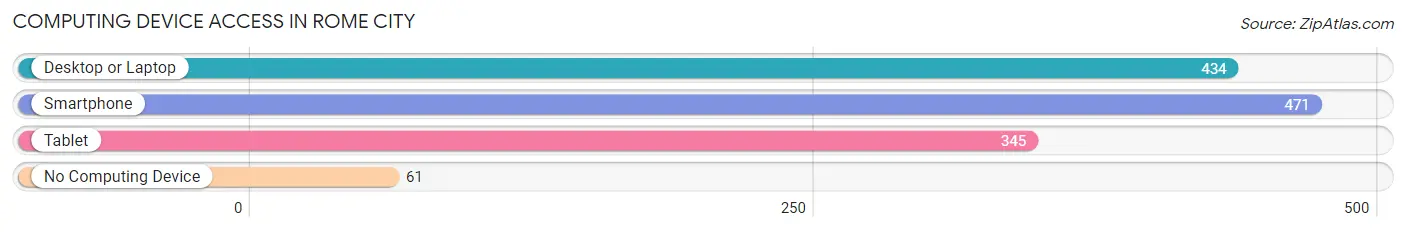
| Device Type | # Households | % Households |
| Desktop or Laptop | 434 | 78.1% |
| Smartphone | 471 | 84.7% |
| Tablet | 345 | 62.1% |
| No Computing Device | 61 | 11.0% |
| Total | 556 | 100.0% |
Internet Access in Rome City
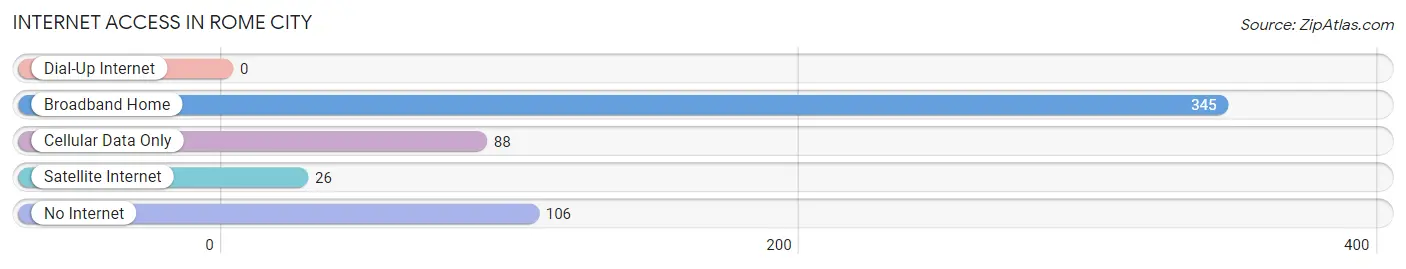
| Internet Type | # Households | % Households |
| Dial-Up Internet | 0 | 0.0% |
| Broadband Home | 345 | 62.1% |
| Cellular Data Only | 88 | 15.8% |
| Satellite Internet | 26 | 4.7% |
| No Internet | 106 | 19.1% |
| Total | 556 | 100.0% |
Rome City Summary
Rome City is a small town located in northeastern Indiana, in Noble County. It is situated on the banks of Lake Wawasee, the largest natural lake in Indiana. The town was founded in 1836 and has a population of 1,845 as of the 2010 census.
Geography
Rome City is located at 41°25'25"N 85°31'17"W (41.423, -85.521). It is situated on the banks of Lake Wawasee, the largest natural lake in Indiana. The town is located in the Tippecanoe River Valley, which is part of the Great Lakes region. The town is surrounded by rolling hills and wooded areas.
The climate in Rome City is humid continental, with hot summers and cold winters. The average temperature in July is 79°F (26°C) and the average temperature in January is 24°F (-4°C). The average annual precipitation is 40 inches (101 cm).
Economy
Rome City's economy is largely based on tourism. The town is a popular destination for fishing, boating, and other outdoor activities. The town is also home to several small businesses, including restaurants, retail stores, and a winery.
The town is also home to a number of manufacturing companies, including a plastics manufacturer, a metal fabricator, and a furniture manufacturer. The town is also home to a number of agricultural businesses, including a dairy farm and a vegetable farm.
Demographics
As of the 2010 census, the population of Rome City was 1,845. The racial makeup of the town was 97.2% White, 0.7% African American, 0.3% Native American, 0.2% Asian, 0.1% Pacific Islander, 0.3% from other races, and 1.3% from two or more races. Hispanic or Latino of any race were 1.3% of the population.
The median income for a household in Rome City was $37,500, and the median income for a family was $45,000. The per capita income for the town was $19,000. About 11.2% of families and 14.2% of the population were below the poverty line, including 18.2% of those under age 18 and 8.3% of those age 65 or over.
History
Rome City was founded in 1836 by a group of settlers from Rome, New York. The town was named after the city of Rome in Italy. The town was originally a farming community, but it soon became a popular destination for fishing and boating.
In the late 19th century, the town became a popular tourist destination. The town was home to several resorts, including the Rome City Hotel, which was built in 1891. The hotel was destroyed by fire in 1910, but it was rebuilt and is still in operation today.
In the early 20th century, the town became a popular destination for wealthy vacationers from Chicago and other cities. The town was home to several large estates, including the estate of the late industrialist and philanthropist John D. Rockefeller.
Rome City is still a popular destination for tourists and vacationers. The town is home to several restaurants, retail stores, and a winery. The town is also home to a number of manufacturing companies, including a plastics manufacturer, a metal fabricator, and a furniture manufacturer. The town is also home to a number of agricultural businesses, including a dairy farm and a vegetable farm.
Common Questions
What is Per Capita Income in Rome City?
Per Capita income in Rome City is $40,565.
What is the Median Family Income in Rome City?
Median Family Income in Rome City is $73,787.
What is the Median Household income in Rome City?
Median Household Income in Rome City is $67,639.
What is Income or Wage Gap in Rome City?
Income or Wage Gap in Rome City is 46.5%.
Women in Rome City earn 53.5 cents for every dollar earned by a man.
What is Inequality or Gini Index in Rome City?
Inequality or Gini Index in Rome City is 0.48.
What is the Total Population of Rome City?
Total Population of Rome City is 1,341.
What is the Total Male Population of Rome City?
Total Male Population of Rome City is 701.
What is the Total Female Population of Rome City?
Total Female Population of Rome City is 640.
What is the Ratio of Males per 100 Females in Rome City?
There are 109.53 Males per 100 Females in Rome City.
What is the Ratio of Females per 100 Males in Rome City?
There are 91.30 Females per 100 Males in Rome City.
What is the Median Population Age in Rome City?
Median Population Age in Rome City is 52.0 Years.
What is the Average Family Size in Rome City
Average Family Size in Rome City is 2.9 People.
What is the Average Household Size in Rome City
Average Household Size in Rome City is 2.4 People.
How Large is the Labor Force in Rome City?
There are 655 People in the Labor Forcein in Rome City.
What is the Percentage of People in the Labor Force in Rome City?
55.7% of People are in the Labor Force in Rome City.
What is the Unemployment Rate in Rome City?
Unemployment Rate in Rome City is 4.4%.