Zip Codes with the Highest Percentage of Population Employed in Firefighting & Prevention in Indianapolis, IN

RELATED REPORTS & OPTIONS

Firefighting & Prevention
Population
Families and Households
Female Fertility
Female Fertility (Unmarried)
Race (Community Size)
Race (Percentage)
Ancestry (Community Size)
AfghanAfricanAlaskan AthabascanAlbanianAlsatianAmericanApacheArabArgentineanArmenianAustralianAustrianBahamianBangladeshiBarbadianBasqueBelgianBelizeanBhutaneseBlackfeetBolivianBrazilianBritishBritish West IndianBulgarianBurmeseCajunCanadianCelticCentral AmericanCentral American IndianCherokeeChickasawChileanChippewaChoctawColombianCosta RicanCroatianCrowCubanCzechCzechoslovakianDanishDominicanDutchEastern EuropeanEcuadorianEgyptianEnglishEstonianEthiopianEuropeanFilipinoFinnishFrenchFrench CanadianGermanGerman RussianGhanaianGreekGuamanian / ChamorroGuatemalanGuyaneseHaitianHonduranHopiHungarianIcelanderIndian (Asian)IndonesianInupiatIranianIraqiIrishIroquoisIsraeliItalianJamaicanJapaneseJordanianKenyanKoreanLaotianLatvianLebaneseLiberianLithuanianLuxembourgerMacedonianMalaysianMenomineeMexicanMexican American IndianMongolianMoroccanNative HawaiianNavajoNew ZealanderNicaraguanNigerianNorthern EuropeanNorwegianPakistaniPalestinianPanamanianPennsylvania GermanPeruvianPolishPortuguesePotawatomiPuerto RicanRomanianRussianSalvadoranSamoanScandinavianScotch-IrishScottishSeminoleSenegaleseSerbianSierra LeoneanSiouxSlavicSlovakSloveneSouth AfricanSouth AmericanSouth American IndianSpaniardSpanishSri LankanSubsaharan AfricanSudaneseSwedishSwissSyrianThaiTonganTrinidadian and TobagonianTurkishUgandanUkrainianUruguayanVenezuelanVietnameseWelshWest IndianYugoslavianZimbabwean
Ancestry (Percentage)
AfghanAfricanAlaskan AthabascanAlbanianAlsatianAmericanApacheArabArgentineanArmenianAustralianAustrianBahamianBangladeshiBarbadianBasqueBelgianBelizeanBhutaneseBlackfeetBolivianBrazilianBritishBritish West IndianBulgarianBurmeseCajunCanadianCelticCentral AmericanCentral American IndianCherokeeChickasawChileanChippewaChoctawColombianCosta RicanCroatianCrowCubanCzechCzechoslovakianDanishDominicanDutchEastern EuropeanEcuadorianEgyptianEnglishEstonianEthiopianEuropeanFilipinoFinnishFrenchFrench CanadianGermanGerman RussianGhanaianGreekGuamanian / ChamorroGuatemalanGuyaneseHaitianHonduranHopiHungarianIcelanderIndian (Asian)IndonesianInupiatIranianIraqiIrishIroquoisIsraeliItalianJamaicanJapaneseJordanianKenyanKoreanLaotianLatvianLebaneseLiberianLithuanianLuxembourgerMacedonianMalaysianMenomineeMexicanMexican American IndianMongolianMoroccanNative HawaiianNavajoNew ZealanderNicaraguanNigerianNorthern EuropeanNorwegianPakistaniPalestinianPanamanianPennsylvania GermanPeruvianPolishPortuguesePotawatomiPuerto RicanRomanianRussianSalvadoranSamoanScandinavianScotch-IrishScottishSeminoleSenegaleseSerbianSierra LeoneanSiouxSlavicSlovakSloveneSouth AfricanSouth AmericanSouth American IndianSpaniardSpanishSri LankanSubsaharan AfricanSudaneseSwedishSwissSyrianThaiTonganTrinidadian and TobagonianTurkishUgandanUkrainianUruguayanVenezuelanVietnameseWelshWest IndianYugoslavianZimbabwean
Immigrant Origin (Total)
AfghanistanAfricaArgentinaAsiaAustraliaAustriaBahamasBangladeshBarbadosBelarusBoliviaBosnia and HerzegovinaBrazilBulgariaBurma / MyanmarCambodiaCameroonCanadaCaribbeanCentral AmericaChileChinaColombiaCongoCosta RicaCubaDenmarkDominican RepublicEastern AfricaEastern AsiaEastern EuropeEcuadorEgyptEl SalvadorEnglandEritreaEthiopiaEuropeFranceGermanyGhanaGreeceGuatemalaGuyanaHaitiHondurasHong KongHungaryIndiaIndonesiaIranIraqIrelandIsraelItalyJamaicaJapanJordanKenyaKoreaLaosLatin AmericaLatviaLebanonLiberiaMalaysiaMexicoMiddle AfricaMoldovaMoroccoNepalNetherlandsNicaraguaNigeriaNorth MacedoniaNorthern AfricaNorthern EuropeNorwayOceaniaPakistanPanamaPeruPhilippinesPolandPortugalRomaniaRussiaSaudi ArabiaScotlandSenegalSerbiaSierra LeoneSingaporeSouth AfricaSouth AmericaSouth Central AsiaSouth Eastern AsiaSouthern EuropeSpainSt. Vincent and the GrenadinesSudanSyriaTaiwanThailandTrinidad and TobagoTurkeyUgandaUkraineUzbekistanVenezuelaVietnamWest IndiesWestern AfricaWestern AsiaWestern EuropeYemenZaireZimbabwe
Immigrant Origin (Percentage)
AfghanistanAfricaArgentinaAsiaAustraliaAustriaBahamasBangladeshBarbadosBelarusBoliviaBosnia and HerzegovinaBrazilBulgariaBurma / MyanmarCambodiaCameroonCanadaCaribbeanCentral AmericaChileChinaColombiaCongoCosta RicaCubaDenmarkDominican RepublicEastern AfricaEastern AsiaEastern EuropeEcuadorEgyptEl SalvadorEnglandEritreaEthiopiaEuropeFranceGermanyGhanaGreeceGuatemalaGuyanaHaitiHondurasHong KongHungaryIndiaIndonesiaIranIraqIrelandIsraelItalyJamaicaJapanJordanKenyaKoreaLaosLatin AmericaLatviaLebanonLiberiaMalaysiaMexicoMiddle AfricaMoldovaMoroccoNepalNetherlandsNicaraguaNigeriaNorth MacedoniaNorthern AfricaNorthern EuropeNorwayOceaniaPakistanPanamaPeruPhilippinesPolandPortugalRomaniaRussiaSaudi ArabiaScotlandSenegalSerbiaSierra LeoneSingaporeSouth AfricaSouth AmericaSouth Central AsiaSouth Eastern AsiaSouthern EuropeSpainSt. Vincent and the GrenadinesSudanSyriaTaiwanThailandTrinidad and TobagoTurkeyUgandaUkraineUzbekistanVenezuelaVietnamWest IndiesWestern AfricaWestern AsiaWestern EuropeYemenZaireZimbabwe
Income
Income (Families)
Income (Households)
Poverty
Poverty (Families)
Unemployment
Employment Occupations
Employment Industries
Employer Class
Commute Time
Commute Means
School Enrollment
Education by Degree Field
Occupancy
Finances
Physical Characteristics
Indianapolis
Compare Zip Codes
Comparison Subject

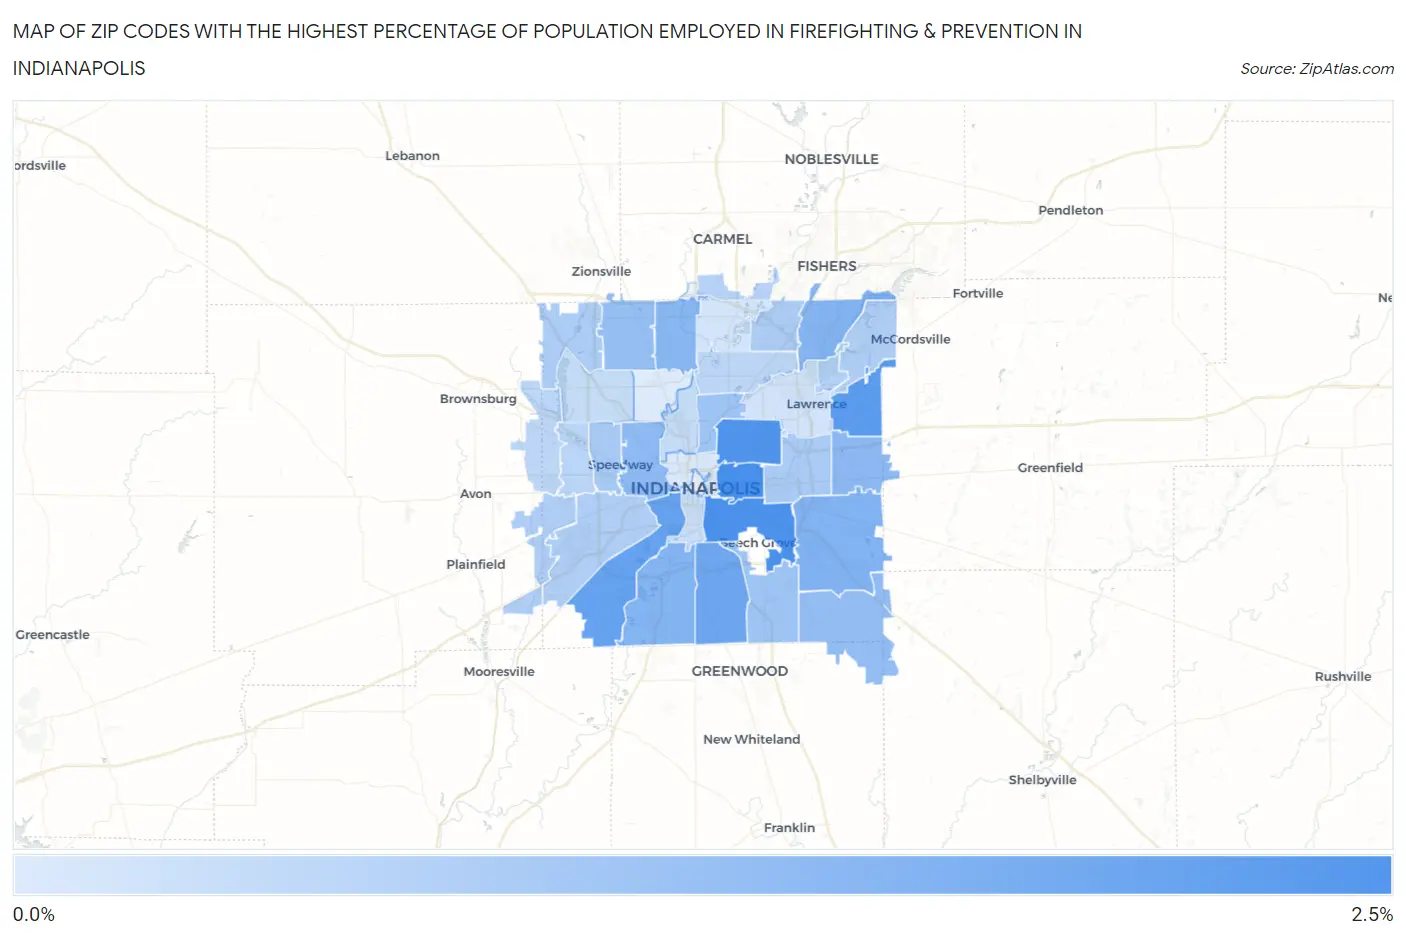
Map of Zip Codes with the Highest Percentage of Population Employed in Firefighting & Prevention in Indianapolis

0.0%
2.5%
Zip Codes with the Highest Percentage of Population Employed in Firefighting & Prevention in Indianapolis Map

Zip Codes with the Highest Percentage of Population Employed in Firefighting & Prevention in Indianapolis, IN

Zip Code % Employed vs State vs National
1.462012.4%0.91%(+1.52)#541.2%(+1.24)#3,275
2.462032.4%0.91%(+1.46)#581.2%(+1.18)#3,414
3.462182.3%0.91%(+1.39)#631.2%(+1.11)#3,588
4.462352.1%0.91%(+1.20)#731.2%(+0.923)#4,129
5.462212.0%0.91%(+1.06)#831.2%(+0.778)#4,653
6.462271.8%0.91%(+0.922)#941.2%(+0.642)#5,223
7.462391.5%0.91%(+0.625)#1221.2%(+0.345)#6,777
8.462171.5%0.91%(+0.587)#1281.2%(+0.307)#7,019
9.462561.5%0.91%(+0.564)#1341.2%(+0.284)#7,177
10.462601.4%0.91%(+0.523)#1411.2%(+0.243)#7,450
11.462291.4%0.91%(+0.460)#1511.2%(+0.180)#7,854
12.462221.3%0.91%(+0.410)#1571.2%(+0.130)#8,239
13.462591.3%0.91%(+0.346)#1681.2%(+0.066)#8,743
14.462681.2%0.91%(+0.326)#1731.2%(+0.046)#8,885
15.462371.1%0.91%(+0.188)#1921.2%(-0.092)#10,161
16.462051.1%0.91%(+0.173)#1981.2%(-0.107)#10,289
17.462240.93%0.91%(+0.025)#2381.2%(-0.255)#11,823
18.462190.91%0.91%(+0.007)#2461.2%(-0.273)#12,020
19.462780.89%0.91%(-0.019)#2511.2%(-0.299)#12,299
20.462500.86%0.91%(-0.044)#2561.2%(-0.324)#12,554
21.462410.85%0.91%(-0.057)#2591.2%(-0.337)#12,685
22.462310.82%0.91%(-0.081)#2661.2%(-0.361)#12,922
23.462360.81%0.91%(-0.097)#2731.2%(-0.377)#13,114
24.462800.74%0.91%(-0.162)#2891.2%(-0.442)#13,828
25.462160.73%0.91%(-0.179)#2961.2%(-0.459)#14,026
26.462140.65%0.91%(-0.251)#3211.2%(-0.531)#14,850
27.462200.63%0.91%(-0.274)#3271.2%(-0.554)#15,086
28.462340.63%0.91%(-0.276)#3281.2%(-0.556)#15,102
29.462080.50%0.91%(-0.405)#3681.2%(-0.685)#16,534
30.462540.49%0.91%(-0.415)#3741.2%(-0.695)#16,658
31.462250.43%0.91%(-0.473)#3921.2%(-0.753)#17,297
32.462260.32%0.91%(-0.582)#4251.2%(-0.863)#18,511
33.462400.28%0.91%(-0.626)#4431.2%(-0.906)#18,957
34.462020.17%0.91%(-0.739)#4821.2%(-1.02)#19,919
35.462280.15%0.91%(-0.759)#4891.2%(-1.04)#20,049

Common Questions

What are the Top 10 Zip Codes with the Highest Percentage of Population Employed in Firefighting & Prevention in Indianapolis, IN?
Top 10 Zip Codes with the Highest Percentage of Population Employed in Firefighting & Prevention in Indianapolis, IN are:
#1
2.4%
#2
2.4%
#3
2.3%
#4
2.1%
#5
2.0%
#6
1.8%
#7
1.5%
#8
1.5%
#9
1.5%
#10
1.4%
What zip code has the Highest Percentage of Population Employed in Firefighting & Prevention in Indianapolis, IN?
46201 has the Highest Percentage of Population Employed in Firefighting & Prevention in Indianapolis, IN with 2.4%.
What is the Percentage of Population Employed in Firefighting & Prevention in Indianapolis, IN?
Percentage of Population Employed in Firefighting & Prevention in Indianapolis is 1.2%.
What is the Percentage of Population Employed in Firefighting & Prevention in Indiana?
Percentage of Population Employed in Firefighting & Prevention in Indiana is 0.91%.
What is the Percentage of Population Employed in Firefighting & Prevention in the United States?
Percentage of Population Employed in Firefighting & Prevention in the United States is 1.2%.