Cloverdale, IN Map & Demographics
Cloverdale Map
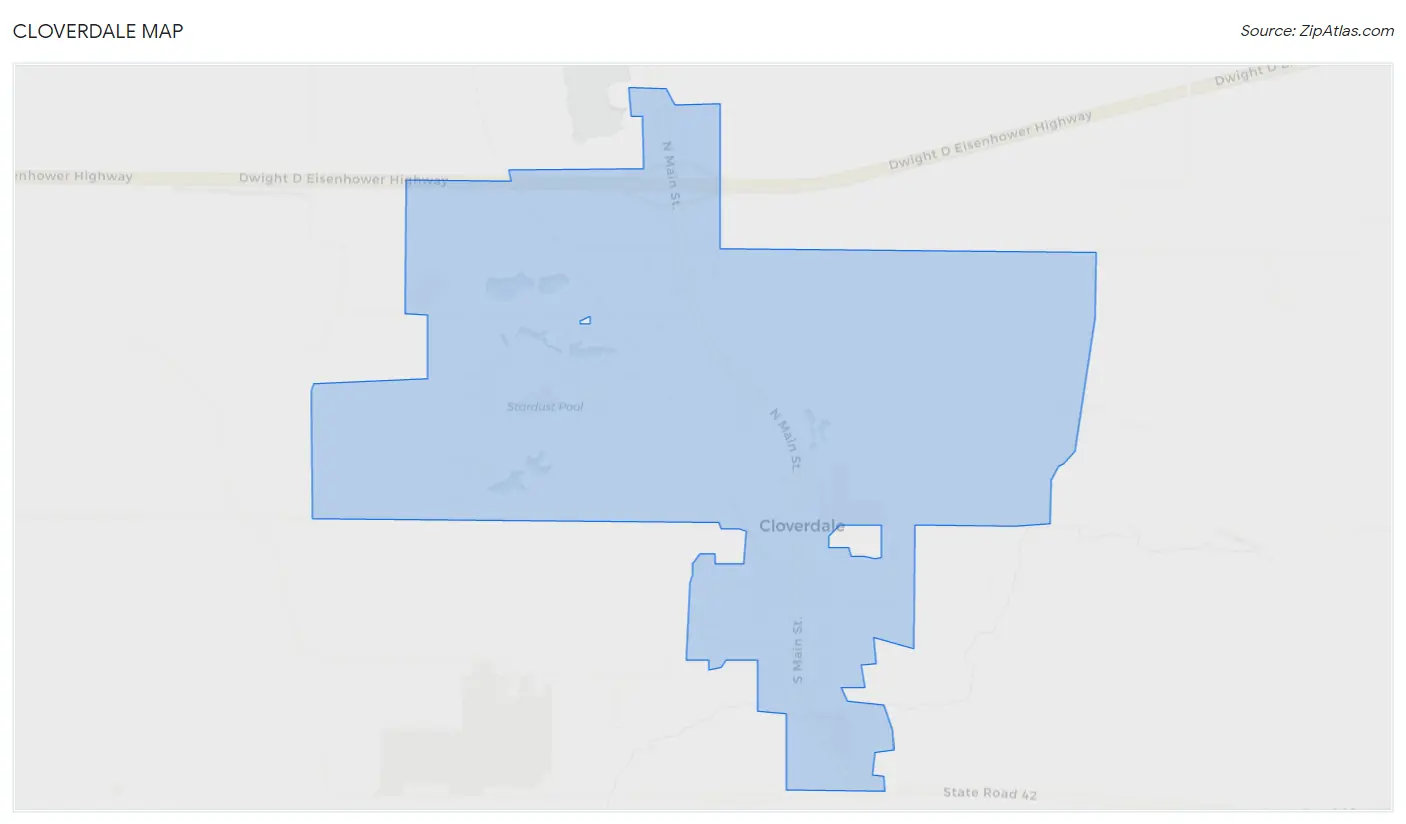
Cloverdale Overview
$25,116
PER CAPITA INCOME
$60,313
AVG FAMILY INCOME
$46,354
AVG HOUSEHOLD INCOME
34.0%
WAGE / INCOME GAP [ % ]
66.0¢/ $1
WAGE / INCOME GAP [ $ ]
0.36
INEQUALITY / GINI INDEX
2,201
TOTAL POPULATION
1,063
MALE POPULATION
1,138
FEMALE POPULATION
93.41
MALES / 100 FEMALES
107.06
FEMALES / 100 MALES
45.2
MEDIAN AGE
2.8
AVG FAMILY SIZE
2.3
AVG HOUSEHOLD SIZE
1,082
LABOR FORCE [ PEOPLE ]
60.0%
PERCENT IN LABOR FORCE
6.6%
UNEMPLOYMENT RATE
Cloverdale Zip Codes
Cloverdale Area Codes
Income in Cloverdale
Income Overview in Cloverdale
Per Capita Income in Cloverdale is $25,116, while median incomes of families and households are $60,313 and $46,354 respectively.
| Characteristic | Number | Measure |
| Per Capita Income | 2,201 | $25,116 |
| Median Family Income | 619 | $60,313 |
| Mean Family Income | 619 | $74,111 |
| Median Household Income | 950 | $46,354 |
| Mean Household Income | 950 | $62,481 |
| Income Deficit | 619 | $0 |
| Wage / Income Gap (%) | 2,201 | 34.00% |
| Wage / Income Gap ($) | 2,201 | 66.00¢ per $1 |
| Gini / Inequality Index | 2,201 | 0.36 |
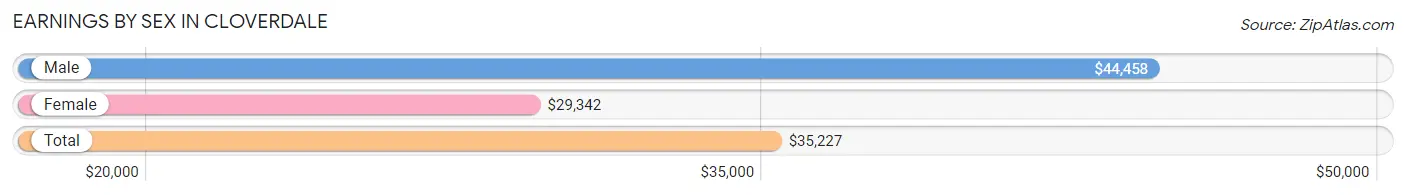
Earnings by Sex in Cloverdale
Average Earnings in Cloverdale are $35,227, $44,458 for men and $29,342 for women, a difference of 34.0%.
| Sex | Number | Average Earnings |
| Male | 560 (51.9%) | $44,458 |
| Female | 518 (48.0%) | $29,342 |
| Total | 1,078 (100.0%) | $35,227 |
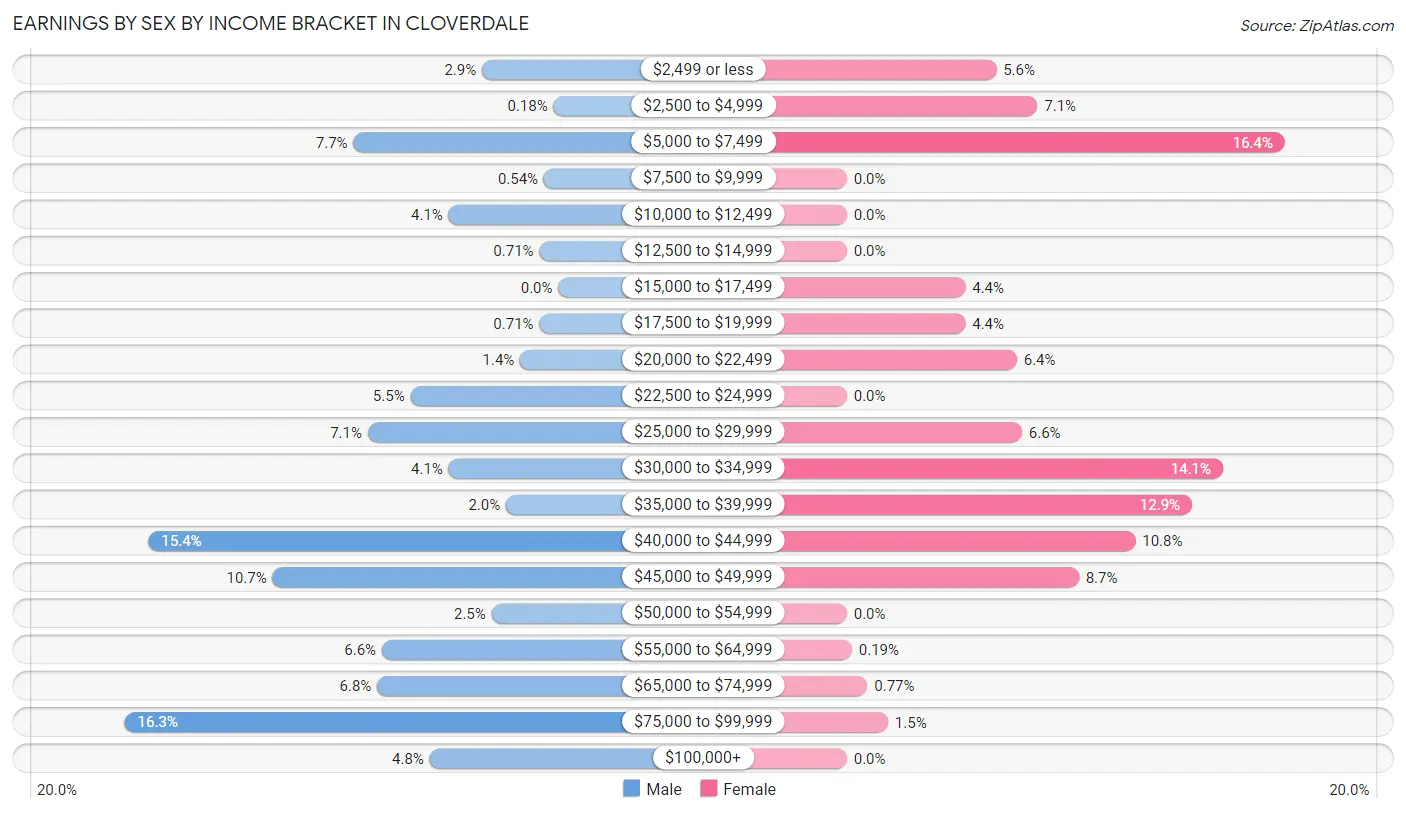
Earnings by Sex by Income Bracket in Cloverdale
The most common earnings brackets in Cloverdale are $75,000 to $99,999 for men (91 | 16.3%) and $5,000 to $7,499 for women (85 | 16.4%).
| Income | Male | Female |
| $2,499 or less | 16 (2.9%) | 29 (5.6%) |
| $2,500 to $4,999 | 1 (0.2%) | 37 (7.1%) |
| $5,000 to $7,499 | 43 (7.7%) | 85 (16.4%) |
| $7,500 to $9,999 | 3 (0.5%) | 0 (0.0%) |
| $10,000 to $12,499 | 23 (4.1%) | 0 (0.0%) |
| $12,500 to $14,999 | 4 (0.7%) | 0 (0.0%) |
| $15,000 to $17,499 | 0 (0.0%) | 23 (4.4%) |
| $17,500 to $19,999 | 4 (0.7%) | 23 (4.4%) |
| $20,000 to $22,499 | 8 (1.4%) | 33 (6.4%) |
| $22,500 to $24,999 | 31 (5.5%) | 0 (0.0%) |
| $25,000 to $29,999 | 40 (7.1%) | 34 (6.6%) |
| $30,000 to $34,999 | 23 (4.1%) | 73 (14.1%) |
| $35,000 to $39,999 | 11 (2.0%) | 67 (12.9%) |
| $40,000 to $44,999 | 86 (15.4%) | 56 (10.8%) |
| $45,000 to $49,999 | 60 (10.7%) | 45 (8.7%) |
| $50,000 to $54,999 | 14 (2.5%) | 0 (0.0%) |
| $55,000 to $64,999 | 37 (6.6%) | 1 (0.2%) |
| $65,000 to $74,999 | 38 (6.8%) | 4 (0.8%) |
| $75,000 to $99,999 | 91 (16.3%) | 8 (1.5%) |
| $100,000+ | 27 (4.8%) | 0 (0.0%) |
| Total | 560 (100.0%) | 518 (100.0%) |
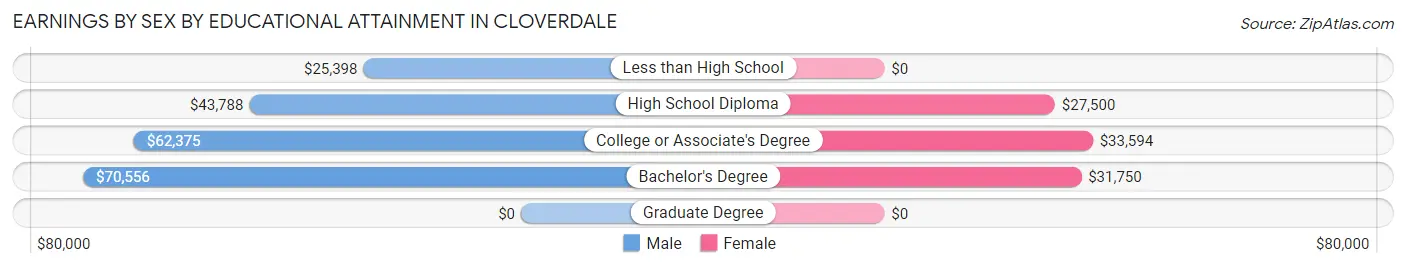
Earnings by Sex by Educational Attainment in Cloverdale
Average earnings in Cloverdale are $44,667 for men and $30,889 for women, a difference of 30.8%. Men with an educational attainment of bachelor's degree enjoy the highest average annual earnings of $70,556, while those with less than high school education earn the least with $25,398. Women with an educational attainment of college or associate's degree earn the most with the average annual earnings of $33,594, while those with high school diploma education have the smallest earnings of $27,500.
| Educational Attainment | Male Income | Female Income |
| Less than High School | $25,398 | $0 |
| High School Diploma | $43,788 | $27,500 |
| College or Associate's Degree | $62,375 | $33,594 |
| Bachelor's Degree | $70,556 | $31,750 |
| Graduate Degree | - | - |
| Total | $44,667 | $30,889 |
Family Income in Cloverdale
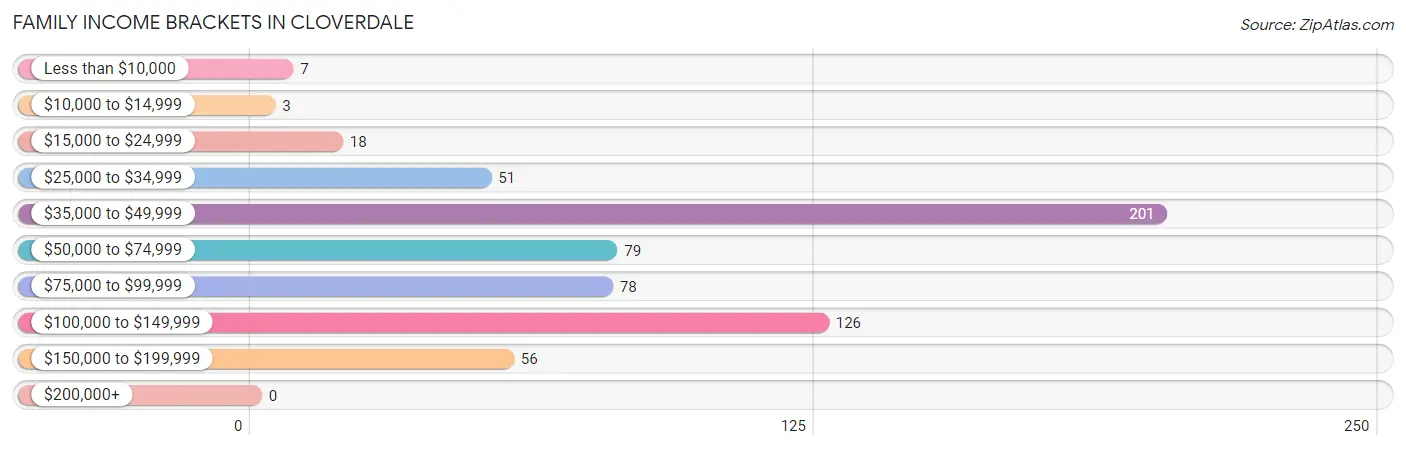
Family Income Brackets in Cloverdale
According to the Cloverdale family income data, there are 201 families falling into the $35,000 to $49,999 income range, which is the most common income bracket and makes up 32.5% of all families.
| Income Bracket | # Families | % Families |
| Less than $10,000 | 7 | 1.1% |
| $10,000 to $14,999 | 3 | 0.5% |
| $15,000 to $24,999 | 18 | 2.9% |
| $25,000 to $34,999 | 51 | 8.2% |
| $35,000 to $49,999 | 201 | 32.5% |
| $50,000 to $74,999 | 79 | 12.8% |
| $75,000 to $99,999 | 78 | 12.6% |
| $100,000 to $149,999 | 126 | 20.4% |
| $150,000 to $199,999 | 56 | 9.0% |
| $200,000+ | 0 | 0.0% |
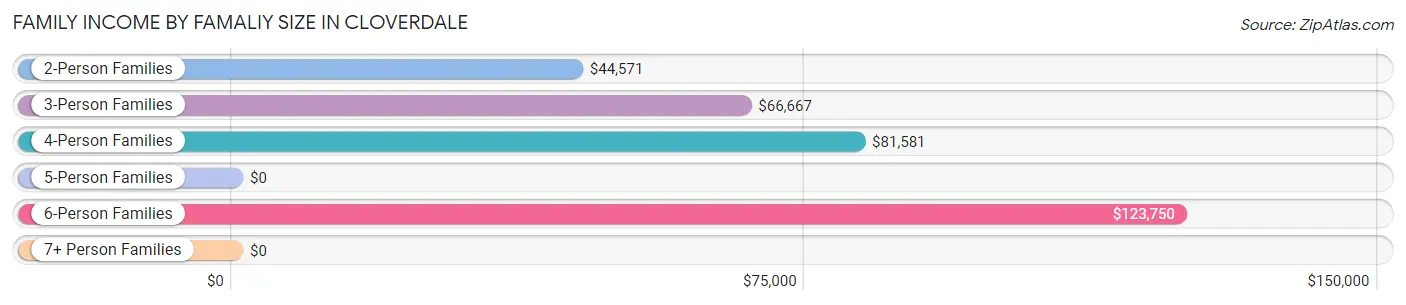
Family Income by Famaliy Size in Cloverdale
6-person families (39 | 6.3%) account for the highest median family income in Cloverdale with $123,750 per family, while 2-person families (346 | 55.9%) have the highest median income of $22,286 per family member.
| Income Bracket | # Families | Median Income |
| 2-Person Families | 346 (55.9%) | $44,571 |
| 3-Person Families | 74 (11.9%) | $66,667 |
| 4-Person Families | 109 (17.6%) | $81,581 |
| 5-Person Families | 51 (8.2%) | $0 |
| 6-Person Families | 39 (6.3%) | $123,750 |
| 7+ Person Families | 0 (0.0%) | $0 |
| Total | 619 (100.0%) | $60,313 |
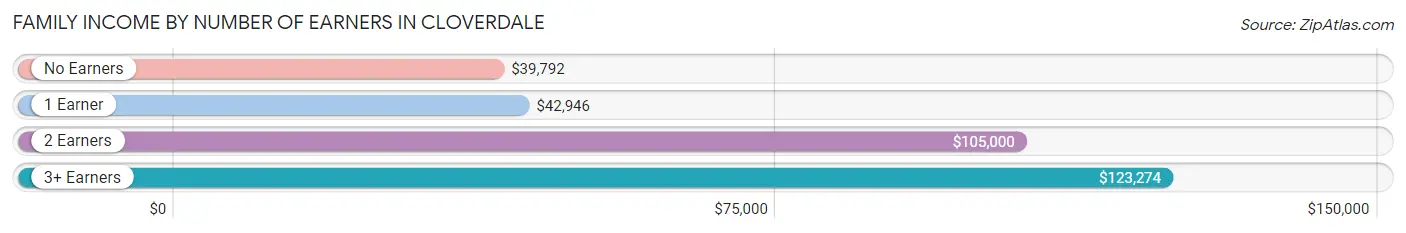
Family Income by Number of Earners in Cloverdale
The median family income in Cloverdale is $60,313, with families comprising 3+ earners (51) having the highest median family income of $123,274, while families with no earners (78) have the lowest median family income of $39,792, accounting for 8.2% and 12.6% of families, respectively.
| Number of Earners | # Families | Median Income |
| No Earners | 78 (12.6%) | $39,792 |
| 1 Earner | 288 (46.5%) | $42,946 |
| 2 Earners | 202 (32.6%) | $105,000 |
| 3+ Earners | 51 (8.2%) | $123,274 |
| Total | 619 (100.0%) | $60,313 |
Household Income in Cloverdale
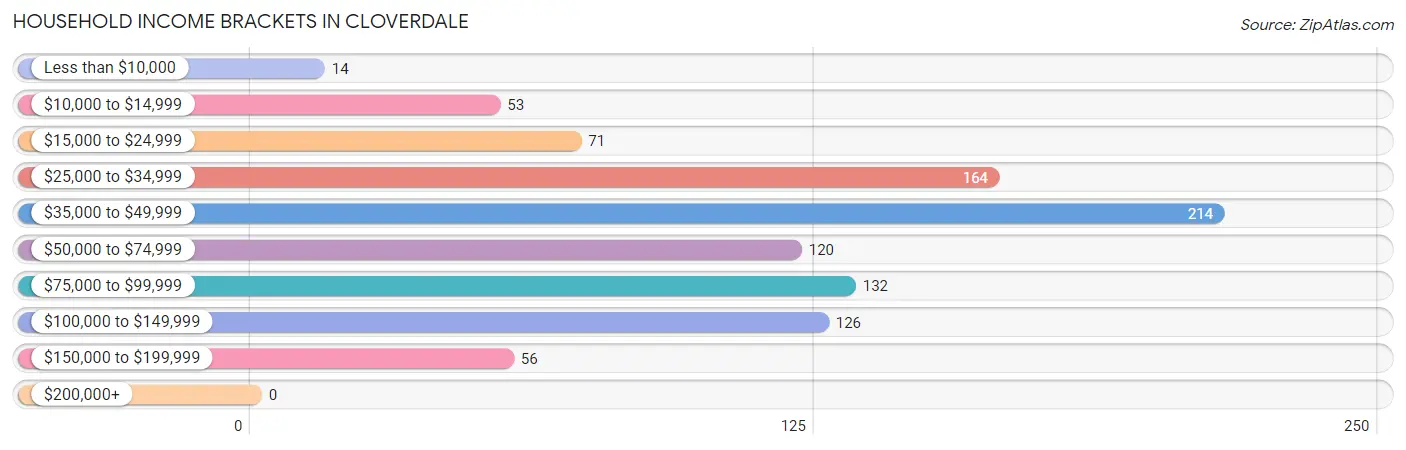
Household Income Brackets in Cloverdale
With 214 households falling in the category, the $35,000 to $49,999 income range is the most frequent in Cloverdale, accounting for 22.5% of all households.
| Income Bracket | # Households | % Households |
| Less than $10,000 | 14 | 1.5% |
| $10,000 to $14,999 | 53 | 5.6% |
| $15,000 to $24,999 | 71 | 7.5% |
| $25,000 to $34,999 | 164 | 17.3% |
| $35,000 to $49,999 | 214 | 22.5% |
| $50,000 to $74,999 | 120 | 12.6% |
| $75,000 to $99,999 | 132 | 13.9% |
| $100,000 to $149,999 | 126 | 13.3% |
| $150,000 to $199,999 | 56 | 5.9% |
| $200,000+ | 0 | 0.0% |
Household Income by Householder Age in Cloverdale
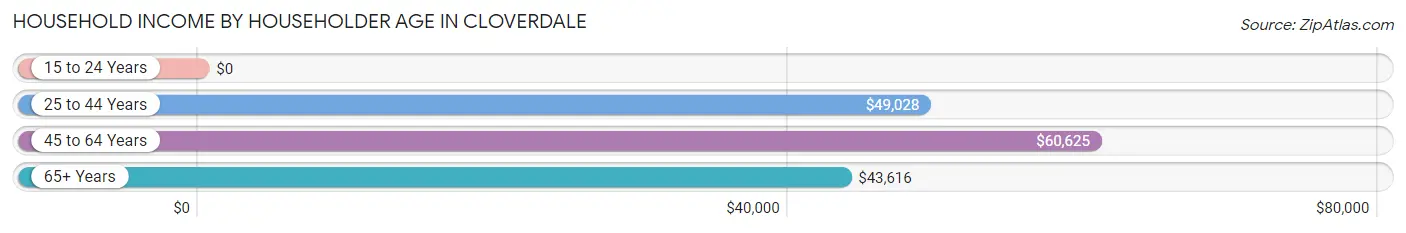
The median household income in Cloverdale is $46,354, with the highest median household income of $60,625 found in the 45 to 64 years age bracket for the primary householder. A total of 384 households (40.4%) fall into this category. Meanwhile, the 15 to 24 years age bracket for the primary householder has the lowest median household income of $0, with 16 households (1.7%) in this group.
| Income Bracket | # Households | Median Income |
| 15 to 24 Years | 16 (1.7%) | $0 |
| 25 to 44 Years | 295 (31.0%) | $49,028 |
| 45 to 64 Years | 384 (40.4%) | $60,625 |
| 65+ Years | 255 (26.8%) | $43,616 |
| Total | 950 (100.0%) | $46,354 |
Poverty in Cloverdale
Income Below Poverty by Sex and Age in Cloverdale
With 9.6% poverty level for males and 9.5% for females among the residents of Cloverdale, under 5 year old males and 75 year old and over females are the most vulnerable to poverty, with 21 males (35.6%) and 30 females (45.5%) in their respective age groups living below the poverty level.
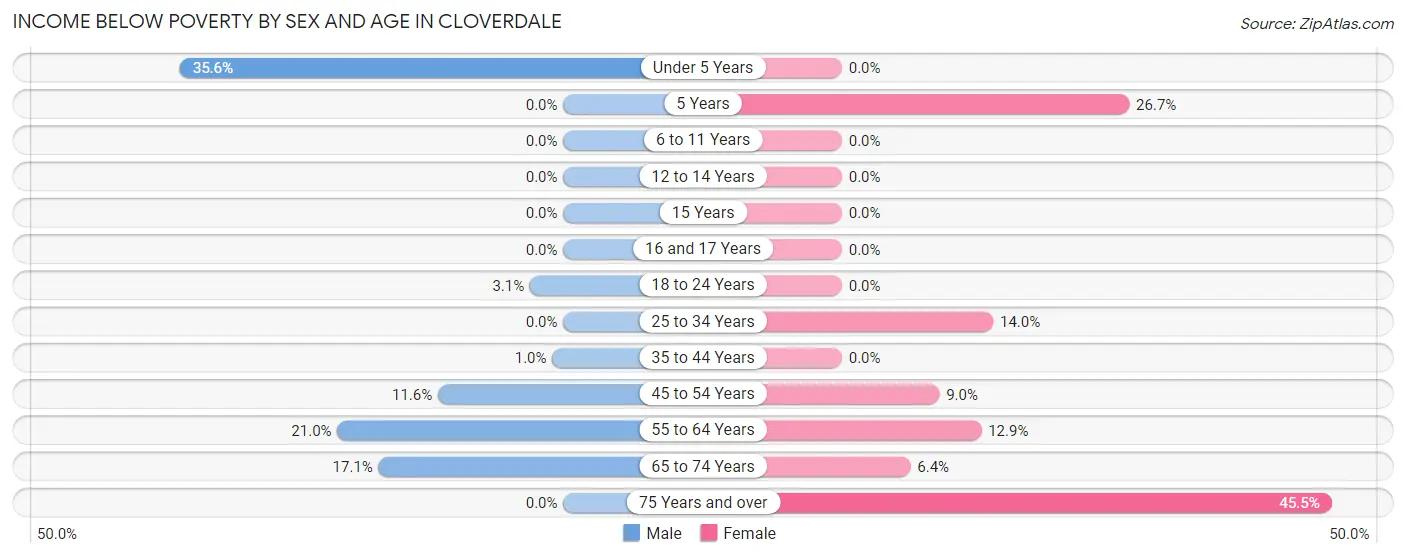
| Age Bracket | Male | Female |
| Under 5 Years | 21 (35.6%) | 0 (0.0%) |
| 5 Years | 0 (0.0%) | 12 (26.7%) |
| 6 to 11 Years | 0 (0.0%) | 0 (0.0%) |
| 12 to 14 Years | 0 (0.0%) | 0 (0.0%) |
| 15 Years | 0 (0.0%) | 0 (0.0%) |
| 16 and 17 Years | 0 (0.0%) | 0 (0.0%) |
| 18 to 24 Years | 5 (3.1%) | 0 (0.0%) |
| 25 to 34 Years | 0 (0.0%) | 16 (14.0%) |
| 35 to 44 Years | 1 (1.0%) | 0 (0.0%) |
| 45 to 54 Years | 15 (11.6%) | 15 (9.0%) |
| 55 to 64 Years | 39 (21.0%) | 22 (12.9%) |
| 65 to 74 Years | 18 (17.1%) | 11 (6.4%) |
| 75 Years and over | 0 (0.0%) | 30 (45.5%) |
| Total | 99 (9.6%) | 106 (9.5%) |
Income Above Poverty by Sex and Age in Cloverdale
According to the poverty statistics in Cloverdale, males aged 5 years and females aged under 5 years are the age groups that are most secure financially, with 100.0% of males and 100.0% of females in these age groups living above the poverty line.
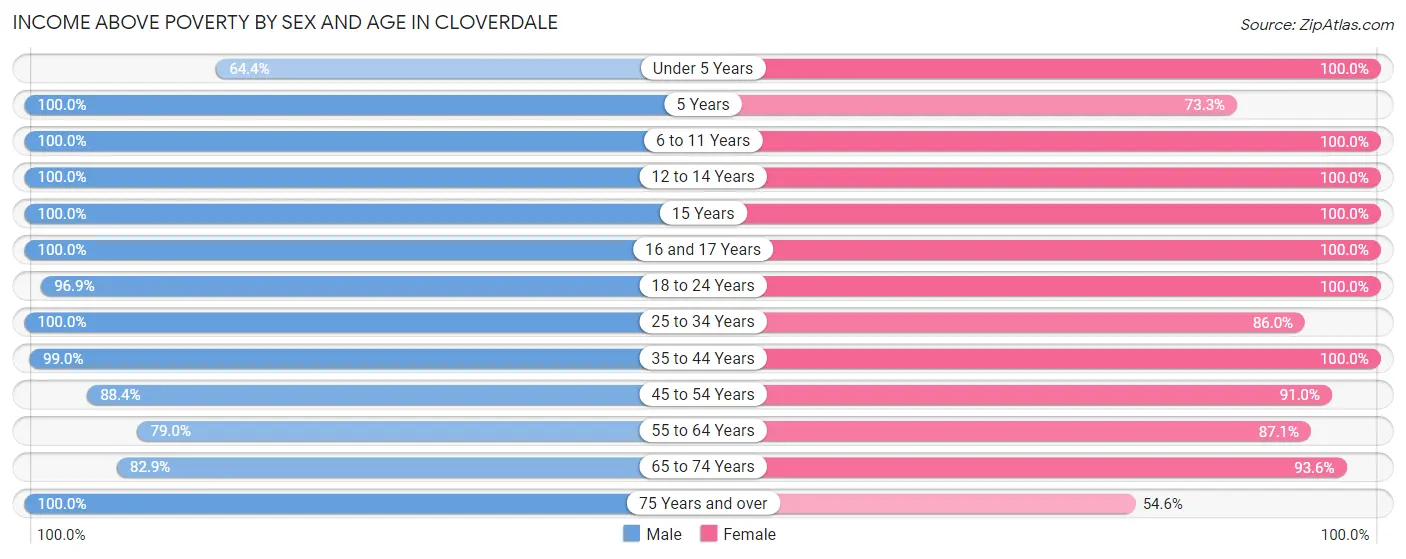
| Age Bracket | Male | Female |
| Under 5 Years | 38 (64.4%) | 21 (100.0%) |
| 5 Years | 13 (100.0%) | 33 (73.3%) |
| 6 to 11 Years | 58 (100.0%) | 65 (100.0%) |
| 12 to 14 Years | 46 (100.0%) | 76 (100.0%) |
| 15 Years | 5 (100.0%) | 9 (100.0%) |
| 16 and 17 Years | 2 (100.0%) | 23 (100.0%) |
| 18 to 24 Years | 157 (96.9%) | 59 (100.0%) |
| 25 to 34 Years | 105 (100.0%) | 98 (86.0%) |
| 35 to 44 Years | 97 (99.0%) | 133 (100.0%) |
| 45 to 54 Years | 114 (88.4%) | 151 (91.0%) |
| 55 to 64 Years | 147 (79.0%) | 148 (87.1%) |
| 65 to 74 Years | 87 (82.9%) | 162 (93.6%) |
| 75 Years and over | 69 (100.0%) | 36 (54.5%) |
| Total | 938 (90.4%) | 1,014 (90.5%) |
Income Below Poverty Among Married-Couple Families in Cloverdale
The poverty statistics for married-couple families in Cloverdale show that 3.7% or 18 of the total 484 families live below the poverty line. Families with 1 or 2 children have the highest poverty rate of 17.4%, comprising of 15 families. On the other hand, families with 3 or 4 children have the lowest poverty rate of 0.0%, which includes 0 families.
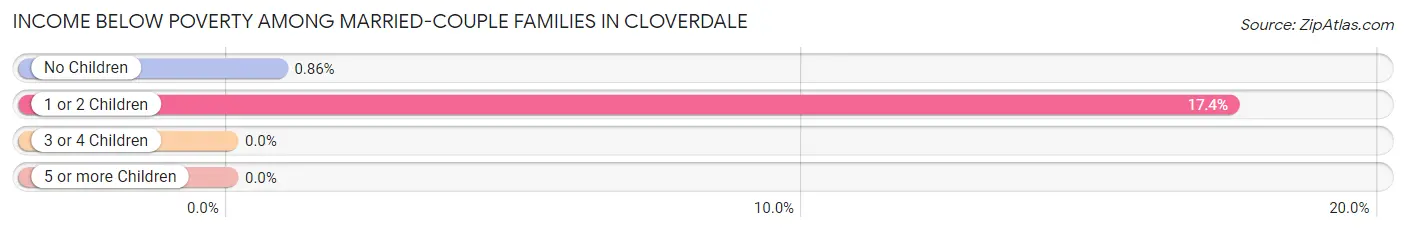
| Children | Above Poverty | Below Poverty |
| No Children | 344 (99.1%) | 3 (0.9%) |
| 1 or 2 Children | 71 (82.6%) | 15 (17.4%) |
| 3 or 4 Children | 51 (100.0%) | 0 (0.0%) |
| 5 or more Children | 0 (0.0%) | 0 (0.0%) |
| Total | 466 (96.3%) | 18 (3.7%) |
Income Below Poverty Among Single-Parent Households in Cloverdale
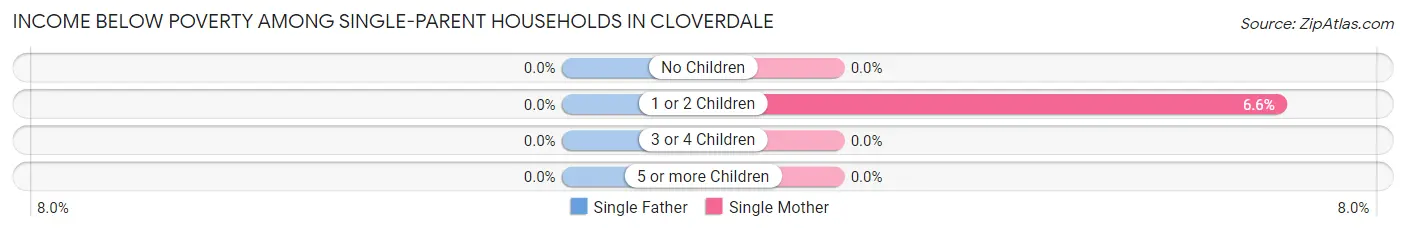
| Children | Single Father | Single Mother |
| No Children | 0 (0.0%) | 0 (0.0%) |
| 1 or 2 Children | 0 (0.0%) | 7 (6.6%) |
| 3 or 4 Children | 0 (0.0%) | 0 (0.0%) |
| 5 or more Children | 0 (0.0%) | 0 (0.0%) |
| Total | 0 (0.0%) | 7 (5.7%) |
Income Below Poverty Among Married-Couple vs Single-Parent Households in Cloverdale
The poverty data for Cloverdale shows that 18 of the married-couple family households (3.7%) and 7 of the single-parent households (5.2%) are living below the poverty level. Within the married-couple family households, those with 1 or 2 children have the highest poverty rate, with 15 households (17.4%) falling below the poverty line. Among the single-parent households, those with 1 or 2 children have the highest poverty rate, with 7 household (6.2%) living below poverty.
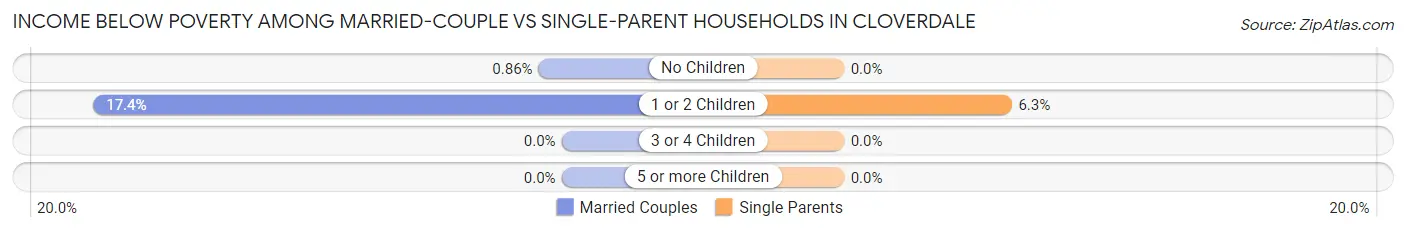
| Children | Married-Couple Families | Single-Parent Households |
| No Children | 3 (0.9%) | 0 (0.0%) |
| 1 or 2 Children | 15 (17.4%) | 7 (6.2%) |
| 3 or 4 Children | 0 (0.0%) | 0 (0.0%) |
| 5 or more Children | 0 (0.0%) | 0 (0.0%) |
| Total | 18 (3.7%) | 7 (5.2%) |
Race in Cloverdale
The most populous races in Cloverdale are White / Caucasian (2,155 | 97.9%), Some other Race (19 | 0.9%), and Two or more Races (17 | 0.8%).
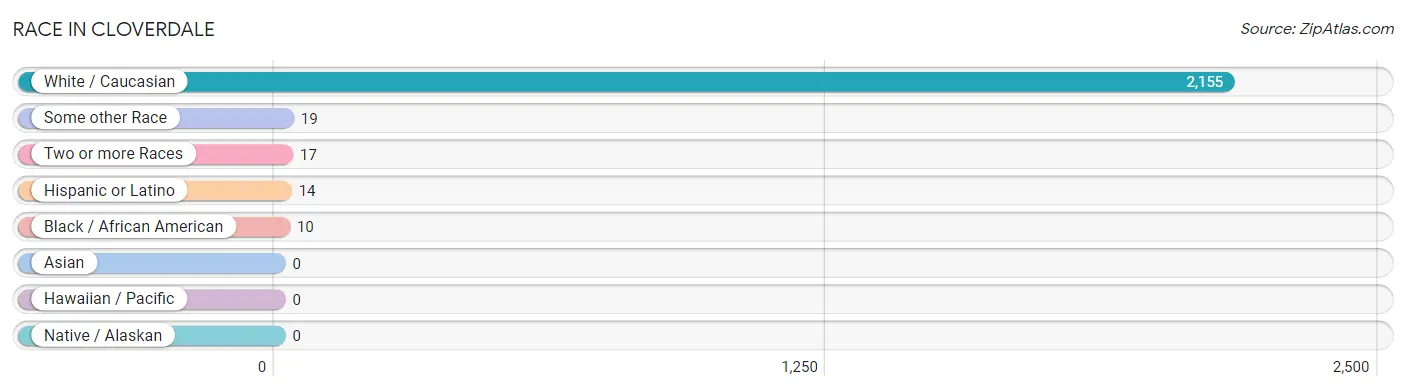
| Race | # Population | % Population |
| Asian | 0 | 0.0% |
| Black / African American | 10 | 0.4% |
| Hawaiian / Pacific | 0 | 0.0% |
| Hispanic or Latino | 14 | 0.6% |
| Native / Alaskan | 0 | 0.0% |
| White / Caucasian | 2,155 | 97.9% |
| Two or more Races | 17 | 0.8% |
| Some other Race | 19 | 0.9% |
| Total | 2,201 | 100.0% |
Ancestry in Cloverdale
The most populous ancestries reported in Cloverdale are American (262 | 11.9%), German (185 | 8.4%), English (182 | 8.3%), Irish (182 | 8.3%), and Polish (70 | 3.2%), together accounting for 40.0% of all Cloverdale residents.
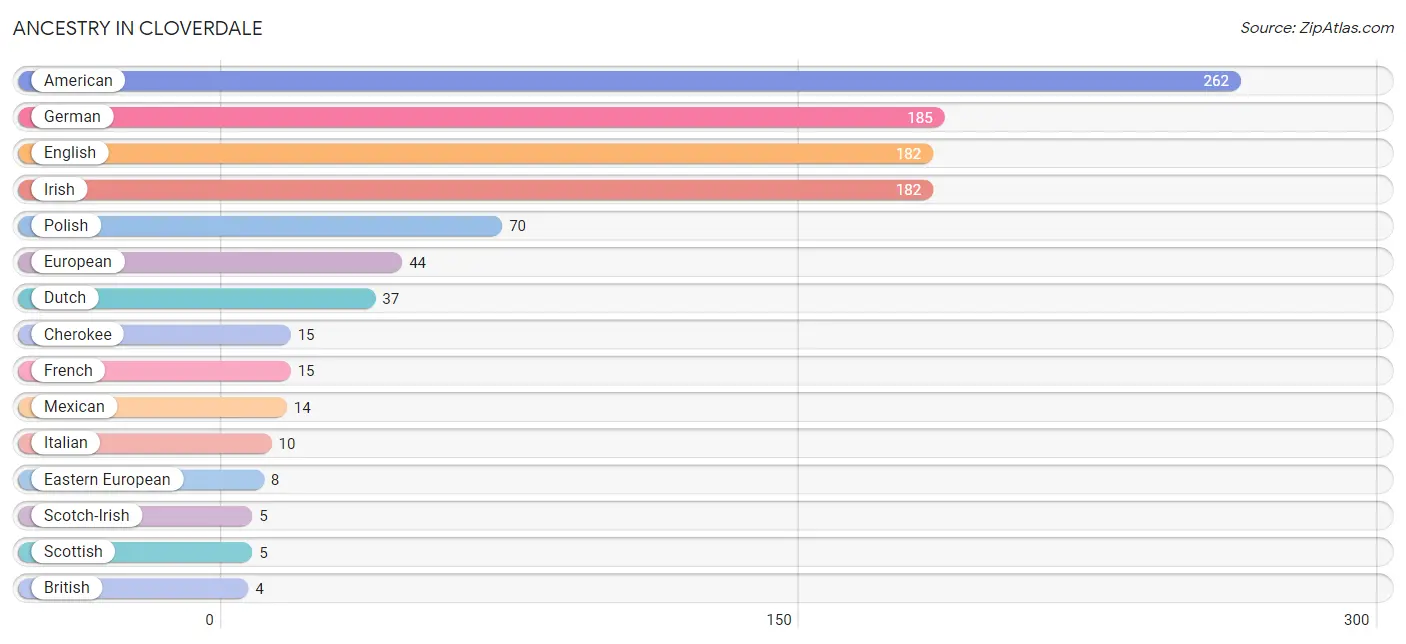
| Ancestry | # Population | % Population |
| American | 262 | 11.9% |
| British | 4 | 0.2% |
| Cherokee | 15 | 0.7% |
| Dutch | 37 | 1.7% |
| Eastern European | 8 | 0.4% |
| English | 182 | 8.3% |
| European | 44 | 2.0% |
| French | 15 | 0.7% |
| German | 185 | 8.4% |
| Irish | 182 | 8.3% |
| Italian | 10 | 0.4% |
| Mexican | 14 | 0.6% |
| Polish | 70 | 3.2% |
| Scandinavian | 2 | 0.1% |
| Scotch-Irish | 5 | 0.2% |
| Scottish | 5 | 0.2% |
| Sioux | 2 | 0.1% | View All 17 Rows |
Immigrants in Cloverdale
The most numerous immigrant groups reported in Cloverdale came from Europe (12 | 0.5%), Germany (12 | 0.5%), and Western Europe (12 | 0.5%), together accounting for 1.7% of all Cloverdale residents.
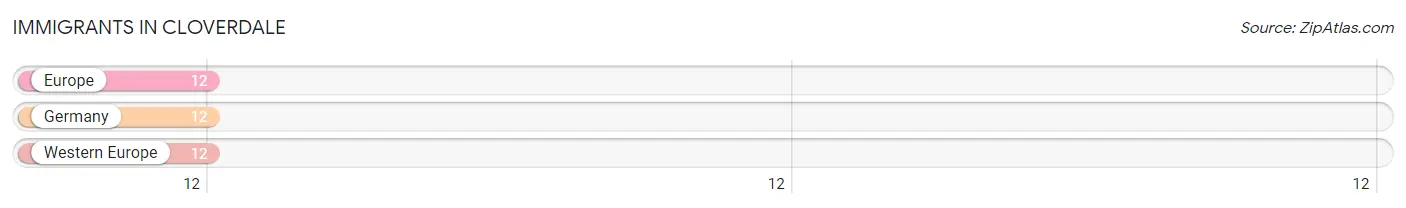
| Immigration Origin | # Population | % Population |
| Europe | 12 | 0.5% |
| Germany | 12 | 0.5% |
| Western Europe | 12 | 0.5% | View All 3 Rows |
Sex and Age in Cloverdale
Sex and Age in Cloverdale
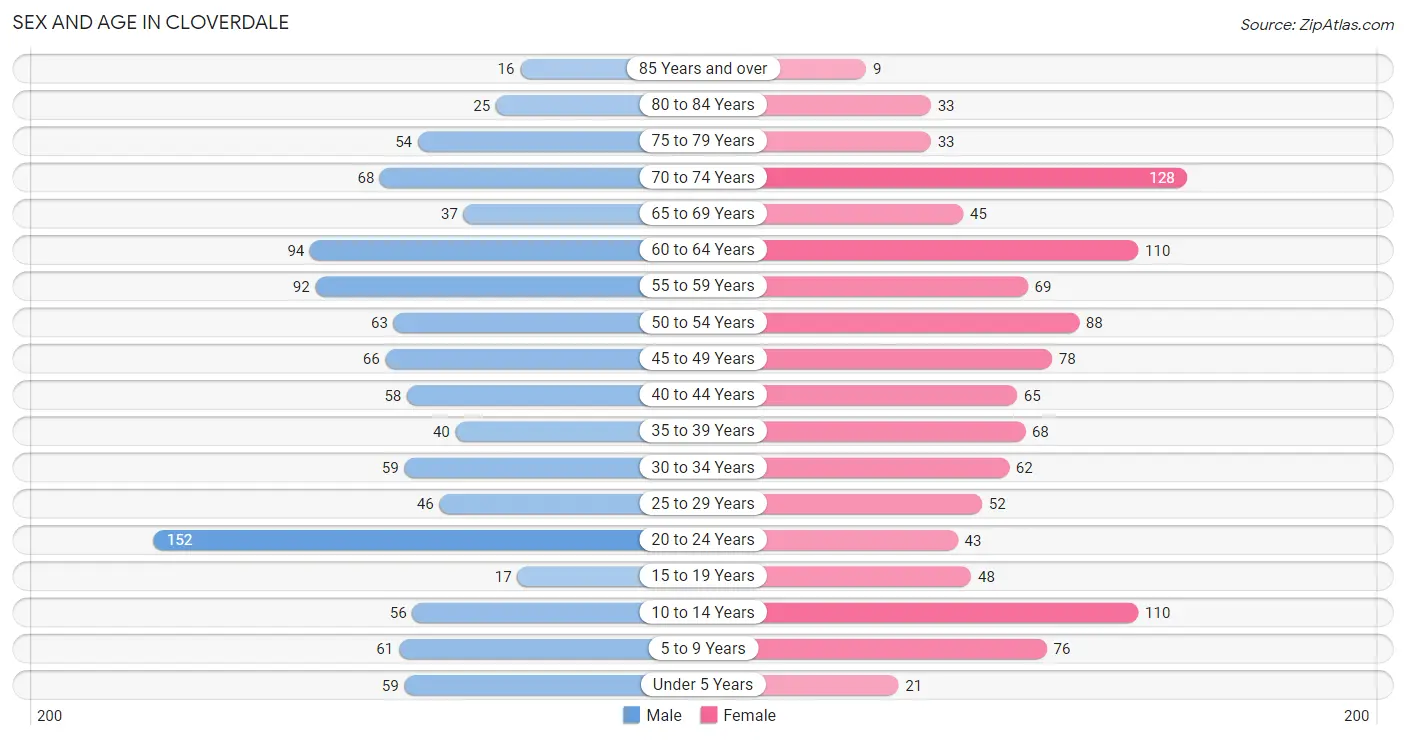
The most populous age groups in Cloverdale are 20 to 24 Years (152 | 14.3%) for men and 70 to 74 Years (128 | 11.3%) for women.
| Age Bracket | Male | Female |
| Under 5 Years | 59 (5.6%) | 21 (1.8%) |
| 5 to 9 Years | 61 (5.7%) | 76 (6.7%) |
| 10 to 14 Years | 56 (5.3%) | 110 (9.7%) |
| 15 to 19 Years | 17 (1.6%) | 48 (4.2%) |
| 20 to 24 Years | 152 (14.3%) | 43 (3.8%) |
| 25 to 29 Years | 46 (4.3%) | 52 (4.6%) |
| 30 to 34 Years | 59 (5.6%) | 62 (5.4%) |
| 35 to 39 Years | 40 (3.8%) | 68 (6.0%) |
| 40 to 44 Years | 58 (5.5%) | 65 (5.7%) |
| 45 to 49 Years | 66 (6.2%) | 78 (6.9%) |
| 50 to 54 Years | 63 (5.9%) | 88 (7.7%) |
| 55 to 59 Years | 92 (8.6%) | 69 (6.1%) |
| 60 to 64 Years | 94 (8.8%) | 110 (9.7%) |
| 65 to 69 Years | 37 (3.5%) | 45 (4.0%) |
| 70 to 74 Years | 68 (6.4%) | 128 (11.3%) |
| 75 to 79 Years | 54 (5.1%) | 33 (2.9%) |
| 80 to 84 Years | 25 (2.4%) | 33 (2.9%) |
| 85 Years and over | 16 (1.5%) | 9 (0.8%) |
| Total | 1,063 (100.0%) | 1,138 (100.0%) |
Families and Households in Cloverdale
Median Family Size in Cloverdale
The median family size in Cloverdale is 2.75 persons per family, with married-couple families (484 | 78.2%) accounting for the largest median family size of 2.94 persons per family. On the other hand, single male/father families (13 | 2.1%) represent the smallest median family size with 1.69 persons per family.
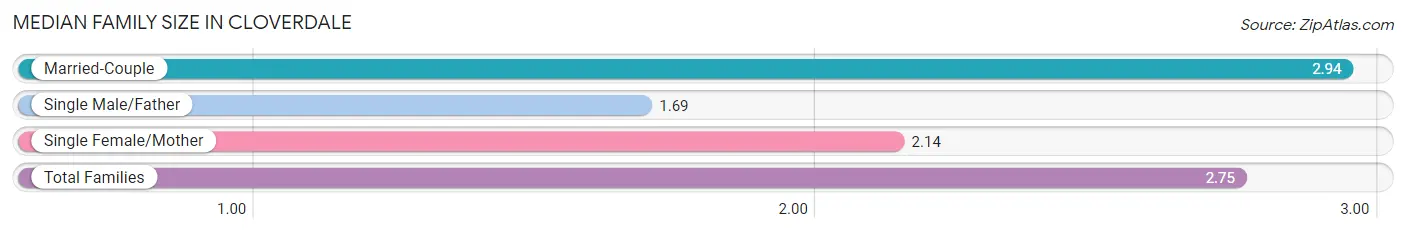
| Family Type | # Families | Family Size |
| Married-Couple | 484 (78.2%) | 2.94 |
| Single Male/Father | 13 (2.1%) | 1.69 |
| Single Female/Mother | 122 (19.7%) | 2.14 |
| Total Families | 619 (100.0%) | 2.75 |
Median Household Size in Cloverdale
The median household size in Cloverdale is 2.27 persons per household, with married-couple households (484 | 50.9%) accounting for the largest median household size of 2.95 persons per household. non-family households (331 | 34.8%) represent the smallest median household size with 1.26 persons per household.
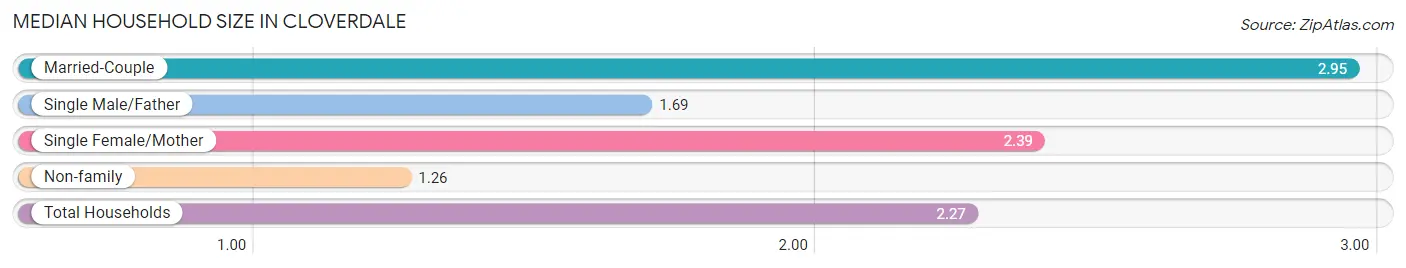
| Household Type | # Households | Household Size |
| Married-Couple | 484 (50.9%) | 2.95 |
| Single Male/Father | 13 (1.4%) | 1.69 |
| Single Female/Mother | 122 (12.8%) | 2.39 |
| Non-family | 331 (34.8%) | 1.26 |
| Total Households | 950 (100.0%) | 2.27 |
Household Size by Marriage Status in Cloverdale
Out of a total of 950 households in Cloverdale, 619 (65.2%) are family households, while 331 (34.8%) are nonfamily households. The most numerous type of family households are 2-person households, comprising 339, and the most common type of nonfamily households are 1-person households, comprising 243.
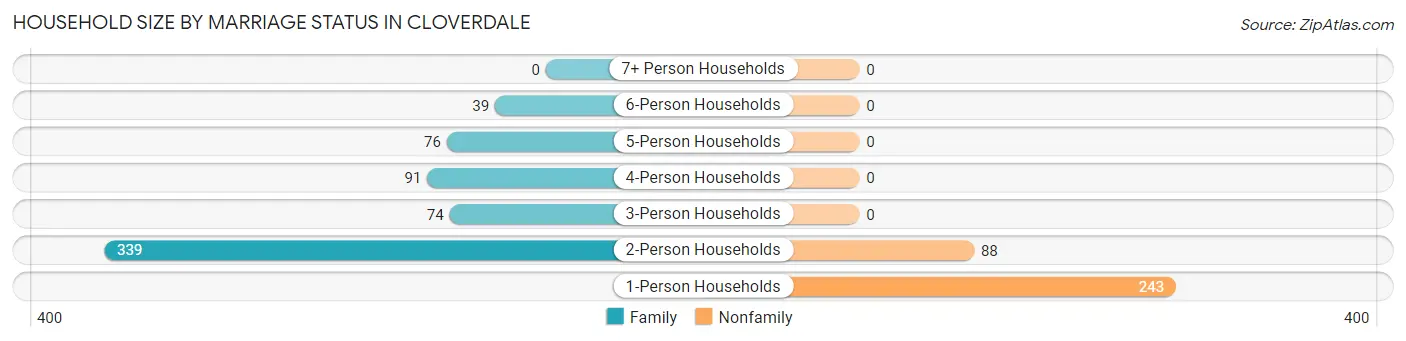
| Household Size | Family Households | Nonfamily Households |
| 1-Person Households | - | 243 (25.6%) |
| 2-Person Households | 339 (35.7%) | 88 (9.3%) |
| 3-Person Households | 74 (7.8%) | 0 (0.0%) |
| 4-Person Households | 91 (9.6%) | 0 (0.0%) |
| 5-Person Households | 76 (8.0%) | 0 (0.0%) |
| 6-Person Households | 39 (4.1%) | 0 (0.0%) |
| 7+ Person Households | 0 (0.0%) | 0 (0.0%) |
| Total | 619 (65.2%) | 331 (34.8%) |
Female Fertility in Cloverdale
Fertility by Age in Cloverdale
Average fertility rate in Cloverdale is 12.0 births per 1,000 women. Women in the age bracket of 35 to 50 years have the highest fertility rate with 23.0 births per 1,000 women. Women in the age bracket of 35 to 50 years acount for 100.0% of all women with births.
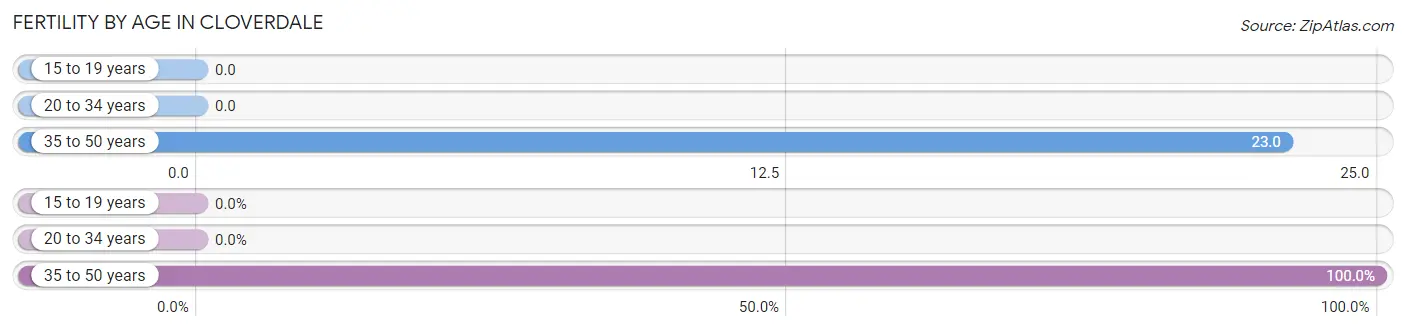
| Age Bracket | Women with Births | Births / 1,000 Women |
| 15 to 19 years | 0 (0.0%) | 0.0 |
| 20 to 34 years | 0 (0.0%) | 0.0 |
| 35 to 50 years | 5 (100.0%) | 23.0 |
| Total | 5 (100.0%) | 12.0 |
Fertility by Age by Marriage Status in Cloverdale
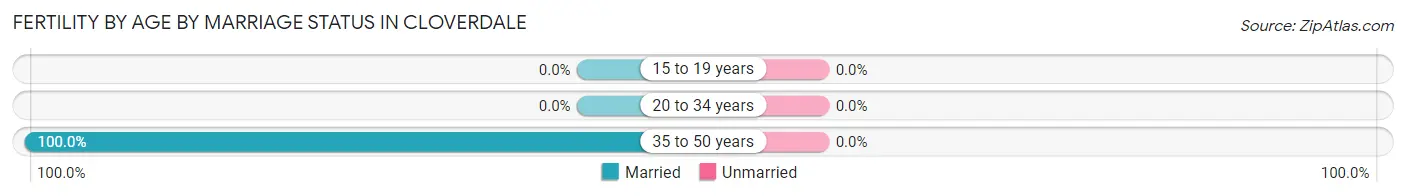
| Age Bracket | Married | Unmarried |
| 15 to 19 years | 0 (0.0%) | 0 (0.0%) |
| 20 to 34 years | 0 (0.0%) | 0 (0.0%) |
| 35 to 50 years | 5 (100.0%) | 0 (0.0%) |
| Total | 5 (100.0%) | 0 (0.0%) |
Fertility by Education in Cloverdale
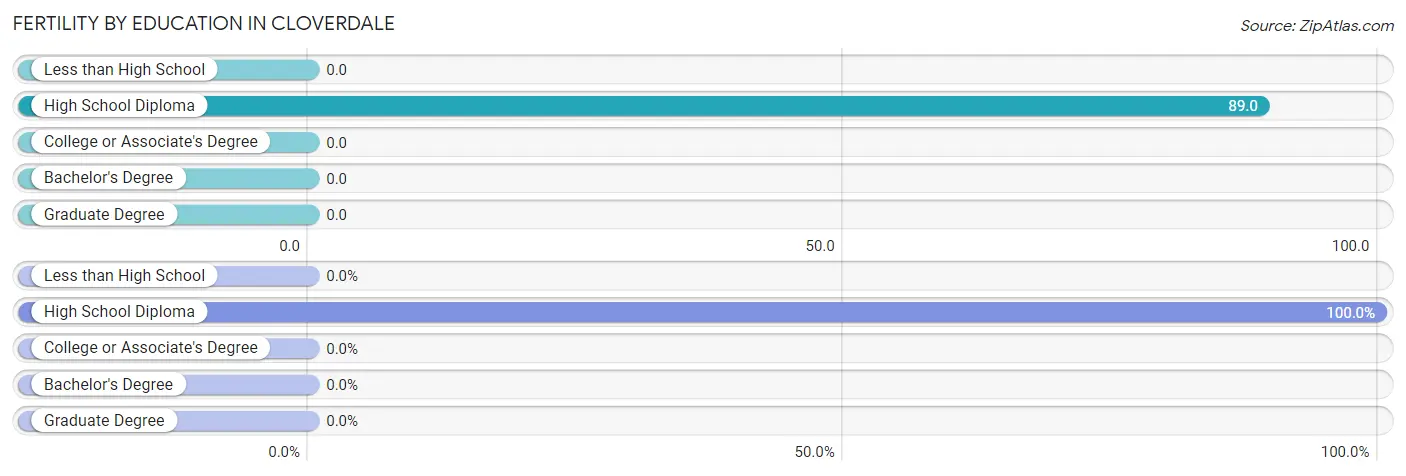
| Educational Attainment | Women with Births | Births / 1,000 Women |
| Less than High School | 0 (0.0%) | 0.0 |
| High School Diploma | 5 (100.0%) | 89.0 |
| College or Associate's Degree | 0 (0.0%) | 0.0 |
| Bachelor's Degree | 0 (0.0%) | 0.0 |
| Graduate Degree | 0 (0.0%) | 0.0 |
| Total | 5 (100.0%) | 12.0 |
Fertility by Education by Marriage Status in Cloverdale
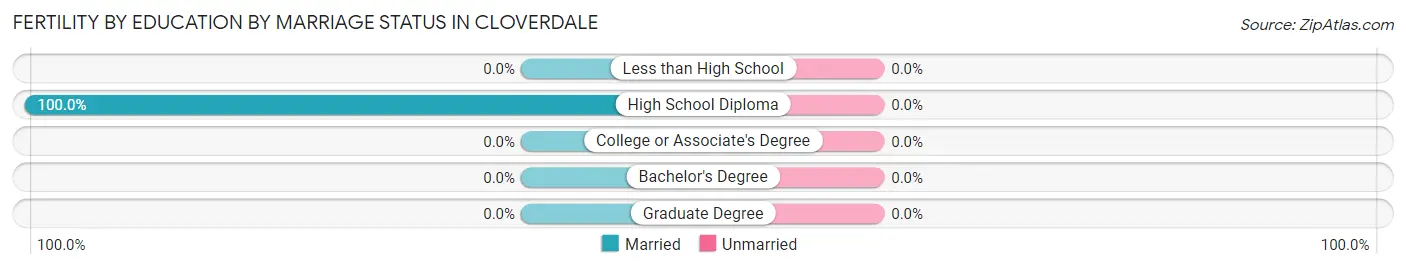
| Educational Attainment | Married | Unmarried |
| Less than High School | 0 (0.0%) | 0 (0.0%) |
| High School Diploma | 5 (100.0%) | 0 (0.0%) |
| College or Associate's Degree | 0 (0.0%) | 0 (0.0%) |
| Bachelor's Degree | 0 (0.0%) | 0 (0.0%) |
| Graduate Degree | 0 (0.0%) | 0 (0.0%) |
| Total | 5 (100.0%) | 0 (0.0%) |
Employment Characteristics in Cloverdale
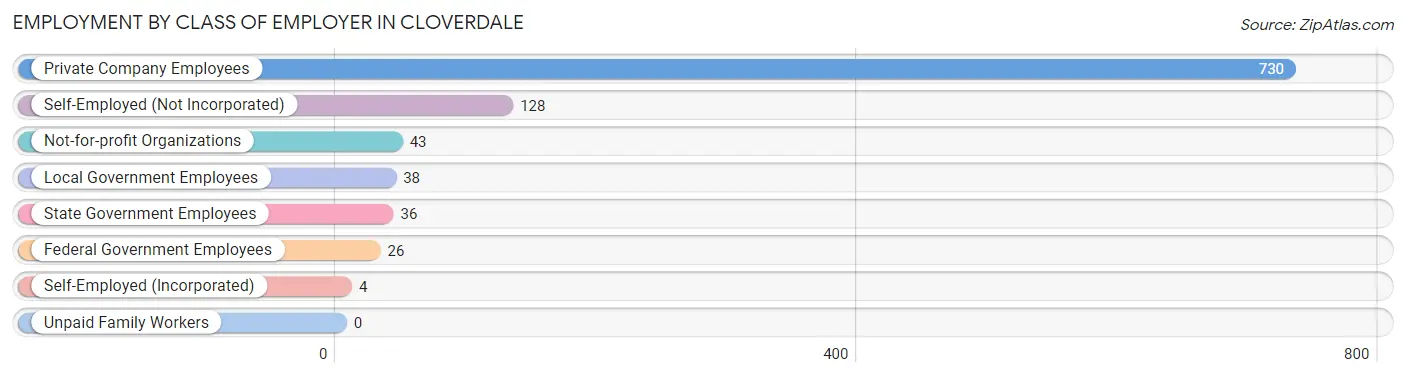
Employment by Class of Employer in Cloverdale
Among the 1,005 employed individuals in Cloverdale, private company employees (730 | 72.6%), self-employed (not incorporated) (128 | 12.7%), and not-for-profit organizations (43 | 4.3%) make up the most common classes of employment.
| Employer Class | # Employees | % Employees |
| Private Company Employees | 730 | 72.6% |
| Self-Employed (Incorporated) | 4 | 0.4% |
| Self-Employed (Not Incorporated) | 128 | 12.7% |
| Not-for-profit Organizations | 43 | 4.3% |
| Local Government Employees | 38 | 3.8% |
| State Government Employees | 36 | 3.6% |
| Federal Government Employees | 26 | 2.6% |
| Unpaid Family Workers | 0 | 0.0% |
| Total | 1,005 | 100.0% |
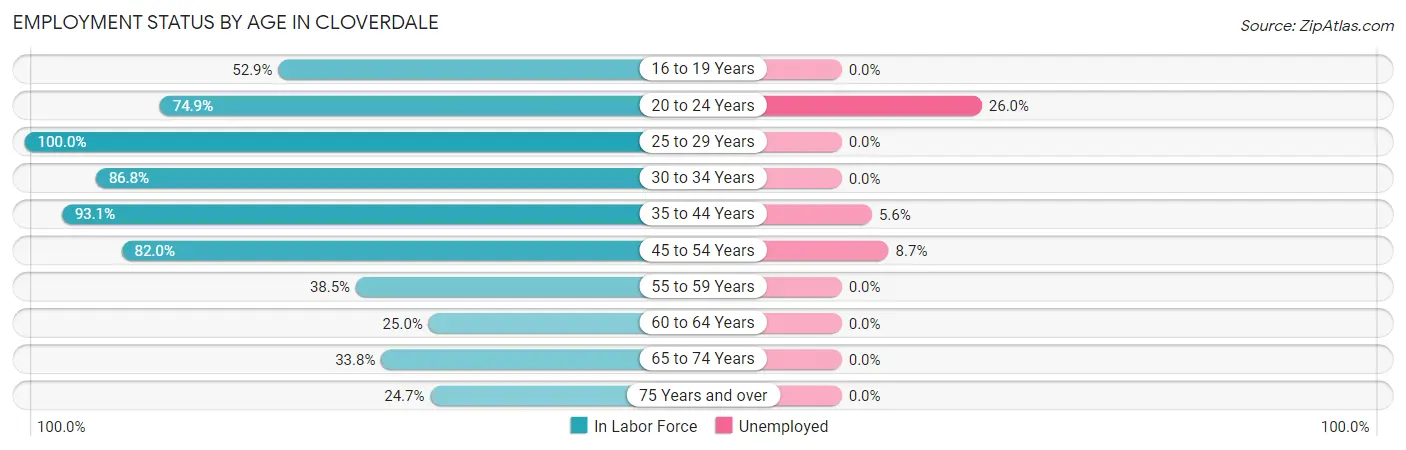
Employment Status by Age in Cloverdale
According to the labor force statistics for Cloverdale, out of the total population over 16 years of age (1,804), 60.0% or 1,082 individuals are in the labor force, with 6.6% or 71 of them unemployed. The age group with the highest labor force participation rate is 25 to 29 years, with 100.0% or 98 individuals in the labor force. Within the labor force, the 20 to 24 years age range has the highest percentage of unemployed individuals, with 26.0% or 38 of them being unemployed.
| Age Bracket | In Labor Force | Unemployed |
| 16 to 19 Years | 27 (52.9%) | 0 (0.0%) |
| 20 to 24 Years | 146 (74.9%) | 38 (26.0%) |
| 25 to 29 Years | 98 (100.0%) | 0 (0.0%) |
| 30 to 34 Years | 105 (86.8%) | 0 (0.0%) |
| 35 to 44 Years | 215 (93.1%) | 12 (5.6%) |
| 45 to 54 Years | 242 (82.0%) | 21 (8.7%) |
| 55 to 59 Years | 62 (38.5%) | 0 (0.0%) |
| 60 to 64 Years | 51 (25.0%) | 0 (0.0%) |
| 65 to 74 Years | 94 (33.8%) | 0 (0.0%) |
| 75 Years and over | 42 (24.7%) | 0 (0.0%) |
| Total | 1,082 (60.0%) | 71 (6.6%) |
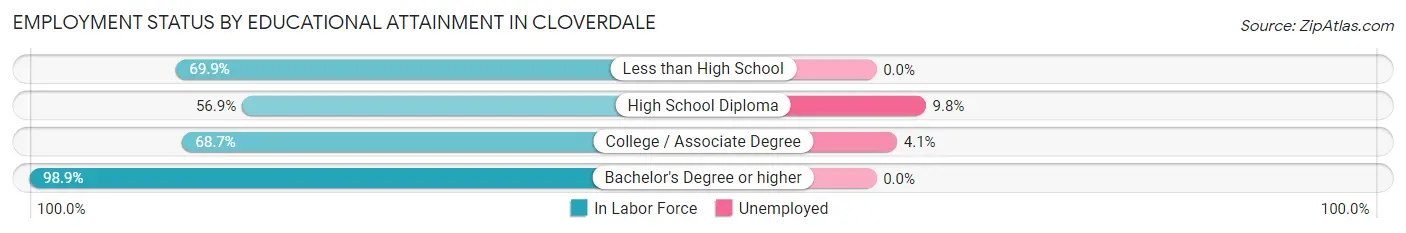
Employment Status by Educational Attainment in Cloverdale
According to labor force statistics for Cloverdale, 69.6% of individuals (773) out of the total population between 25 and 64 years of age (1,110) are in the labor force, with 4.3% or 33 of them being unemployed. The group with the highest labor force participation rate are those with the educational attainment of bachelor's degree or higher, with 98.9% or 175 individuals in the labor force. Within the labor force, individuals with high school diploma education have the highest percentage of unemployment, with 9.8% or 21 of them being unemployed.
| Educational Attainment | In Labor Force | Unemployed |
| Less than High School | 93 (69.9%) | 0 (0.0%) |
| High School Diploma | 215 (56.9%) | 37 (9.8%) |
| College / Associate Degree | 290 (68.7%) | 17 (4.1%) |
| Bachelor's Degree or higher | 175 (98.9%) | 0 (0.0%) |
| Total | 773 (69.6%) | 48 (4.3%) |
Employment Occupations by Sex in Cloverdale
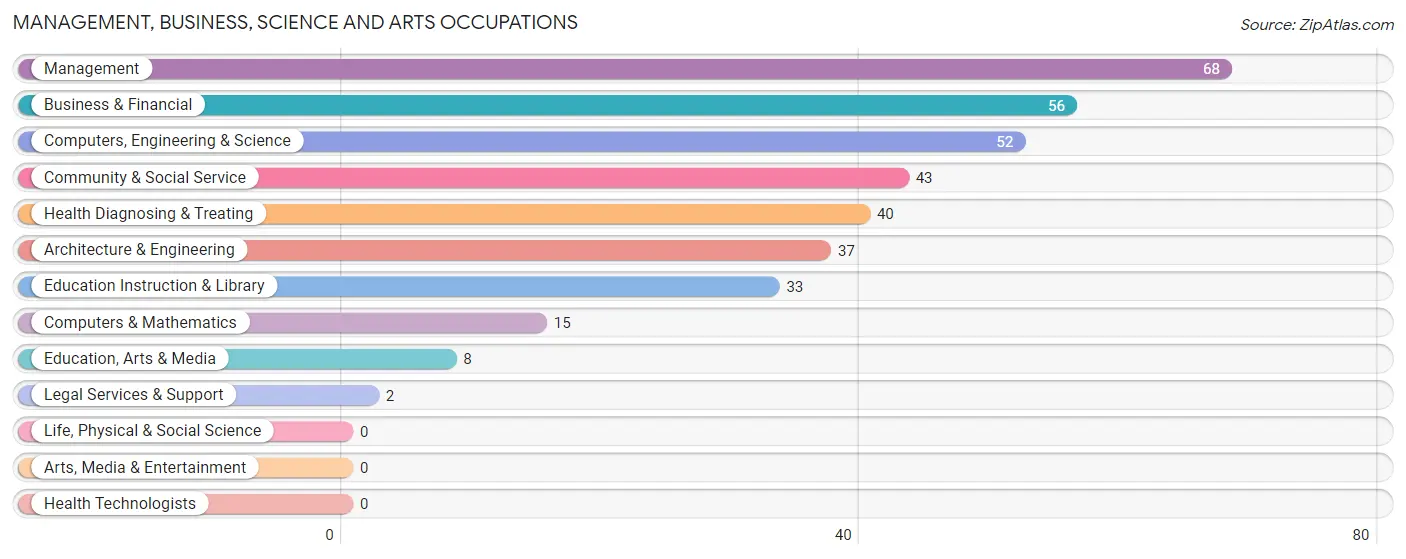
Management, Business, Science and Arts Occupations
The most common Management, Business, Science and Arts occupations in Cloverdale are Management (68 | 6.7%), Business & Financial (56 | 5.5%), Computers, Engineering & Science (52 | 5.1%), Community & Social Service (43 | 4.3%), and Health Diagnosing & Treating (40 | 4.0%).
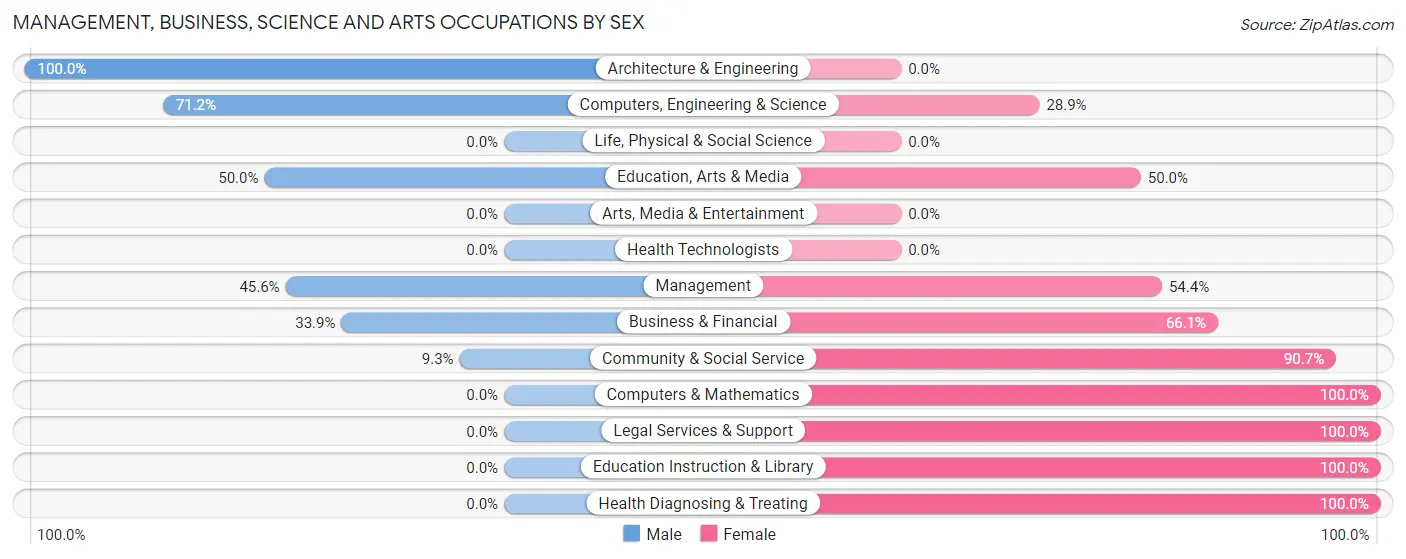
Management, Business, Science and Arts Occupations by Sex
Within the Management, Business, Science and Arts occupations in Cloverdale, the most male-oriented occupations are Architecture & Engineering (100.0%), Computers, Engineering & Science (71.2%), and Education, Arts & Media (50.0%), while the most female-oriented occupations are Computers & Mathematics (100.0%), Legal Services & Support (100.0%), and Education Instruction & Library (100.0%).
| Occupation | Male | Female |
| Management | 31 (45.6%) | 37 (54.4%) |
| Business & Financial | 19 (33.9%) | 37 (66.1%) |
| Computers, Engineering & Science | 37 (71.2%) | 15 (28.8%) |
| Computers & Mathematics | 0 (0.0%) | 15 (100.0%) |
| Architecture & Engineering | 37 (100.0%) | 0 (0.0%) |
| Life, Physical & Social Science | 0 (0.0%) | 0 (0.0%) |
| Community & Social Service | 4 (9.3%) | 39 (90.7%) |
| Education, Arts & Media | 4 (50.0%) | 4 (50.0%) |
| Legal Services & Support | 0 (0.0%) | 2 (100.0%) |
| Education Instruction & Library | 0 (0.0%) | 33 (100.0%) |
| Arts, Media & Entertainment | 0 (0.0%) | 0 (0.0%) |
| Health Diagnosing & Treating | 0 (0.0%) | 40 (100.0%) |
| Health Technologists | 0 (0.0%) | 0 (0.0%) |
| Total (Category) | 91 (35.1%) | 168 (64.9%) |
| Total (Overall) | 527 (52.1%) | 484 (47.9%) |
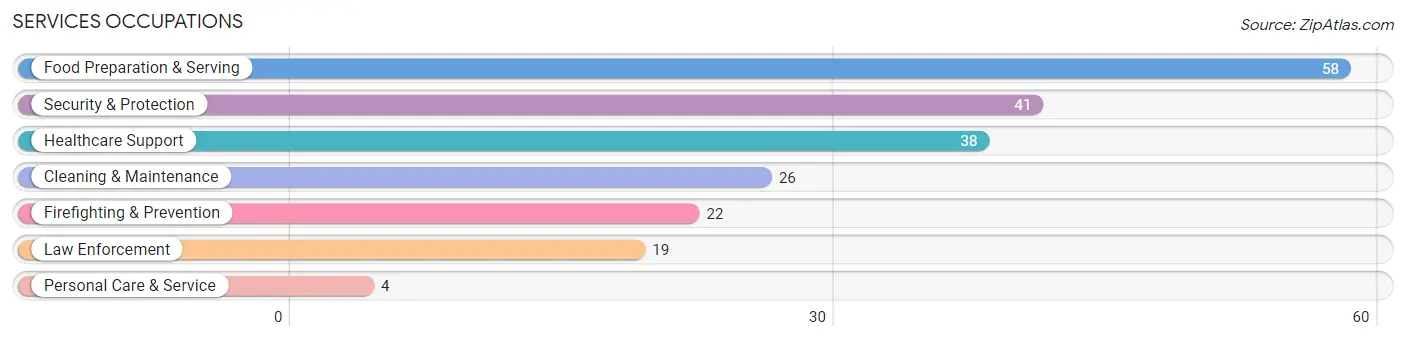
Services Occupations
The most common Services occupations in Cloverdale are Food Preparation & Serving (58 | 5.7%), Security & Protection (41 | 4.1%), Healthcare Support (38 | 3.8%), Cleaning & Maintenance (26 | 2.6%), and Firefighting & Prevention (22 | 2.2%).
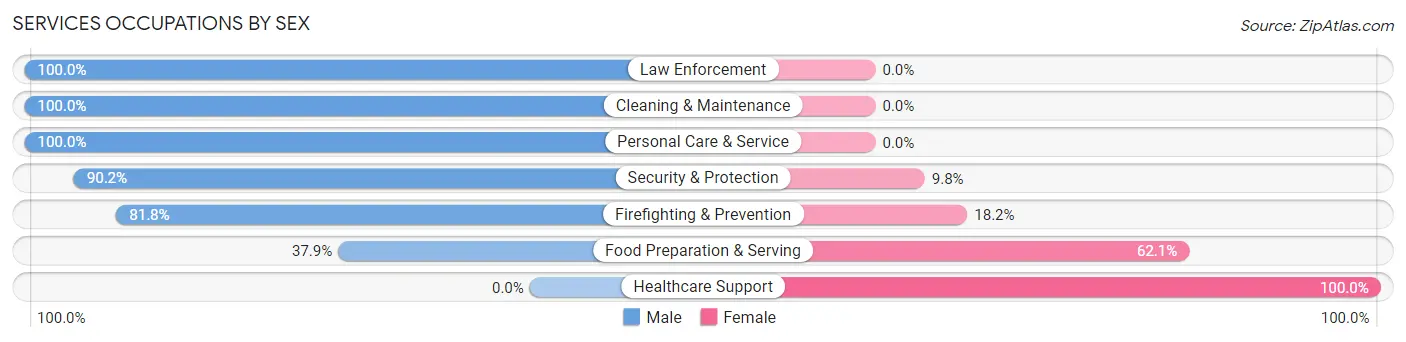
Services Occupations by Sex
Within the Services occupations in Cloverdale, the most male-oriented occupations are Law Enforcement (100.0%), Cleaning & Maintenance (100.0%), and Personal Care & Service (100.0%), while the most female-oriented occupations are Healthcare Support (100.0%), Food Preparation & Serving (62.1%), and Firefighting & Prevention (18.2%).
| Occupation | Male | Female |
| Healthcare Support | 0 (0.0%) | 38 (100.0%) |
| Security & Protection | 37 (90.2%) | 4 (9.8%) |
| Firefighting & Prevention | 18 (81.8%) | 4 (18.2%) |
| Law Enforcement | 19 (100.0%) | 0 (0.0%) |
| Food Preparation & Serving | 22 (37.9%) | 36 (62.1%) |
| Cleaning & Maintenance | 26 (100.0%) | 0 (0.0%) |
| Personal Care & Service | 4 (100.0%) | 0 (0.0%) |
| Total (Category) | 89 (53.3%) | 78 (46.7%) |
| Total (Overall) | 527 (52.1%) | 484 (47.9%) |
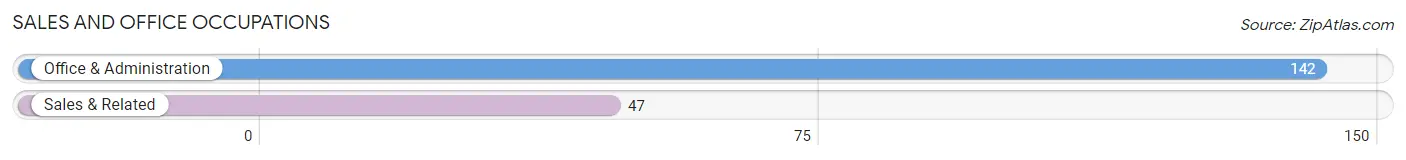
Sales and Office Occupations
The most common Sales and Office occupations in Cloverdale are Office & Administration (142 | 14.1%), and Sales & Related (47 | 4.6%).
Sales and Office Occupations by Sex
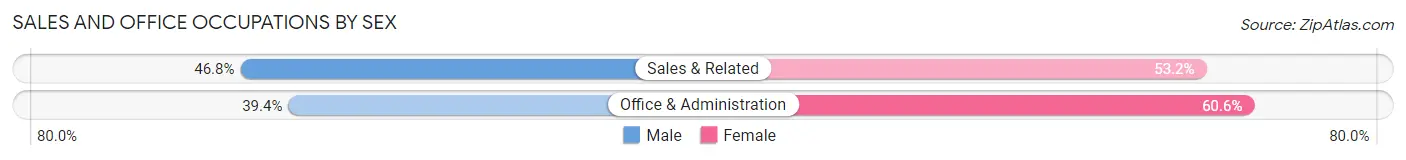
| Occupation | Male | Female |
| Sales & Related | 22 (46.8%) | 25 (53.2%) |
| Office & Administration | 56 (39.4%) | 86 (60.6%) |
| Total (Category) | 78 (41.3%) | 111 (58.7%) |
| Total (Overall) | 527 (52.1%) | 484 (47.9%) |
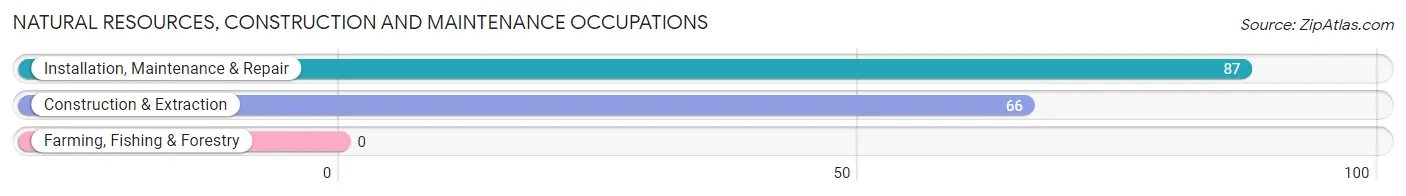
Natural Resources, Construction and Maintenance Occupations
The most common Natural Resources, Construction and Maintenance occupations in Cloverdale are Installation, Maintenance & Repair (87 | 8.6%), and Construction & Extraction (66 | 6.5%).
Natural Resources, Construction and Maintenance Occupations by Sex
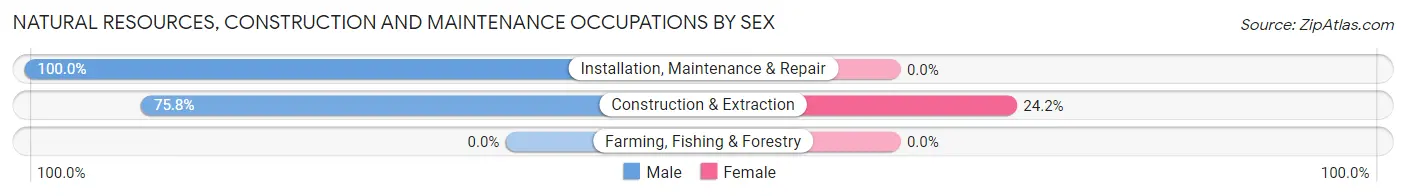
| Occupation | Male | Female |
| Farming, Fishing & Forestry | 0 (0.0%) | 0 (0.0%) |
| Construction & Extraction | 50 (75.8%) | 16 (24.2%) |
| Installation, Maintenance & Repair | 87 (100.0%) | 0 (0.0%) |
| Total (Category) | 137 (89.5%) | 16 (10.5%) |
| Total (Overall) | 527 (52.1%) | 484 (47.9%) |
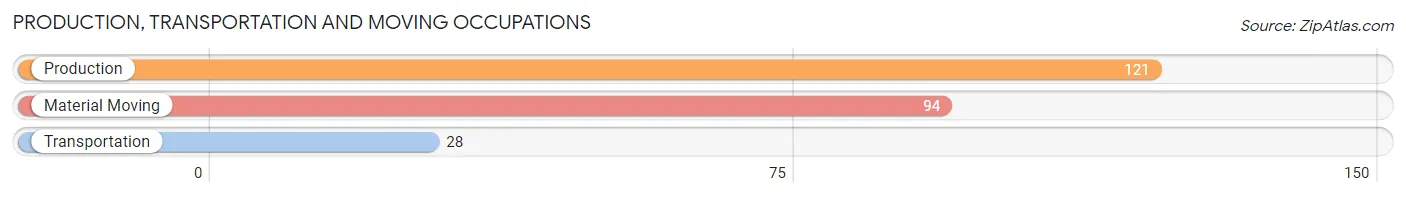
Production, Transportation and Moving Occupations
The most common Production, Transportation and Moving occupations in Cloverdale are Production (121 | 12.0%), Material Moving (94 | 9.3%), and Transportation (28 | 2.8%).
Production, Transportation and Moving Occupations by Sex
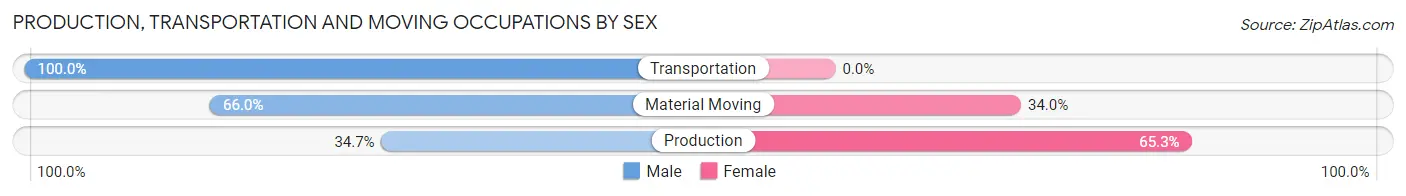
| Occupation | Male | Female |
| Production | 42 (34.7%) | 79 (65.3%) |
| Transportation | 28 (100.0%) | 0 (0.0%) |
| Material Moving | 62 (66.0%) | 32 (34.0%) |
| Total (Category) | 132 (54.3%) | 111 (45.7%) |
| Total (Overall) | 527 (52.1%) | 484 (47.9%) |
Employment Industries by Sex in Cloverdale
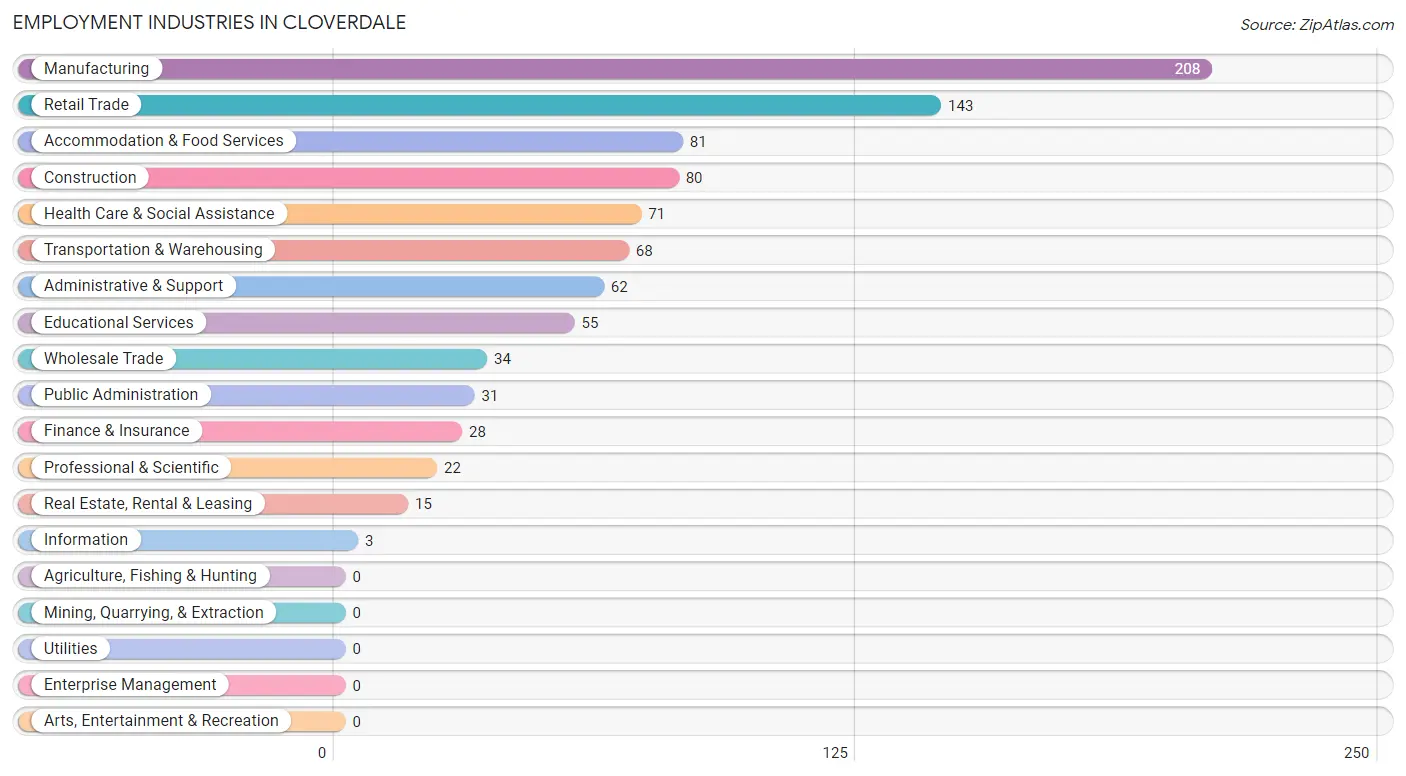
Employment Industries in Cloverdale
The major employment industries in Cloverdale include Manufacturing (208 | 20.6%), Retail Trade (143 | 14.1%), Accommodation & Food Services (81 | 8.0%), Construction (80 | 7.9%), and Health Care & Social Assistance (71 | 7.0%).
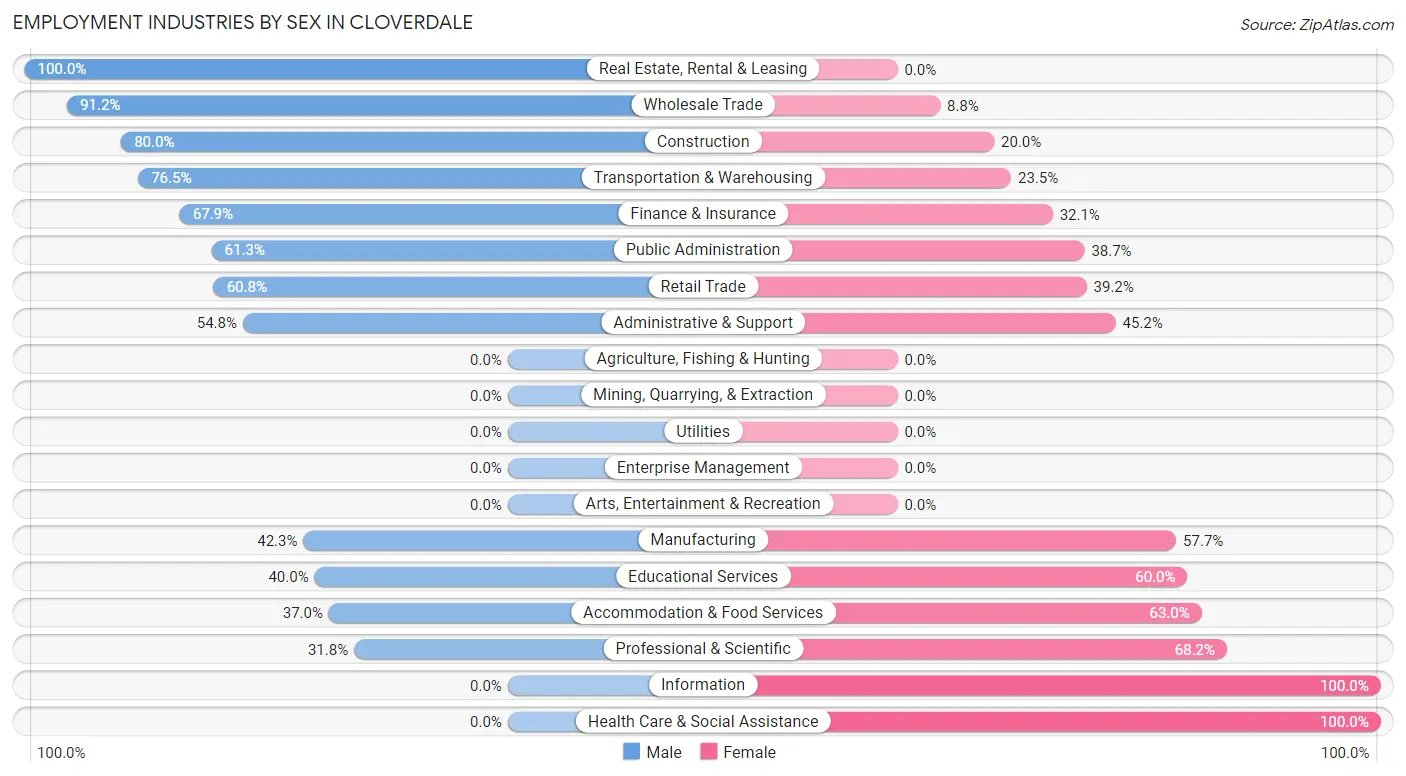
Employment Industries by Sex in Cloverdale
The Cloverdale industries that see more men than women are Real Estate, Rental & Leasing (100.0%), Wholesale Trade (91.2%), and Construction (80.0%), whereas the industries that tend to have a higher number of women are Information (100.0%), Health Care & Social Assistance (100.0%), and Professional & Scientific (68.2%).
| Industry | Male | Female |
| Agriculture, Fishing & Hunting | 0 (0.0%) | 0 (0.0%) |
| Mining, Quarrying, & Extraction | 0 (0.0%) | 0 (0.0%) |
| Construction | 64 (80.0%) | 16 (20.0%) |
| Manufacturing | 88 (42.3%) | 120 (57.7%) |
| Wholesale Trade | 31 (91.2%) | 3 (8.8%) |
| Retail Trade | 87 (60.8%) | 56 (39.2%) |
| Transportation & Warehousing | 52 (76.5%) | 16 (23.5%) |
| Utilities | 0 (0.0%) | 0 (0.0%) |
| Information | 0 (0.0%) | 3 (100.0%) |
| Finance & Insurance | 19 (67.9%) | 9 (32.1%) |
| Real Estate, Rental & Leasing | 15 (100.0%) | 0 (0.0%) |
| Professional & Scientific | 7 (31.8%) | 15 (68.2%) |
| Enterprise Management | 0 (0.0%) | 0 (0.0%) |
| Administrative & Support | 34 (54.8%) | 28 (45.2%) |
| Educational Services | 22 (40.0%) | 33 (60.0%) |
| Health Care & Social Assistance | 0 (0.0%) | 71 (100.0%) |
| Arts, Entertainment & Recreation | 0 (0.0%) | 0 (0.0%) |
| Accommodation & Food Services | 30 (37.0%) | 51 (63.0%) |
| Public Administration | 19 (61.3%) | 12 (38.7%) |
| Total | 527 (52.1%) | 484 (47.9%) |
Education in Cloverdale
School Enrollment in Cloverdale
The most common levels of schooling among the 450 students in Cloverdale are middle school (117 | 26.0%), high school (99 | 22.0%), and elementary school (98 | 21.8%).
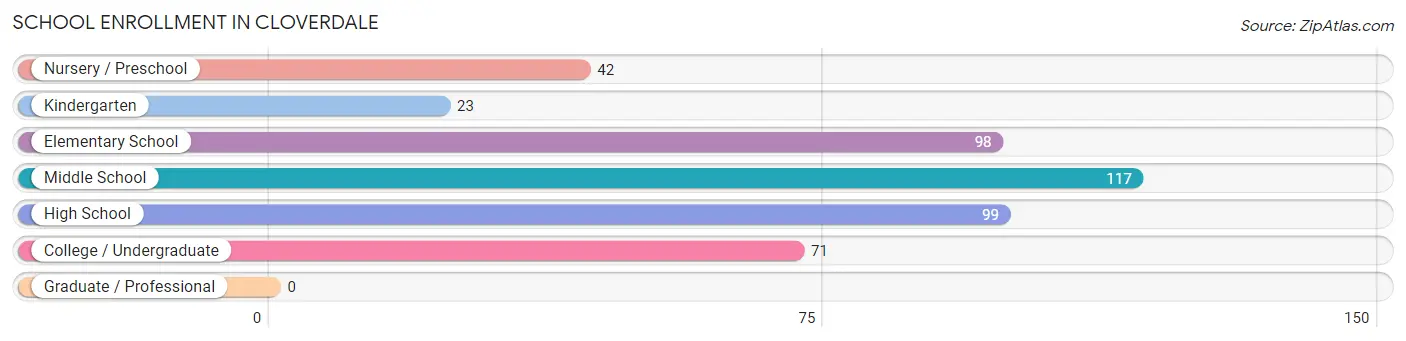
| School Level | # Students | % Students |
| Nursery / Preschool | 42 | 9.3% |
| Kindergarten | 23 | 5.1% |
| Elementary School | 98 | 21.8% |
| Middle School | 117 | 26.0% |
| High School | 99 | 22.0% |
| College / Undergraduate | 71 | 15.8% |
| Graduate / Professional | 0 | 0.0% |
| Total | 450 | 100.0% |
School Enrollment by Age by Funding Source in Cloverdale
Out of a total of 450 students who are enrolled in schools in Cloverdale, 93 (20.7%) attend a private institution, while the remaining 357 (79.3%) are enrolled in public schools. The age group of 20 to 24 year olds has the highest likelihood of being enrolled in private schools, with 37 (94.9% in the age bracket) enrolled. Conversely, the age group of 15 to 17 year olds has the lowest likelihood of being enrolled in a private school, with 39 (100.0% in the age bracket) attending a public institution.
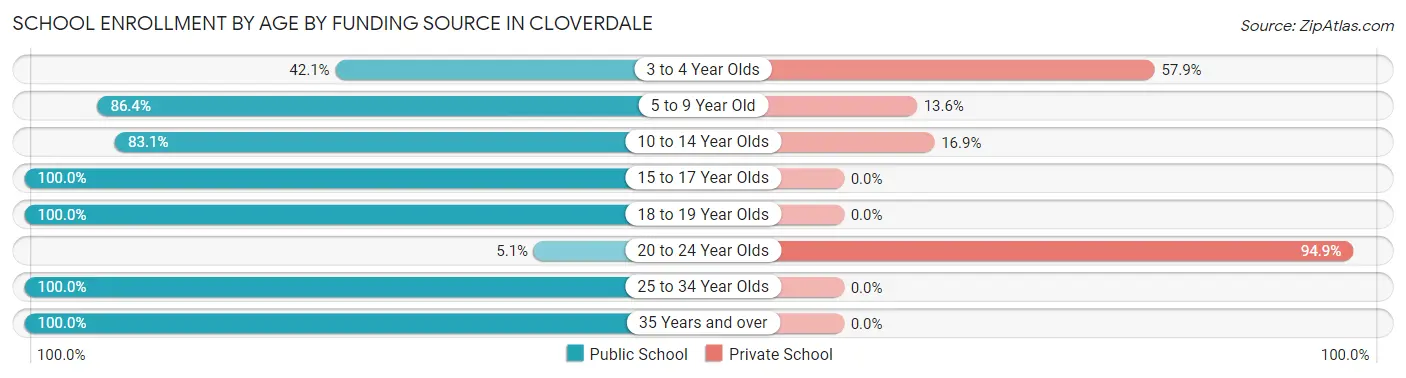
| Age Bracket | Public School | Private School |
| 3 to 4 Year Olds | 8 (42.1%) | 11 (57.9%) |
| 5 to 9 Year Old | 108 (86.4%) | 17 (13.6%) |
| 10 to 14 Year Olds | 138 (83.1%) | 28 (16.9%) |
| 15 to 17 Year Olds | 39 (100.0%) | 0 (0.0%) |
| 18 to 19 Year Olds | 26 (100.0%) | 0 (0.0%) |
| 20 to 24 Year Olds | 2 (5.1%) | 37 (94.9%) |
| 25 to 34 Year Olds | 28 (100.0%) | 0 (0.0%) |
| 35 Years and over | 8 (100.0%) | 0 (0.0%) |
| Total | 357 (79.3%) | 93 (20.7%) |
Educational Attainment by Field of Study in Cloverdale
Business (110 | 39.2%), liberal arts & history (57 | 20.3%), education (43 | 15.3%), arts & humanities (26 | 9.2%), and physical & health sciences (11 | 3.9%) are the most common fields of study among 281 individuals in Cloverdale who have obtained a bachelor's degree or higher.
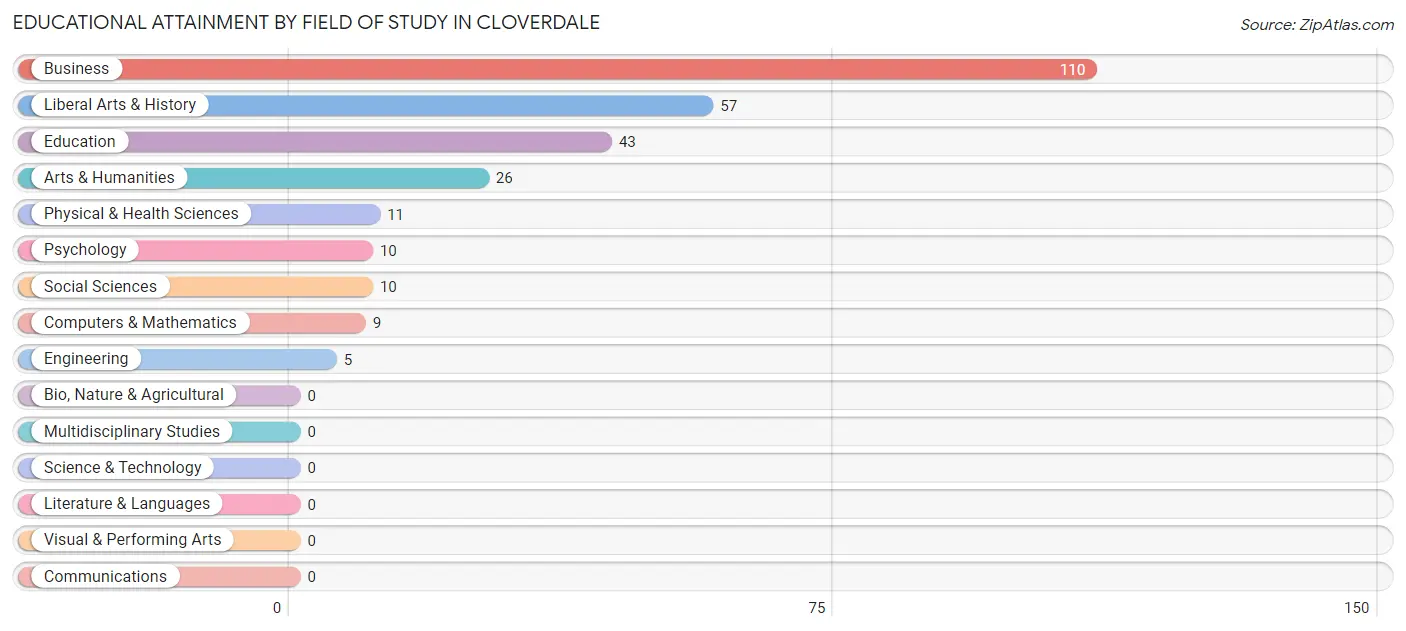
| Field of Study | # Graduates | % Graduates |
| Computers & Mathematics | 9 | 3.2% |
| Bio, Nature & Agricultural | 0 | 0.0% |
| Physical & Health Sciences | 11 | 3.9% |
| Psychology | 10 | 3.6% |
| Social Sciences | 10 | 3.6% |
| Engineering | 5 | 1.8% |
| Multidisciplinary Studies | 0 | 0.0% |
| Science & Technology | 0 | 0.0% |
| Business | 110 | 39.2% |
| Education | 43 | 15.3% |
| Literature & Languages | 0 | 0.0% |
| Liberal Arts & History | 57 | 20.3% |
| Visual & Performing Arts | 0 | 0.0% |
| Communications | 0 | 0.0% |
| Arts & Humanities | 26 | 9.2% |
| Total | 281 | 100.0% |
Transportation & Commute in Cloverdale
Vehicle Availability by Sex in Cloverdale
The most prevalent vehicle ownership categories in Cloverdale are males with 2 vehicles (235, accounting for 45.1%) and females with 2 vehicles (200, making up 48.5%).
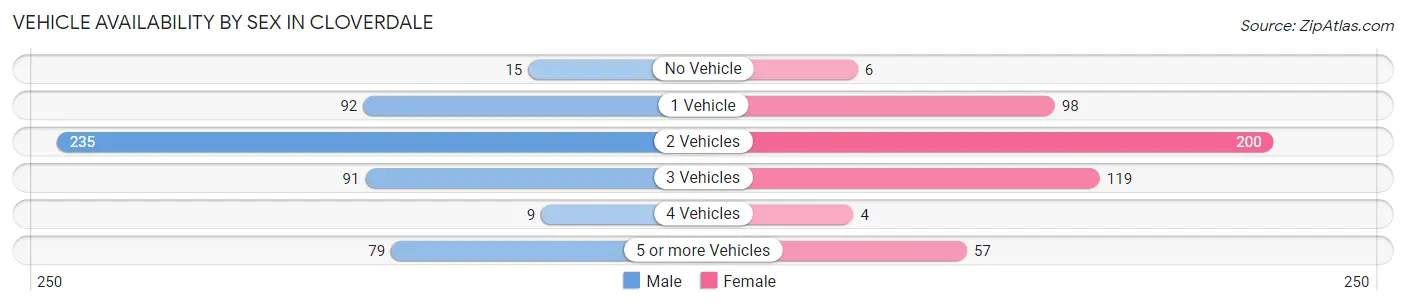
| Vehicles Available | Male | Female |
| No Vehicle | 15 (2.9%) | 6 (1.2%) |
| 1 Vehicle | 92 (17.7%) | 98 (20.3%) |
| 2 Vehicles | 235 (45.1%) | 200 (41.3%) |
| 3 Vehicles | 91 (17.5%) | 119 (24.6%) |
| 4 Vehicles | 9 (1.7%) | 4 (0.8%) |
| 5 or more Vehicles | 79 (15.2%) | 57 (11.8%) |
| Total | 521 (100.0%) | 484 (100.0%) |
Commute Time in Cloverdale
The most frequently occuring commute durations in Cloverdale are 20 to 24 minutes (202 commuters, 20.7%), less than 5 minutes (158 commuters, 16.2%), and 45 to 59 minutes (151 commuters, 15.5%).
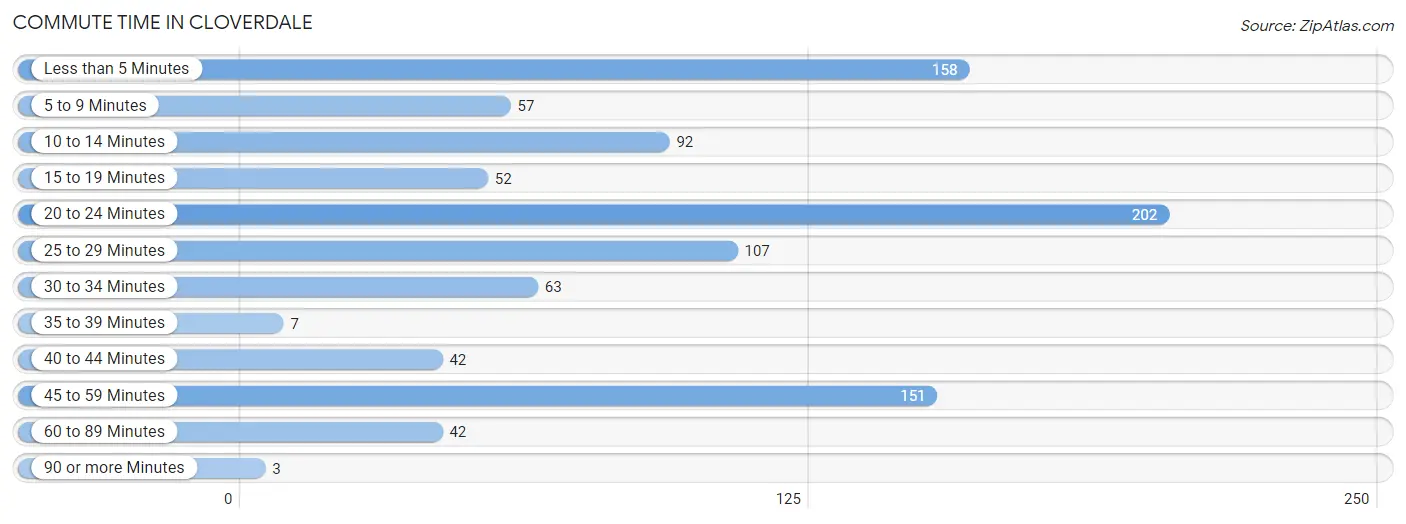
| Commute Time | # Commuters | % Commuters |
| Less than 5 Minutes | 158 | 16.2% |
| 5 to 9 Minutes | 57 | 5.8% |
| 10 to 14 Minutes | 92 | 9.4% |
| 15 to 19 Minutes | 52 | 5.3% |
| 20 to 24 Minutes | 202 | 20.7% |
| 25 to 29 Minutes | 107 | 11.0% |
| 30 to 34 Minutes | 63 | 6.5% |
| 35 to 39 Minutes | 7 | 0.7% |
| 40 to 44 Minutes | 42 | 4.3% |
| 45 to 59 Minutes | 151 | 15.5% |
| 60 to 89 Minutes | 42 | 4.3% |
| 90 or more Minutes | 3 | 0.3% |
Commute Time by Sex in Cloverdale
The most common commute times in Cloverdale are 20 to 24 minutes (92 commuters, 17.7%) for males and 20 to 24 minutes (110 commuters, 24.2%) for females.
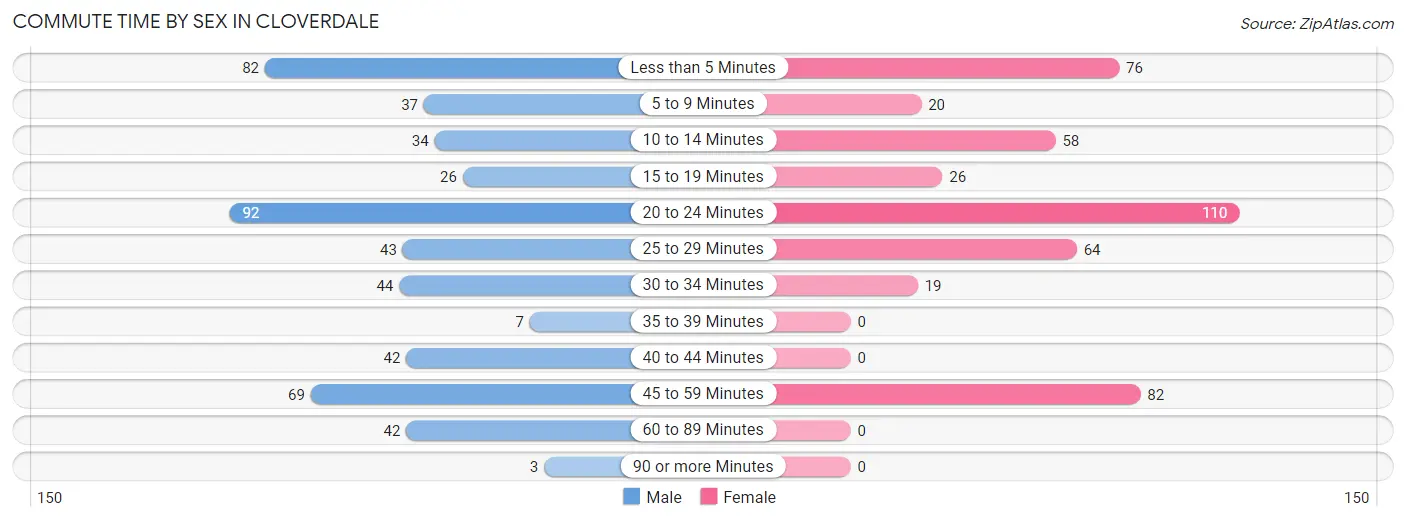
| Commute Time | Male | Female |
| Less than 5 Minutes | 82 (15.7%) | 76 (16.7%) |
| 5 to 9 Minutes | 37 (7.1%) | 20 (4.4%) |
| 10 to 14 Minutes | 34 (6.5%) | 58 (12.8%) |
| 15 to 19 Minutes | 26 (5.0%) | 26 (5.7%) |
| 20 to 24 Minutes | 92 (17.7%) | 110 (24.2%) |
| 25 to 29 Minutes | 43 (8.3%) | 64 (14.1%) |
| 30 to 34 Minutes | 44 (8.5%) | 19 (4.2%) |
| 35 to 39 Minutes | 7 (1.3%) | 0 (0.0%) |
| 40 to 44 Minutes | 42 (8.1%) | 0 (0.0%) |
| 45 to 59 Minutes | 69 (13.2%) | 82 (18.0%) |
| 60 to 89 Minutes | 42 (8.1%) | 0 (0.0%) |
| 90 or more Minutes | 3 (0.6%) | 0 (0.0%) |
Time of Departure to Work by Sex in Cloverdale
The most frequent times of departure to work in Cloverdale are 6:00 AM to 6:29 AM (101, 19.4%) for males and 7:00 AM to 7:29 AM (89, 19.6%) for females.
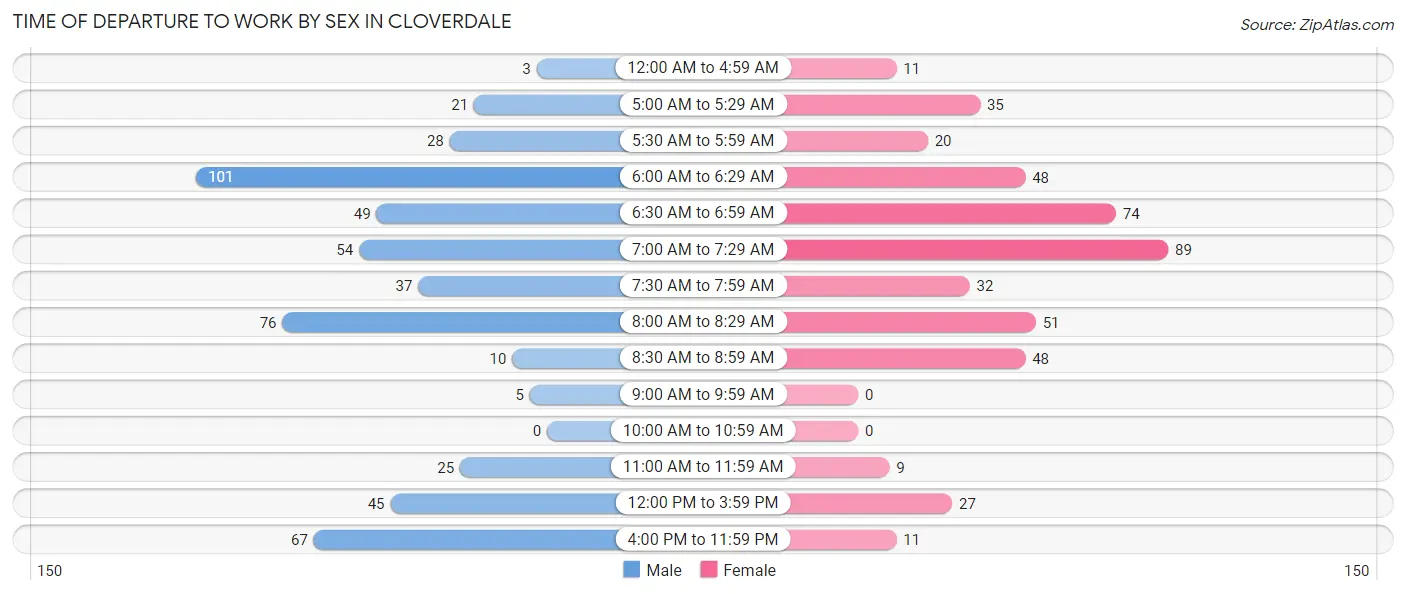
| Time of Departure | Male | Female |
| 12:00 AM to 4:59 AM | 3 (0.6%) | 11 (2.4%) |
| 5:00 AM to 5:29 AM | 21 (4.0%) | 35 (7.7%) |
| 5:30 AM to 5:59 AM | 28 (5.4%) | 20 (4.4%) |
| 6:00 AM to 6:29 AM | 101 (19.4%) | 48 (10.5%) |
| 6:30 AM to 6:59 AM | 49 (9.4%) | 74 (16.3%) |
| 7:00 AM to 7:29 AM | 54 (10.4%) | 89 (19.6%) |
| 7:30 AM to 7:59 AM | 37 (7.1%) | 32 (7.0%) |
| 8:00 AM to 8:29 AM | 76 (14.6%) | 51 (11.2%) |
| 8:30 AM to 8:59 AM | 10 (1.9%) | 48 (10.5%) |
| 9:00 AM to 9:59 AM | 5 (1.0%) | 0 (0.0%) |
| 10:00 AM to 10:59 AM | 0 (0.0%) | 0 (0.0%) |
| 11:00 AM to 11:59 AM | 25 (4.8%) | 9 (2.0%) |
| 12:00 PM to 3:59 PM | 45 (8.6%) | 27 (5.9%) |
| 4:00 PM to 11:59 PM | 67 (12.9%) | 11 (2.4%) |
| Total | 521 (100.0%) | 455 (100.0%) |
Housing Occupancy in Cloverdale
Occupancy by Ownership in Cloverdale
Of the total 950 dwellings in Cloverdale, owner-occupied units account for 572 (60.2%), while renter-occupied units make up 378 (39.8%).
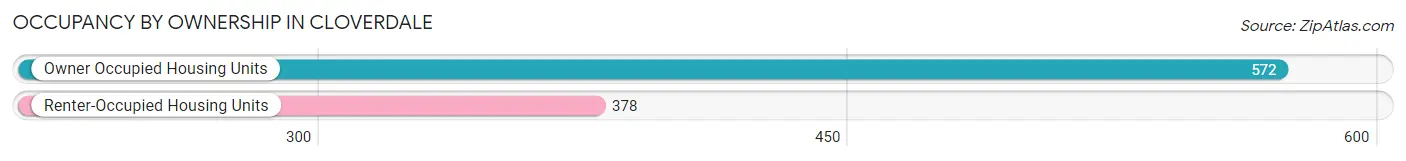
| Occupancy | # Housing Units | % Housing Units |
| Owner Occupied Housing Units | 572 | 60.2% |
| Renter-Occupied Housing Units | 378 | 39.8% |
| Total Occupied Housing Units | 950 | 100.0% |
Occupancy by Household Size in Cloverdale
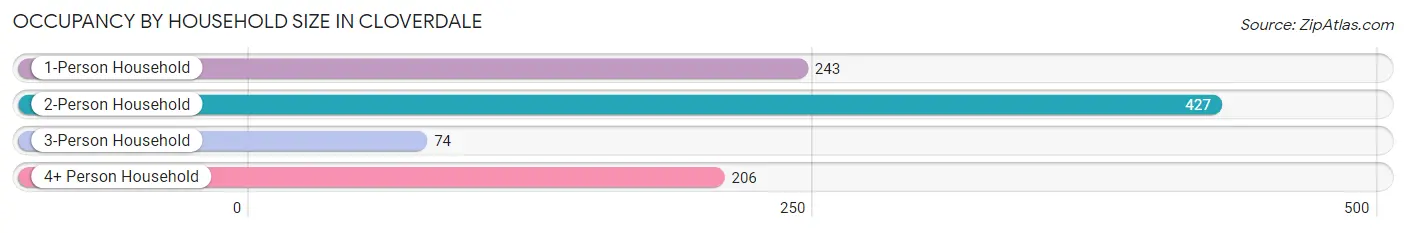
| Household Size | # Housing Units | % Housing Units |
| 1-Person Household | 243 | 25.6% |
| 2-Person Household | 427 | 45.0% |
| 3-Person Household | 74 | 7.8% |
| 4+ Person Household | 206 | 21.7% |
| Total Housing Units | 950 | 100.0% |
Occupancy by Ownership by Household Size in Cloverdale
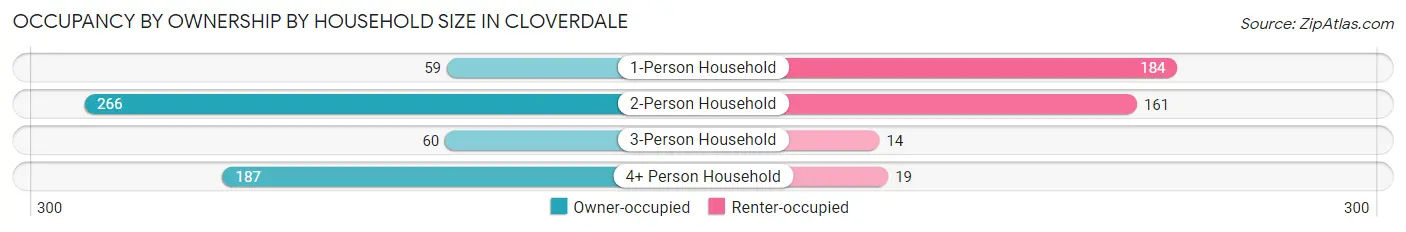
| Household Size | Owner-occupied | Renter-occupied |
| 1-Person Household | 59 (24.3%) | 184 (75.7%) |
| 2-Person Household | 266 (62.3%) | 161 (37.7%) |
| 3-Person Household | 60 (81.1%) | 14 (18.9%) |
| 4+ Person Household | 187 (90.8%) | 19 (9.2%) |
| Total Housing Units | 572 (60.2%) | 378 (39.8%) |
Occupancy by Educational Attainment in Cloverdale
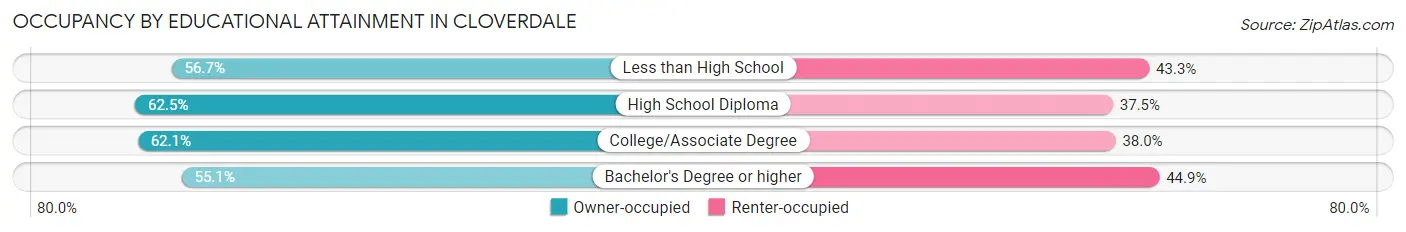
| Household Size | Owner-occupied | Renter-occupied |
| Less than High School | 55 (56.7%) | 42 (43.3%) |
| High School Diploma | 203 (62.5%) | 122 (37.5%) |
| College/Associate Degree | 206 (62.1%) | 126 (38.0%) |
| Bachelor's Degree or higher | 108 (55.1%) | 88 (44.9%) |
Occupancy by Age of Householder in Cloverdale
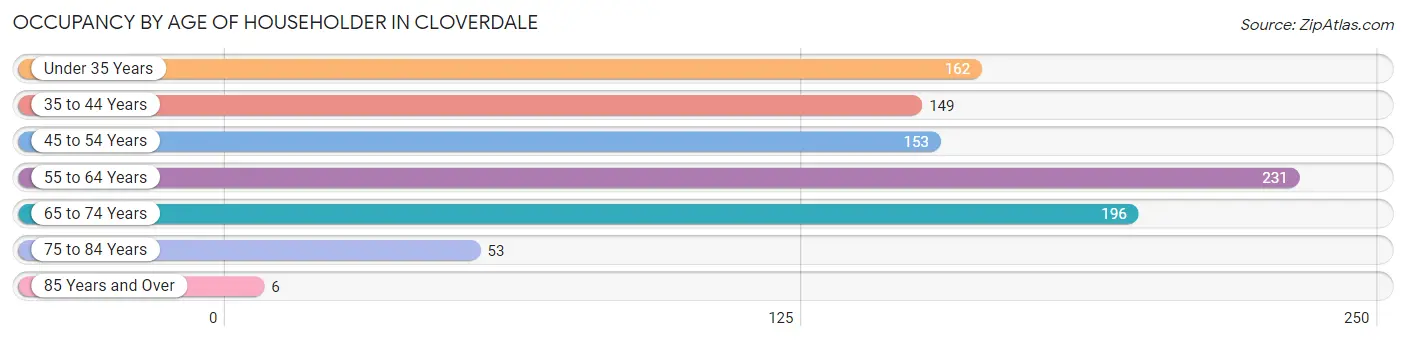
| Age Bracket | # Households | % Households |
| Under 35 Years | 162 | 17.1% |
| 35 to 44 Years | 149 | 15.7% |
| 45 to 54 Years | 153 | 16.1% |
| 55 to 64 Years | 231 | 24.3% |
| 65 to 74 Years | 196 | 20.6% |
| 75 to 84 Years | 53 | 5.6% |
| 85 Years and Over | 6 | 0.6% |
| Total | 950 | 100.0% |
Housing Finances in Cloverdale
Median Income by Occupancy in Cloverdale
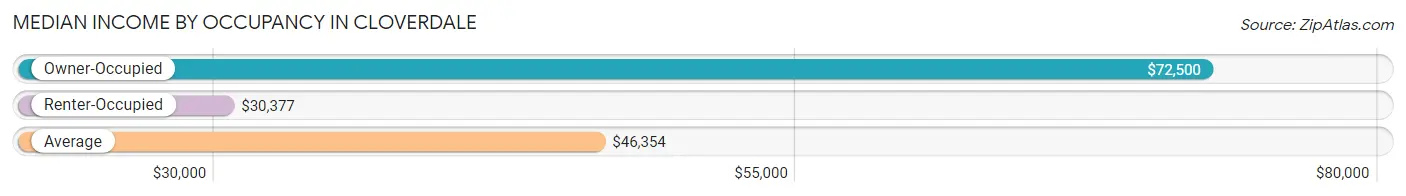
| Occupancy Type | # Households | Median Income |
| Owner-Occupied | 572 (60.2%) | $72,500 |
| Renter-Occupied | 378 (39.8%) | $30,377 |
| Average | 950 (100.0%) | $46,354 |
Occupancy by Householder Income Bracket in Cloverdale
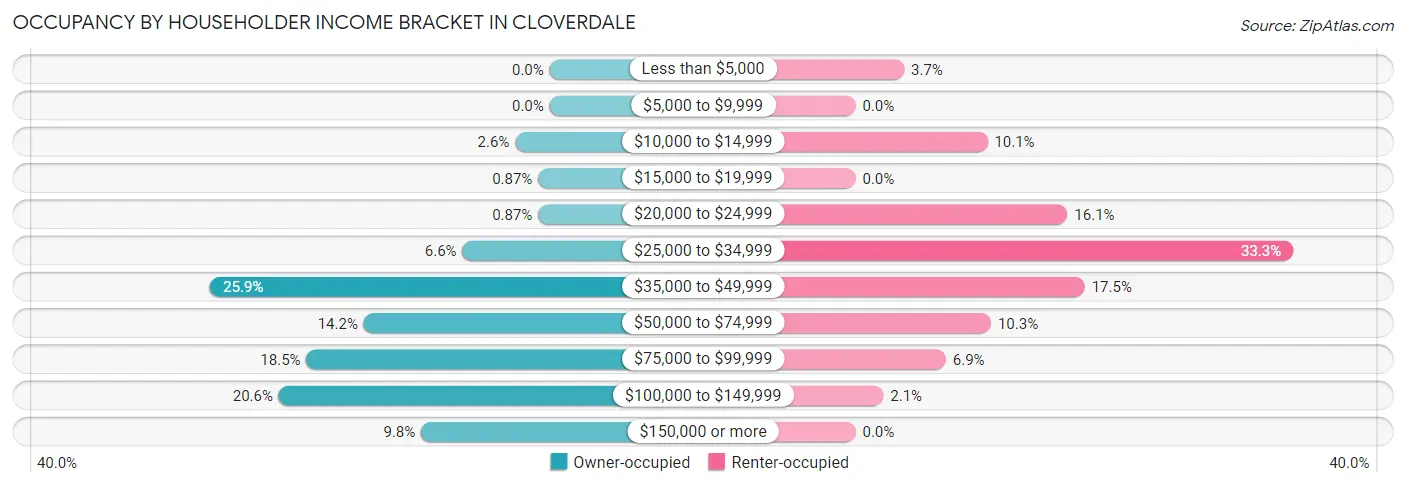
| Income Bracket | Owner-occupied | Renter-occupied |
| Less than $5,000 | 0 (0.0%) | 14 (3.7%) |
| $5,000 to $9,999 | 0 (0.0%) | 0 (0.0%) |
| $10,000 to $14,999 | 15 (2.6%) | 38 (10.1%) |
| $15,000 to $19,999 | 5 (0.9%) | 0 (0.0%) |
| $20,000 to $24,999 | 5 (0.9%) | 61 (16.1%) |
| $25,000 to $34,999 | 38 (6.6%) | 126 (33.3%) |
| $35,000 to $49,999 | 148 (25.9%) | 66 (17.5%) |
| $50,000 to $74,999 | 81 (14.2%) | 39 (10.3%) |
| $75,000 to $99,999 | 106 (18.5%) | 26 (6.9%) |
| $100,000 to $149,999 | 118 (20.6%) | 8 (2.1%) |
| $150,000 or more | 56 (9.8%) | 0 (0.0%) |
| Total | 572 (100.0%) | 378 (100.0%) |
Monthly Housing Cost Tiers in Cloverdale
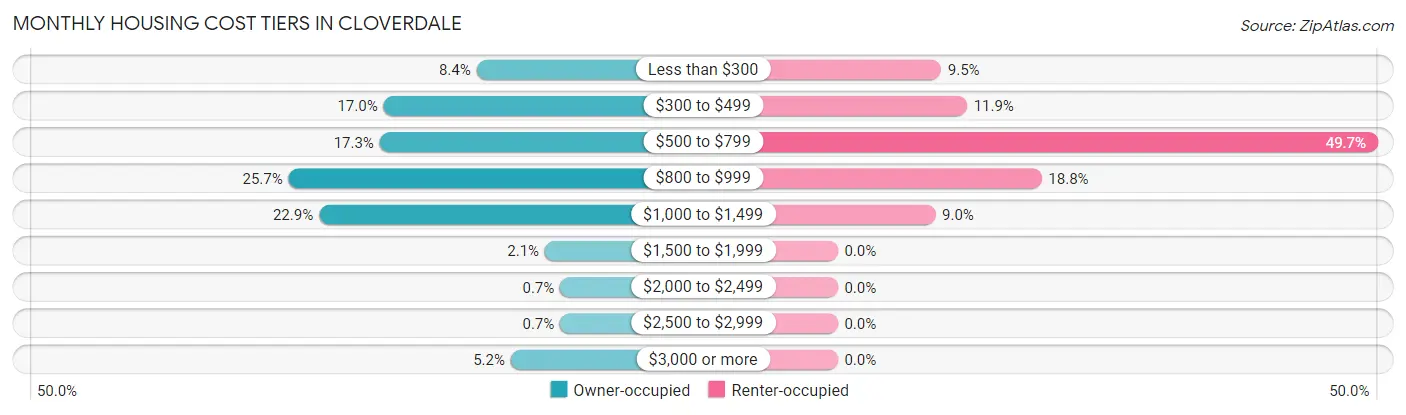
| Monthly Cost | Owner-occupied | Renter-occupied |
| Less than $300 | 48 (8.4%) | 36 (9.5%) |
| $300 to $499 | 97 (17.0%) | 45 (11.9%) |
| $500 to $799 | 99 (17.3%) | 188 (49.7%) |
| $800 to $999 | 147 (25.7%) | 71 (18.8%) |
| $1,000 to $1,499 | 131 (22.9%) | 34 (9.0%) |
| $1,500 to $1,999 | 12 (2.1%) | 0 (0.0%) |
| $2,000 to $2,499 | 4 (0.7%) | 0 (0.0%) |
| $2,500 to $2,999 | 4 (0.7%) | 0 (0.0%) |
| $3,000 or more | 30 (5.2%) | 0 (0.0%) |
| Total | 572 (100.0%) | 378 (100.0%) |
Physical Housing Characteristics in Cloverdale
Housing Structures in Cloverdale
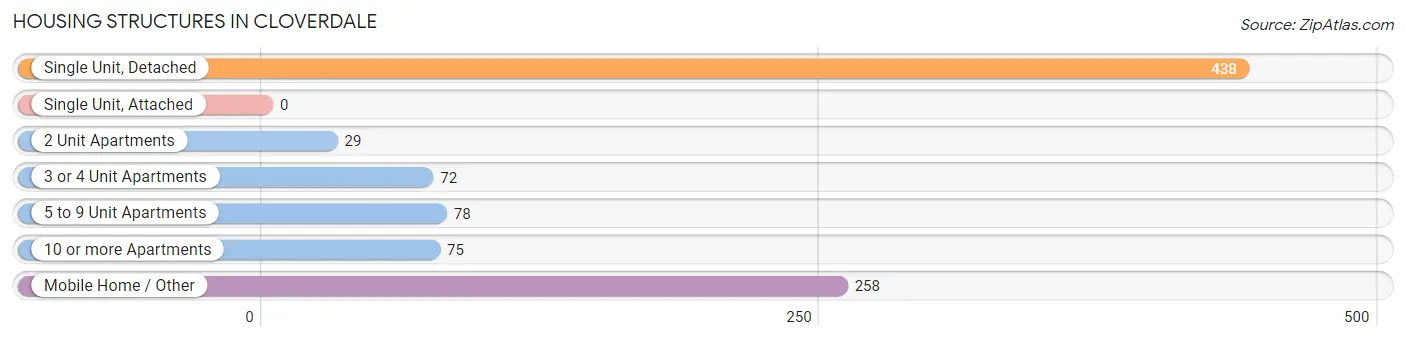
| Structure Type | # Housing Units | % Housing Units |
| Single Unit, Detached | 438 | 46.1% |
| Single Unit, Attached | 0 | 0.0% |
| 2 Unit Apartments | 29 | 3.0% |
| 3 or 4 Unit Apartments | 72 | 7.6% |
| 5 to 9 Unit Apartments | 78 | 8.2% |
| 10 or more Apartments | 75 | 7.9% |
| Mobile Home / Other | 258 | 27.2% |
| Total | 950 | 100.0% |
Housing Structures by Occupancy in Cloverdale
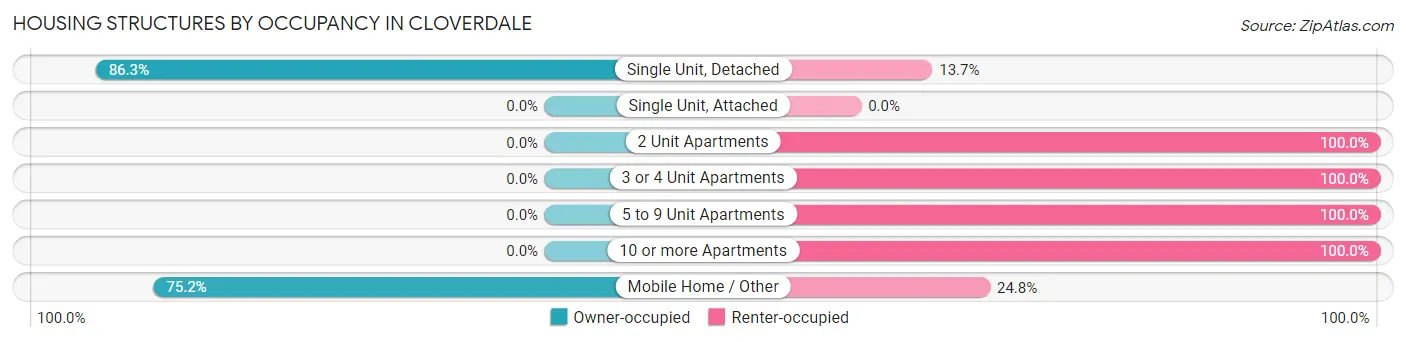
| Structure Type | Owner-occupied | Renter-occupied |
| Single Unit, Detached | 378 (86.3%) | 60 (13.7%) |
| Single Unit, Attached | 0 (0.0%) | 0 (0.0%) |
| 2 Unit Apartments | 0 (0.0%) | 29 (100.0%) |
| 3 or 4 Unit Apartments | 0 (0.0%) | 72 (100.0%) |
| 5 to 9 Unit Apartments | 0 (0.0%) | 78 (100.0%) |
| 10 or more Apartments | 0 (0.0%) | 75 (100.0%) |
| Mobile Home / Other | 194 (75.2%) | 64 (24.8%) |
| Total | 572 (60.2%) | 378 (39.8%) |
Housing Structures by Number of Rooms in Cloverdale
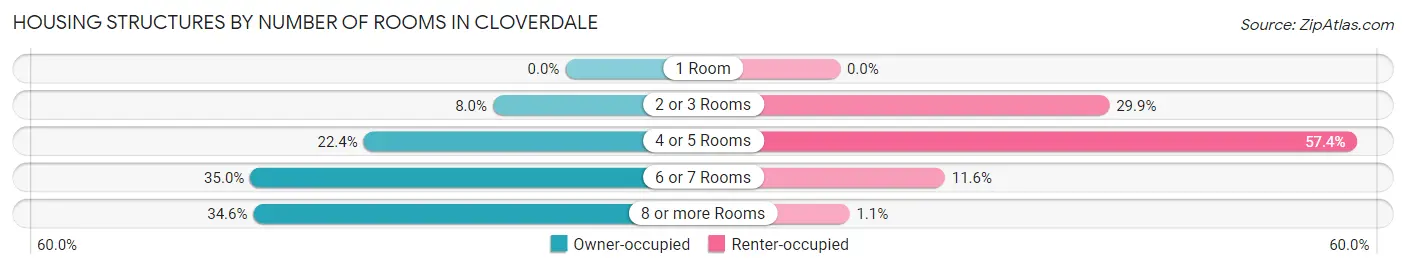
| Number of Rooms | Owner-occupied | Renter-occupied |
| 1 Room | 0 (0.0%) | 0 (0.0%) |
| 2 or 3 Rooms | 46 (8.0%) | 113 (29.9%) |
| 4 or 5 Rooms | 128 (22.4%) | 217 (57.4%) |
| 6 or 7 Rooms | 200 (35.0%) | 44 (11.6%) |
| 8 or more Rooms | 198 (34.6%) | 4 (1.1%) |
| Total | 572 (100.0%) | 378 (100.0%) |
Housing Structure by Heating Type in Cloverdale
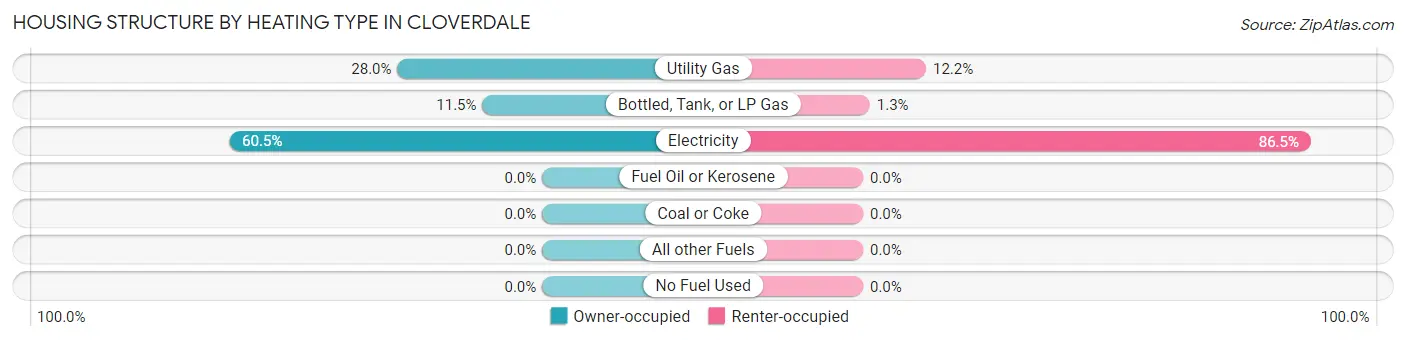
| Heating Type | Owner-occupied | Renter-occupied |
| Utility Gas | 160 (28.0%) | 46 (12.2%) |
| Bottled, Tank, or LP Gas | 66 (11.5%) | 5 (1.3%) |
| Electricity | 346 (60.5%) | 327 (86.5%) |
| Fuel Oil or Kerosene | 0 (0.0%) | 0 (0.0%) |
| Coal or Coke | 0 (0.0%) | 0 (0.0%) |
| All other Fuels | 0 (0.0%) | 0 (0.0%) |
| No Fuel Used | 0 (0.0%) | 0 (0.0%) |
| Total | 572 (100.0%) | 378 (100.0%) |
Household Vehicle Usage in Cloverdale
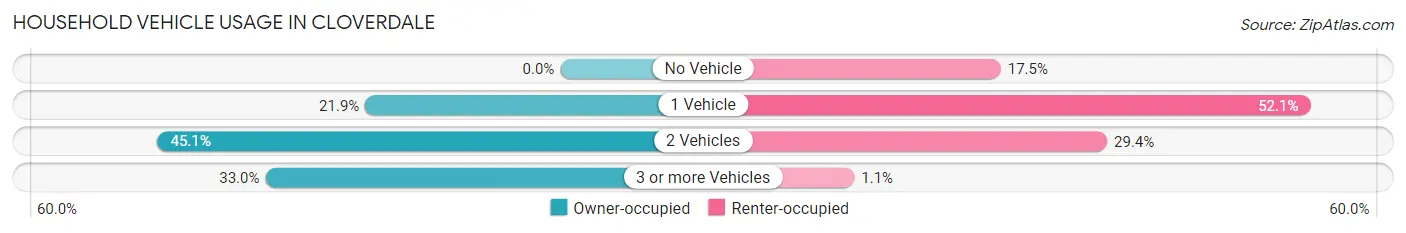
| Vehicles per Household | Owner-occupied | Renter-occupied |
| No Vehicle | 0 (0.0%) | 66 (17.5%) |
| 1 Vehicle | 125 (21.8%) | 197 (52.1%) |
| 2 Vehicles | 258 (45.1%) | 111 (29.4%) |
| 3 or more Vehicles | 189 (33.0%) | 4 (1.1%) |
| Total | 572 (100.0%) | 378 (100.0%) |
Real Estate & Mortgages in Cloverdale
Real Estate and Mortgage Overview in Cloverdale
| Characteristic | Without Mortgage | With Mortgage |
| Housing Units | 230 | 342 |
| Median Property Value | $101,800 | $119,800 |
| Median Household Income | $65,500 | $35 |
| Monthly Housing Costs | $425 | $30 |
| Real Estate Taxes | $536 | $28 |
Property Value by Mortgage Status in Cloverdale
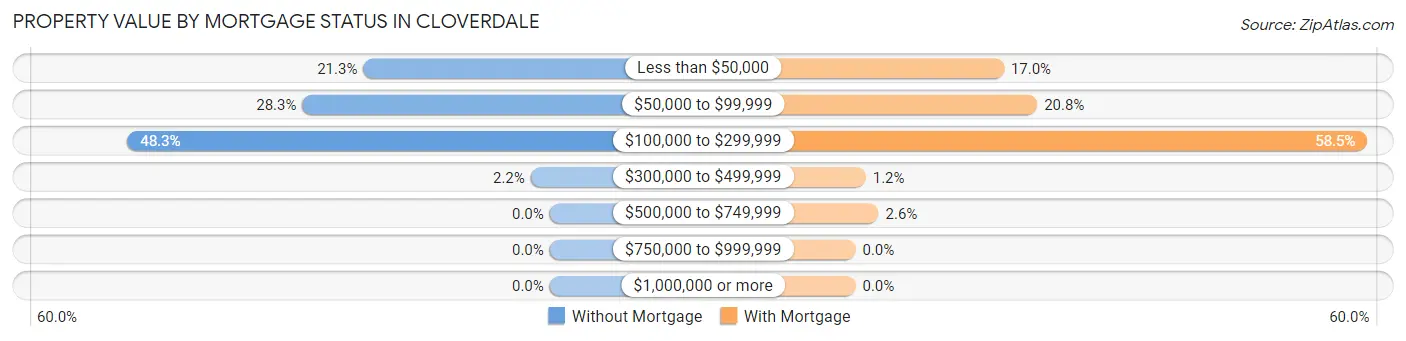
| Property Value | Without Mortgage | With Mortgage |
| Less than $50,000 | 49 (21.3%) | 58 (17.0%) |
| $50,000 to $99,999 | 65 (28.3%) | 71 (20.8%) |
| $100,000 to $299,999 | 111 (48.3%) | 200 (58.5%) |
| $300,000 to $499,999 | 5 (2.2%) | 4 (1.2%) |
| $500,000 to $749,999 | 0 (0.0%) | 9 (2.6%) |
| $750,000 to $999,999 | 0 (0.0%) | 0 (0.0%) |
| $1,000,000 or more | 0 (0.0%) | 0 (0.0%) |
| Total | 230 (100.0%) | 342 (100.0%) |
Household Income by Mortgage Status in Cloverdale
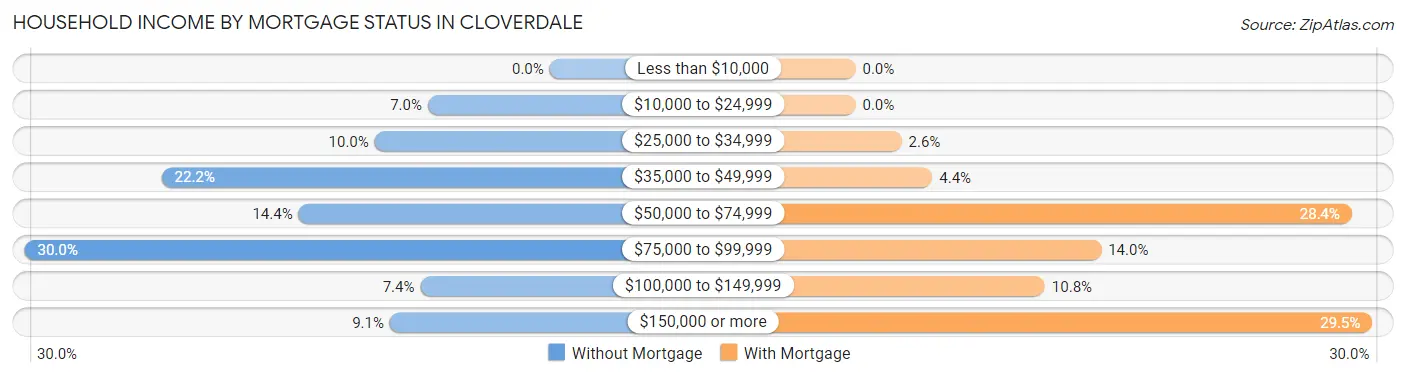
| Household Income | Without Mortgage | With Mortgage |
| Less than $10,000 | 0 (0.0%) | 0 (0.0%) |
| $10,000 to $24,999 | 16 (7.0%) | 0 (0.0%) |
| $25,000 to $34,999 | 23 (10.0%) | 9 (2.6%) |
| $35,000 to $49,999 | 51 (22.2%) | 15 (4.4%) |
| $50,000 to $74,999 | 33 (14.3%) | 97 (28.4%) |
| $75,000 to $99,999 | 69 (30.0%) | 48 (14.0%) |
| $100,000 to $149,999 | 17 (7.4%) | 37 (10.8%) |
| $150,000 or more | 21 (9.1%) | 101 (29.5%) |
| Total | 230 (100.0%) | 342 (100.0%) |
Property Value to Household Income Ratio in Cloverdale
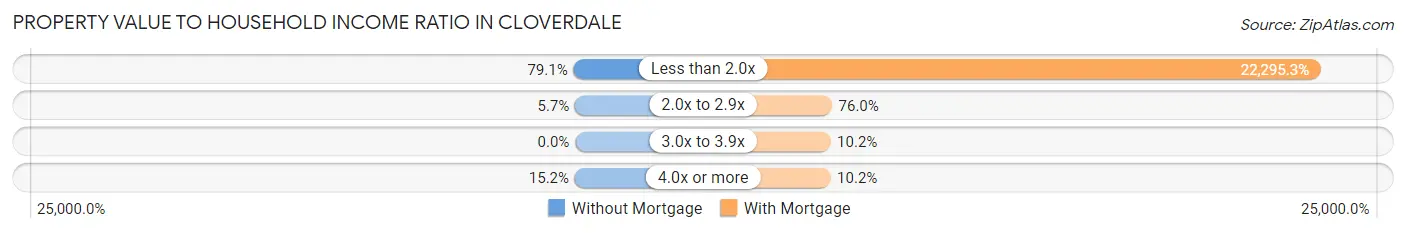
| Value-to-Income Ratio | Without Mortgage | With Mortgage |
| Less than 2.0x | 182 (79.1%) | 76,250 (22,295.3%) |
| 2.0x to 2.9x | 13 (5.7%) | 260 (76.0%) |
| 3.0x to 3.9x | 0 (0.0%) | 35 (10.2%) |
| 4.0x or more | 35 (15.2%) | 35 (10.2%) |
| Total | 230 (100.0%) | 342 (100.0%) |
Real Estate Taxes by Mortgage Status in Cloverdale
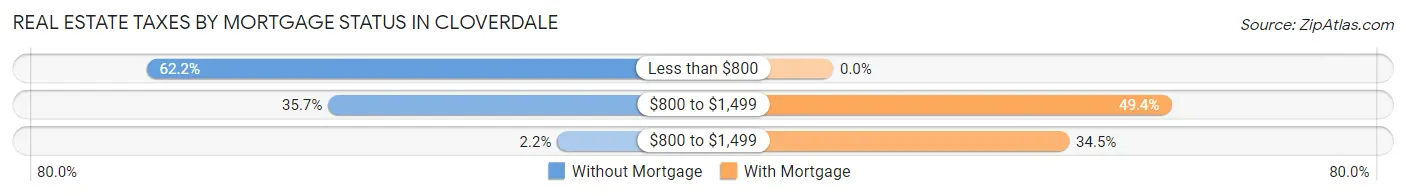
| Property Taxes | Without Mortgage | With Mortgage |
| Less than $800 | 143 (62.2%) | 0 (0.0%) |
| $800 to $1,499 | 82 (35.6%) | 169 (49.4%) |
| $800 to $1,499 | 5 (2.2%) | 118 (34.5%) |
| Total | 230 (100.0%) | 342 (100.0%) |
Health & Disability in Cloverdale
Health Insurance Coverage by Age in Cloverdale
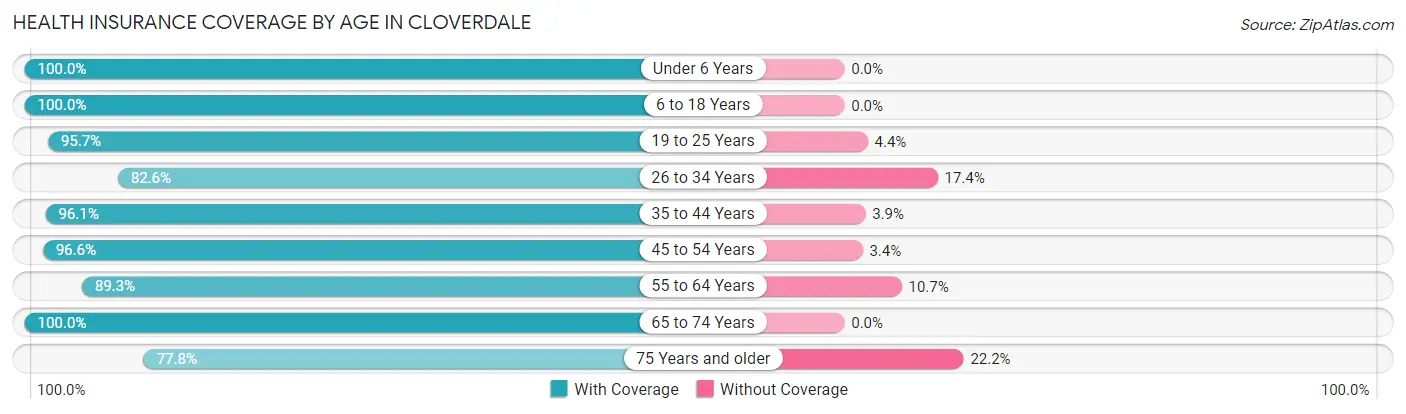
| Age Bracket | With Coverage | Without Coverage |
| Under 6 Years | 138 (100.0%) | 0 (0.0%) |
| 6 to 18 Years | 310 (100.0%) | 0 (0.0%) |
| 19 to 25 Years | 198 (95.7%) | 9 (4.3%) |
| 26 to 34 Years | 171 (82.6%) | 36 (17.4%) |
| 35 to 44 Years | 222 (96.1%) | 9 (3.9%) |
| 45 to 54 Years | 285 (96.6%) | 10 (3.4%) |
| 55 to 64 Years | 318 (89.3%) | 38 (10.7%) |
| 65 to 74 Years | 278 (100.0%) | 0 (0.0%) |
| 75 Years and older | 105 (77.8%) | 30 (22.2%) |
| Total | 2,025 (93.9%) | 132 (6.1%) |
Health Insurance Coverage by Citizenship Status in Cloverdale
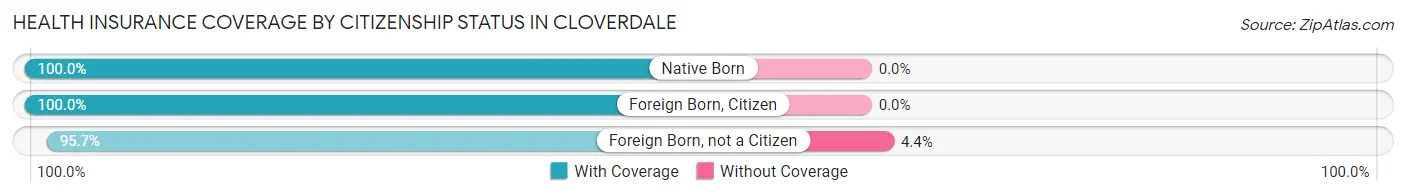
| Citizenship Status | With Coverage | Without Coverage |
| Native Born | 138 (100.0%) | 0 (0.0%) |
| Foreign Born, Citizen | 310 (100.0%) | 0 (0.0%) |
| Foreign Born, not a Citizen | 198 (95.7%) | 9 (4.3%) |
Health Insurance Coverage by Household Income in Cloverdale
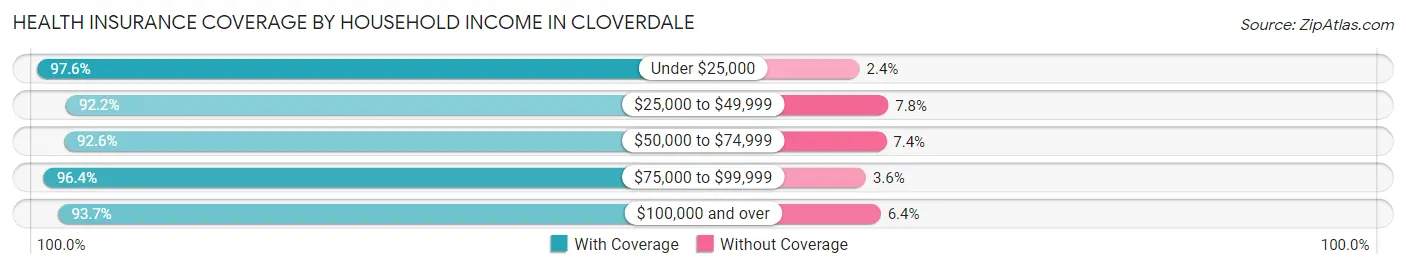
| Household Income | With Coverage | Without Coverage |
| Under $25,000 | 163 (97.6%) | 4 (2.4%) |
| $25,000 to $49,999 | 688 (92.2%) | 58 (7.8%) |
| $50,000 to $74,999 | 225 (92.6%) | 18 (7.4%) |
| $75,000 to $99,999 | 403 (96.4%) | 15 (3.6%) |
| $100,000 and over | 546 (93.6%) | 37 (6.4%) |
Public vs Private Health Insurance Coverage by Age in Cloverdale
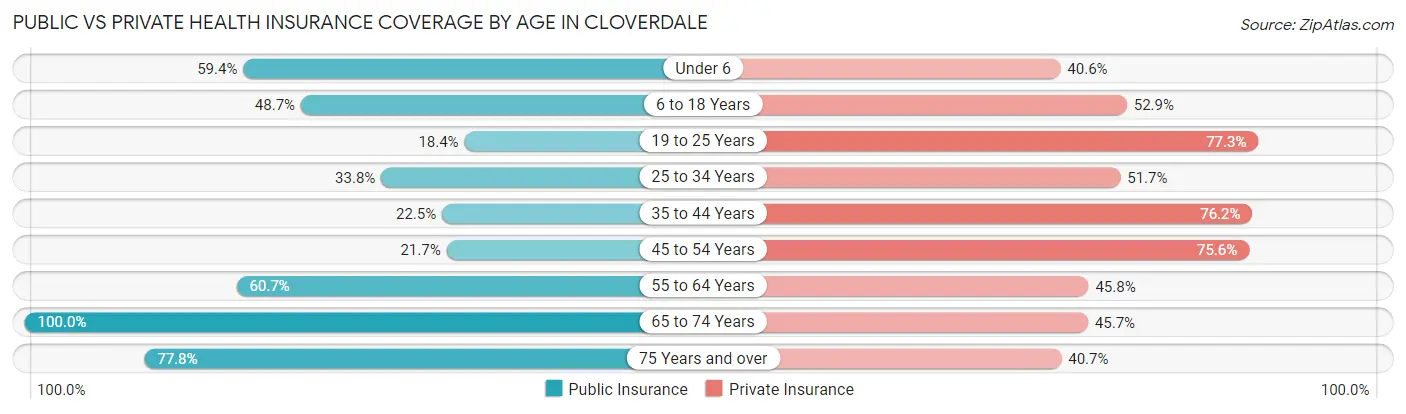
| Age Bracket | Public Insurance | Private Insurance |
| Under 6 | 82 (59.4%) | 56 (40.6%) |
| 6 to 18 Years | 151 (48.7%) | 164 (52.9%) |
| 19 to 25 Years | 38 (18.4%) | 160 (77.3%) |
| 25 to 34 Years | 70 (33.8%) | 107 (51.7%) |
| 35 to 44 Years | 52 (22.5%) | 176 (76.2%) |
| 45 to 54 Years | 64 (21.7%) | 223 (75.6%) |
| 55 to 64 Years | 216 (60.7%) | 163 (45.8%) |
| 65 to 74 Years | 278 (100.0%) | 127 (45.7%) |
| 75 Years and over | 105 (77.8%) | 55 (40.7%) |
| Total | 1,056 (49.0%) | 1,231 (57.1%) |
Disability Status by Sex by Age in Cloverdale
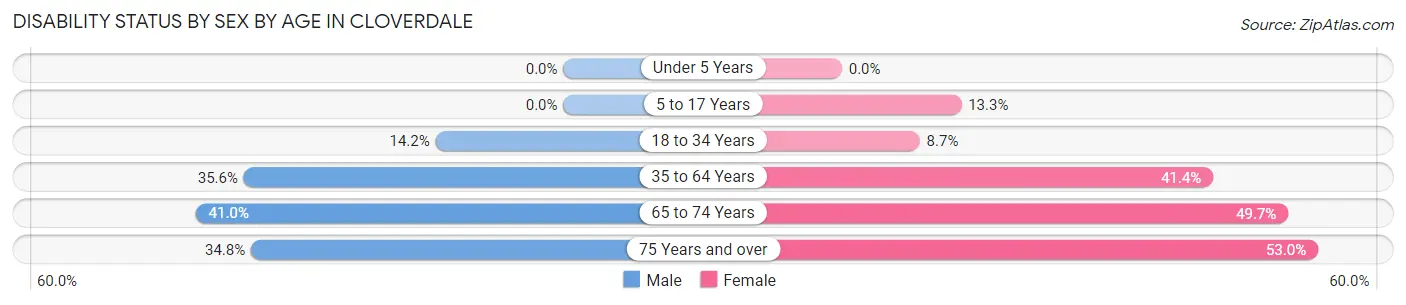
| Age Bracket | Male | Female |
| Under 5 Years | 0 (0.0%) | 0 (0.0%) |
| 5 to 17 Years | 0 (0.0%) | 29 (13.3%) |
| 18 to 34 Years | 38 (14.2%) | 15 (8.7%) |
| 35 to 64 Years | 147 (35.6%) | 194 (41.4%) |
| 65 to 74 Years | 43 (40.9%) | 86 (49.7%) |
| 75 Years and over | 24 (34.8%) | 35 (53.0%) |
Disability Class by Sex by Age in Cloverdale
Disability Class: Hearing Difficulty
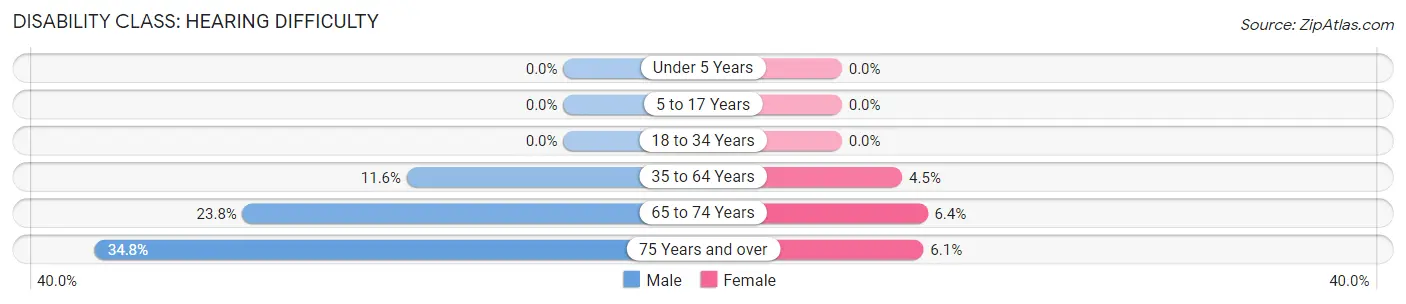
| Age Bracket | Male | Female |
| Under 5 Years | 0 (0.0%) | 0 (0.0%) |
| 5 to 17 Years | 0 (0.0%) | 0 (0.0%) |
| 18 to 34 Years | 0 (0.0%) | 0 (0.0%) |
| 35 to 64 Years | 48 (11.6%) | 21 (4.5%) |
| 65 to 74 Years | 25 (23.8%) | 11 (6.4%) |
| 75 Years and over | 24 (34.8%) | 4 (6.1%) |
Disability Class: Vision Difficulty
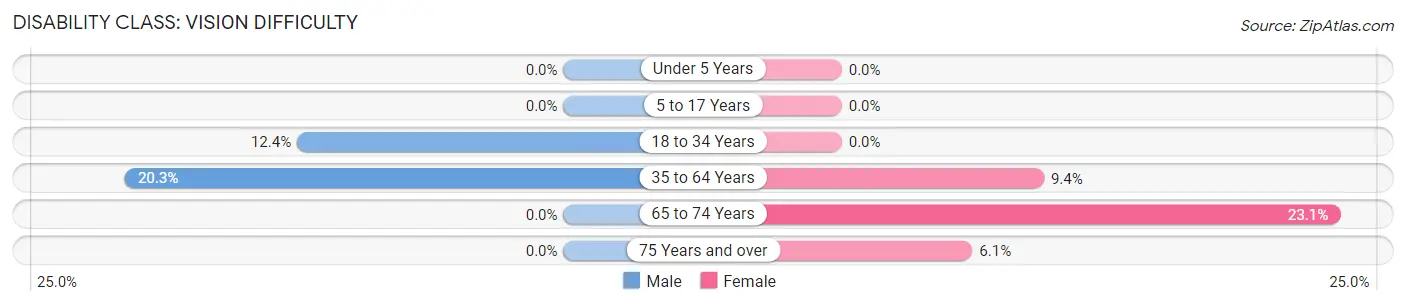
| Age Bracket | Male | Female |
| Under 5 Years | 0 (0.0%) | 0 (0.0%) |
| 5 to 17 Years | 0 (0.0%) | 0 (0.0%) |
| 18 to 34 Years | 33 (12.4%) | 0 (0.0%) |
| 35 to 64 Years | 84 (20.3%) | 44 (9.4%) |
| 65 to 74 Years | 0 (0.0%) | 40 (23.1%) |
| 75 Years and over | 0 (0.0%) | 4 (6.1%) |
Disability Class: Cognitive Difficulty
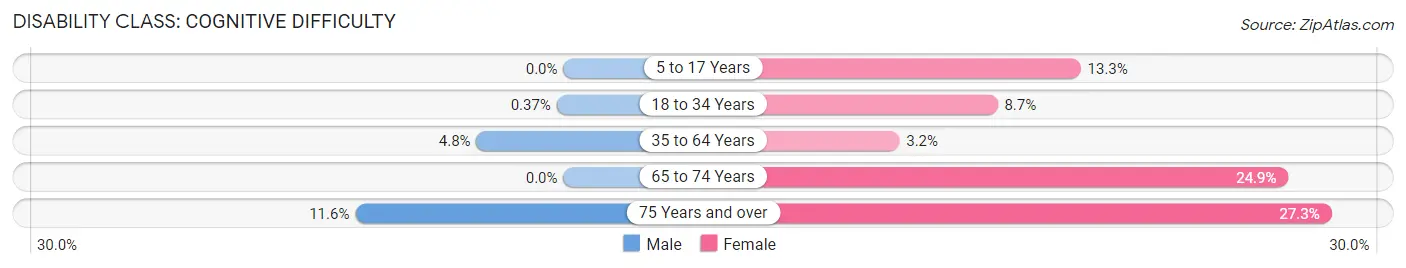
| Age Bracket | Male | Female |
| 5 to 17 Years | 0 (0.0%) | 29 (13.3%) |
| 18 to 34 Years | 1 (0.4%) | 15 (8.7%) |
| 35 to 64 Years | 20 (4.8%) | 15 (3.2%) |
| 65 to 74 Years | 0 (0.0%) | 43 (24.9%) |
| 75 Years and over | 8 (11.6%) | 18 (27.3%) |
Disability Class: Ambulatory Difficulty
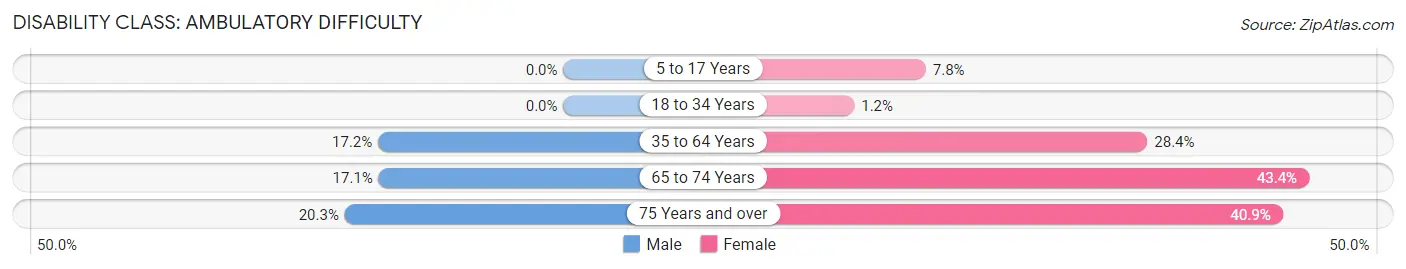
| Age Bracket | Male | Female |
| 5 to 17 Years | 0 (0.0%) | 17 (7.8%) |
| 18 to 34 Years | 0 (0.0%) | 2 (1.2%) |
| 35 to 64 Years | 71 (17.2%) | 133 (28.4%) |
| 65 to 74 Years | 18 (17.1%) | 75 (43.3%) |
| 75 Years and over | 14 (20.3%) | 27 (40.9%) |
Disability Class: Self-Care Difficulty
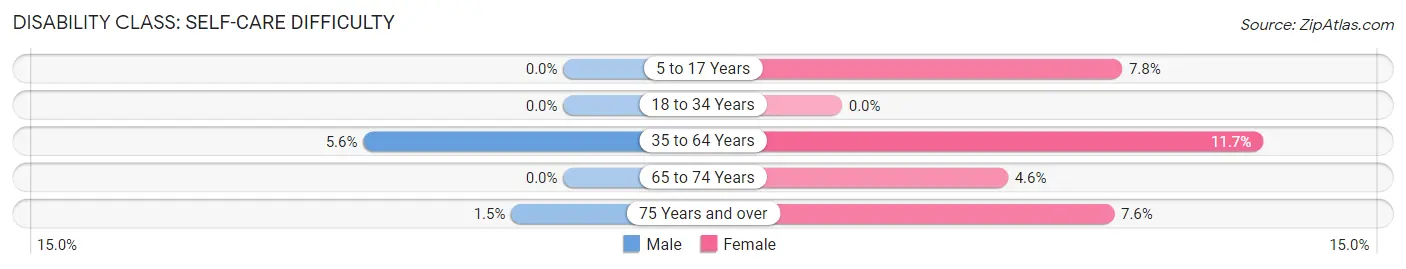
| Age Bracket | Male | Female |
| 5 to 17 Years | 0 (0.0%) | 17 (7.8%) |
| 18 to 34 Years | 0 (0.0%) | 0 (0.0%) |
| 35 to 64 Years | 23 (5.6%) | 55 (11.7%) |
| 65 to 74 Years | 0 (0.0%) | 8 (4.6%) |
| 75 Years and over | 1 (1.5%) | 5 (7.6%) |
Technology Access in Cloverdale
Computing Device Access in Cloverdale
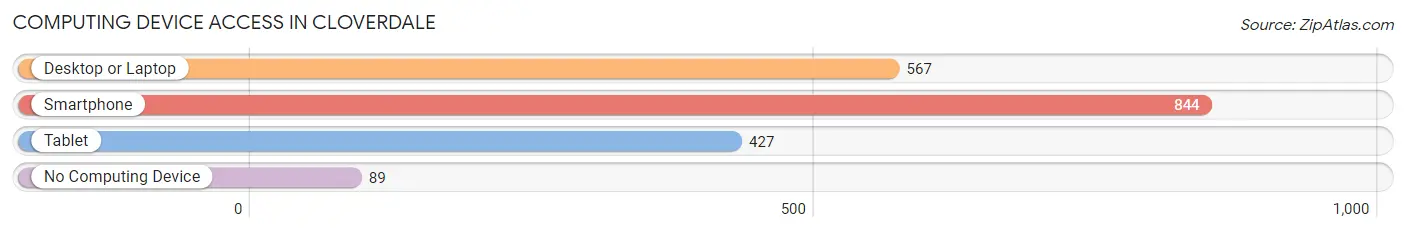
| Device Type | # Households | % Households |
| Desktop or Laptop | 567 | 59.7% |
| Smartphone | 844 | 88.8% |
| Tablet | 427 | 45.0% |
| No Computing Device | 89 | 9.4% |
| Total | 950 | 100.0% |
Internet Access in Cloverdale
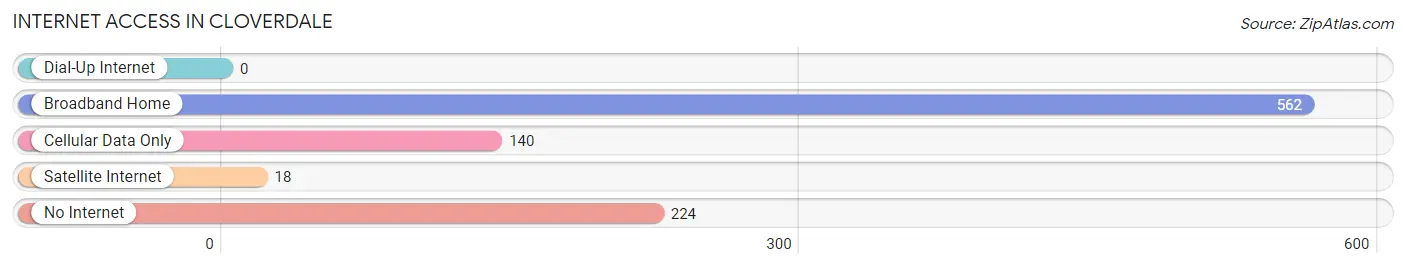
| Internet Type | # Households | % Households |
| Dial-Up Internet | 0 | 0.0% |
| Broadband Home | 562 | 59.2% |
| Cellular Data Only | 140 | 14.7% |
| Satellite Internet | 18 | 1.9% |
| No Internet | 224 | 23.6% |
| Total | 950 | 100.0% |
Cloverdale Summary
Cloverdale, Indiana is a small town located in Putnam County, Indiana. It is situated in the western part of the state, about 40 miles west of Indianapolis. The town has a population of approximately 1,500 people and is part of the Greater Indianapolis Metropolitan Area.
History
Cloverdale was founded in 1837 by a group of settlers from North Carolina. The town was named after the clover fields that surrounded the area. The first post office was established in 1838 and the town was officially incorporated in 1845.
The town grew slowly but steadily throughout the 19th century. In 1876, the Cloverdale and Indianapolis Railroad was built, connecting the town to the larger city of Indianapolis. This allowed for increased trade and commerce between the two towns.
In the early 20th century, Cloverdale experienced a period of growth and prosperity. The town was home to several factories, including a flour mill, a furniture factory, and a canning factory. The town also had a thriving agricultural industry, with many farmers growing corn, wheat, and other crops.
Geography
Cloverdale is located in the western part of Putnam County, Indiana. It is situated in the Wabash Valley, which is part of the larger Midwest region. The town is located on the banks of the Wabash River, which flows through the area.
The town is surrounded by rolling hills and farmland. The climate in the area is generally mild, with hot summers and cold winters. The average annual temperature is around 50 degrees Fahrenheit.
Economy
Cloverdale’s economy is largely based on agriculture and manufacturing. The town is home to several factories, including a flour mill, a furniture factory, and a canning factory. The town also has a thriving agricultural industry, with many farmers growing corn, wheat, and other crops.
The town is also home to several small businesses, including restaurants, shops, and other services. The town is also home to a branch of the Putnam County Library.
Demographics
As of the 2010 census, the population of Cloverdale was 1,500. The racial makeup of the town was 97.3% White, 0.7% African American, 0.3% Native American, 0.3% Asian, and 1.3% from other races. The median household income was $37,500.
The town is home to a variety of religious denominations, including Baptist, Methodist, and Catholic. The town is also home to a variety of cultural and recreational activities, including a local theater, a golf course, and several parks.
Conclusion
Cloverdale, Indiana is a small town located in Putnam County, Indiana. It is situated in the western part of the state, about 40 miles west of Indianapolis. The town has a population of approximately 1,500 people and is part of the Greater Indianapolis Metropolitan Area. The town’s economy is largely based on agriculture and manufacturing, and the town is home to several small businesses, including restaurants, shops, and other services. The town is also home to a variety of religious denominations, including Baptist, Methodist, and Catholic. The town is also home to a variety of cultural and recreational activities, including a local theater, a golf course, and several parks.
Common Questions
What is Per Capita Income in Cloverdale?
Per Capita income in Cloverdale is $25,116.
What is the Median Family Income in Cloverdale?
Median Family Income in Cloverdale is $60,313.
What is the Median Household income in Cloverdale?
Median Household Income in Cloverdale is $46,354.
What is Income or Wage Gap in Cloverdale?
Income or Wage Gap in Cloverdale is 34.0%.
Women in Cloverdale earn 66.0 cents for every dollar earned by a man.
What is Inequality or Gini Index in Cloverdale?
Inequality or Gini Index in Cloverdale is 0.36.
What is the Total Population of Cloverdale?
Total Population of Cloverdale is 2,201.
What is the Total Male Population of Cloverdale?
Total Male Population of Cloverdale is 1,063.
What is the Total Female Population of Cloverdale?
Total Female Population of Cloverdale is 1,138.
What is the Ratio of Males per 100 Females in Cloverdale?
There are 93.41 Males per 100 Females in Cloverdale.
What is the Ratio of Females per 100 Males in Cloverdale?
There are 107.06 Females per 100 Males in Cloverdale.
What is the Median Population Age in Cloverdale?
Median Population Age in Cloverdale is 45.2 Years.
What is the Average Family Size in Cloverdale
Average Family Size in Cloverdale is 2.8 People.
What is the Average Household Size in Cloverdale
Average Household Size in Cloverdale is 2.3 People.
How Large is the Labor Force in Cloverdale?
There are 1,082 People in the Labor Forcein in Cloverdale.
What is the Percentage of People in the Labor Force in Cloverdale?
60.0% of People are in the Labor Force in Cloverdale.
What is the Unemployment Rate in Cloverdale?
Unemployment Rate in Cloverdale is 6.6%.