Vincennes, IN Map & Demographics
Vincennes Map
Vincennes Overview
$28,924
PER CAPITA INCOME
$61,374
AVG FAMILY INCOME
$47,376
AVG HOUSEHOLD INCOME
28.1%
WAGE / INCOME GAP [ % ]
71.9¢/ $1
WAGE / INCOME GAP [ $ ]
$9,388
FAMILY INCOME DEFICIT
0.48
INEQUALITY / GINI INDEX
16,715
TOTAL POPULATION
8,377
MALE POPULATION
8,338
FEMALE POPULATION
100.47
MALES / 100 FEMALES
99.53
FEMALES / 100 MALES
37.1
MEDIAN AGE
2.7
AVG FAMILY SIZE
2.1
AVG HOUSEHOLD SIZE
8,539
LABOR FORCE [ PEOPLE ]
61.1%
PERCENT IN LABOR FORCE
5.3%
UNEMPLOYMENT RATE
Vincennes Zip Codes
Vincennes Area Codes
Income in Vincennes
Income Overview in Vincennes
Per Capita Income in Vincennes is $28,924, while median incomes of families and households are $61,374 and $47,376 respectively.
| Characteristic | Number | Measure |
| Per Capita Income | 16,715 | $28,924 |
| Median Family Income | 4,100 | $61,374 |
| Mean Family Income | 4,100 | $78,304 |
| Median Household Income | 7,173 | $47,376 |
| Mean Household Income | 7,173 | $66,604 |
| Income Deficit | 4,100 | $9,388 |
| Wage / Income Gap (%) | 16,715 | 28.08% |
| Wage / Income Gap ($) | 16,715 | 71.92¢ per $1 |
| Gini / Inequality Index | 16,715 | 0.48 |
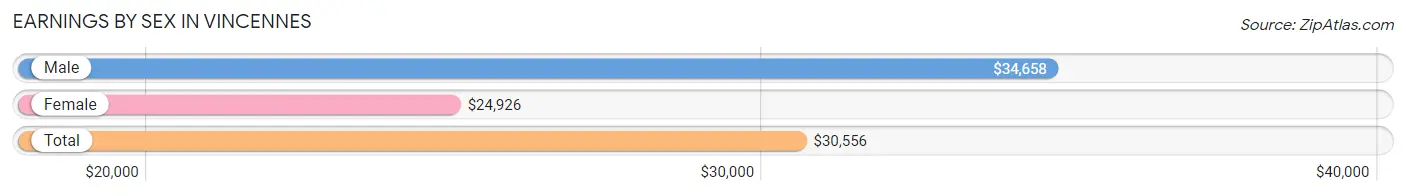
Earnings by Sex in Vincennes
Average Earnings in Vincennes are $30,556, $34,658 for men and $24,926 for women, a difference of 28.1%.
| Sex | Number | Average Earnings |
| Male | 4,981 (56.0%) | $34,658 |
| Female | 3,917 (44.0%) | $24,926 |
| Total | 8,898 (100.0%) | $30,556 |
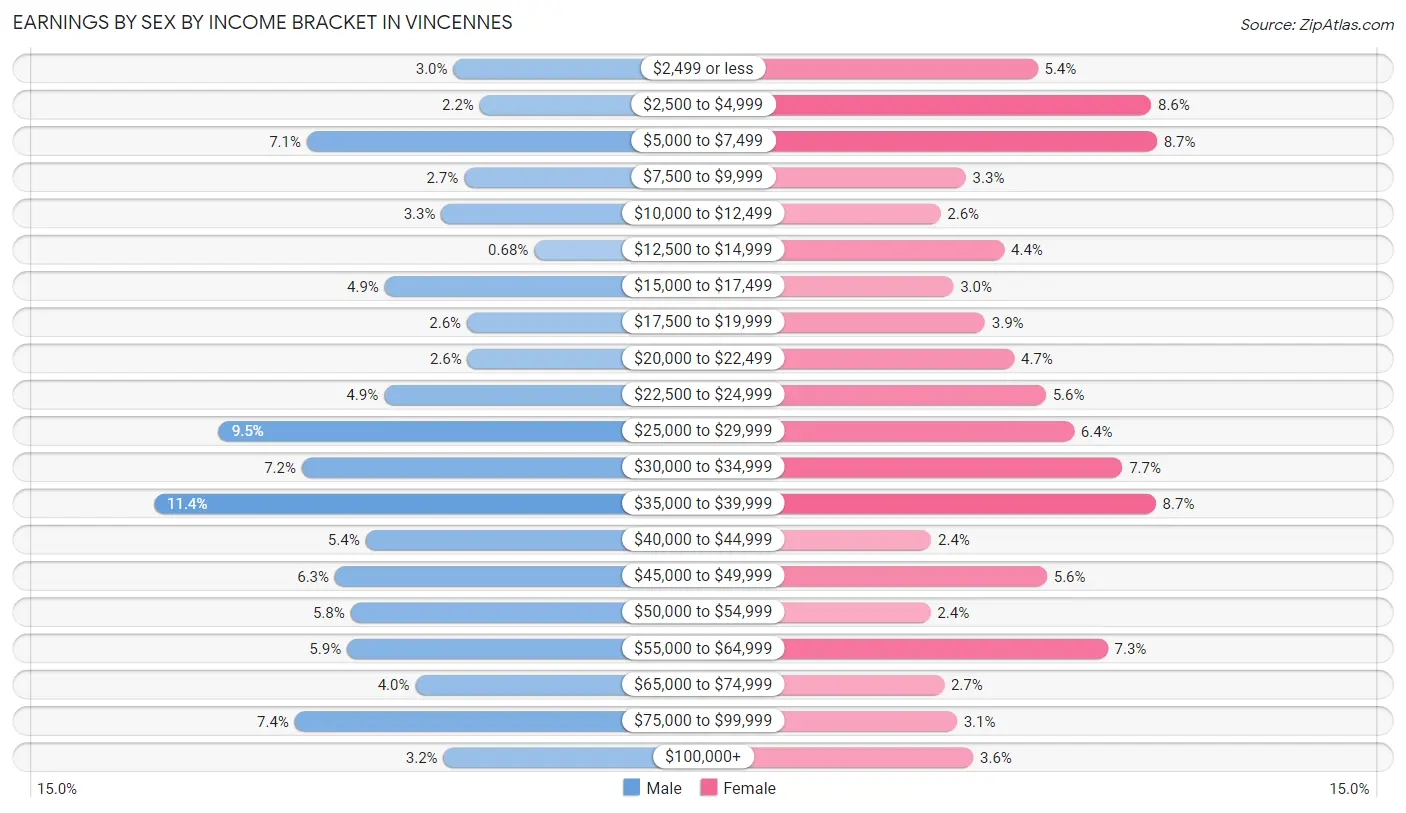
Earnings by Sex by Income Bracket in Vincennes
The most common earnings brackets in Vincennes are $35,000 to $39,999 for men (566 | 11.4%) and $5,000 to $7,499 for women (341 | 8.7%).
| Income | Male | Female |
| $2,499 or less | 147 (2.9%) | 210 (5.4%) |
| $2,500 to $4,999 | 110 (2.2%) | 335 (8.6%) |
| $5,000 to $7,499 | 352 (7.1%) | 341 (8.7%) |
| $7,500 to $9,999 | 132 (2.6%) | 131 (3.3%) |
| $10,000 to $12,499 | 164 (3.3%) | 103 (2.6%) |
| $12,500 to $14,999 | 34 (0.7%) | 173 (4.4%) |
| $15,000 to $17,499 | 243 (4.9%) | 117 (3.0%) |
| $17,500 to $19,999 | 128 (2.6%) | 152 (3.9%) |
| $20,000 to $22,499 | 127 (2.5%) | 184 (4.7%) |
| $22,500 to $24,999 | 244 (4.9%) | 219 (5.6%) |
| $25,000 to $29,999 | 475 (9.5%) | 250 (6.4%) |
| $30,000 to $34,999 | 359 (7.2%) | 303 (7.7%) |
| $35,000 to $39,999 | 566 (11.4%) | 340 (8.7%) |
| $40,000 to $44,999 | 270 (5.4%) | 93 (2.4%) |
| $45,000 to $49,999 | 313 (6.3%) | 220 (5.6%) |
| $50,000 to $54,999 | 291 (5.8%) | 92 (2.4%) |
| $55,000 to $64,999 | 296 (5.9%) | 287 (7.3%) |
| $65,000 to $74,999 | 200 (4.0%) | 107 (2.7%) |
| $75,000 to $99,999 | 369 (7.4%) | 121 (3.1%) |
| $100,000+ | 161 (3.2%) | 139 (3.5%) |
| Total | 4,981 (100.0%) | 3,917 (100.0%) |
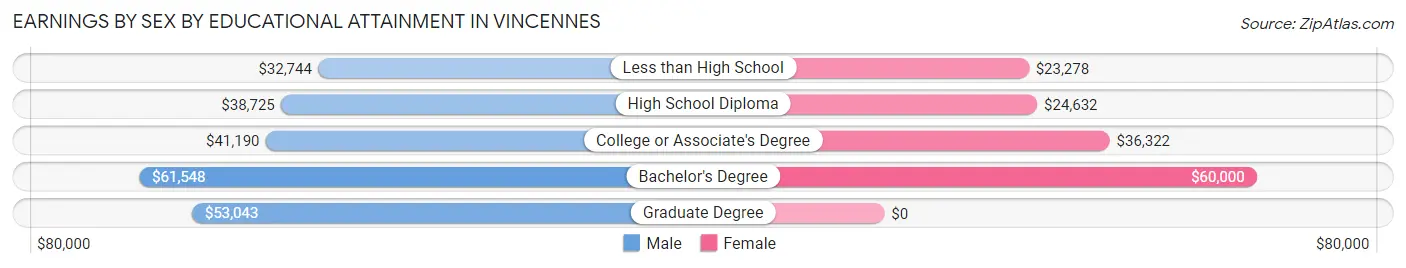
Earnings by Sex by Educational Attainment in Vincennes
Average earnings in Vincennes are $39,809 for men and $32,633 for women, a difference of 18.0%. Men with an educational attainment of bachelor's degree enjoy the highest average annual earnings of $61,548, while those with less than high school education earn the least with $32,744. Women with an educational attainment of bachelor's degree earn the most with the average annual earnings of $60,000, while those with less than high school education have the smallest earnings of $23,278.
| Educational Attainment | Male Income | Female Income |
| Less than High School | $32,744 | $23,278 |
| High School Diploma | $38,725 | $24,632 |
| College or Associate's Degree | $41,190 | $36,322 |
| Bachelor's Degree | $61,548 | $60,000 |
| Graduate Degree | $53,043 | $0 |
| Total | $39,809 | $32,633 |
Family Income in Vincennes
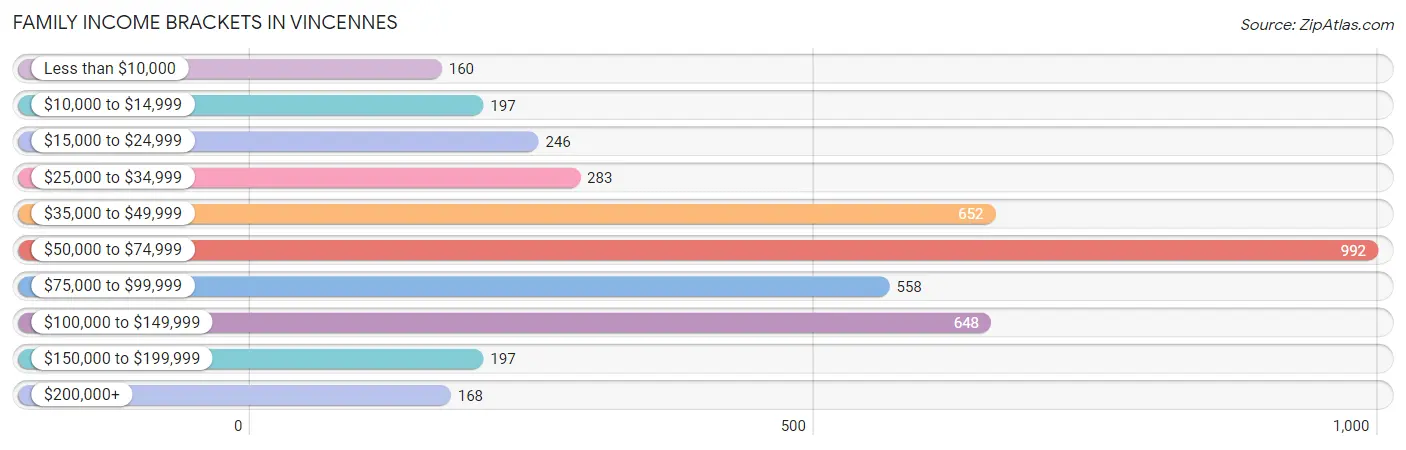
Family Income Brackets in Vincennes
According to the Vincennes family income data, there are 992 families falling into the $50,000 to $74,999 income range, which is the most common income bracket and makes up 24.2% of all families. Conversely, the less than $10,000 income bracket is the least frequent group with only 160 families (3.9%) belonging to this category.
| Income Bracket | # Families | % Families |
| Less than $10,000 | 160 | 3.9% |
| $10,000 to $14,999 | 197 | 4.8% |
| $15,000 to $24,999 | 246 | 6.0% |
| $25,000 to $34,999 | 283 | 6.9% |
| $35,000 to $49,999 | 652 | 15.9% |
| $50,000 to $74,999 | 992 | 24.2% |
| $75,000 to $99,999 | 558 | 13.6% |
| $100,000 to $149,999 | 648 | 15.8% |
| $150,000 to $199,999 | 197 | 4.8% |
| $200,000+ | 168 | 4.1% |
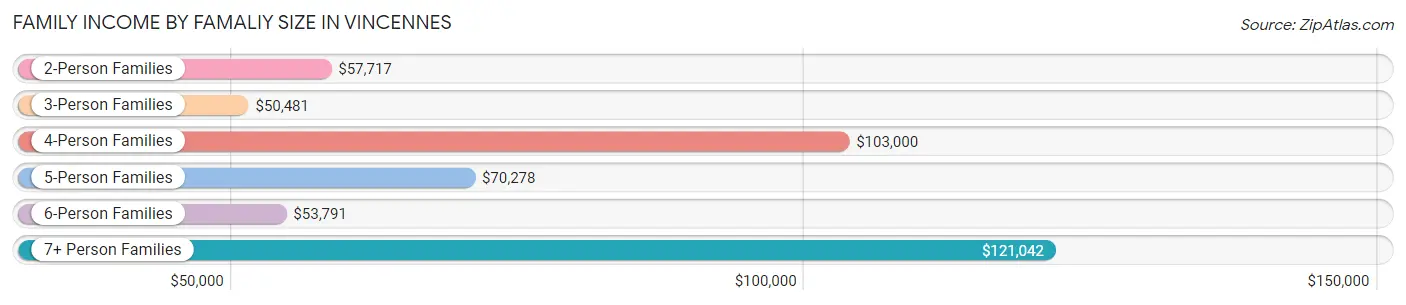
Family Income by Famaliy Size in Vincennes
7+ person families (90 | 2.2%) account for the highest median family income in Vincennes with $121,042 per family, while 2-person families (1,988 | 48.5%) have the highest median income of $28,858 per family member.
| Income Bracket | # Families | Median Income |
| 2-Person Families | 1,988 (48.5%) | $57,717 |
| 3-Person Families | 907 (22.1%) | $50,481 |
| 4-Person Families | 682 (16.6%) | $103,000 |
| 5-Person Families | 204 (5.0%) | $70,278 |
| 6-Person Families | 229 (5.6%) | $53,791 |
| 7+ Person Families | 90 (2.2%) | $121,042 |
| Total | 4,100 (100.0%) | $61,374 |
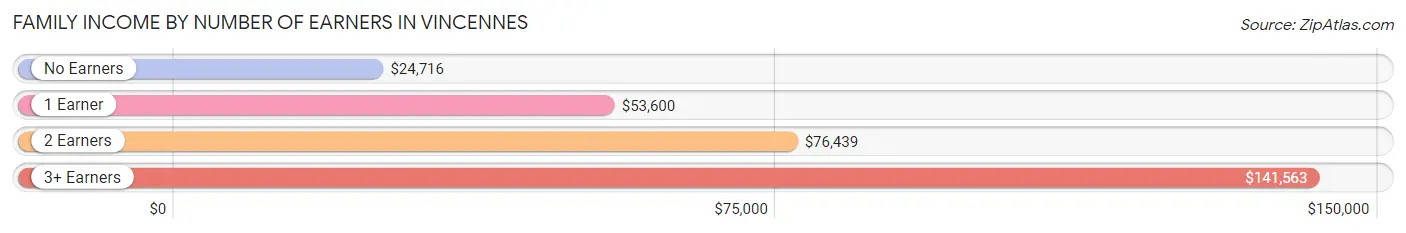
Family Income by Number of Earners in Vincennes
The median family income in Vincennes is $61,374, with families comprising 3+ earners (456) having the highest median family income of $141,563, while families with no earners (749) have the lowest median family income of $24,716, accounting for 11.1% and 18.3% of families, respectively.
| Number of Earners | # Families | Median Income |
| No Earners | 749 (18.3%) | $24,716 |
| 1 Earner | 1,490 (36.3%) | $53,600 |
| 2 Earners | 1,405 (34.3%) | $76,439 |
| 3+ Earners | 456 (11.1%) | $141,563 |
| Total | 4,100 (100.0%) | $61,374 |
Household Income in Vincennes
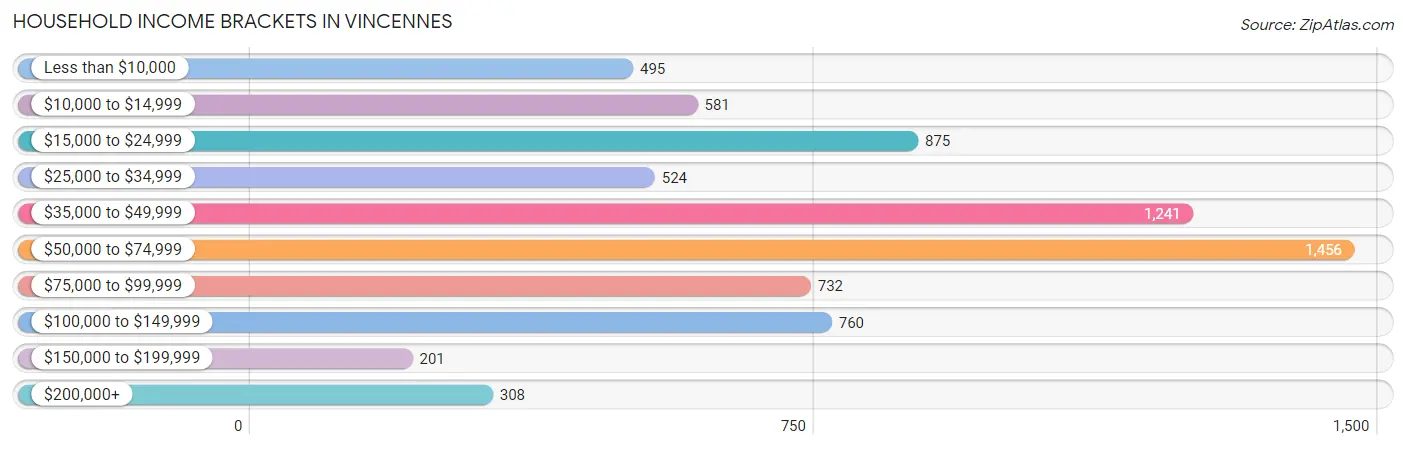
Household Income Brackets in Vincennes
With 1,456 households falling in the category, the $50,000 to $74,999 income range is the most frequent in Vincennes, accounting for 20.3% of all households. In contrast, only 201 households (2.8%) fall into the $150,000 to $199,999 income bracket, making it the least populous group.
| Income Bracket | # Households | % Households |
| Less than $10,000 | 495 | 6.9% |
| $10,000 to $14,999 | 581 | 8.1% |
| $15,000 to $24,999 | 875 | 12.2% |
| $25,000 to $34,999 | 524 | 7.3% |
| $35,000 to $49,999 | 1,241 | 17.3% |
| $50,000 to $74,999 | 1,456 | 20.3% |
| $75,000 to $99,999 | 732 | 10.2% |
| $100,000 to $149,999 | 760 | 10.6% |
| $150,000 to $199,999 | 201 | 2.8% |
| $200,000+ | 308 | 4.3% |
Household Income by Householder Age in Vincennes
The median household income in Vincennes is $47,376, with the highest median household income of $54,289 found in the 45 to 64 years age bracket for the primary householder. A total of 2,615 households (36.5%) fall into this category. Meanwhile, the 15 to 24 years age bracket for the primary householder has the lowest median household income of $22,417, with 555 households (7.7%) in this group.
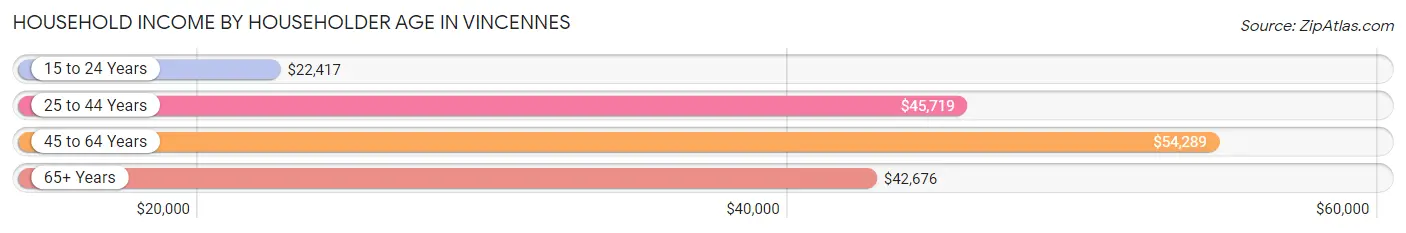
| Income Bracket | # Households | Median Income |
| 15 to 24 Years | 555 (7.7%) | $22,417 |
| 25 to 44 Years | 2,068 (28.8%) | $45,719 |
| 45 to 64 Years | 2,615 (36.5%) | $54,289 |
| 65+ Years | 1,935 (27.0%) | $42,676 |
| Total | 7,173 (100.0%) | $47,376 |
Poverty in Vincennes
Income Below Poverty by Sex and Age in Vincennes
With 14.2% poverty level for males and 25.6% for females among the residents of Vincennes, under 5 year old males and 18 to 24 year old females are the most vulnerable to poverty, with 220 males (48.2%) and 267 females (38.6%) in their respective age groups living below the poverty level.
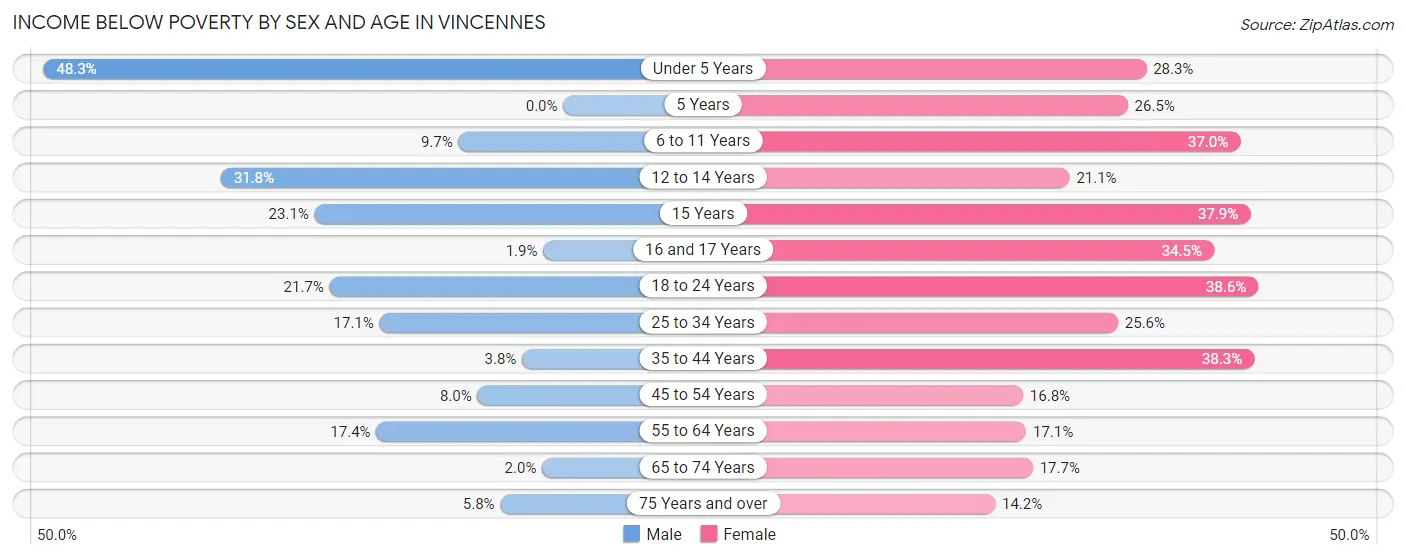
| Age Bracket | Male | Female |
| Under 5 Years | 220 (48.2%) | 102 (28.2%) |
| 5 Years | 0 (0.0%) | 13 (26.5%) |
| 6 to 11 Years | 49 (9.7%) | 197 (37.0%) |
| 12 to 14 Years | 62 (31.8%) | 60 (21.1%) |
| 15 Years | 15 (23.1%) | 36 (37.9%) |
| 16 and 17 Years | 3 (1.9%) | 97 (34.5%) |
| 18 to 24 Years | 236 (21.7%) | 267 (38.6%) |
| 25 to 34 Years | 156 (17.1%) | 237 (25.6%) |
| 35 to 44 Years | 33 (3.8%) | 401 (38.3%) |
| 45 to 54 Years | 91 (8.0%) | 156 (16.8%) |
| 55 to 64 Years | 174 (17.3%) | 165 (17.1%) |
| 65 to 74 Years | 13 (2.0%) | 132 (17.7%) |
| 75 Years and over | 23 (5.8%) | 118 (14.2%) |
| Total | 1,075 (14.2%) | 1,981 (25.6%) |
Income Above Poverty by Sex and Age in Vincennes
According to the poverty statistics in Vincennes, males aged 5 years and females aged 75 years and over are the age groups that are most secure financially, with 100.0% of males and 85.8% of females in these age groups living above the poverty line.
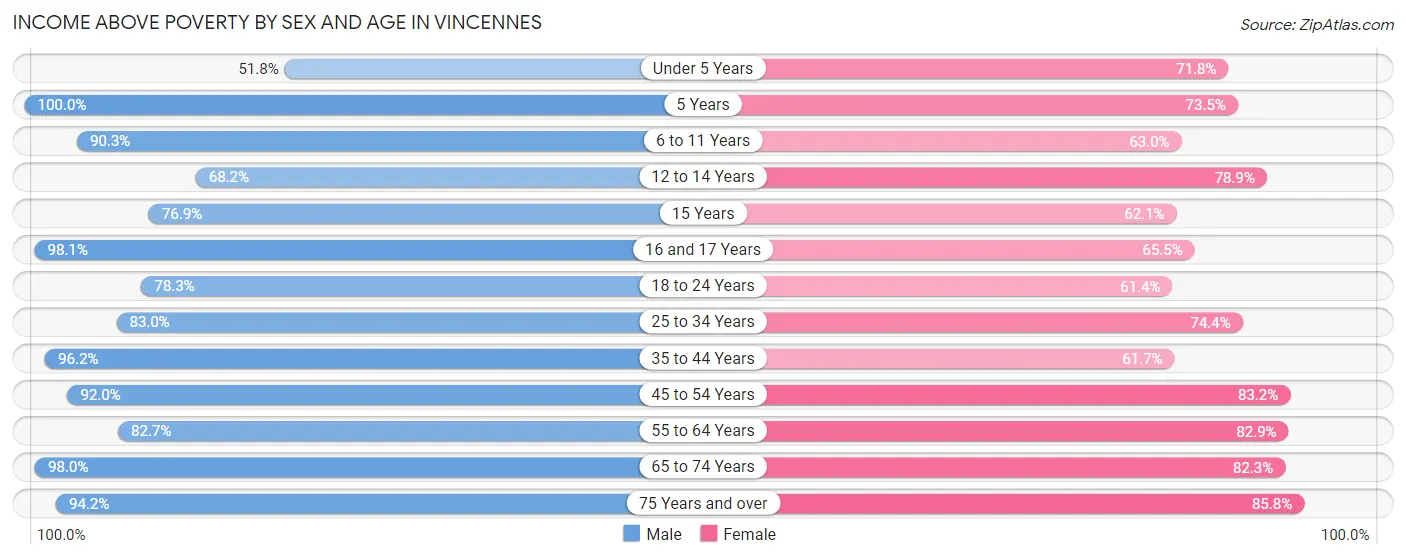
| Age Bracket | Male | Female |
| Under 5 Years | 236 (51.7%) | 259 (71.8%) |
| 5 Years | 102 (100.0%) | 36 (73.5%) |
| 6 to 11 Years | 455 (90.3%) | 336 (63.0%) |
| 12 to 14 Years | 133 (68.2%) | 224 (78.9%) |
| 15 Years | 50 (76.9%) | 59 (62.1%) |
| 16 and 17 Years | 158 (98.1%) | 184 (65.5%) |
| 18 to 24 Years | 852 (78.3%) | 424 (61.4%) |
| 25 to 34 Years | 759 (83.0%) | 688 (74.4%) |
| 35 to 44 Years | 832 (96.2%) | 647 (61.7%) |
| 45 to 54 Years | 1,052 (92.0%) | 772 (83.2%) |
| 55 to 64 Years | 829 (82.7%) | 800 (82.9%) |
| 65 to 74 Years | 651 (98.0%) | 613 (82.3%) |
| 75 Years and over | 371 (94.2%) | 712 (85.8%) |
| Total | 6,480 (85.8%) | 5,754 (74.4%) |
Income Below Poverty Among Married-Couple Families in Vincennes
The poverty statistics for married-couple families in Vincennes show that 3.5% or 96 of the total 2,736 families live below the poverty line. Families with 3 or 4 children have the highest poverty rate of 22.2%, comprising of 30 families. On the other hand, families with 5 or more children have the lowest poverty rate of 0.0%, which includes 0 families.
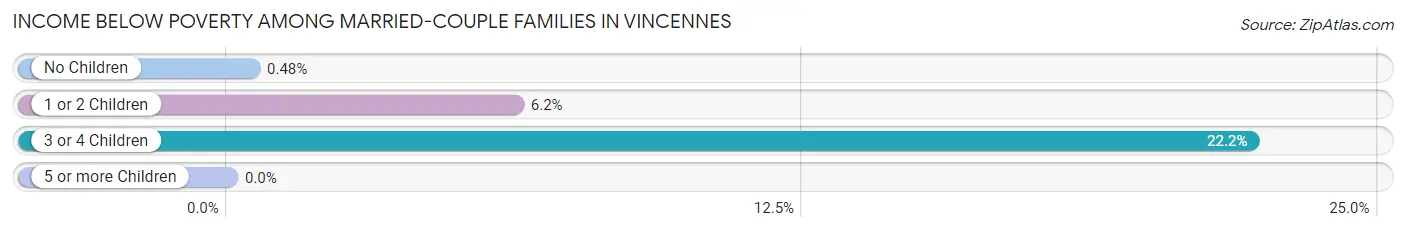
| Children | Above Poverty | Below Poverty |
| No Children | 1,643 (99.5%) | 8 (0.5%) |
| 1 or 2 Children | 875 (93.8%) | 58 (6.2%) |
| 3 or 4 Children | 105 (77.8%) | 30 (22.2%) |
| 5 or more Children | 17 (100.0%) | 0 (0.0%) |
| Total | 2,640 (96.5%) | 96 (3.5%) |
Income Below Poverty Among Single-Parent Households in Vincennes
According to the poverty data in Vincennes, 9.9% or 58 single-father households and 53.1% or 412 single-mother households are living below the poverty line. Among single-father households, those with 3 or 4 children have the highest poverty rate, with 21 households (63.6%) experiencing poverty. Likewise, among single-mother households, those with 1 or 2 children have the highest poverty rate, with 381 households (64.5%) falling below the poverty line.
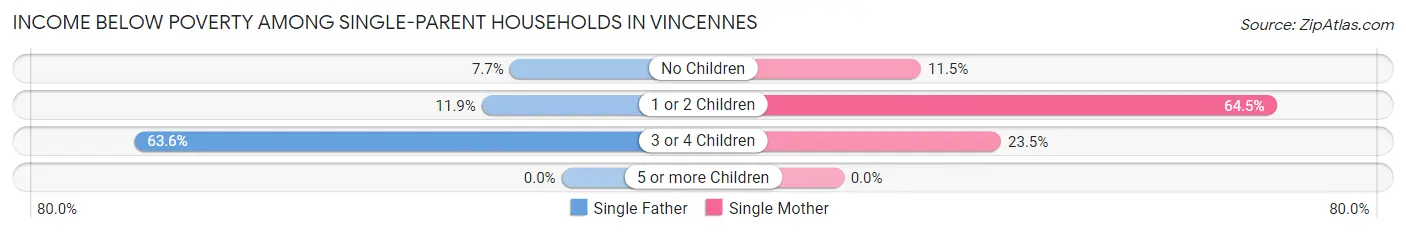
| Children | Single Father | Single Mother |
| No Children | 12 (7.7%) | 12 (11.5%) |
| 1 or 2 Children | 25 (11.9%) | 381 (64.5%) |
| 3 or 4 Children | 21 (63.6%) | 19 (23.5%) |
| 5 or more Children | 0 (0.0%) | 0 (0.0%) |
| Total | 58 (9.9%) | 412 (53.1%) |
Income Below Poverty Among Married-Couple vs Single-Parent Households in Vincennes
The poverty data for Vincennes shows that 96 of the married-couple family households (3.5%) and 470 of the single-parent households (34.5%) are living below the poverty level. Within the married-couple family households, those with 3 or 4 children have the highest poverty rate, with 30 households (22.2%) falling below the poverty line. Among the single-parent households, those with 1 or 2 children have the highest poverty rate, with 406 household (50.7%) living below poverty.
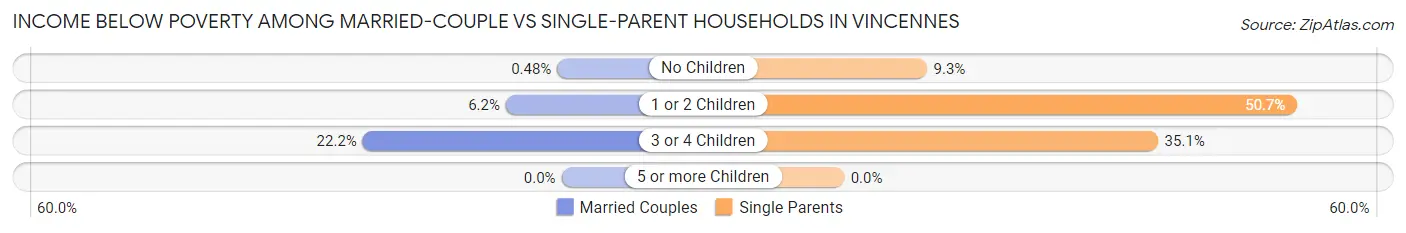
| Children | Married-Couple Families | Single-Parent Households |
| No Children | 8 (0.5%) | 24 (9.3%) |
| 1 or 2 Children | 58 (6.2%) | 406 (50.7%) |
| 3 or 4 Children | 30 (22.2%) | 40 (35.1%) |
| 5 or more Children | 0 (0.0%) | 0 (0.0%) |
| Total | 96 (3.5%) | 470 (34.5%) |
Race in Vincennes
The most populous races in Vincennes are White / Caucasian (14,454 | 86.5%), Two or more Races (860 | 5.1%), and Black / African American (790 | 4.7%).
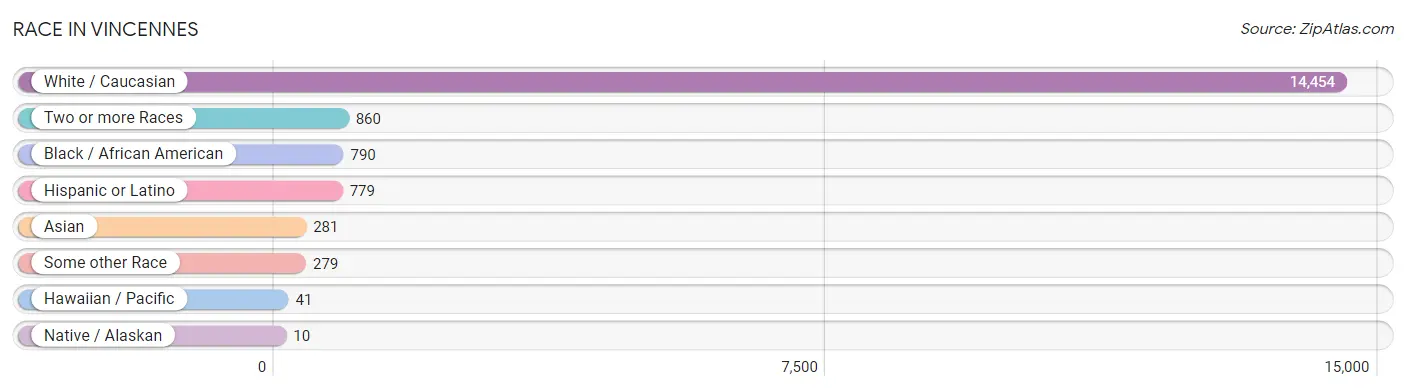
| Race | # Population | % Population |
| Asian | 281 | 1.7% |
| Black / African American | 790 | 4.7% |
| Hawaiian / Pacific | 41 | 0.3% |
| Hispanic or Latino | 779 | 4.7% |
| Native / Alaskan | 10 | 0.1% |
| White / Caucasian | 14,454 | 86.5% |
| Two or more Races | 860 | 5.1% |
| Some other Race | 279 | 1.7% |
| Total | 16,715 | 100.0% |
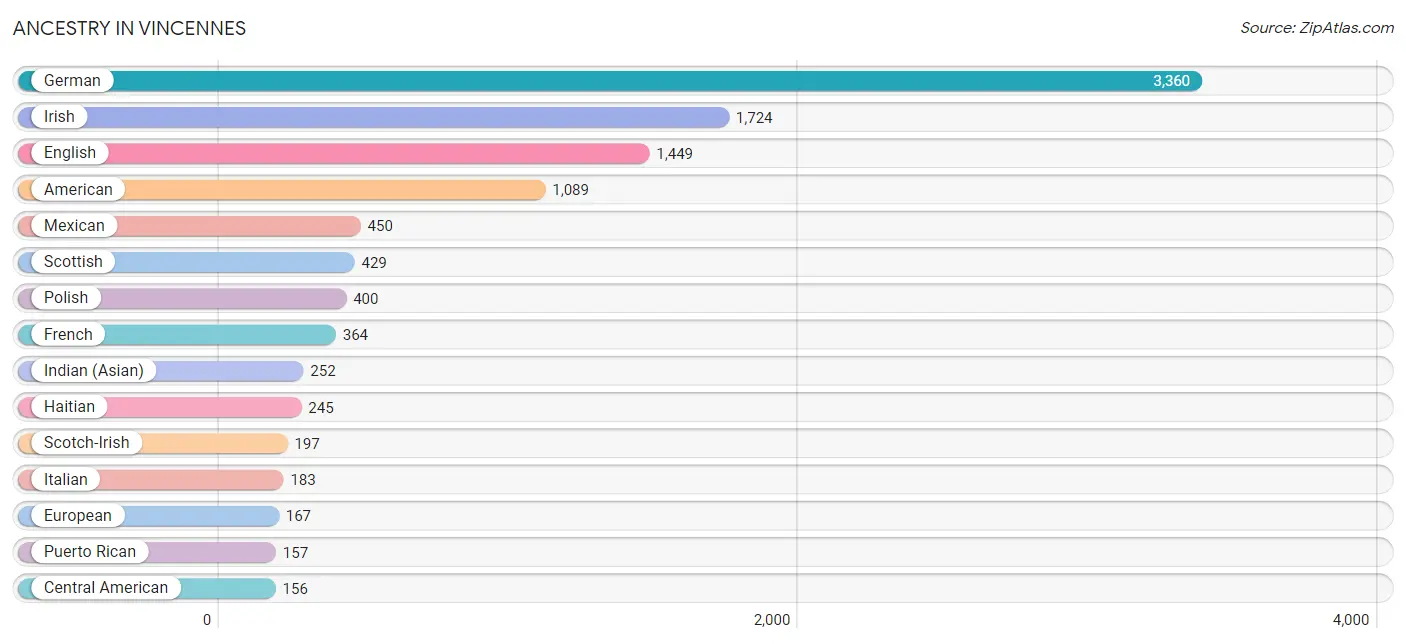
Ancestry in Vincennes
The most populous ancestries reported in Vincennes are German (3,360 | 20.1%), Irish (1,724 | 10.3%), English (1,449 | 8.7%), American (1,089 | 6.5%), and Mexican (450 | 2.7%), together accounting for 48.3% of all Vincennes residents.
| Ancestry | # Population | % Population |
| African | 24 | 0.1% |
| American | 1,089 | 6.5% |
| Arab | 22 | 0.1% |
| Austrian | 35 | 0.2% |
| Belgian | 13 | 0.1% |
| Bhutanese | 7 | 0.0% |
| Blackfeet | 8 | 0.1% |
| British | 48 | 0.3% |
| Central American | 156 | 0.9% |
| Cherokee | 47 | 0.3% |
| Choctaw | 5 | 0.0% |
| Croatian | 24 | 0.1% |
| Crow | 8 | 0.1% |
| Danish | 58 | 0.4% |
| Dutch | 111 | 0.7% |
| Eastern European | 4 | 0.0% |
| English | 1,449 | 8.7% |
| European | 167 | 1.0% |
| French | 364 | 2.2% |
| French Canadian | 10 | 0.1% |
| German | 3,360 | 20.1% |
| Greek | 39 | 0.2% |
| Guatemalan | 156 | 0.9% |
| Haitian | 245 | 1.5% |
| Hungarian | 11 | 0.1% |
| Indian (Asian) | 252 | 1.5% |
| Irish | 1,724 | 10.3% |
| Iroquois | 5 | 0.0% |
| Italian | 183 | 1.1% |
| Jordanian | 22 | 0.1% |
| Korean | 22 | 0.1% |
| Mexican | 450 | 2.7% |
| Native Hawaiian | 41 | 0.3% |
| Norwegian | 11 | 0.1% |
| Pennsylvania German | 13 | 0.1% |
| Polish | 400 | 2.4% |
| Puerto Rican | 157 | 0.9% |
| Romanian | 102 | 0.6% |
| Scandinavian | 13 | 0.1% |
| Scotch-Irish | 197 | 1.2% |
| Scottish | 429 | 2.6% |
| Slovak | 8 | 0.1% |
| Subsaharan African | 98 | 0.6% |
| Swedish | 13 | 0.1% |
| Swiss | 8 | 0.1% |
| Ukrainian | 3 | 0.0% |
| Welsh | 98 | 0.6% | View All 47 Rows |
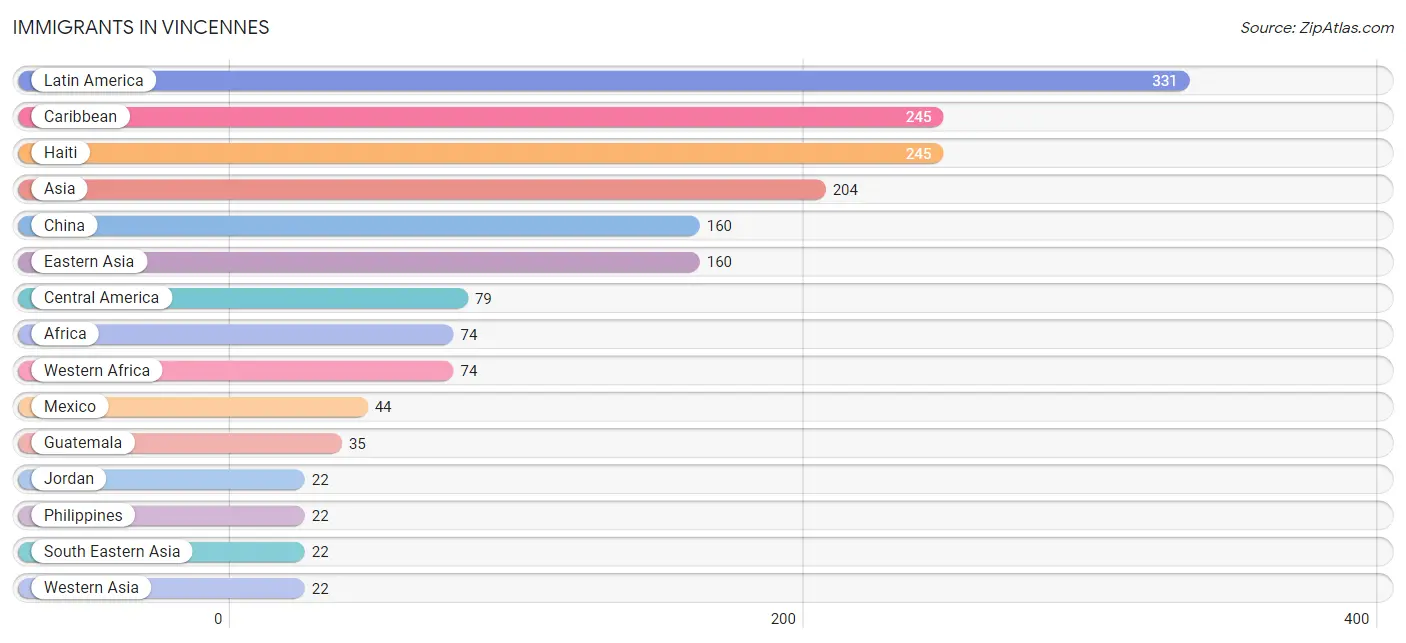
Immigrants in Vincennes
The most numerous immigrant groups reported in Vincennes came from Latin America (331 | 2.0%), Caribbean (245 | 1.5%), Haiti (245 | 1.5%), Asia (204 | 1.2%), and China (160 | 1.0%), together accounting for 7.1% of all Vincennes residents.
| Immigration Origin | # Population | % Population |
| Africa | 74 | 0.4% |
| Asia | 204 | 1.2% |
| Brazil | 7 | 0.0% |
| Canada | 2 | 0.0% |
| Caribbean | 245 | 1.5% |
| Central America | 79 | 0.5% |
| China | 160 | 1.0% |
| Eastern Asia | 160 | 1.0% |
| Europe | 4 | 0.0% |
| France | 4 | 0.0% |
| Guatemala | 35 | 0.2% |
| Haiti | 245 | 1.5% |
| Jordan | 22 | 0.1% |
| Latin America | 331 | 2.0% |
| Mexico | 44 | 0.3% |
| Philippines | 22 | 0.1% |
| South America | 7 | 0.0% |
| South Eastern Asia | 22 | 0.1% |
| Western Africa | 74 | 0.4% |
| Western Asia | 22 | 0.1% |
| Western Europe | 4 | 0.0% | View All 21 Rows |
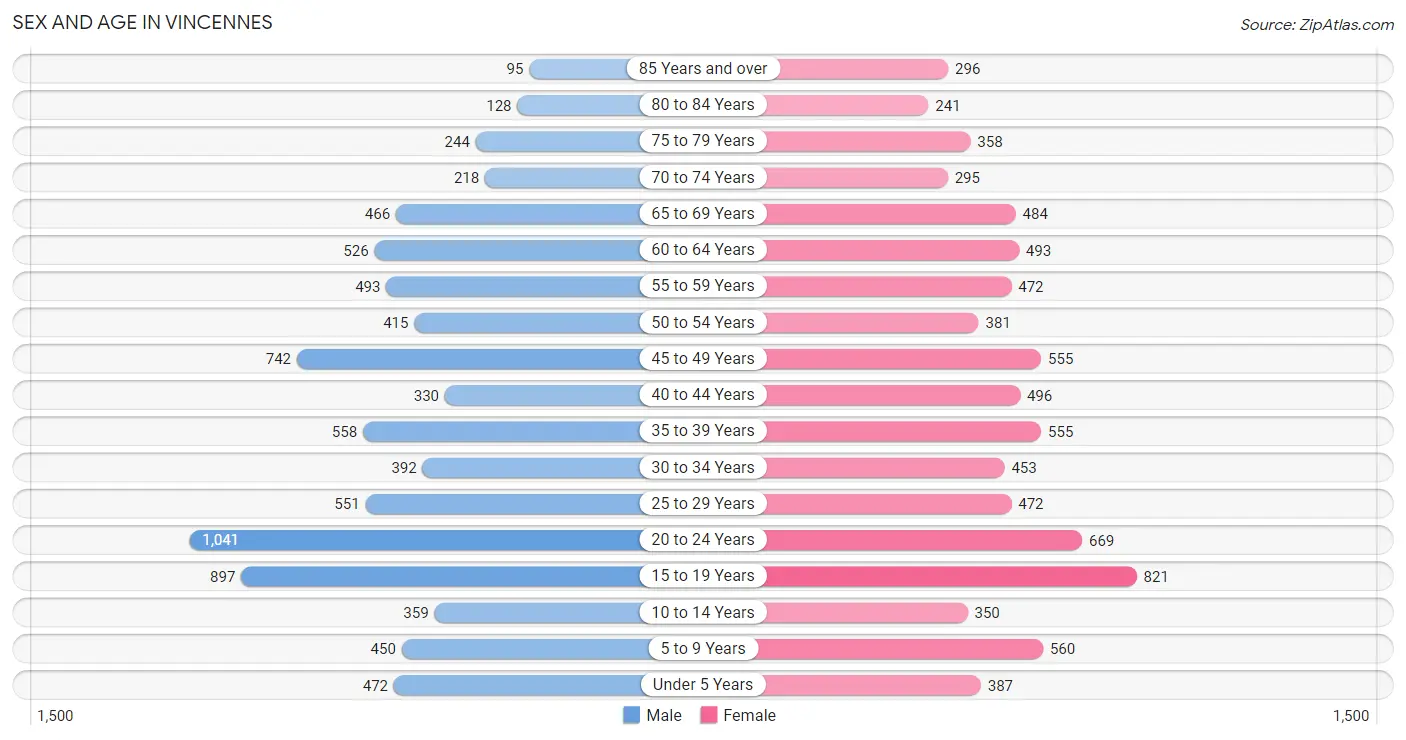
Sex and Age in Vincennes
Sex and Age in Vincennes
The most populous age groups in Vincennes are 20 to 24 Years (1,041 | 12.4%) for men and 15 to 19 Years (821 | 9.9%) for women.
| Age Bracket | Male | Female |
| Under 5 Years | 472 (5.6%) | 387 (4.6%) |
| 5 to 9 Years | 450 (5.4%) | 560 (6.7%) |
| 10 to 14 Years | 359 (4.3%) | 350 (4.2%) |
| 15 to 19 Years | 897 (10.7%) | 821 (9.9%) |
| 20 to 24 Years | 1,041 (12.4%) | 669 (8.0%) |
| 25 to 29 Years | 551 (6.6%) | 472 (5.7%) |
| 30 to 34 Years | 392 (4.7%) | 453 (5.4%) |
| 35 to 39 Years | 558 (6.7%) | 555 (6.7%) |
| 40 to 44 Years | 330 (3.9%) | 496 (5.9%) |
| 45 to 49 Years | 742 (8.9%) | 555 (6.7%) |
| 50 to 54 Years | 415 (5.0%) | 381 (4.6%) |
| 55 to 59 Years | 493 (5.9%) | 472 (5.7%) |
| 60 to 64 Years | 526 (6.3%) | 493 (5.9%) |
| 65 to 69 Years | 466 (5.6%) | 484 (5.8%) |
| 70 to 74 Years | 218 (2.6%) | 295 (3.5%) |
| 75 to 79 Years | 244 (2.9%) | 358 (4.3%) |
| 80 to 84 Years | 128 (1.5%) | 241 (2.9%) |
| 85 Years and over | 95 (1.1%) | 296 (3.5%) |
| Total | 8,377 (100.0%) | 8,338 (100.0%) |
Families and Households in Vincennes
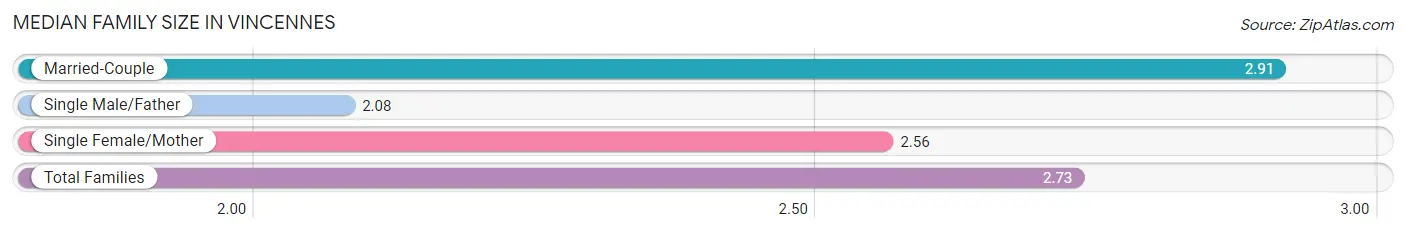
Median Family Size in Vincennes
The median family size in Vincennes is 2.73 persons per family, with married-couple families (2,736 | 66.7%) accounting for the largest median family size of 2.91 persons per family. On the other hand, single male/father families (588 | 14.3%) represent the smallest median family size with 2.08 persons per family.
| Family Type | # Families | Family Size |
| Married-Couple | 2,736 (66.7%) | 2.91 |
| Single Male/Father | 588 (14.3%) | 2.08 |
| Single Female/Mother | 776 (18.9%) | 2.56 |
| Total Families | 4,100 (100.0%) | 2.73 |
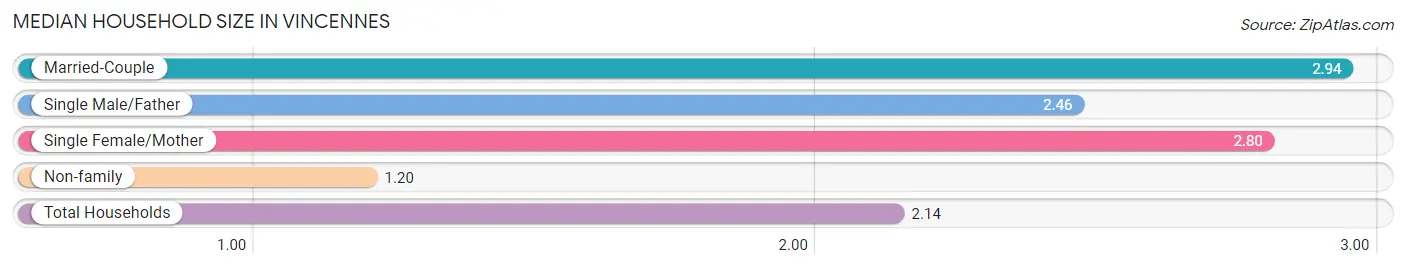
Median Household Size in Vincennes
The median household size in Vincennes is 2.14 persons per household, with married-couple households (2,736 | 38.1%) accounting for the largest median household size of 2.94 persons per household. non-family households (3,073 | 42.8%) represent the smallest median household size with 1.20 persons per household.
| Household Type | # Households | Household Size |
| Married-Couple | 2,736 (38.1%) | 2.94 |
| Single Male/Father | 588 (8.2%) | 2.46 |
| Single Female/Mother | 776 (10.8%) | 2.80 |
| Non-family | 3,073 (42.8%) | 1.20 |
| Total Households | 7,173 (100.0%) | 2.14 |
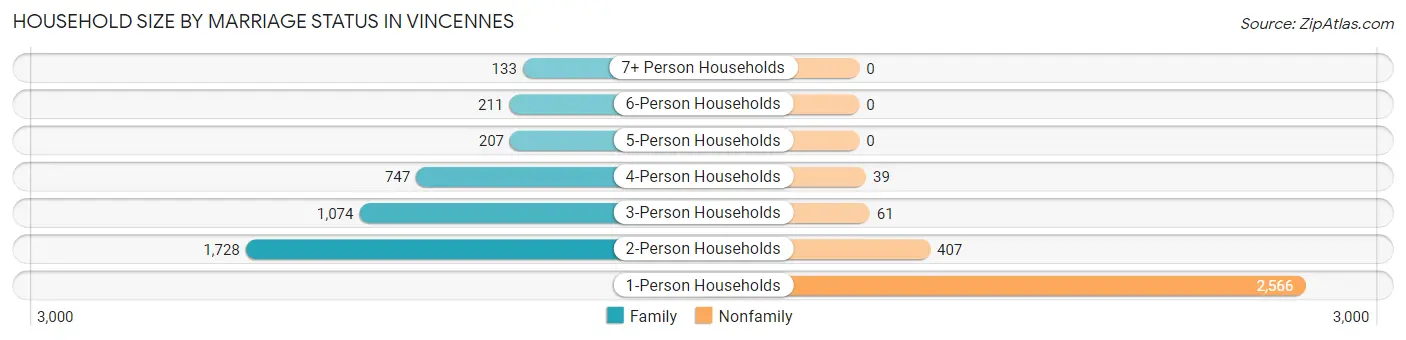
Household Size by Marriage Status in Vincennes
Out of a total of 7,173 households in Vincennes, 4,100 (57.2%) are family households, while 3,073 (42.8%) are nonfamily households. The most numerous type of family households are 2-person households, comprising 1,728, and the most common type of nonfamily households are 1-person households, comprising 2,566.
| Household Size | Family Households | Nonfamily Households |
| 1-Person Households | - | 2,566 (35.8%) |
| 2-Person Households | 1,728 (24.1%) | 407 (5.7%) |
| 3-Person Households | 1,074 (15.0%) | 61 (0.9%) |
| 4-Person Households | 747 (10.4%) | 39 (0.5%) |
| 5-Person Households | 207 (2.9%) | 0 (0.0%) |
| 6-Person Households | 211 (2.9%) | 0 (0.0%) |
| 7+ Person Households | 133 (1.8%) | 0 (0.0%) |
| Total | 4,100 (57.2%) | 3,073 (42.8%) |
Female Fertility in Vincennes
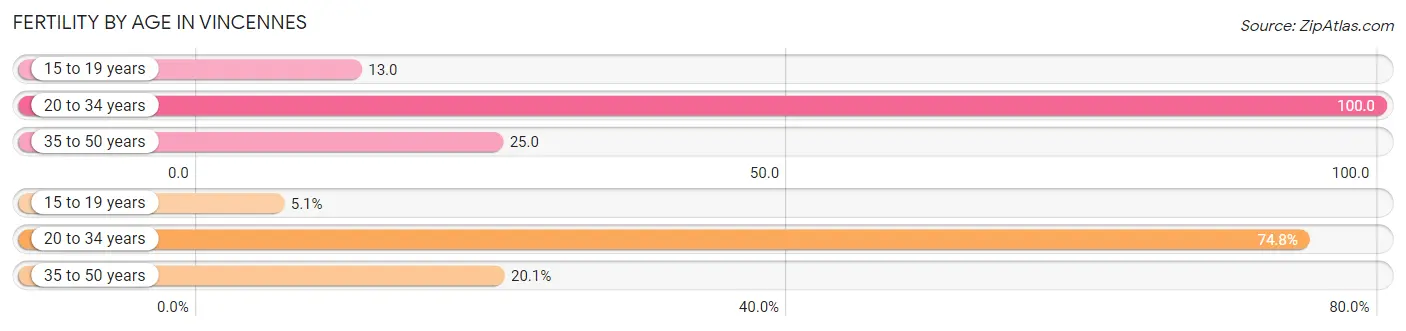
Fertility by Age in Vincennes
Average fertility rate in Vincennes is 52.0 births per 1,000 women. Women in the age bracket of 20 to 34 years have the highest fertility rate with 100.0 births per 1,000 women. Women in the age bracket of 20 to 34 years acount for 74.8% of all women with births.
| Age Bracket | Women with Births | Births / 1,000 Women |
| 15 to 19 years | 11 (5.1%) | 13.0 |
| 20 to 34 years | 160 (74.8%) | 100.0 |
| 35 to 50 years | 43 (20.1%) | 25.0 |
| Total | 214 (100.0%) | 52.0 |
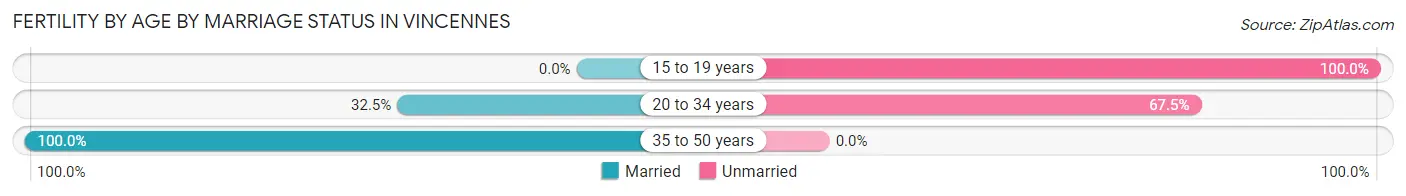
Fertility by Age by Marriage Status in Vincennes
44.4% of women with births (214) in Vincennes are married. The highest percentage of unmarried women with births falls into 15 to 19 years age bracket with 100.0% of them unmarried at the time of birth, while the lowest percentage of unmarried women with births belong to 35 to 50 years age bracket with 0.0% of them unmarried.
| Age Bracket | Married | Unmarried |
| 15 to 19 years | 0 (0.0%) | 11 (100.0%) |
| 20 to 34 years | 52 (32.5%) | 108 (67.5%) |
| 35 to 50 years | 43 (100.0%) | 0 (0.0%) |
| Total | 95 (44.4%) | 119 (55.6%) |
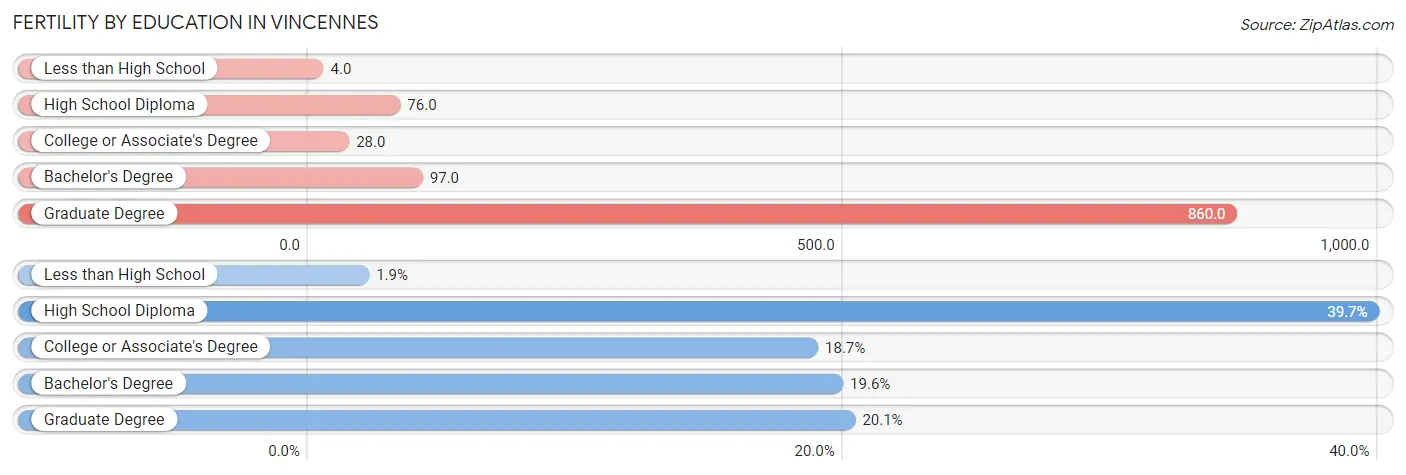
Fertility by Education in Vincennes
Average fertility rate in Vincennes is 52.0 births per 1,000 women. Women with the education attainment of graduate degree have the highest fertility rate of 860.0 births per 1,000 women, while women with the education attainment of less than high school have the lowest fertility at 4.0 births per 1,000 women. Women with the education attainment of high school diploma represent 39.7% of all women with births.
| Educational Attainment | Women with Births | Births / 1,000 Women |
| Less than High School | 4 (1.9%) | 4.0 |
| High School Diploma | 85 (39.7%) | 76.0 |
| College or Associate's Degree | 40 (18.7%) | 28.0 |
| Bachelor's Degree | 42 (19.6%) | 97.0 |
| Graduate Degree | 43 (20.1%) | 860.0 |
| Total | 214 (100.0%) | 52.0 |
Fertility by Education by Marriage Status in Vincennes
55.6% of women with births in Vincennes are unmarried. Women with the educational attainment of less than high school are most likely to be married with 100.0% of them married at childbirth, while women with the educational attainment of college or associate's degree are least likely to be married with 100.0% of them unmarried at childbirth.
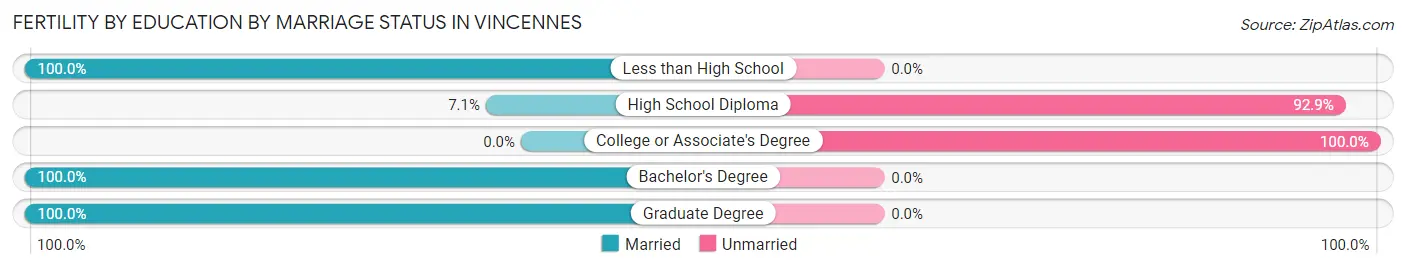
| Educational Attainment | Married | Unmarried |
| Less than High School | 4 (100.0%) | 0 (0.0%) |
| High School Diploma | 6 (7.1%) | 79 (92.9%) |
| College or Associate's Degree | 0 (0.0%) | 40 (100.0%) |
| Bachelor's Degree | 42 (100.0%) | 0 (0.0%) |
| Graduate Degree | 43 (100.0%) | 0 (0.0%) |
| Total | 95 (44.4%) | 119 (55.6%) |
Employment Characteristics in Vincennes
Employment by Class of Employer in Vincennes
Among the 7,974 employed individuals in Vincennes, private company employees (5,457 | 68.4%), not-for-profit organizations (1,166 | 14.6%), and state government employees (550 | 6.9%) make up the most common classes of employment.
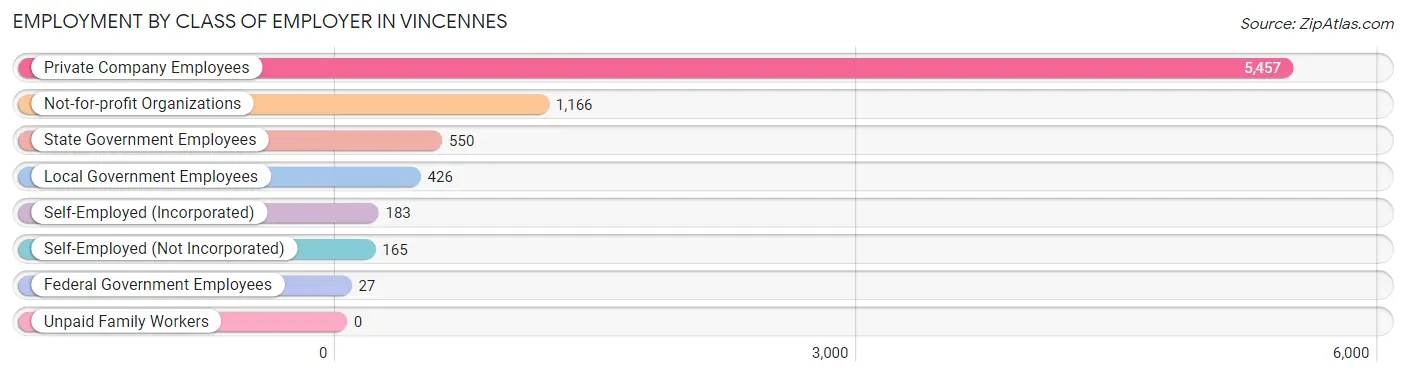
| Employer Class | # Employees | % Employees |
| Private Company Employees | 5,457 | 68.4% |
| Self-Employed (Incorporated) | 183 | 2.3% |
| Self-Employed (Not Incorporated) | 165 | 2.1% |
| Not-for-profit Organizations | 1,166 | 14.6% |
| Local Government Employees | 426 | 5.3% |
| State Government Employees | 550 | 6.9% |
| Federal Government Employees | 27 | 0.3% |
| Unpaid Family Workers | 0 | 0.0% |
| Total | 7,974 | 100.0% |
Employment Status by Age in Vincennes
According to the labor force statistics for Vincennes, out of the total population over 16 years of age (13,975), 61.1% or 8,539 individuals are in the labor force, with 5.3% or 453 of them unemployed. The age group with the highest labor force participation rate is 45 to 54 years, with 84.1% or 1,760 individuals in the labor force. Within the labor force, the 45 to 54 years age range has the highest percentage of unemployed individuals, with 11.8% or 208 of them being unemployed.
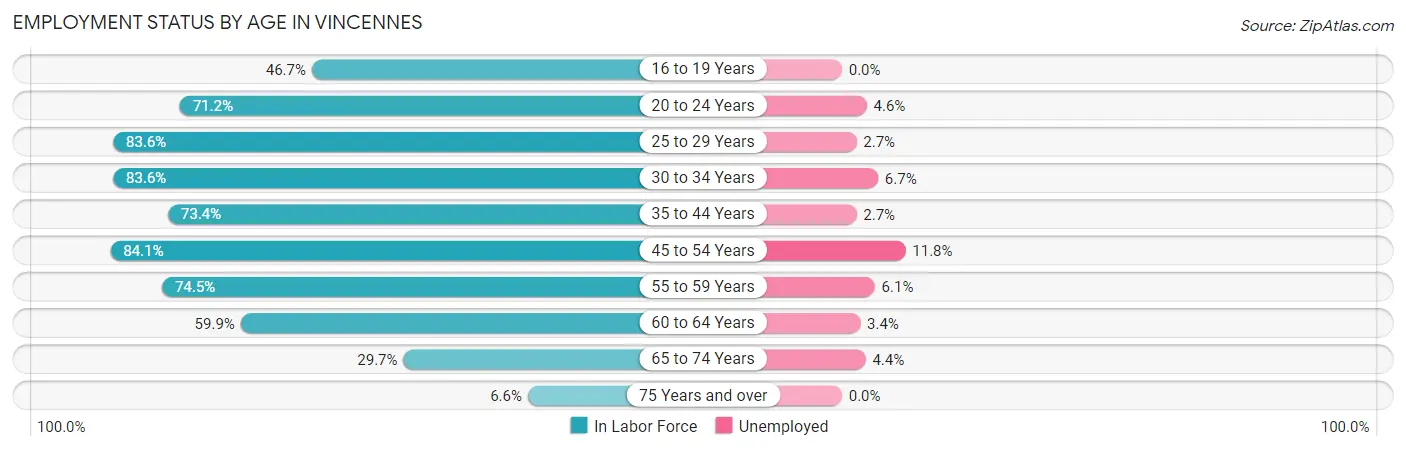
| Age Bracket | In Labor Force | Unemployed |
| 16 to 19 Years | 727 (46.7%) | 0 (0.0%) |
| 20 to 24 Years | 1,218 (71.2%) | 56 (4.6%) |
| 25 to 29 Years | 855 (83.6%) | 23 (2.7%) |
| 30 to 34 Years | 706 (83.6%) | 47 (6.7%) |
| 35 to 44 Years | 1,423 (73.4%) | 38 (2.7%) |
| 45 to 54 Years | 1,760 (84.1%) | 208 (11.8%) |
| 55 to 59 Years | 719 (74.5%) | 44 (6.1%) |
| 60 to 64 Years | 610 (59.9%) | 21 (3.4%) |
| 65 to 74 Years | 435 (29.7%) | 19 (4.4%) |
| 75 Years and over | 90 (6.6%) | 0 (0.0%) |
| Total | 8,539 (61.1%) | 453 (5.3%) |
Employment Status by Educational Attainment in Vincennes
According to labor force statistics for Vincennes, 77.0% of individuals (6,071) out of the total population between 25 and 64 years of age (7,884) are in the labor force, with 6.3% or 382 of them being unemployed. The group with the highest labor force participation rate are those with the educational attainment of college / associate degree, with 85.0% or 2,298 individuals in the labor force. Within the labor force, individuals with high school diploma education have the highest percentage of unemployment, with 13.1% or 284 of them being unemployed.
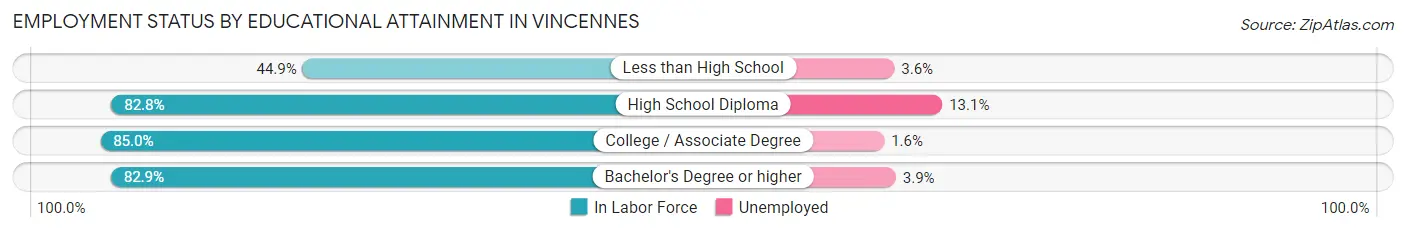
| Educational Attainment | In Labor Force | Unemployed |
| Less than High School | 609 (44.9%) | 49 (3.6%) |
| High School Diploma | 2,166 (82.8%) | 343 (13.1%) |
| College / Associate Degree | 2,298 (85.0%) | 43 (1.6%) |
| Bachelor's Degree or higher | 1,001 (82.9%) | 47 (3.9%) |
| Total | 6,071 (77.0%) | 497 (6.3%) |
Employment Occupations by Sex in Vincennes
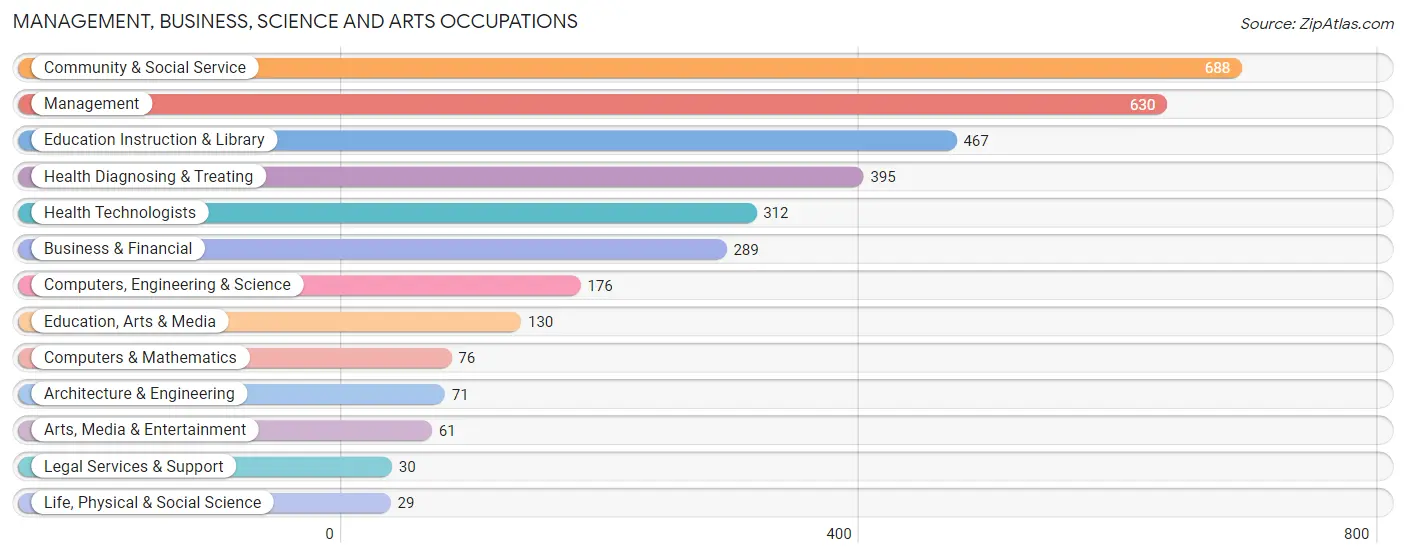
Management, Business, Science and Arts Occupations
The most common Management, Business, Science and Arts occupations in Vincennes are Community & Social Service (688 | 8.5%), Management (630 | 7.8%), Education Instruction & Library (467 | 5.8%), Health Diagnosing & Treating (395 | 4.9%), and Health Technologists (312 | 3.9%).
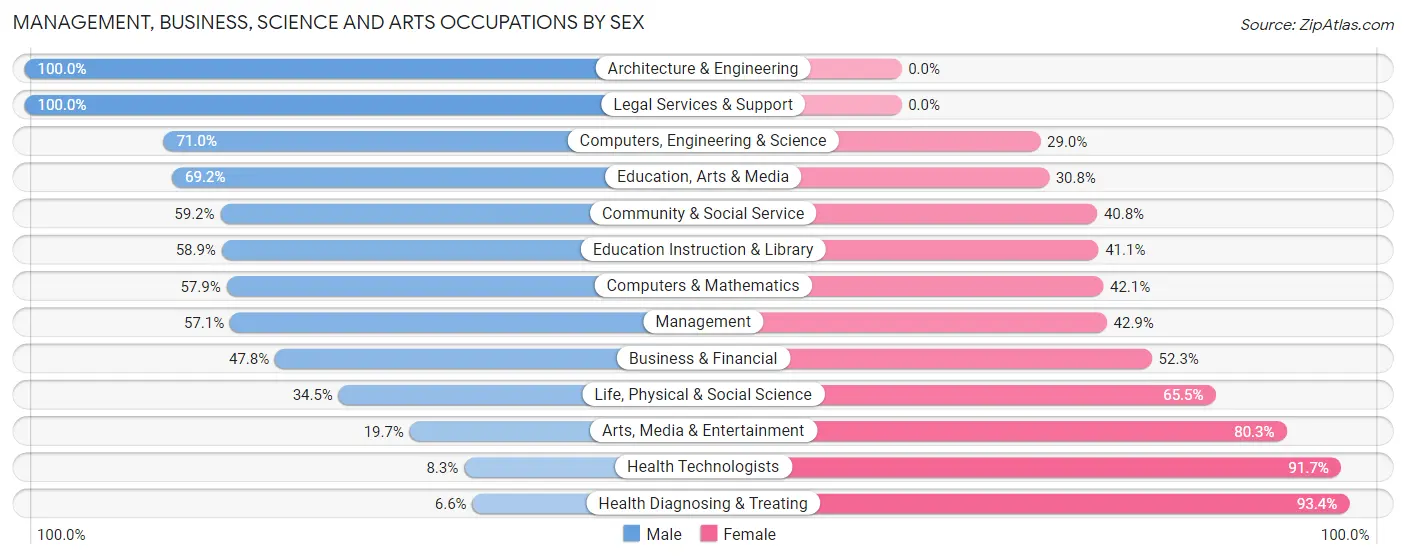
Management, Business, Science and Arts Occupations by Sex
Within the Management, Business, Science and Arts occupations in Vincennes, the most male-oriented occupations are Architecture & Engineering (100.0%), Legal Services & Support (100.0%), and Computers, Engineering & Science (71.0%), while the most female-oriented occupations are Health Diagnosing & Treating (93.4%), Health Technologists (91.7%), and Arts, Media & Entertainment (80.3%).
| Occupation | Male | Female |
| Management | 360 (57.1%) | 270 (42.9%) |
| Business & Financial | 138 (47.7%) | 151 (52.2%) |
| Computers, Engineering & Science | 125 (71.0%) | 51 (29.0%) |
| Computers & Mathematics | 44 (57.9%) | 32 (42.1%) |
| Architecture & Engineering | 71 (100.0%) | 0 (0.0%) |
| Life, Physical & Social Science | 10 (34.5%) | 19 (65.5%) |
| Community & Social Service | 407 (59.2%) | 281 (40.8%) |
| Education, Arts & Media | 90 (69.2%) | 40 (30.8%) |
| Legal Services & Support | 30 (100.0%) | 0 (0.0%) |
| Education Instruction & Library | 275 (58.9%) | 192 (41.1%) |
| Arts, Media & Entertainment | 12 (19.7%) | 49 (80.3%) |
| Health Diagnosing & Treating | 26 (6.6%) | 369 (93.4%) |
| Health Technologists | 26 (8.3%) | 286 (91.7%) |
| Total (Category) | 1,056 (48.5%) | 1,122 (51.5%) |
| Total (Overall) | 4,470 (55.3%) | 3,616 (44.7%) |
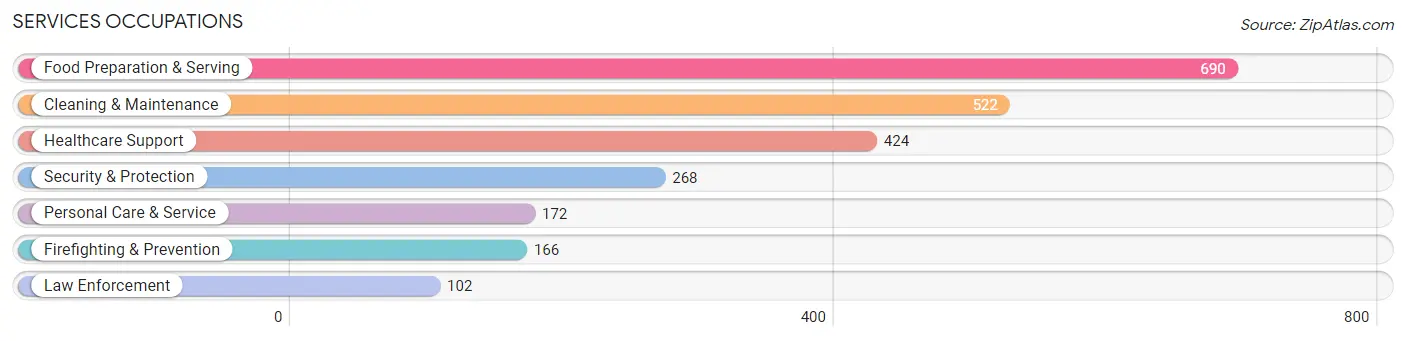
Services Occupations
The most common Services occupations in Vincennes are Food Preparation & Serving (690 | 8.5%), Cleaning & Maintenance (522 | 6.5%), Healthcare Support (424 | 5.2%), Security & Protection (268 | 3.3%), and Personal Care & Service (172 | 2.1%).
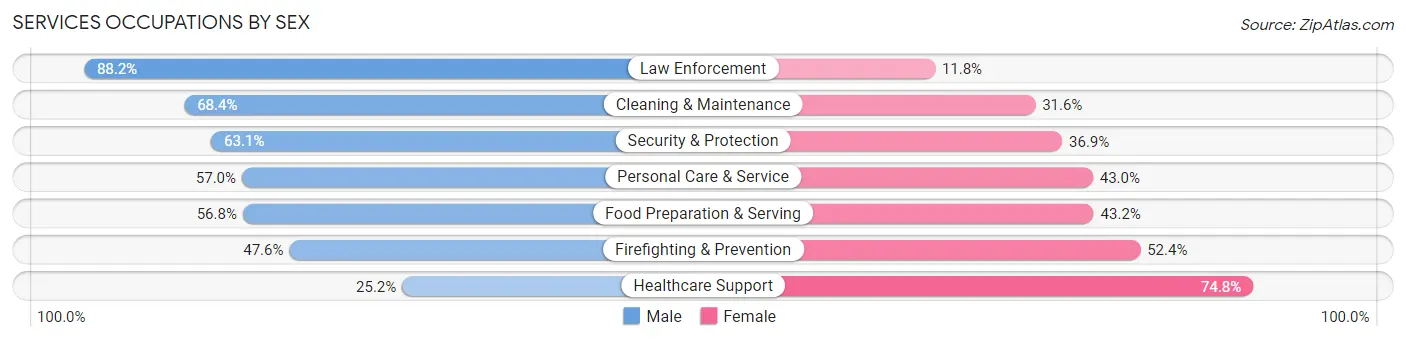
Services Occupations by Sex
Within the Services occupations in Vincennes, the most male-oriented occupations are Law Enforcement (88.2%), Cleaning & Maintenance (68.4%), and Security & Protection (63.1%), while the most female-oriented occupations are Healthcare Support (74.8%), Firefighting & Prevention (52.4%), and Food Preparation & Serving (43.2%).
| Occupation | Male | Female |
| Healthcare Support | 107 (25.2%) | 317 (74.8%) |
| Security & Protection | 169 (63.1%) | 99 (36.9%) |
| Firefighting & Prevention | 79 (47.6%) | 87 (52.4%) |
| Law Enforcement | 90 (88.2%) | 12 (11.8%) |
| Food Preparation & Serving | 392 (56.8%) | 298 (43.2%) |
| Cleaning & Maintenance | 357 (68.4%) | 165 (31.6%) |
| Personal Care & Service | 98 (57.0%) | 74 (43.0%) |
| Total (Category) | 1,123 (54.1%) | 953 (45.9%) |
| Total (Overall) | 4,470 (55.3%) | 3,616 (44.7%) |
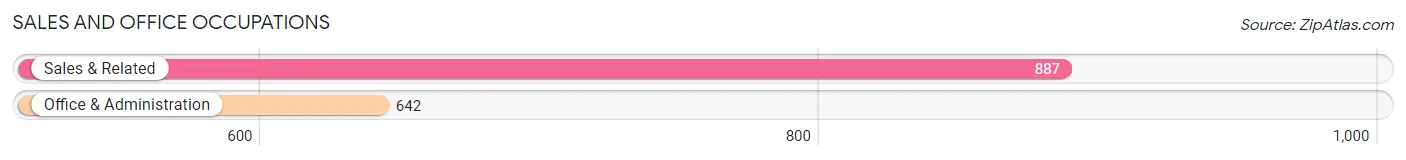
Sales and Office Occupations
The most common Sales and Office occupations in Vincennes are Sales & Related (887 | 11.0%), and Office & Administration (642 | 7.9%).
Sales and Office Occupations by Sex
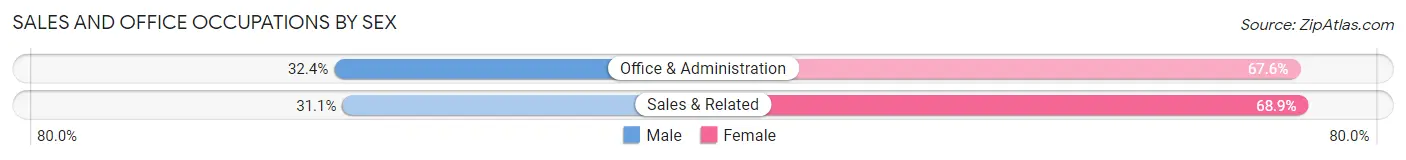
| Occupation | Male | Female |
| Sales & Related | 276 (31.1%) | 611 (68.9%) |
| Office & Administration | 208 (32.4%) | 434 (67.6%) |
| Total (Category) | 484 (31.7%) | 1,045 (68.3%) |
| Total (Overall) | 4,470 (55.3%) | 3,616 (44.7%) |
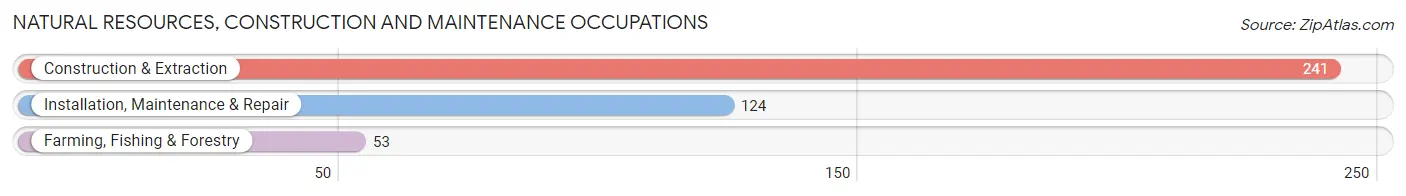
Natural Resources, Construction and Maintenance Occupations
The most common Natural Resources, Construction and Maintenance occupations in Vincennes are Construction & Extraction (241 | 3.0%), Installation, Maintenance & Repair (124 | 1.5%), and Farming, Fishing & Forestry (53 | 0.7%).
Natural Resources, Construction and Maintenance Occupations by Sex
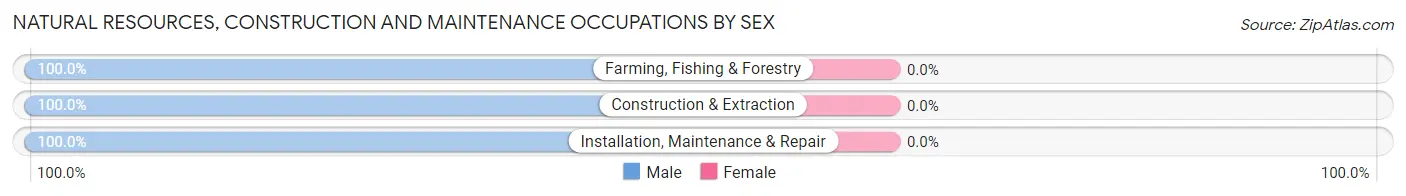
| Occupation | Male | Female |
| Farming, Fishing & Forestry | 53 (100.0%) | 0 (0.0%) |
| Construction & Extraction | 241 (100.0%) | 0 (0.0%) |
| Installation, Maintenance & Repair | 124 (100.0%) | 0 (0.0%) |
| Total (Category) | 418 (100.0%) | 0 (0.0%) |
| Total (Overall) | 4,470 (55.3%) | 3,616 (44.7%) |
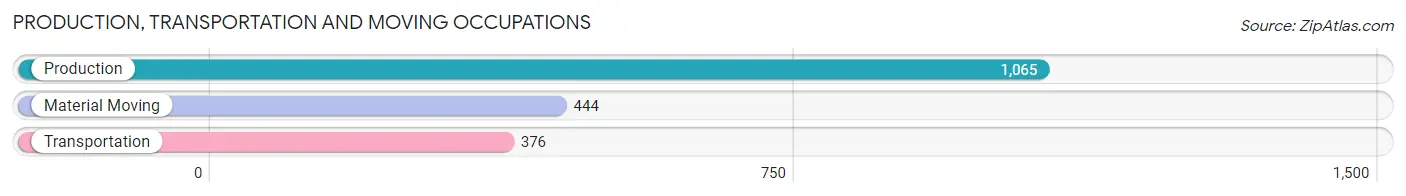
Production, Transportation and Moving Occupations
The most common Production, Transportation and Moving occupations in Vincennes are Production (1,065 | 13.2%), Material Moving (444 | 5.5%), and Transportation (376 | 4.6%).
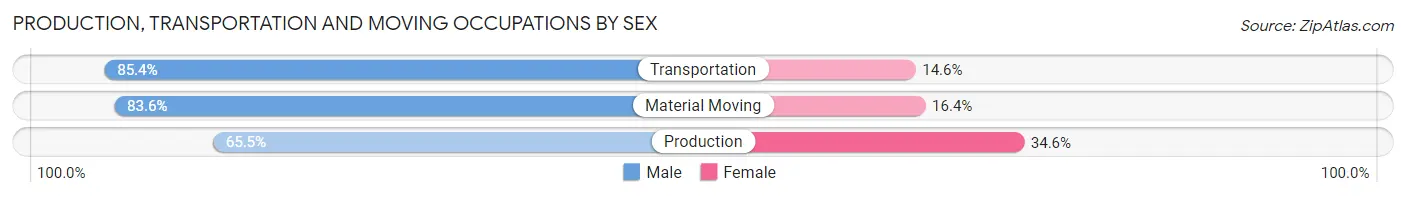
Production, Transportation and Moving Occupations by Sex
| Occupation | Male | Female |
| Production | 697 (65.4%) | 368 (34.5%) |
| Transportation | 321 (85.4%) | 55 (14.6%) |
| Material Moving | 371 (83.6%) | 73 (16.4%) |
| Total (Category) | 1,389 (73.7%) | 496 (26.3%) |
| Total (Overall) | 4,470 (55.3%) | 3,616 (44.7%) |
Employment Industries by Sex in Vincennes
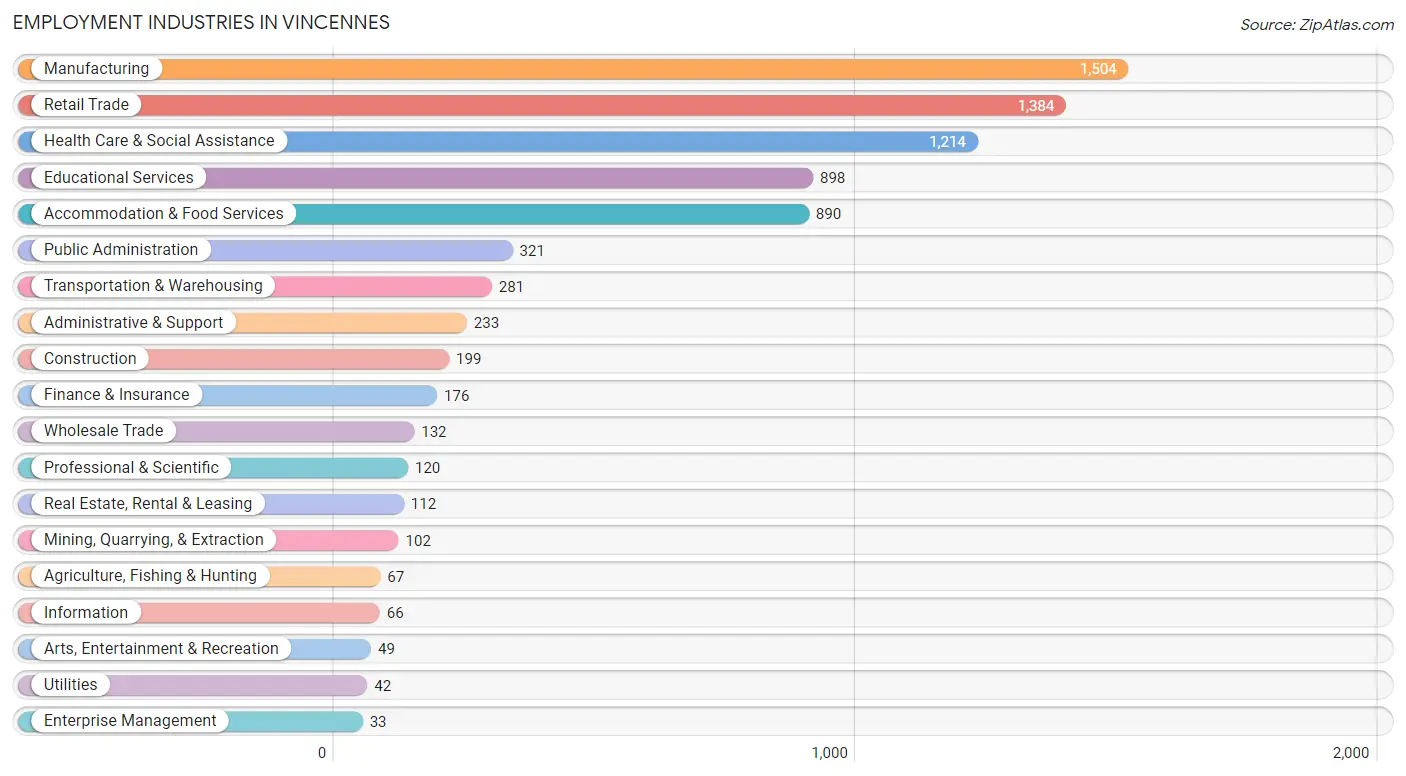
Employment Industries in Vincennes
The major employment industries in Vincennes include Manufacturing (1,504 | 18.6%), Retail Trade (1,384 | 17.1%), Health Care & Social Assistance (1,214 | 15.0%), Educational Services (898 | 11.1%), and Accommodation & Food Services (890 | 11.0%).
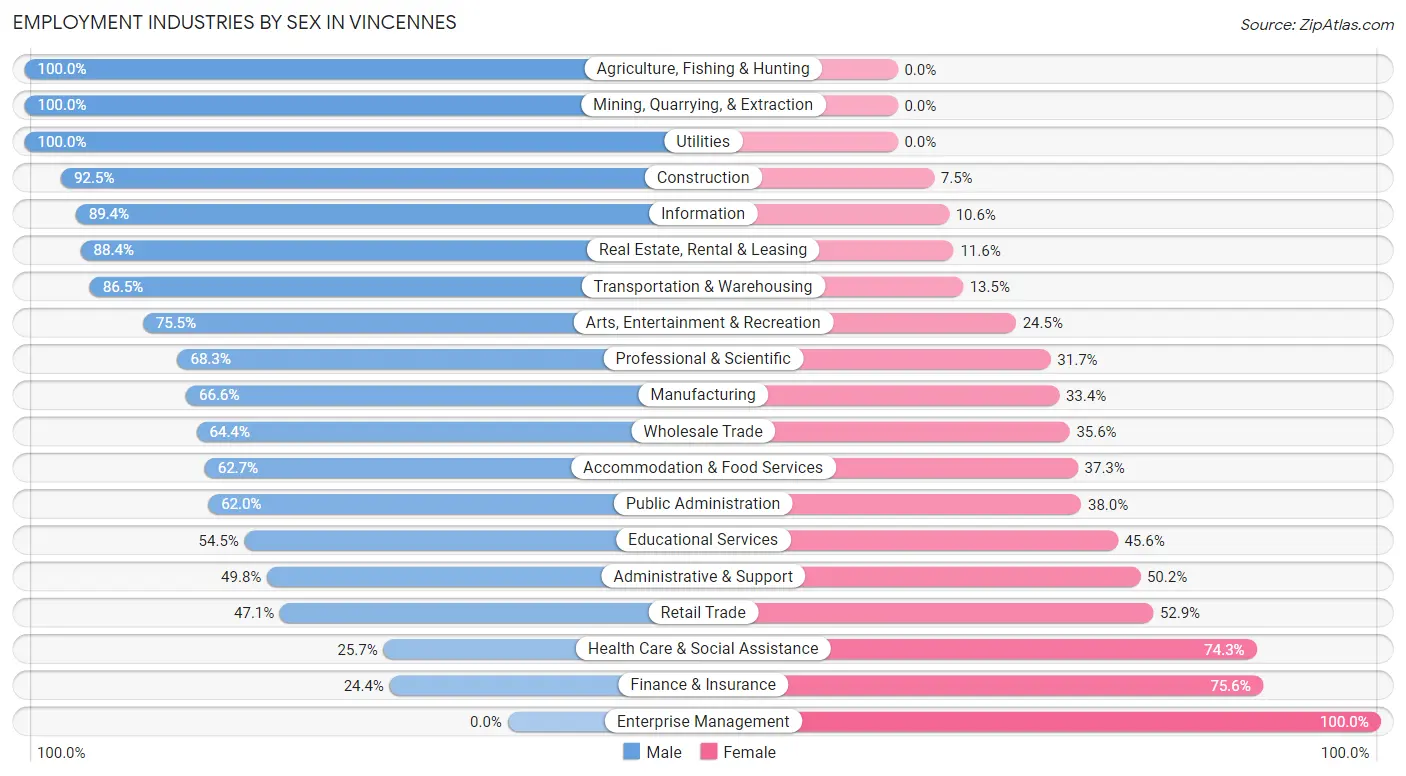
Employment Industries by Sex in Vincennes
The Vincennes industries that see more men than women are Agriculture, Fishing & Hunting (100.0%), Mining, Quarrying, & Extraction (100.0%), and Utilities (100.0%), whereas the industries that tend to have a higher number of women are Enterprise Management (100.0%), Finance & Insurance (75.6%), and Health Care & Social Assistance (74.3%).
| Industry | Male | Female |
| Agriculture, Fishing & Hunting | 67 (100.0%) | 0 (0.0%) |
| Mining, Quarrying, & Extraction | 102 (100.0%) | 0 (0.0%) |
| Construction | 184 (92.5%) | 15 (7.5%) |
| Manufacturing | 1,001 (66.6%) | 503 (33.4%) |
| Wholesale Trade | 85 (64.4%) | 47 (35.6%) |
| Retail Trade | 652 (47.1%) | 732 (52.9%) |
| Transportation & Warehousing | 243 (86.5%) | 38 (13.5%) |
| Utilities | 42 (100.0%) | 0 (0.0%) |
| Information | 59 (89.4%) | 7 (10.6%) |
| Finance & Insurance | 43 (24.4%) | 133 (75.6%) |
| Real Estate, Rental & Leasing | 99 (88.4%) | 13 (11.6%) |
| Professional & Scientific | 82 (68.3%) | 38 (31.7%) |
| Enterprise Management | 0 (0.0%) | 33 (100.0%) |
| Administrative & Support | 116 (49.8%) | 117 (50.2%) |
| Educational Services | 489 (54.4%) | 409 (45.6%) |
| Health Care & Social Assistance | 312 (25.7%) | 902 (74.3%) |
| Arts, Entertainment & Recreation | 37 (75.5%) | 12 (24.5%) |
| Accommodation & Food Services | 558 (62.7%) | 332 (37.3%) |
| Public Administration | 199 (62.0%) | 122 (38.0%) |
| Total | 4,470 (55.3%) | 3,616 (44.7%) |
Education in Vincennes
School Enrollment in Vincennes
The most common levels of schooling among the 4,279 students in Vincennes are college / undergraduate (1,783 | 41.7%), elementary school (827 | 19.3%), and high school (720 | 16.8%).

| School Level | # Students | % Students |
| Nursery / Preschool | 171 | 4.0% |
| Kindergarten | 258 | 6.0% |
| Elementary School | 827 | 19.3% |
| Middle School | 497 | 11.6% |
| High School | 720 | 16.8% |
| College / Undergraduate | 1,783 | 41.7% |
| Graduate / Professional | 23 | 0.5% |
| Total | 4,279 | 100.0% |
School Enrollment by Age by Funding Source in Vincennes
Out of a total of 4,279 students who are enrolled in schools in Vincennes, 287 (6.7%) attend a private institution, while the remaining 3,992 (93.3%) are enrolled in public schools. The age group of 15 to 17 year olds has the highest likelihood of being enrolled in private schools, with 122 (25.0% in the age bracket) enrolled. Conversely, the age group of 25 to 34 year olds has the lowest likelihood of being enrolled in a private school, with 212 (100.0% in the age bracket) attending a public institution.
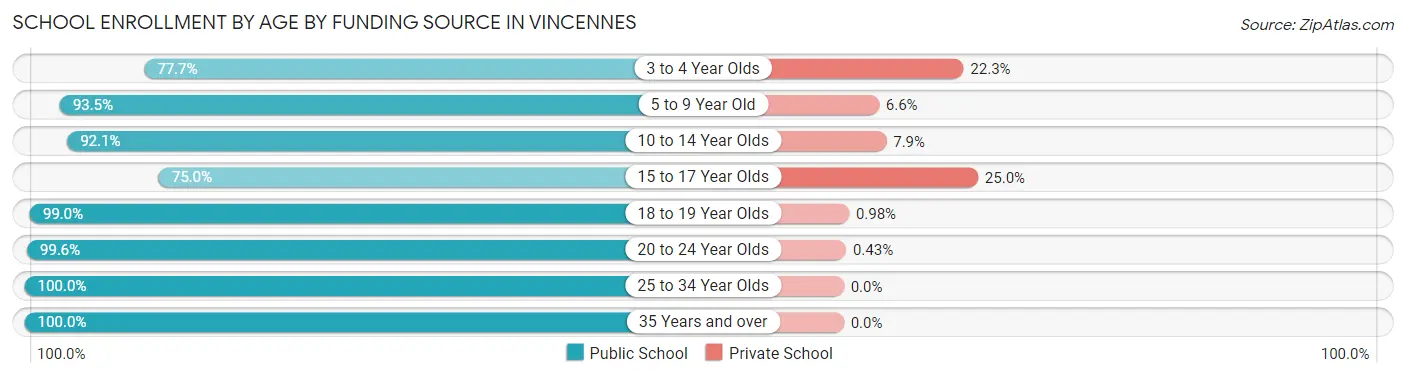
| Age Bracket | Public School | Private School |
| 3 to 4 Year Olds | 115 (77.7%) | 33 (22.3%) |
| 5 to 9 Year Old | 927 (93.4%) | 65 (6.6%) |
| 10 to 14 Year Olds | 638 (92.1%) | 55 (7.9%) |
| 15 to 17 Year Olds | 366 (75.0%) | 122 (25.0%) |
| 18 to 19 Year Olds | 1,010 (99.0%) | 10 (1.0%) |
| 20 to 24 Year Olds | 697 (99.6%) | 3 (0.4%) |
| 25 to 34 Year Olds | 212 (100.0%) | 0 (0.0%) |
| 35 Years and over | 26 (100.0%) | 0 (0.0%) |
| Total | 3,992 (93.3%) | 287 (6.7%) |
Educational Attainment by Field of Study in Vincennes
Business (360 | 20.2%), science & technology (308 | 17.2%), education (261 | 14.6%), social sciences (146 | 8.2%), and arts & humanities (109 | 6.1%) are the most common fields of study among 1,787 individuals in Vincennes who have obtained a bachelor's degree or higher.
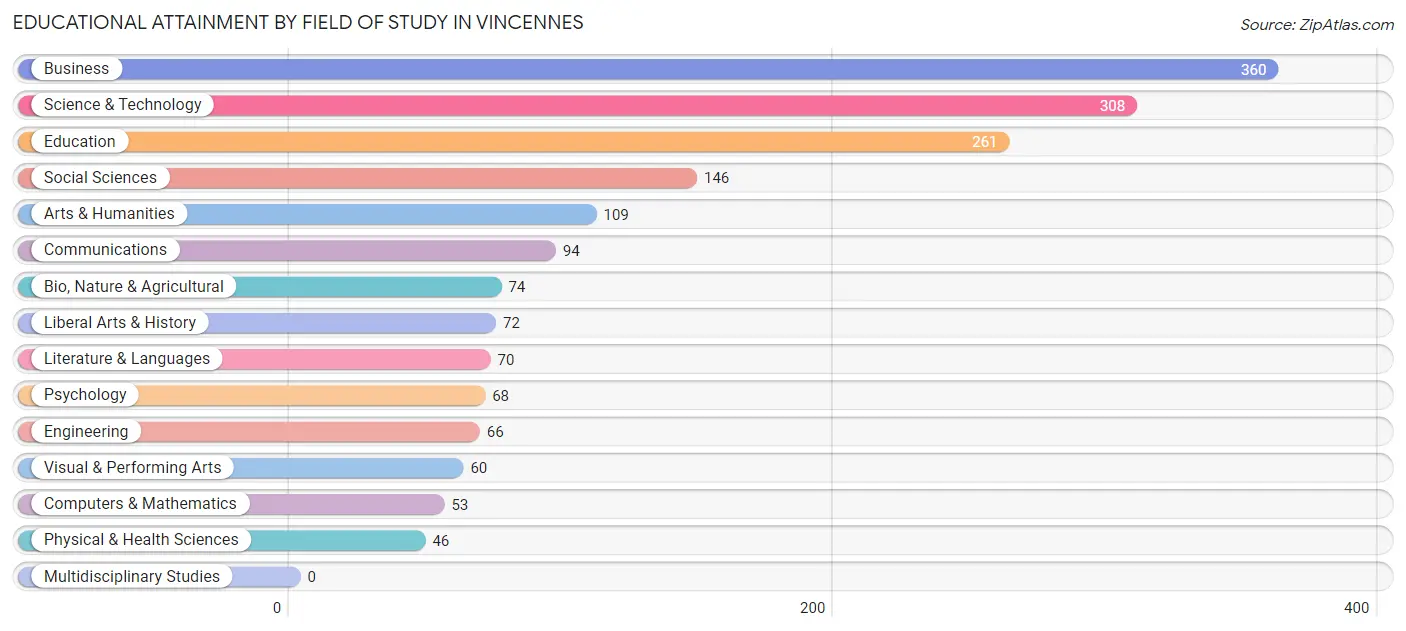
| Field of Study | # Graduates | % Graduates |
| Computers & Mathematics | 53 | 3.0% |
| Bio, Nature & Agricultural | 74 | 4.1% |
| Physical & Health Sciences | 46 | 2.6% |
| Psychology | 68 | 3.8% |
| Social Sciences | 146 | 8.2% |
| Engineering | 66 | 3.7% |
| Multidisciplinary Studies | 0 | 0.0% |
| Science & Technology | 308 | 17.2% |
| Business | 360 | 20.2% |
| Education | 261 | 14.6% |
| Literature & Languages | 70 | 3.9% |
| Liberal Arts & History | 72 | 4.0% |
| Visual & Performing Arts | 60 | 3.4% |
| Communications | 94 | 5.3% |
| Arts & Humanities | 109 | 6.1% |
| Total | 1,787 | 100.0% |
Transportation & Commute in Vincennes
Vehicle Availability by Sex in Vincennes
The most prevalent vehicle ownership categories in Vincennes are males with 2 vehicles (1,661, accounting for 40.0%) and females with 2 vehicles (1,330, making up 50.2%).
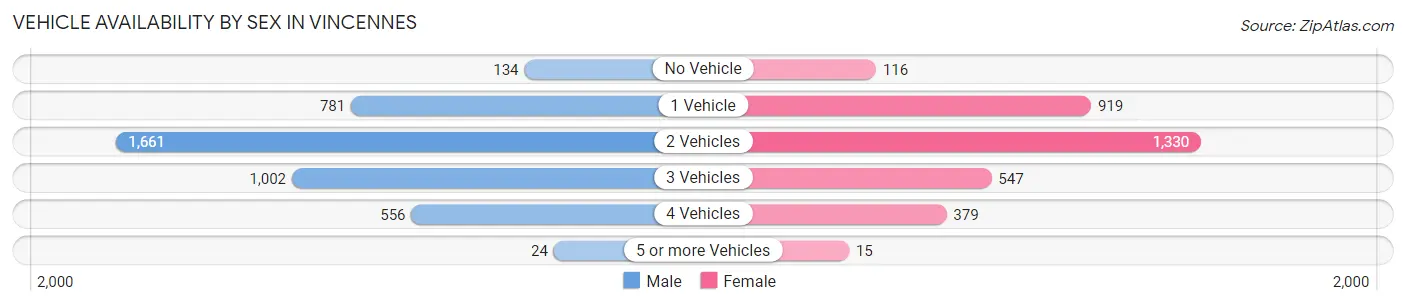
| Vehicles Available | Male | Female |
| No Vehicle | 134 (3.2%) | 116 (3.5%) |
| 1 Vehicle | 781 (18.8%) | 919 (27.8%) |
| 2 Vehicles | 1,661 (40.0%) | 1,330 (40.2%) |
| 3 Vehicles | 1,002 (24.1%) | 547 (16.6%) |
| 4 Vehicles | 556 (13.4%) | 379 (11.5%) |
| 5 or more Vehicles | 24 (0.6%) | 15 (0.4%) |
| Total | 4,158 (100.0%) | 3,306 (100.0%) |
Commute Time in Vincennes
The most frequently occuring commute durations in Vincennes are 5 to 9 minutes (2,256 commuters, 29.0%), 10 to 14 minutes (2,151 commuters, 27.6%), and 15 to 19 minutes (875 commuters, 11.2%).
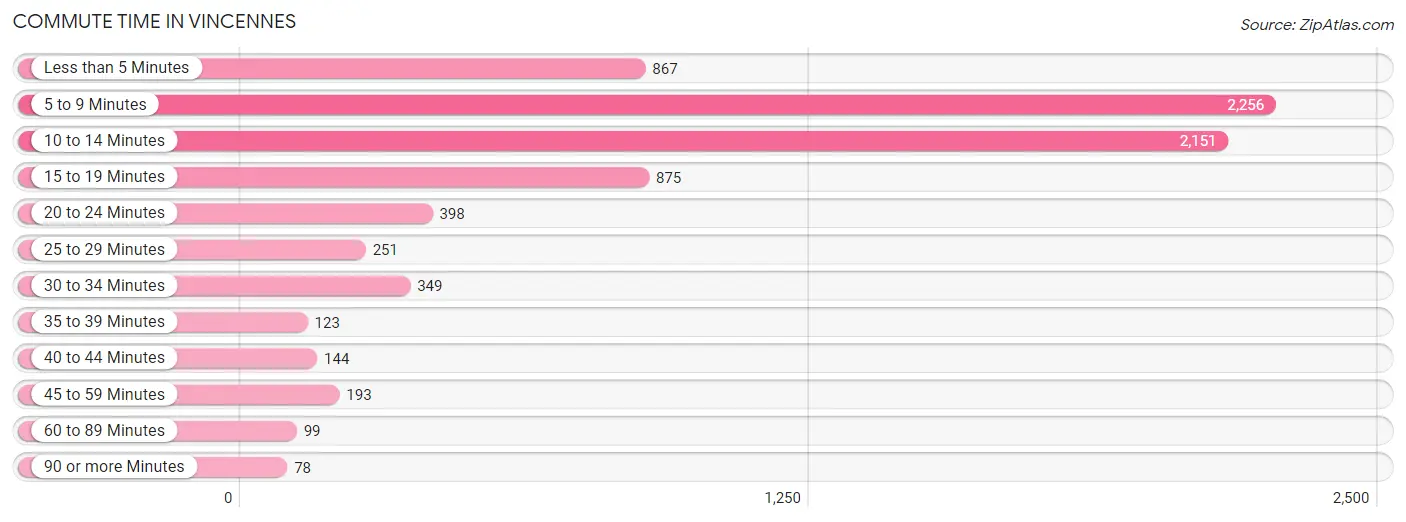
| Commute Time | # Commuters | % Commuters |
| Less than 5 Minutes | 867 | 11.1% |
| 5 to 9 Minutes | 2,256 | 29.0% |
| 10 to 14 Minutes | 2,151 | 27.6% |
| 15 to 19 Minutes | 875 | 11.2% |
| 20 to 24 Minutes | 398 | 5.1% |
| 25 to 29 Minutes | 251 | 3.2% |
| 30 to 34 Minutes | 349 | 4.5% |
| 35 to 39 Minutes | 123 | 1.6% |
| 40 to 44 Minutes | 144 | 1.8% |
| 45 to 59 Minutes | 193 | 2.5% |
| 60 to 89 Minutes | 99 | 1.3% |
| 90 or more Minutes | 78 | 1.0% |
Commute Time by Sex in Vincennes
The most common commute times in Vincennes are 5 to 9 minutes (1,284 commuters, 29.8%) for males and 10 to 14 minutes (1,159 commuters, 33.3%) for females.
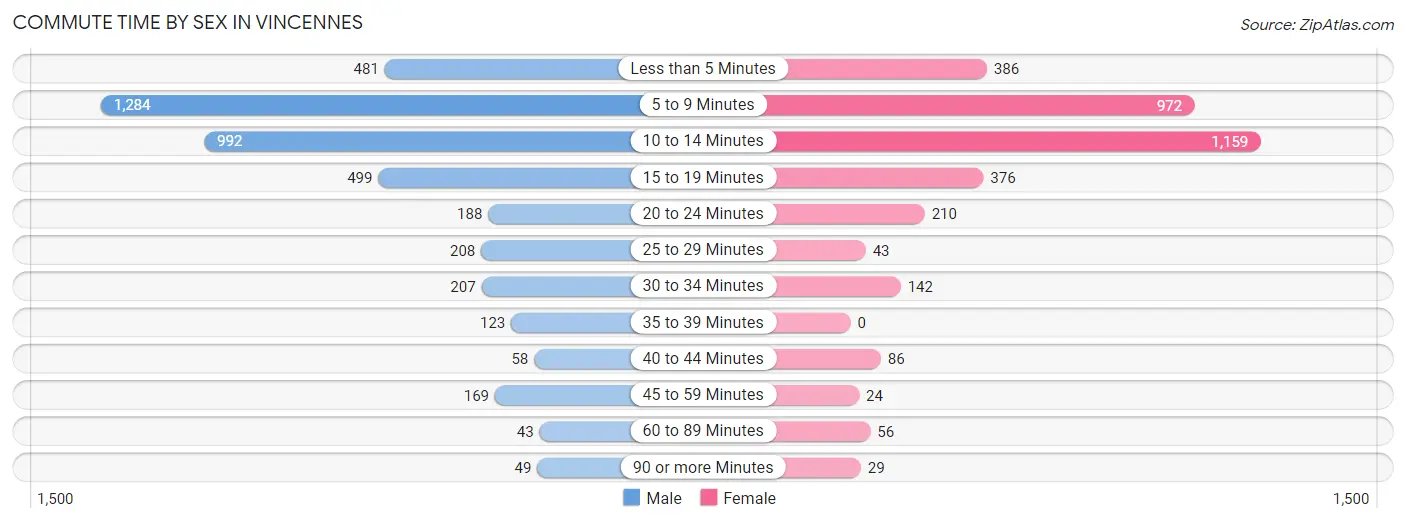
| Commute Time | Male | Female |
| Less than 5 Minutes | 481 (11.2%) | 386 (11.1%) |
| 5 to 9 Minutes | 1,284 (29.8%) | 972 (27.9%) |
| 10 to 14 Minutes | 992 (23.1%) | 1,159 (33.3%) |
| 15 to 19 Minutes | 499 (11.6%) | 376 (10.8%) |
| 20 to 24 Minutes | 188 (4.4%) | 210 (6.0%) |
| 25 to 29 Minutes | 208 (4.8%) | 43 (1.2%) |
| 30 to 34 Minutes | 207 (4.8%) | 142 (4.1%) |
| 35 to 39 Minutes | 123 (2.9%) | 0 (0.0%) |
| 40 to 44 Minutes | 58 (1.3%) | 86 (2.5%) |
| 45 to 59 Minutes | 169 (3.9%) | 24 (0.7%) |
| 60 to 89 Minutes | 43 (1.0%) | 56 (1.6%) |
| 90 or more Minutes | 49 (1.1%) | 29 (0.8%) |
Time of Departure to Work by Sex in Vincennes
The most frequent times of departure to work in Vincennes are 4:00 PM to 11:59 PM (608, 14.1%) for males and 7:30 AM to 7:59 AM (709, 20.4%) for females.
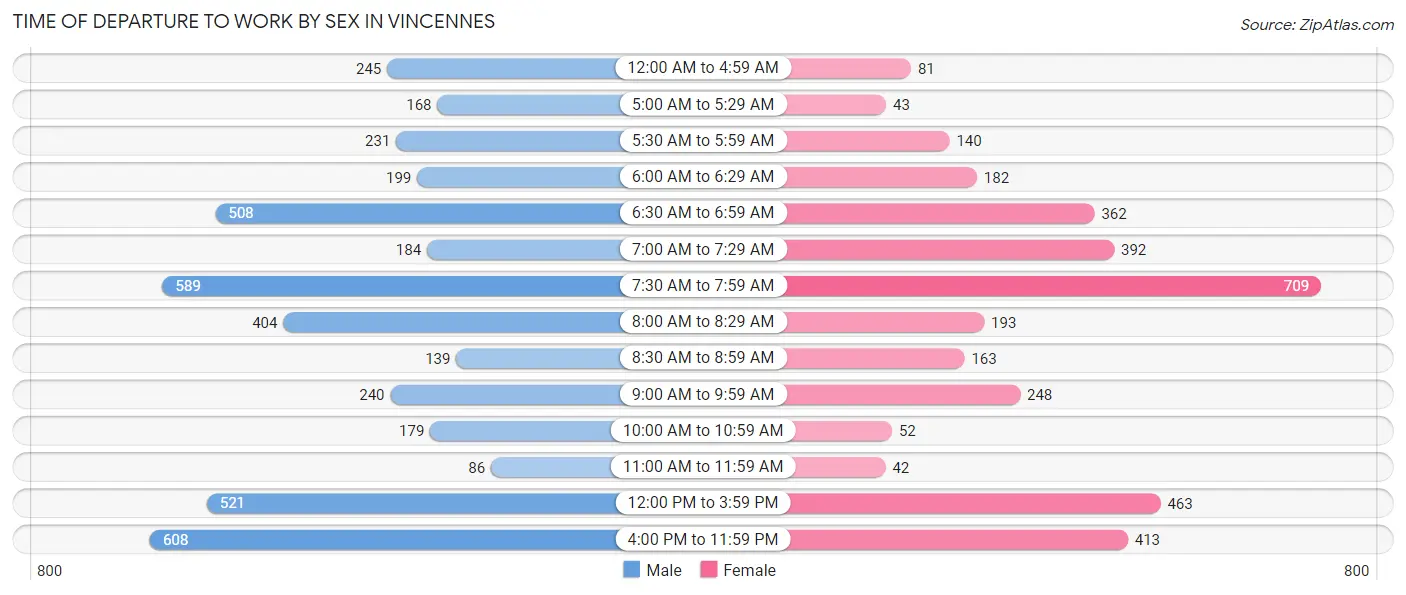
| Time of Departure | Male | Female |
| 12:00 AM to 4:59 AM | 245 (5.7%) | 81 (2.3%) |
| 5:00 AM to 5:29 AM | 168 (3.9%) | 43 (1.2%) |
| 5:30 AM to 5:59 AM | 231 (5.4%) | 140 (4.0%) |
| 6:00 AM to 6:29 AM | 199 (4.6%) | 182 (5.2%) |
| 6:30 AM to 6:59 AM | 508 (11.8%) | 362 (10.4%) |
| 7:00 AM to 7:29 AM | 184 (4.3%) | 392 (11.3%) |
| 7:30 AM to 7:59 AM | 589 (13.7%) | 709 (20.4%) |
| 8:00 AM to 8:29 AM | 404 (9.4%) | 193 (5.5%) |
| 8:30 AM to 8:59 AM | 139 (3.2%) | 163 (4.7%) |
| 9:00 AM to 9:59 AM | 240 (5.6%) | 248 (7.1%) |
| 10:00 AM to 10:59 AM | 179 (4.2%) | 52 (1.5%) |
| 11:00 AM to 11:59 AM | 86 (2.0%) | 42 (1.2%) |
| 12:00 PM to 3:59 PM | 521 (12.1%) | 463 (13.3%) |
| 4:00 PM to 11:59 PM | 608 (14.1%) | 413 (11.9%) |
| Total | 4,301 (100.0%) | 3,483 (100.0%) |
Housing Occupancy in Vincennes
Occupancy by Ownership in Vincennes
Of the total 7,173 dwellings in Vincennes, owner-occupied units account for 3,363 (46.9%), while renter-occupied units make up 3,810 (53.1%).
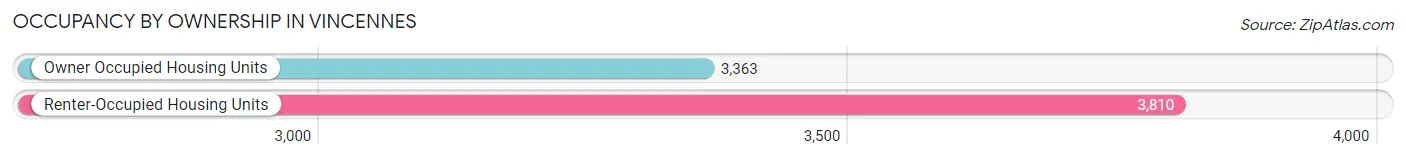
| Occupancy | # Housing Units | % Housing Units |
| Owner Occupied Housing Units | 3,363 | 46.9% |
| Renter-Occupied Housing Units | 3,810 | 53.1% |
| Total Occupied Housing Units | 7,173 | 100.0% |
Occupancy by Household Size in Vincennes
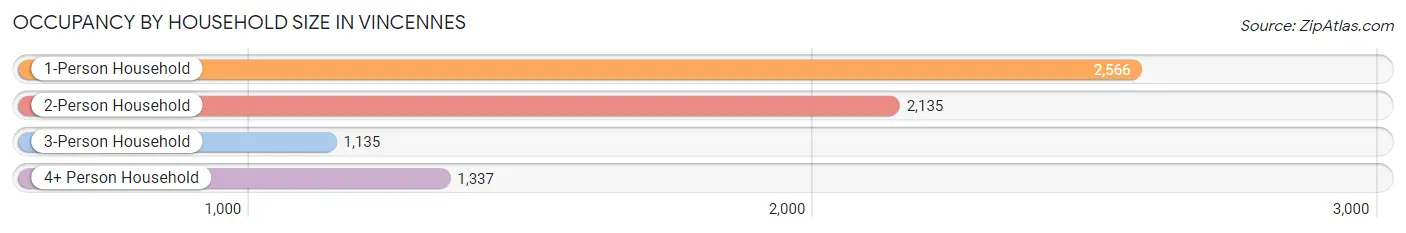
| Household Size | # Housing Units | % Housing Units |
| 1-Person Household | 2,566 | 35.8% |
| 2-Person Household | 2,135 | 29.8% |
| 3-Person Household | 1,135 | 15.8% |
| 4+ Person Household | 1,337 | 18.6% |
| Total Housing Units | 7,173 | 100.0% |
Occupancy by Ownership by Household Size in Vincennes
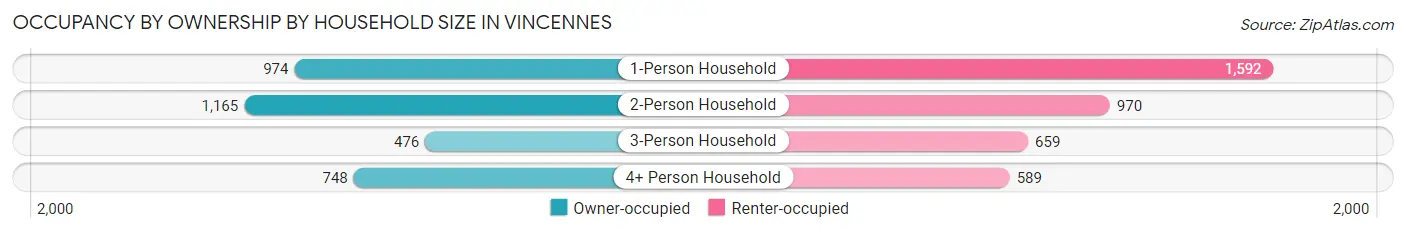
| Household Size | Owner-occupied | Renter-occupied |
| 1-Person Household | 974 (38.0%) | 1,592 (62.0%) |
| 2-Person Household | 1,165 (54.6%) | 970 (45.4%) |
| 3-Person Household | 476 (41.9%) | 659 (58.1%) |
| 4+ Person Household | 748 (55.9%) | 589 (44.1%) |
| Total Housing Units | 3,363 (46.9%) | 3,810 (53.1%) |
Occupancy by Educational Attainment in Vincennes
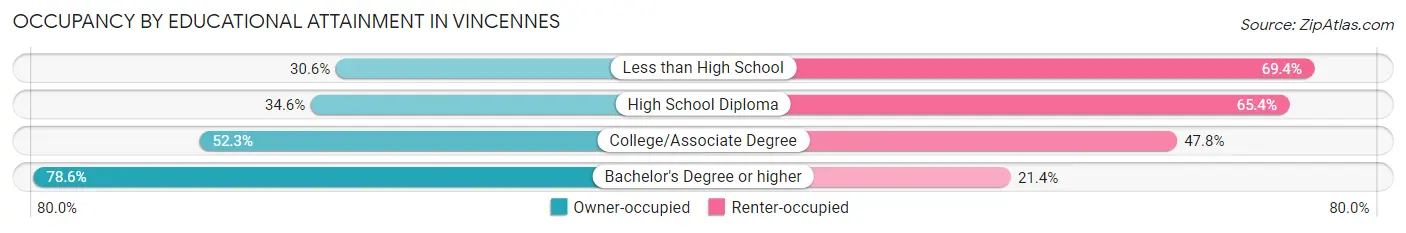
| Household Size | Owner-occupied | Renter-occupied |
| Less than High School | 386 (30.6%) | 876 (69.4%) |
| High School Diploma | 819 (34.6%) | 1,551 (65.4%) |
| College/Associate Degree | 1,240 (52.2%) | 1,133 (47.7%) |
| Bachelor's Degree or higher | 918 (78.6%) | 250 (21.4%) |
Occupancy by Age of Householder in Vincennes
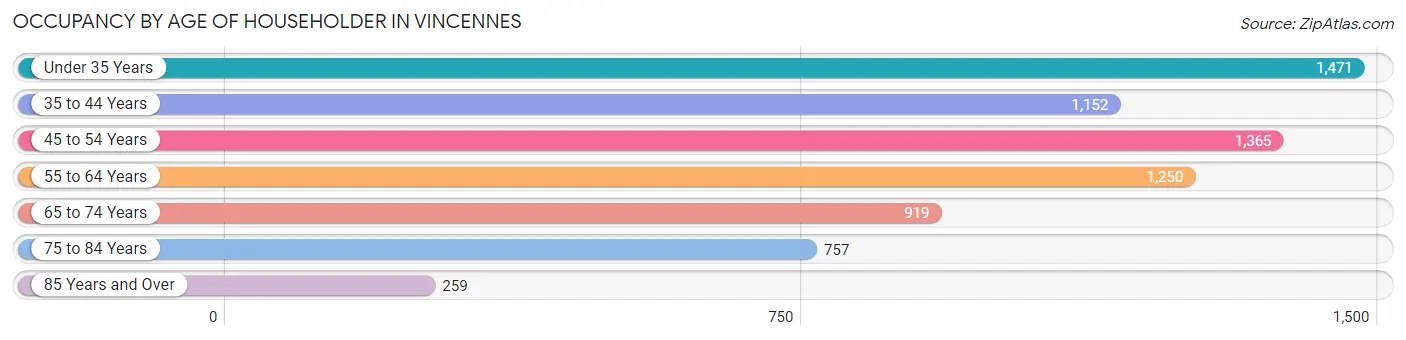
| Age Bracket | # Households | % Households |
| Under 35 Years | 1,471 | 20.5% |
| 35 to 44 Years | 1,152 | 16.1% |
| 45 to 54 Years | 1,365 | 19.0% |
| 55 to 64 Years | 1,250 | 17.4% |
| 65 to 74 Years | 919 | 12.8% |
| 75 to 84 Years | 757 | 10.5% |
| 85 Years and Over | 259 | 3.6% |
| Total | 7,173 | 100.0% |
Housing Finances in Vincennes
Median Income by Occupancy in Vincennes
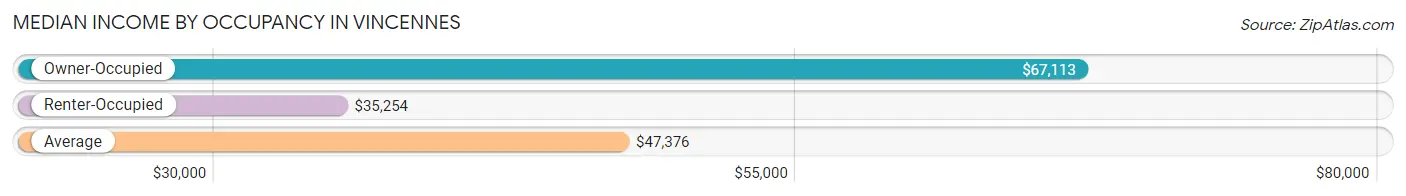
| Occupancy Type | # Households | Median Income |
| Owner-Occupied | 3,363 (46.9%) | $67,113 |
| Renter-Occupied | 3,810 (53.1%) | $35,254 |
| Average | 7,173 (100.0%) | $47,376 |
Occupancy by Householder Income Bracket in Vincennes
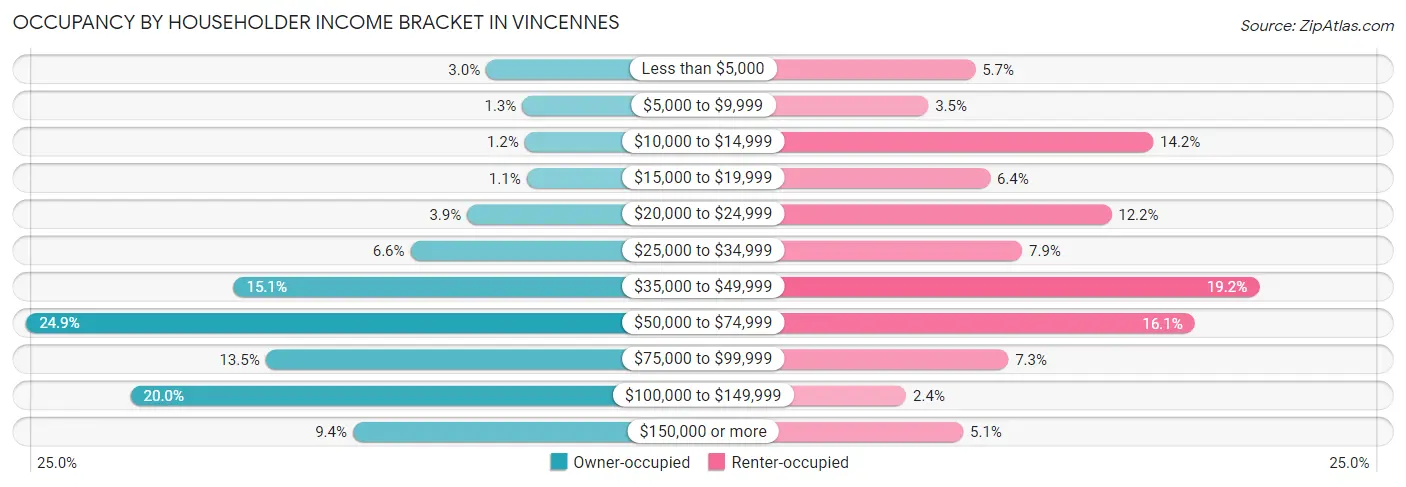
| Income Bracket | Owner-occupied | Renter-occupied |
| Less than $5,000 | 102 (3.0%) | 217 (5.7%) |
| $5,000 to $9,999 | 44 (1.3%) | 132 (3.5%) |
| $10,000 to $14,999 | 40 (1.2%) | 540 (14.2%) |
| $15,000 to $19,999 | 37 (1.1%) | 244 (6.4%) |
| $20,000 to $24,999 | 132 (3.9%) | 464 (12.2%) |
| $25,000 to $34,999 | 223 (6.6%) | 302 (7.9%) |
| $35,000 to $49,999 | 506 (15.0%) | 732 (19.2%) |
| $50,000 to $74,999 | 838 (24.9%) | 615 (16.1%) |
| $75,000 to $99,999 | 455 (13.5%) | 277 (7.3%) |
| $100,000 to $149,999 | 671 (20.0%) | 92 (2.4%) |
| $150,000 or more | 315 (9.4%) | 195 (5.1%) |
| Total | 3,363 (100.0%) | 3,810 (100.0%) |
Monthly Housing Cost Tiers in Vincennes
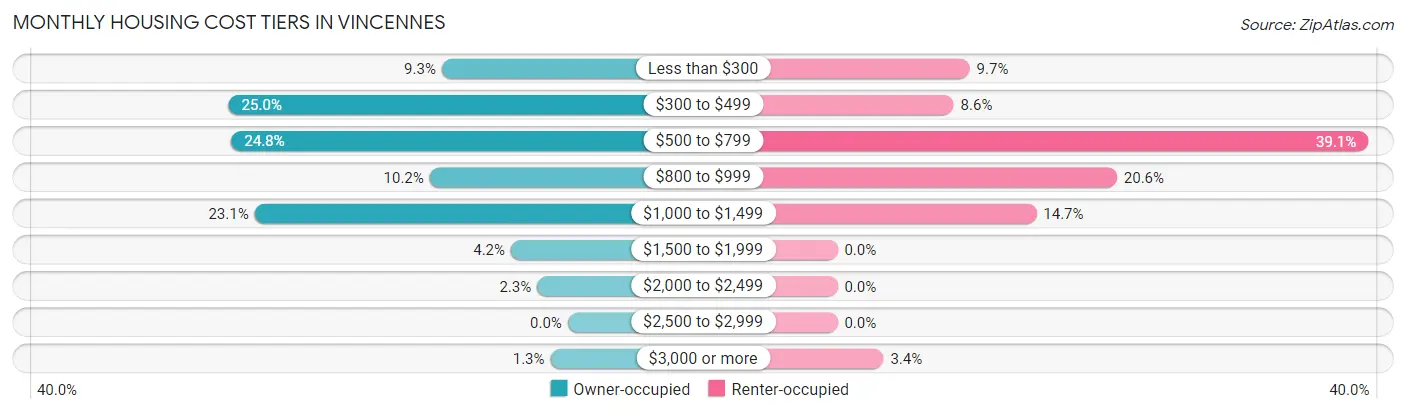
| Monthly Cost | Owner-occupied | Renter-occupied |
| Less than $300 | 312 (9.3%) | 371 (9.7%) |
| $300 to $499 | 840 (25.0%) | 326 (8.6%) |
| $500 to $799 | 833 (24.8%) | 1,489 (39.1%) |
| $800 to $999 | 342 (10.2%) | 784 (20.6%) |
| $1,000 to $1,499 | 776 (23.1%) | 558 (14.6%) |
| $1,500 to $1,999 | 141 (4.2%) | 0 (0.0%) |
| $2,000 to $2,499 | 76 (2.3%) | 0 (0.0%) |
| $2,500 to $2,999 | 0 (0.0%) | 0 (0.0%) |
| $3,000 or more | 43 (1.3%) | 129 (3.4%) |
| Total | 3,363 (100.0%) | 3,810 (100.0%) |
Physical Housing Characteristics in Vincennes
Housing Structures in Vincennes
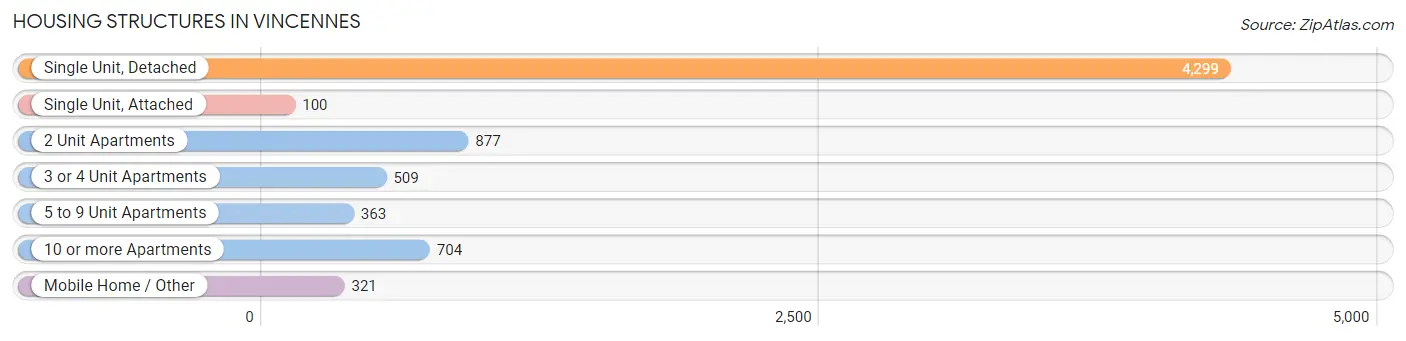
| Structure Type | # Housing Units | % Housing Units |
| Single Unit, Detached | 4,299 | 59.9% |
| Single Unit, Attached | 100 | 1.4% |
| 2 Unit Apartments | 877 | 12.2% |
| 3 or 4 Unit Apartments | 509 | 7.1% |
| 5 to 9 Unit Apartments | 363 | 5.1% |
| 10 or more Apartments | 704 | 9.8% |
| Mobile Home / Other | 321 | 4.5% |
| Total | 7,173 | 100.0% |
Housing Structures by Occupancy in Vincennes
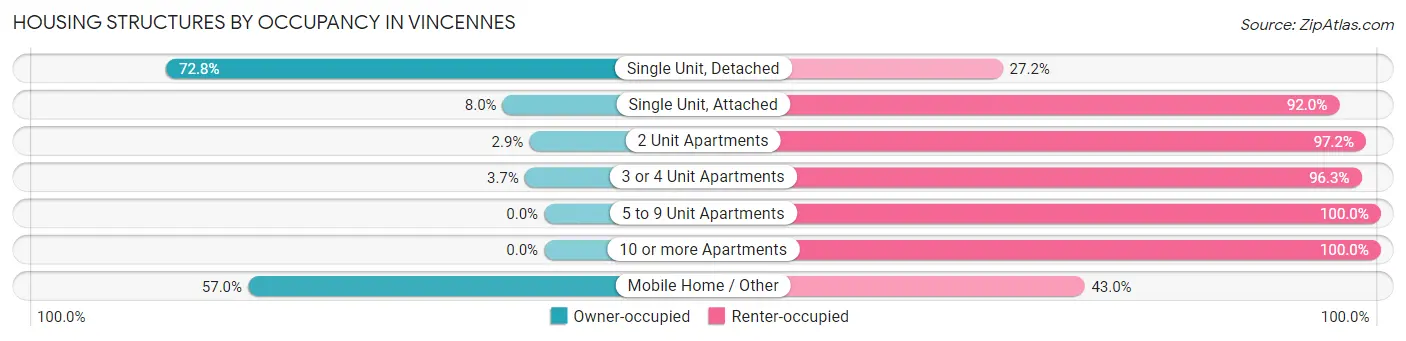
| Structure Type | Owner-occupied | Renter-occupied |
| Single Unit, Detached | 3,128 (72.8%) | 1,171 (27.2%) |
| Single Unit, Attached | 8 (8.0%) | 92 (92.0%) |
| 2 Unit Apartments | 25 (2.9%) | 852 (97.2%) |
| 3 or 4 Unit Apartments | 19 (3.7%) | 490 (96.3%) |
| 5 to 9 Unit Apartments | 0 (0.0%) | 363 (100.0%) |
| 10 or more Apartments | 0 (0.0%) | 704 (100.0%) |
| Mobile Home / Other | 183 (57.0%) | 138 (43.0%) |
| Total | 3,363 (46.9%) | 3,810 (53.1%) |
Housing Structures by Number of Rooms in Vincennes
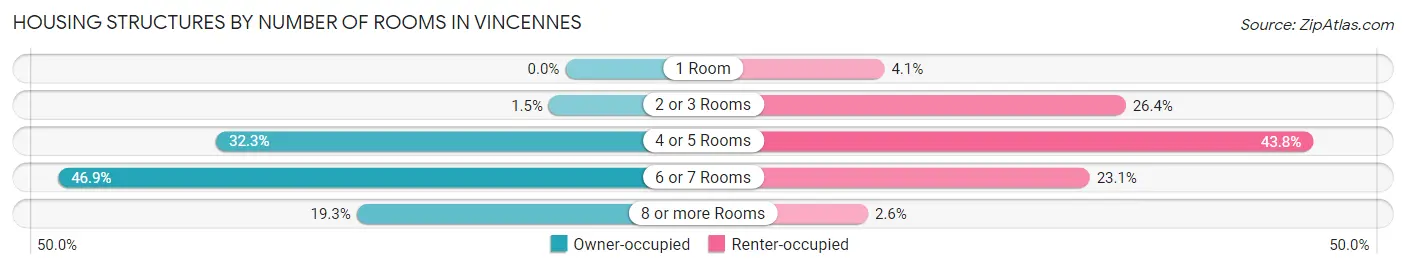
| Number of Rooms | Owner-occupied | Renter-occupied |
| 1 Room | 0 (0.0%) | 157 (4.1%) |
| 2 or 3 Rooms | 51 (1.5%) | 1,007 (26.4%) |
| 4 or 5 Rooms | 1,086 (32.3%) | 1,667 (43.8%) |
| 6 or 7 Rooms | 1,577 (46.9%) | 880 (23.1%) |
| 8 or more Rooms | 649 (19.3%) | 99 (2.6%) |
| Total | 3,363 (100.0%) | 3,810 (100.0%) |
Housing Structure by Heating Type in Vincennes
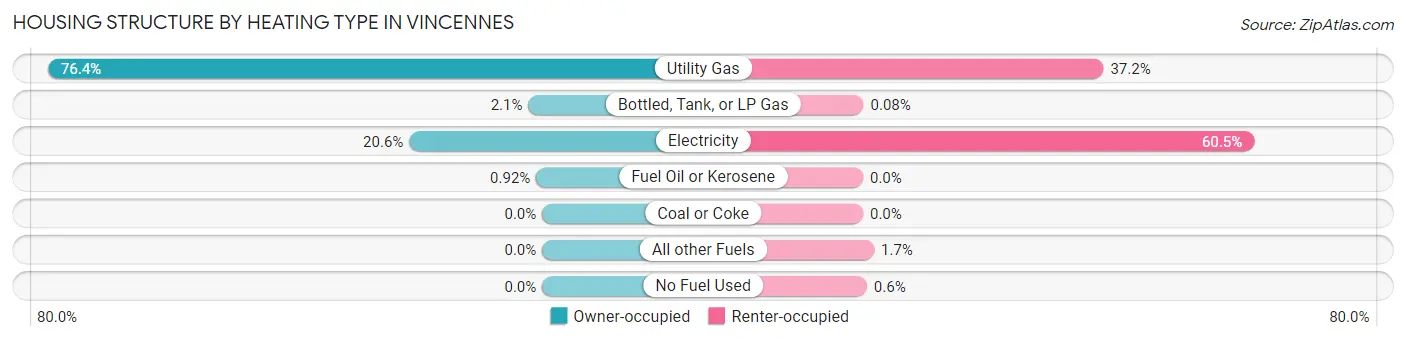
| Heating Type | Owner-occupied | Renter-occupied |
| Utility Gas | 2,569 (76.4%) | 1,416 (37.2%) |
| Bottled, Tank, or LP Gas | 72 (2.1%) | 3 (0.1%) |
| Electricity | 691 (20.5%) | 2,303 (60.5%) |
| Fuel Oil or Kerosene | 31 (0.9%) | 0 (0.0%) |
| Coal or Coke | 0 (0.0%) | 0 (0.0%) |
| All other Fuels | 0 (0.0%) | 65 (1.7%) |
| No Fuel Used | 0 (0.0%) | 23 (0.6%) |
| Total | 3,363 (100.0%) | 3,810 (100.0%) |
Household Vehicle Usage in Vincennes
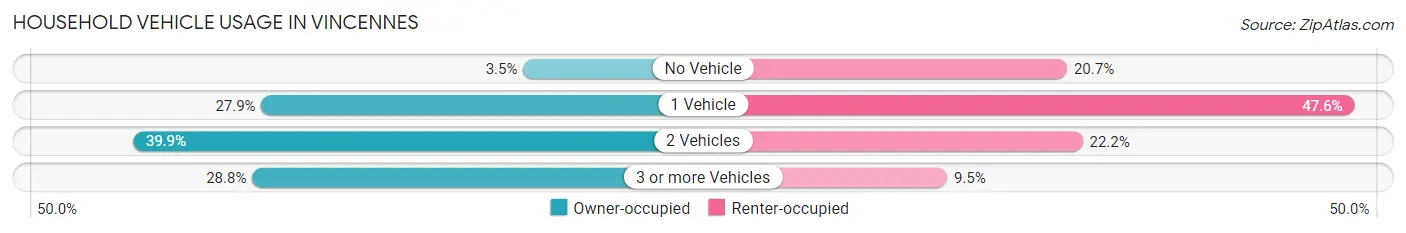
| Vehicles per Household | Owner-occupied | Renter-occupied |
| No Vehicle | 116 (3.5%) | 790 (20.7%) |
| 1 Vehicle | 938 (27.9%) | 1,812 (47.6%) |
| 2 Vehicles | 1,342 (39.9%) | 845 (22.2%) |
| 3 or more Vehicles | 967 (28.7%) | 363 (9.5%) |
| Total | 3,363 (100.0%) | 3,810 (100.0%) |
Real Estate & Mortgages in Vincennes
Real Estate and Mortgage Overview in Vincennes
| Characteristic | Without Mortgage | With Mortgage |
| Housing Units | 1,431 | 1,932 |
| Median Property Value | $84,700 | $101,400 |
| Median Household Income | $57,802 | $176 |
| Monthly Housing Costs | $404 | $43 |
| Real Estate Taxes | $718 | $35 |
Property Value by Mortgage Status in Vincennes
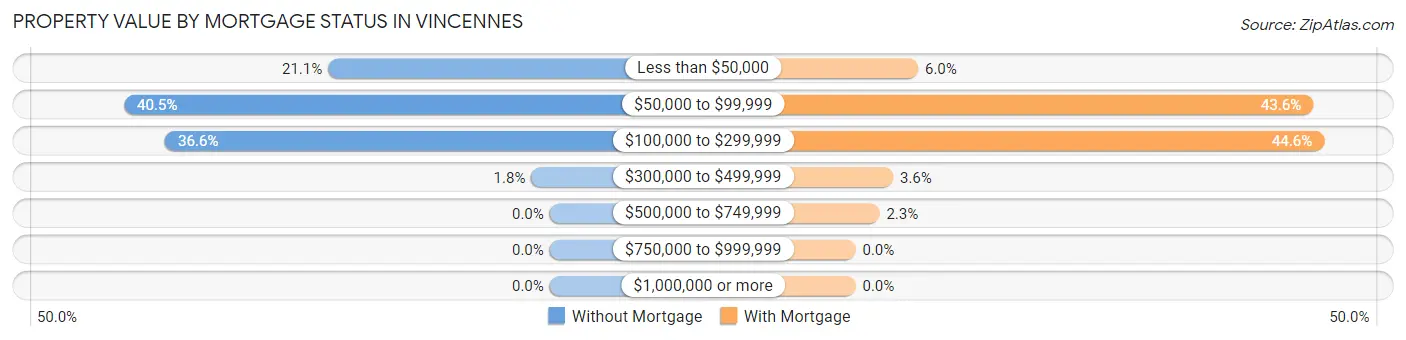
| Property Value | Without Mortgage | With Mortgage |
| Less than $50,000 | 302 (21.1%) | 115 (5.9%) |
| $50,000 to $99,999 | 580 (40.5%) | 842 (43.6%) |
| $100,000 to $299,999 | 524 (36.6%) | 862 (44.6%) |
| $300,000 to $499,999 | 25 (1.8%) | 69 (3.6%) |
| $500,000 to $749,999 | 0 (0.0%) | 44 (2.3%) |
| $750,000 to $999,999 | 0 (0.0%) | 0 (0.0%) |
| $1,000,000 or more | 0 (0.0%) | 0 (0.0%) |
| Total | 1,431 (100.0%) | 1,932 (100.0%) |
Household Income by Mortgage Status in Vincennes
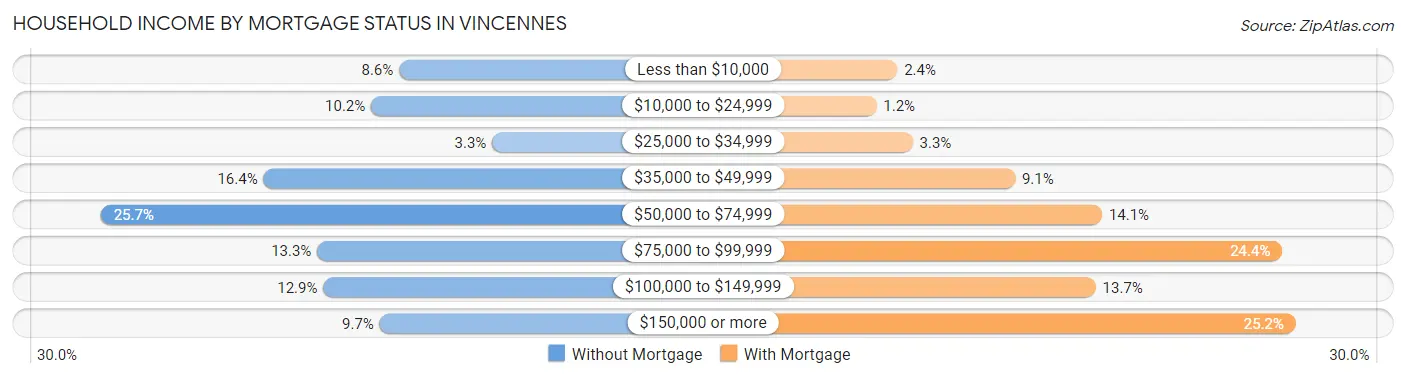
| Household Income | Without Mortgage | With Mortgage |
| Less than $10,000 | 123 (8.6%) | 46 (2.4%) |
| $10,000 to $24,999 | 146 (10.2%) | 23 (1.2%) |
| $25,000 to $34,999 | 47 (3.3%) | 63 (3.3%) |
| $35,000 to $49,999 | 234 (16.4%) | 176 (9.1%) |
| $50,000 to $74,999 | 367 (25.7%) | 272 (14.1%) |
| $75,000 to $99,999 | 190 (13.3%) | 471 (24.4%) |
| $100,000 to $149,999 | 185 (12.9%) | 265 (13.7%) |
| $150,000 or more | 139 (9.7%) | 486 (25.2%) |
| Total | 1,431 (100.0%) | 1,932 (100.0%) |
Property Value to Household Income Ratio in Vincennes
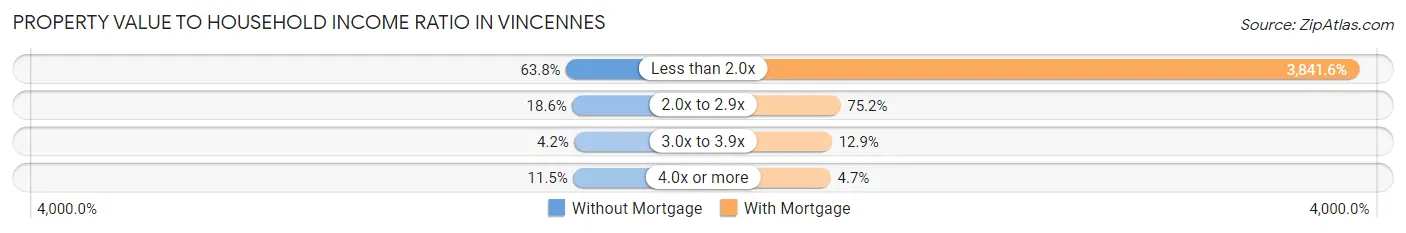
| Value-to-Income Ratio | Without Mortgage | With Mortgage |
| Less than 2.0x | 913 (63.8%) | 74,220 (3,841.6%) |
| 2.0x to 2.9x | 266 (18.6%) | 1,453 (75.2%) |
| 3.0x to 3.9x | 60 (4.2%) | 250 (12.9%) |
| 4.0x or more | 165 (11.5%) | 91 (4.7%) |
| Total | 1,431 (100.0%) | 1,932 (100.0%) |
Real Estate Taxes by Mortgage Status in Vincennes
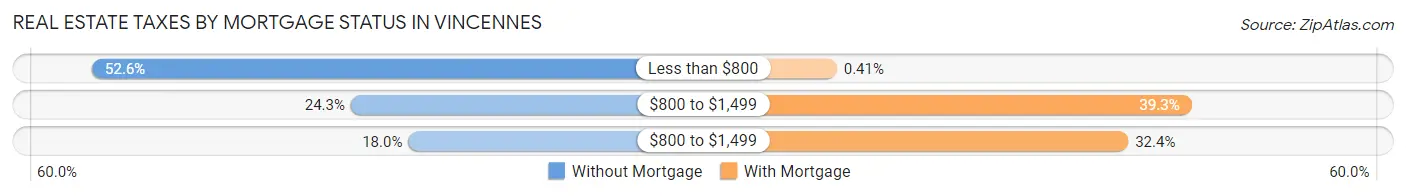
| Property Taxes | Without Mortgage | With Mortgage |
| Less than $800 | 753 (52.6%) | 8 (0.4%) |
| $800 to $1,499 | 347 (24.2%) | 759 (39.3%) |
| $800 to $1,499 | 257 (18.0%) | 625 (32.4%) |
| Total | 1,431 (100.0%) | 1,932 (100.0%) |
Health & Disability in Vincennes
Health Insurance Coverage by Age in Vincennes
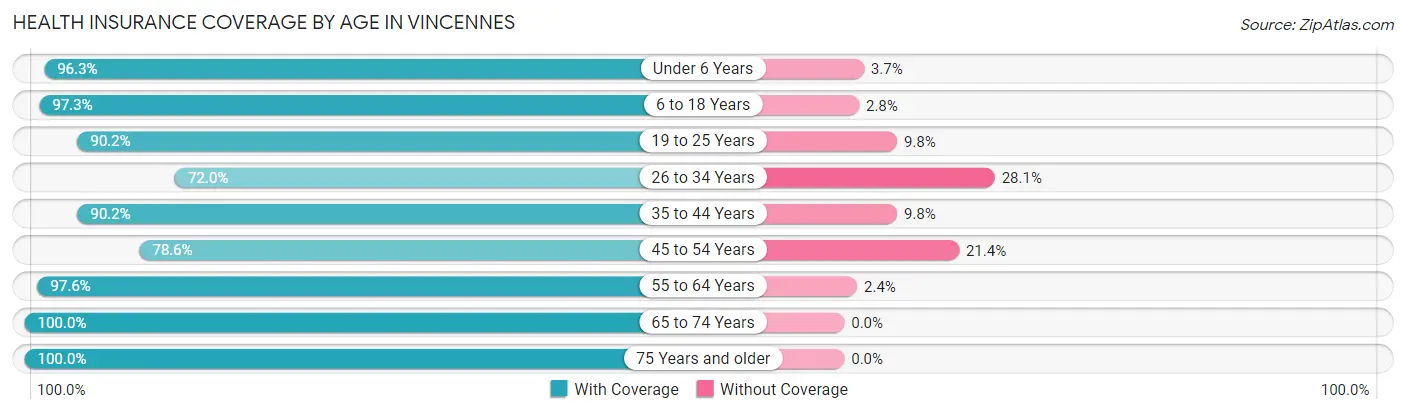
| Age Bracket | With Coverage | Without Coverage |
| Under 6 Years | 973 (96.3%) | 37 (3.7%) |
| 6 to 18 Years | 2,547 (97.3%) | 72 (2.8%) |
| 19 to 25 Years | 2,347 (90.2%) | 256 (9.8%) |
| 26 to 34 Years | 1,149 (72.0%) | 448 (28.1%) |
| 35 to 44 Years | 1,725 (90.2%) | 188 (9.8%) |
| 45 to 54 Years | 1,628 (78.6%) | 443 (21.4%) |
| 55 to 64 Years | 1,921 (97.6%) | 47 (2.4%) |
| 65 to 74 Years | 1,409 (100.0%) | 0 (0.0%) |
| 75 Years and older | 1,224 (100.0%) | 0 (0.0%) |
| Total | 14,923 (90.9%) | 1,491 (9.1%) |
Health Insurance Coverage by Citizenship Status in Vincennes
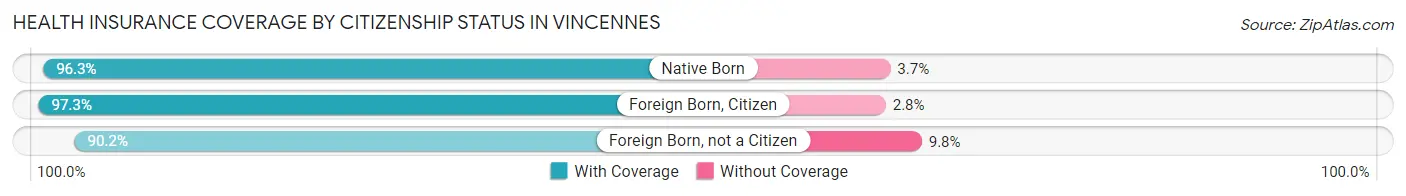
| Citizenship Status | With Coverage | Without Coverage |
| Native Born | 973 (96.3%) | 37 (3.7%) |
| Foreign Born, Citizen | 2,547 (97.3%) | 72 (2.8%) |
| Foreign Born, not a Citizen | 2,347 (90.2%) | 256 (9.8%) |
Health Insurance Coverage by Household Income in Vincennes
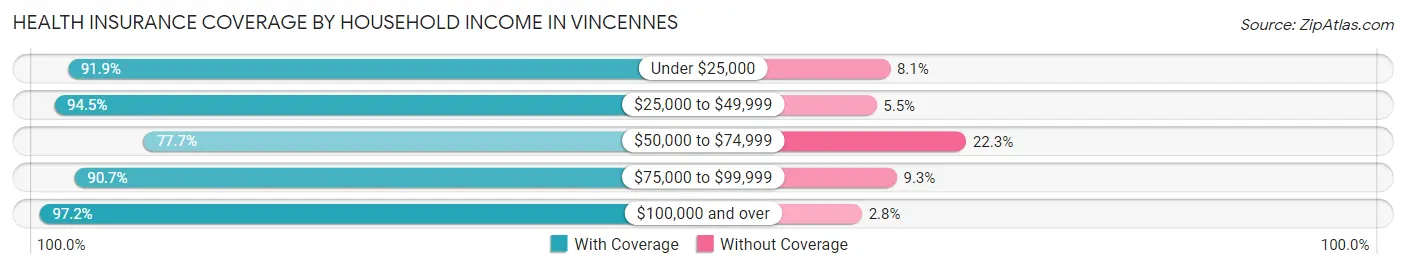
| Household Income | With Coverage | Without Coverage |
| Under $25,000 | 2,584 (91.9%) | 227 (8.1%) |
| $25,000 to $49,999 | 3,424 (94.5%) | 201 (5.5%) |
| $50,000 to $74,999 | 2,550 (77.7%) | 733 (22.3%) |
| $75,000 to $99,999 | 1,946 (90.7%) | 200 (9.3%) |
| $100,000 and over | 3,376 (97.2%) | 97 (2.8%) |
Public vs Private Health Insurance Coverage by Age in Vincennes
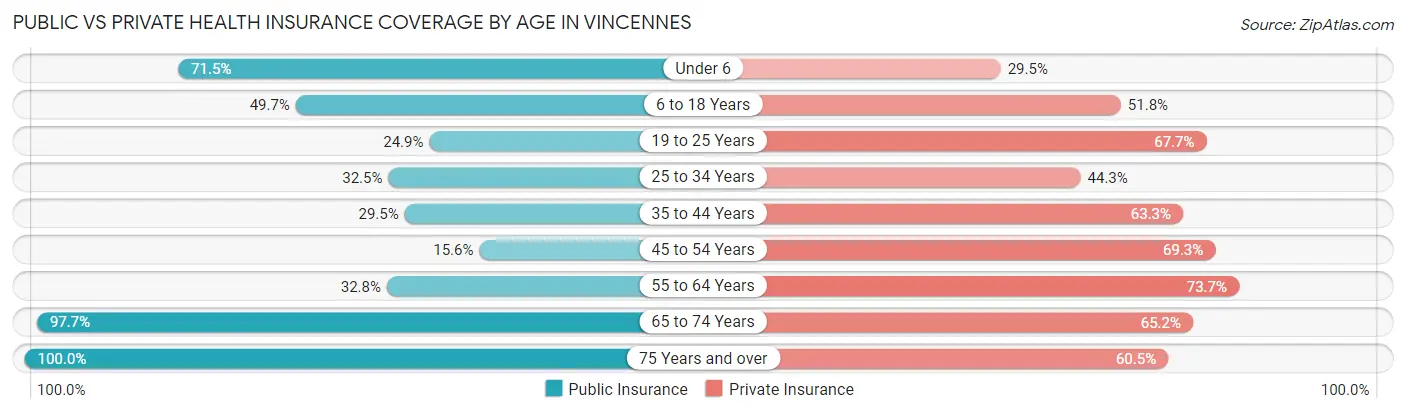
| Age Bracket | Public Insurance | Private Insurance |
| Under 6 | 722 (71.5%) | 298 (29.5%) |
| 6 to 18 Years | 1,301 (49.7%) | 1,357 (51.8%) |
| 19 to 25 Years | 648 (24.9%) | 1,761 (67.6%) |
| 25 to 34 Years | 519 (32.5%) | 708 (44.3%) |
| 35 to 44 Years | 564 (29.5%) | 1,211 (63.3%) |
| 45 to 54 Years | 323 (15.6%) | 1,435 (69.3%) |
| 55 to 64 Years | 645 (32.8%) | 1,450 (73.7%) |
| 65 to 74 Years | 1,377 (97.7%) | 918 (65.1%) |
| 75 Years and over | 1,224 (100.0%) | 741 (60.5%) |
| Total | 7,323 (44.6%) | 9,879 (60.2%) |
Disability Status by Sex by Age in Vincennes
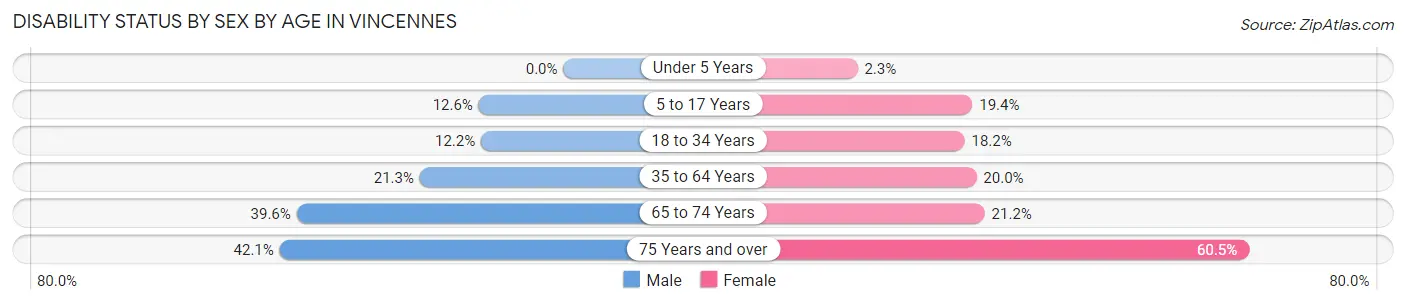
| Age Bracket | Male | Female |
| Under 5 Years | 0 (0.0%) | 9 (2.3%) |
| 5 to 17 Years | 130 (12.6%) | 250 (19.4%) |
| 18 to 34 Years | 319 (12.2%) | 371 (18.2%) |
| 35 to 64 Years | 642 (21.3%) | 588 (20.0%) |
| 65 to 74 Years | 263 (39.6%) | 158 (21.2%) |
| 75 Years and over | 166 (42.1%) | 502 (60.5%) |
Disability Class by Sex by Age in Vincennes
Disability Class: Hearing Difficulty
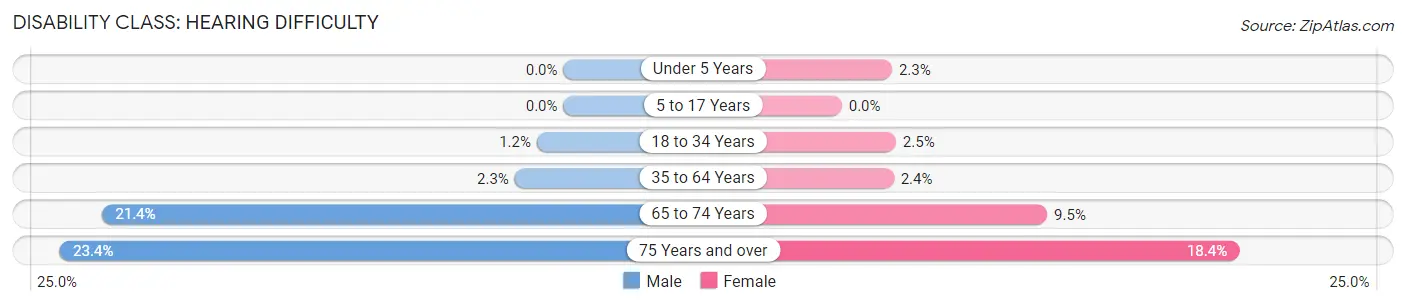
| Age Bracket | Male | Female |
| Under 5 Years | 0 (0.0%) | 9 (2.3%) |
| 5 to 17 Years | 0 (0.0%) | 0 (0.0%) |
| 18 to 34 Years | 32 (1.2%) | 51 (2.5%) |
| 35 to 64 Years | 68 (2.3%) | 71 (2.4%) |
| 65 to 74 Years | 142 (21.4%) | 71 (9.5%) |
| 75 Years and over | 92 (23.4%) | 153 (18.4%) |
Disability Class: Vision Difficulty
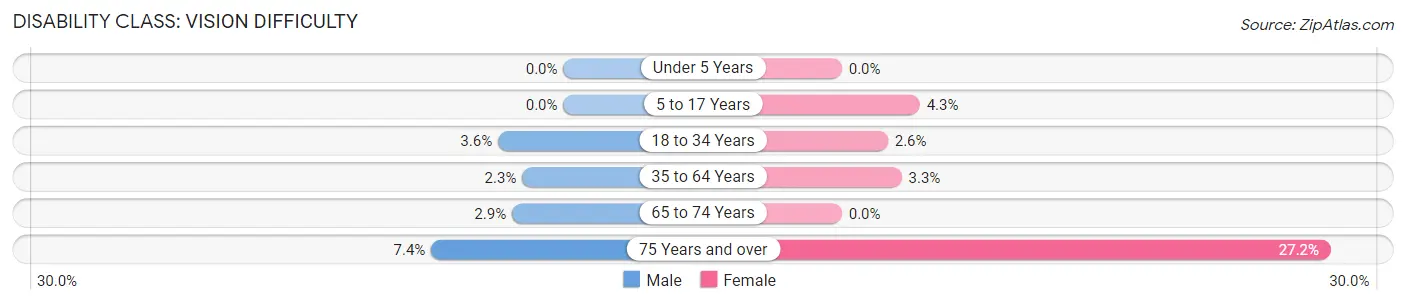
| Age Bracket | Male | Female |
| Under 5 Years | 0 (0.0%) | 0 (0.0%) |
| 5 to 17 Years | 0 (0.0%) | 56 (4.3%) |
| 18 to 34 Years | 95 (3.6%) | 52 (2.6%) |
| 35 to 64 Years | 69 (2.3%) | 98 (3.3%) |
| 65 to 74 Years | 19 (2.9%) | 0 (0.0%) |
| 75 Years and over | 29 (7.4%) | 226 (27.2%) |
Disability Class: Cognitive Difficulty
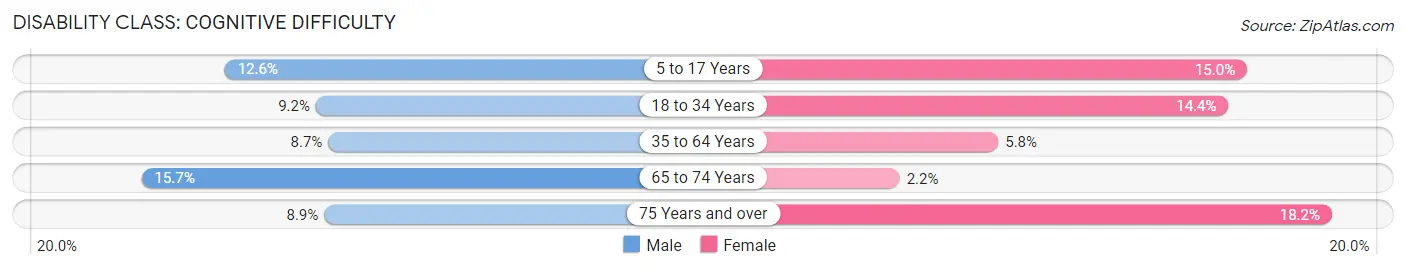
| Age Bracket | Male | Female |
| 5 to 17 Years | 130 (12.6%) | 194 (15.0%) |
| 18 to 34 Years | 240 (9.2%) | 292 (14.3%) |
| 35 to 64 Years | 263 (8.7%) | 171 (5.8%) |
| 65 to 74 Years | 104 (15.7%) | 16 (2.1%) |
| 75 Years and over | 35 (8.9%) | 151 (18.2%) |
Disability Class: Ambulatory Difficulty
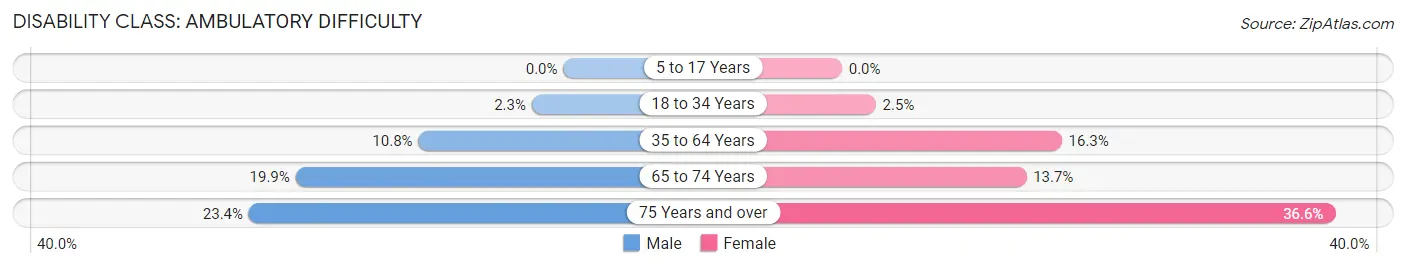
| Age Bracket | Male | Female |
| 5 to 17 Years | 0 (0.0%) | 0 (0.0%) |
| 18 to 34 Years | 61 (2.3%) | 51 (2.5%) |
| 35 to 64 Years | 324 (10.8%) | 480 (16.3%) |
| 65 to 74 Years | 132 (19.9%) | 102 (13.7%) |
| 75 Years and over | 92 (23.4%) | 304 (36.6%) |
Disability Class: Self-Care Difficulty
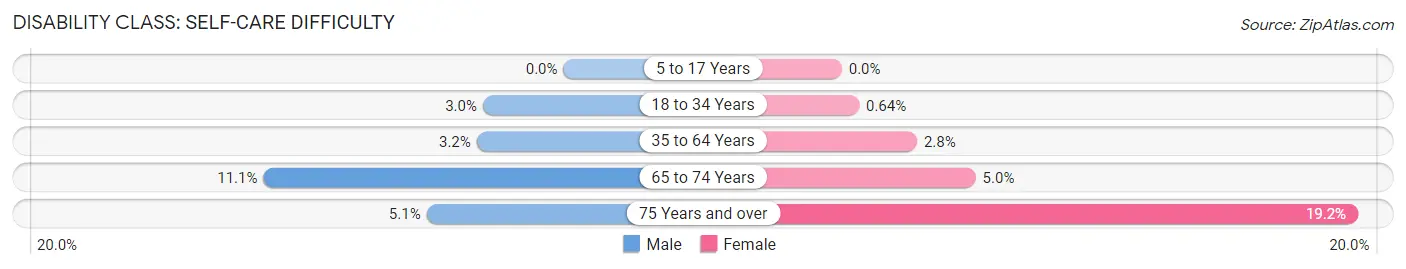
| Age Bracket | Male | Female |
| 5 to 17 Years | 0 (0.0%) | 0 (0.0%) |
| 18 to 34 Years | 78 (3.0%) | 13 (0.6%) |
| 35 to 64 Years | 97 (3.2%) | 82 (2.8%) |
| 65 to 74 Years | 74 (11.1%) | 37 (5.0%) |
| 75 Years and over | 20 (5.1%) | 159 (19.2%) |
Technology Access in Vincennes
Computing Device Access in Vincennes
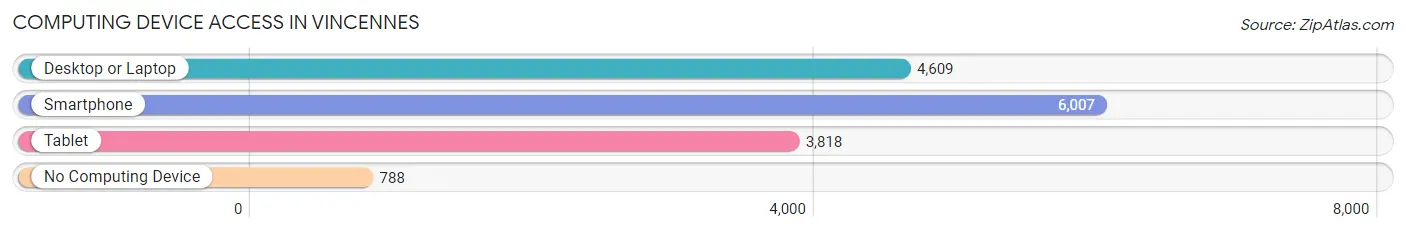
| Device Type | # Households | % Households |
| Desktop or Laptop | 4,609 | 64.2% |
| Smartphone | 6,007 | 83.7% |
| Tablet | 3,818 | 53.2% |
| No Computing Device | 788 | 11.0% |
| Total | 7,173 | 100.0% |
Internet Access in Vincennes
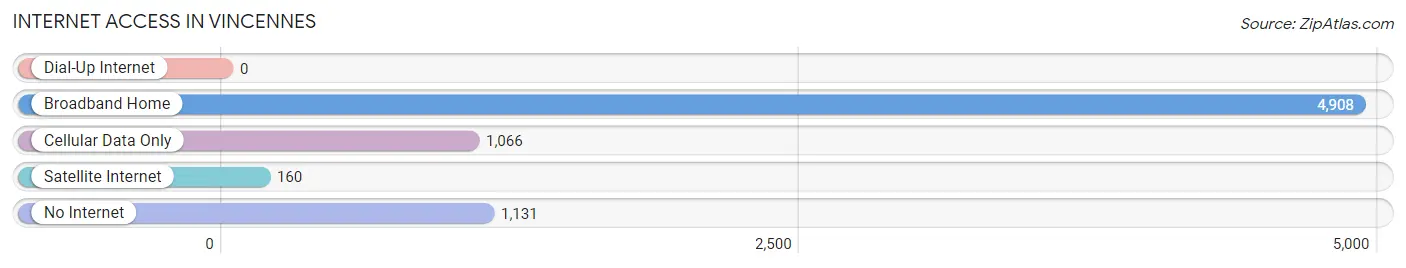
| Internet Type | # Households | % Households |
| Dial-Up Internet | 0 | 0.0% |
| Broadband Home | 4,908 | 68.4% |
| Cellular Data Only | 1,066 | 14.9% |
| Satellite Internet | 160 | 2.2% |
| No Internet | 1,131 | 15.8% |
| Total | 7,173 | 100.0% |
Vincennes Summary
Vincennes, Indiana is a city located in Knox County, Indiana, United States. It is the county seat of Knox County and is located along the Wabash River. The population of Vincennes was 18,423 at the 2010 census, making it the second-largest city in the state of Indiana.
History
Vincennes was founded in 1732 by French fur traders. It was the first permanent European settlement in what is now Indiana. The city was named after François-Marie Bissot, Sieur de Vincennes, a French military officer who was stationed in the area. The city was a major trading post for the French and British during the 18th century.
During the American Revolutionary War, Vincennes was the site of the Battle of Vincennes, which was fought between the American forces led by George Rogers Clark and the British forces led by Henry Hamilton. The Americans were victorious in the battle, and it was a major turning point in the war.
In the 19th century, Vincennes was an important port city on the Wabash River. It was a major center for the production of tobacco, and it was also a major stop on the Underground Railroad.
Geography
Vincennes is located in the southwestern part of Indiana, along the Wabash River. It is about 50 miles (80 km) south of Indianapolis and about 100 miles (160 km) east of St. Louis, Missouri. The city has a total area of 8.3 square miles (21.5 km2), of which 8.2 square miles (21.3 km2) is land and 0.1 square miles (0.2 km2) is water.
The climate in Vincennes is humid continental, with hot, humid summers and cold, snowy winters. The average annual temperature is 54 °F (12 °C), and the average annual precipitation is 40 inches (1,016 mm).
Economy
Vincennes has a diversified economy, with a mix of manufacturing, retail, and service industries. The city is home to several large employers, including Vincennes University, Good Samaritan Hospital, and the Vincennes State Historic Sites.
The city is also home to several small businesses, including restaurants, shops, and other services. The city is also home to several industrial parks, which provide jobs in manufacturing and other industries.
Demographics
As of the 2010 census, the population of Vincennes was 18,423. The racial makeup of the city was 87.3% White, 8.2% African American, 0.4% Native American, 0.7% Asian, 0.1% Pacific Islander, 1.2% from other races, and 2.1% from two or more races. Hispanic or Latino of any race were 3.2% of the population.
The median income for a household in Vincennes was $35,945, and the median income for a family was $45,945. The per capita income for the city was $19,945. About 14.3% of families and 17.7% of the population were below the poverty line, including 25.2% of those under age 18 and 8.7% of those age 65 or over.
Vincennes is a diverse city, with a mix of cultures and backgrounds. The city is home to a variety of religious denominations, including Catholic, Protestant, and Jewish. The city is also home to a variety of ethnicities, including German, Irish, Italian, and French.
Common Questions
What is Per Capita Income in Vincennes?
Per Capita income in Vincennes is $28,924.
What is the Median Family Income in Vincennes?
Median Family Income in Vincennes is $61,374.
What is the Median Household income in Vincennes?
Median Household Income in Vincennes is $47,376.
What is Income or Wage Gap in Vincennes?
Income or Wage Gap in Vincennes is 28.1%.
Women in Vincennes earn 71.9 cents for every dollar earned by a man.
What is Family Income Deficit in Vincennes?
Family Income Deficit in Vincennes is $9,388.
Families that are below poverty line in Vincennes earn $9,388 less on average than the poverty threshold level.
What is Inequality or Gini Index in Vincennes?
Inequality or Gini Index in Vincennes is 0.48.
What is the Total Population of Vincennes?
Total Population of Vincennes is 16,715.
What is the Total Male Population of Vincennes?
Total Male Population of Vincennes is 8,377.
What is the Total Female Population of Vincennes?
Total Female Population of Vincennes is 8,338.
What is the Ratio of Males per 100 Females in Vincennes?
There are 100.47 Males per 100 Females in Vincennes.
What is the Ratio of Females per 100 Males in Vincennes?
There are 99.53 Females per 100 Males in Vincennes.
What is the Median Population Age in Vincennes?
Median Population Age in Vincennes is 37.1 Years.
What is the Average Family Size in Vincennes
Average Family Size in Vincennes is 2.7 People.
What is the Average Household Size in Vincennes
Average Household Size in Vincennes is 2.1 People.
How Large is the Labor Force in Vincennes?
There are 8,539 People in the Labor Forcein in Vincennes.
What is the Percentage of People in the Labor Force in Vincennes?
61.1% of People are in the Labor Force in Vincennes.
What is the Unemployment Rate in Vincennes?
Unemployment Rate in Vincennes is 5.3%.