Farmersburg, IN Map & Demographics
Farmersburg Map
Farmersburg Overview
$25,733
PER CAPITA INCOME
$70,345
AVG FAMILY INCOME
$64,167
AVG HOUSEHOLD INCOME
9.2%
WAGE / INCOME GAP [ % ]
90.8¢/ $1
WAGE / INCOME GAP [ $ ]
0.37
INEQUALITY / GINI INDEX
1,224
TOTAL POPULATION
627
MALE POPULATION
597
FEMALE POPULATION
105.03
MALES / 100 FEMALES
95.22
FEMALES / 100 MALES
42.0
MEDIAN AGE
2.8
AVG FAMILY SIZE
2.5
AVG HOUSEHOLD SIZE
534
LABOR FORCE [ PEOPLE ]
52.4%
PERCENT IN LABOR FORCE
1.7%
UNEMPLOYMENT RATE
Farmersburg Zip Codes
Farmersburg Area Codes
Income in Farmersburg
Income Overview in Farmersburg
Per Capita Income in Farmersburg is $25,733, while median incomes of families and households are $70,345 and $64,167 respectively.
| Characteristic | Number | Measure |
| Per Capita Income | 1,224 | $25,733 |
| Median Family Income | 378 | $70,345 |
| Mean Family Income | 378 | $75,142 |
| Median Household Income | 482 | $64,167 |
| Mean Household Income | 482 | $68,794 |
| Income Deficit | 378 | $0 |
| Wage / Income Gap (%) | 1,224 | 9.21% |
| Wage / Income Gap ($) | 1,224 | 90.79¢ per $1 |
| Gini / Inequality Index | 1,224 | 0.37 |
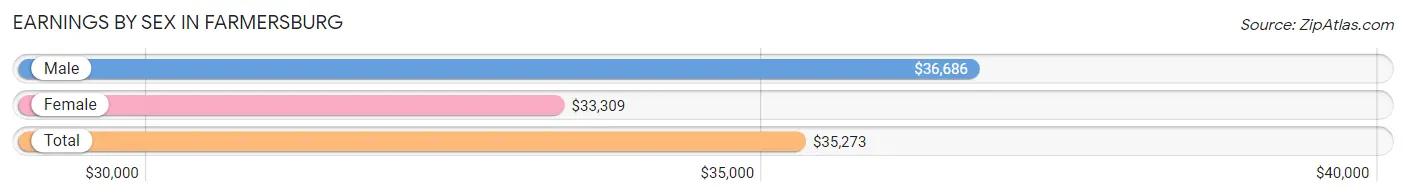
Earnings by Sex in Farmersburg
Average Earnings in Farmersburg are $35,273, $36,686 for men and $33,309 for women, a difference of 9.2%.
| Sex | Number | Average Earnings |
| Male | 286 (51.4%) | $36,686 |
| Female | 270 (48.6%) | $33,309 |
| Total | 556 (100.0%) | $35,273 |
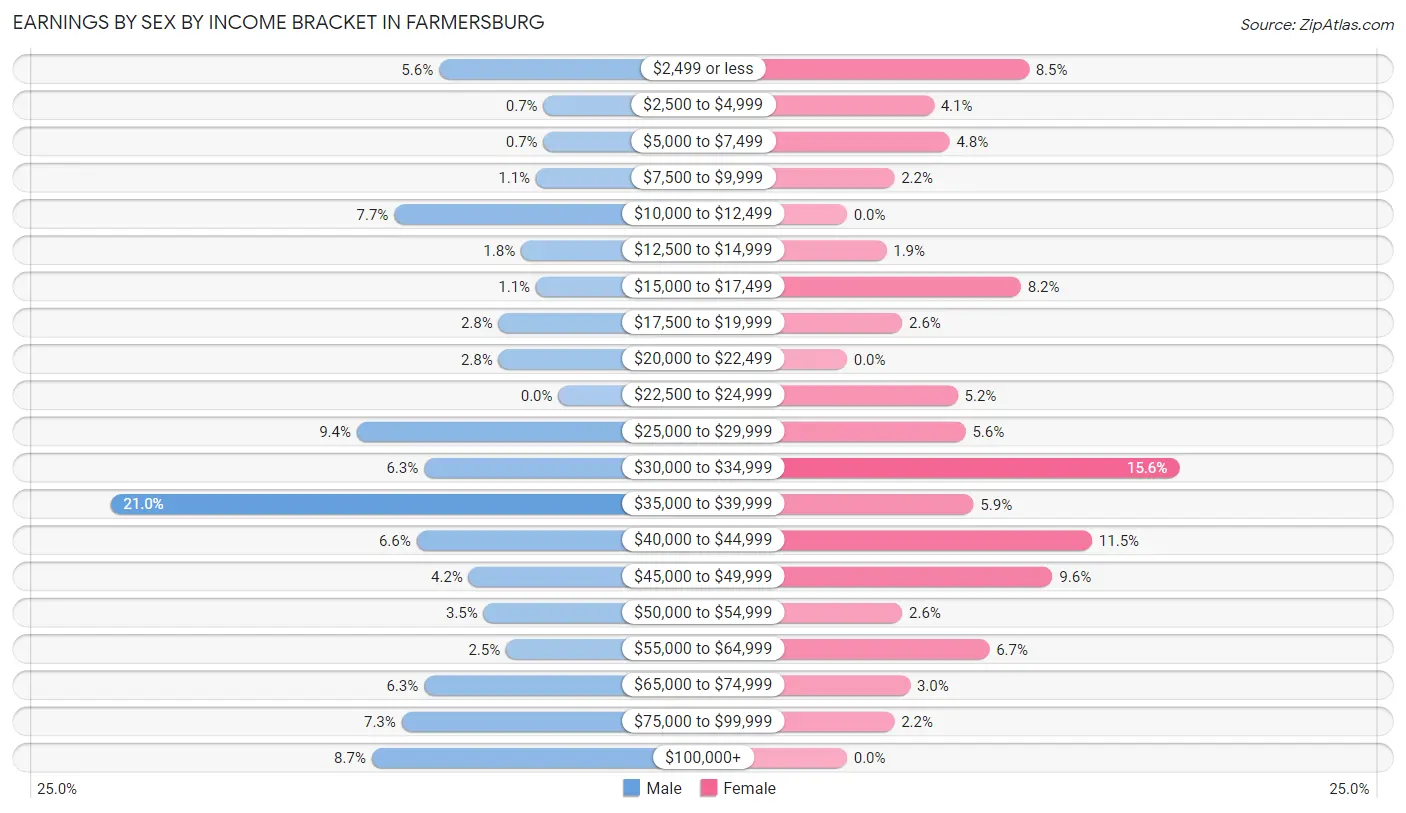
Earnings by Sex by Income Bracket in Farmersburg
The most common earnings brackets in Farmersburg are $35,000 to $39,999 for men (60 | 21.0%) and $30,000 to $34,999 for women (42 | 15.6%).
| Income | Male | Female |
| $2,499 or less | 16 (5.6%) | 23 (8.5%) |
| $2,500 to $4,999 | 2 (0.7%) | 11 (4.1%) |
| $5,000 to $7,499 | 2 (0.7%) | 13 (4.8%) |
| $7,500 to $9,999 | 3 (1.1%) | 6 (2.2%) |
| $10,000 to $12,499 | 22 (7.7%) | 0 (0.0%) |
| $12,500 to $14,999 | 5 (1.8%) | 5 (1.8%) |
| $15,000 to $17,499 | 3 (1.1%) | 22 (8.2%) |
| $17,500 to $19,999 | 8 (2.8%) | 7 (2.6%) |
| $20,000 to $22,499 | 8 (2.8%) | 0 (0.0%) |
| $22,500 to $24,999 | 0 (0.0%) | 14 (5.2%) |
| $25,000 to $29,999 | 27 (9.4%) | 15 (5.6%) |
| $30,000 to $34,999 | 18 (6.3%) | 42 (15.6%) |
| $35,000 to $39,999 | 60 (21.0%) | 16 (5.9%) |
| $40,000 to $44,999 | 19 (6.6%) | 31 (11.5%) |
| $45,000 to $49,999 | 12 (4.2%) | 26 (9.6%) |
| $50,000 to $54,999 | 10 (3.5%) | 7 (2.6%) |
| $55,000 to $64,999 | 7 (2.5%) | 18 (6.7%) |
| $65,000 to $74,999 | 18 (6.3%) | 8 (3.0%) |
| $75,000 to $99,999 | 21 (7.3%) | 6 (2.2%) |
| $100,000+ | 25 (8.7%) | 0 (0.0%) |
| Total | 286 (100.0%) | 270 (100.0%) |
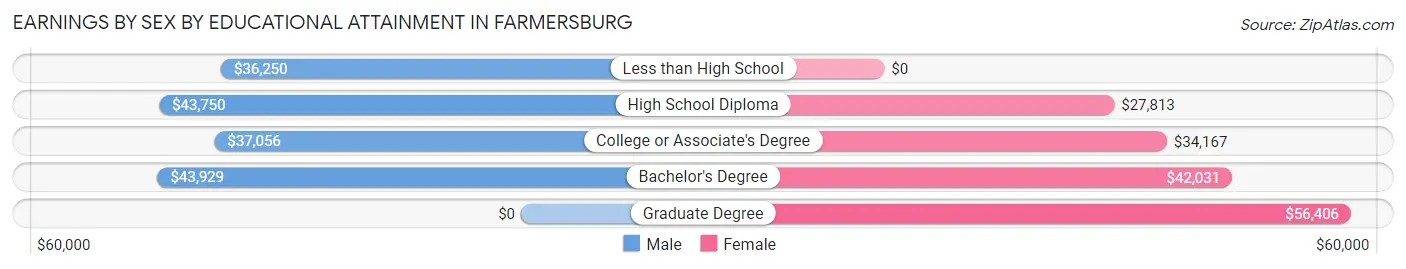
Earnings by Sex by Educational Attainment in Farmersburg
Average earnings in Farmersburg are $38,162 for men and $34,890 for women, a difference of 8.6%. Men with an educational attainment of bachelor's degree enjoy the highest average annual earnings of $43,929, while those with less than high school education earn the least with $36,250. Women with an educational attainment of graduate degree earn the most with the average annual earnings of $56,406, while those with high school diploma education have the smallest earnings of $27,813.
| Educational Attainment | Male Income | Female Income |
| Less than High School | $36,250 | $0 |
| High School Diploma | $43,750 | $27,813 |
| College or Associate's Degree | $37,056 | $34,167 |
| Bachelor's Degree | $43,929 | $42,031 |
| Graduate Degree | - | - |
| Total | $38,162 | $34,890 |
Family Income in Farmersburg
Family Income Brackets in Farmersburg
According to the Farmersburg family income data, there are 88 families falling into the $75,000 to $99,999 income range, which is the most common income bracket and makes up 23.3% of all families. Conversely, the $200,000+ income bracket is the least frequent group with only 2 families (0.5%) belonging to this category.
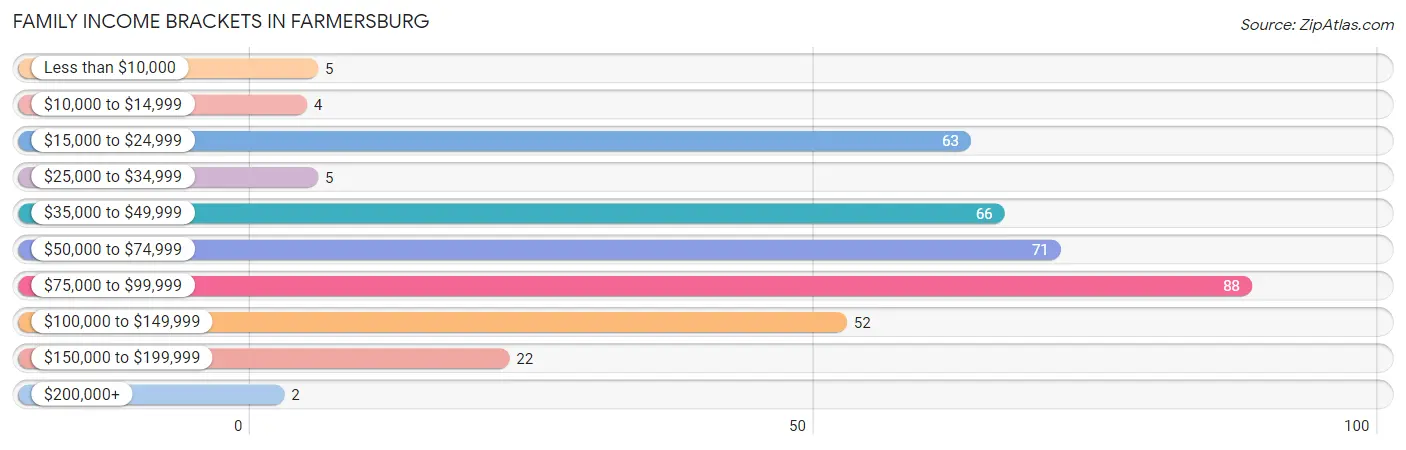
| Income Bracket | # Families | % Families |
| Less than $10,000 | 5 | 1.3% |
| $10,000 to $14,999 | 4 | 1.1% |
| $15,000 to $24,999 | 63 | 16.7% |
| $25,000 to $34,999 | 5 | 1.3% |
| $35,000 to $49,999 | 66 | 17.5% |
| $50,000 to $74,999 | 71 | 18.8% |
| $75,000 to $99,999 | 88 | 23.3% |
| $100,000 to $149,999 | 52 | 13.8% |
| $150,000 to $199,999 | 22 | 5.8% |
| $200,000+ | 2 | 0.5% |
Family Income by Famaliy Size in Farmersburg
5-person families (10 | 2.6%) account for the highest median family income in Farmersburg with $130,833 per family, while 3-person families (50 | 13.2%) have the highest median income of $39,286 per family member.
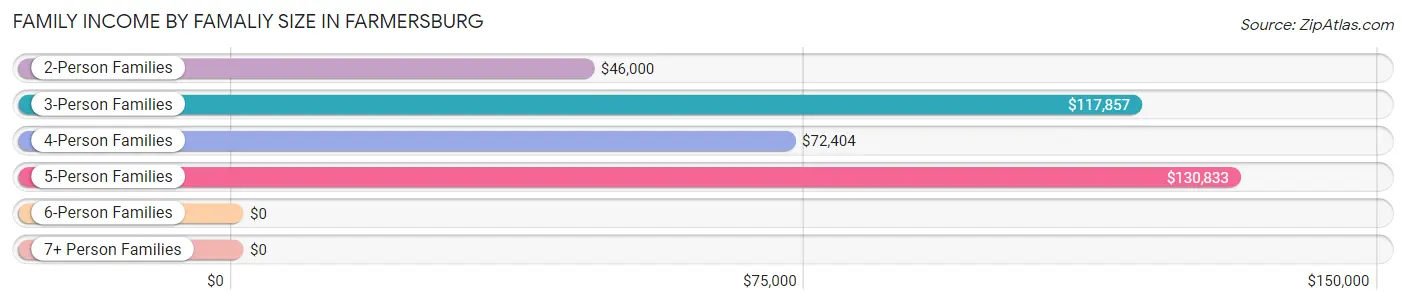
| Income Bracket | # Families | Median Income |
| 2-Person Families | 188 (49.7%) | $46,000 |
| 3-Person Families | 50 (13.2%) | $117,857 |
| 4-Person Families | 118 (31.2%) | $72,404 |
| 5-Person Families | 10 (2.6%) | $130,833 |
| 6-Person Families | 5 (1.3%) | $0 |
| 7+ Person Families | 7 (1.8%) | $0 |
| Total | 378 (100.0%) | $70,345 |
Family Income by Number of Earners in Farmersburg
The median family income in Farmersburg is $70,345, with families comprising 3+ earners (30) having the highest median family income of $122,857, while families with no earners (103) have the lowest median family income of $30,750, accounting for 7.9% and 27.3% of families, respectively.
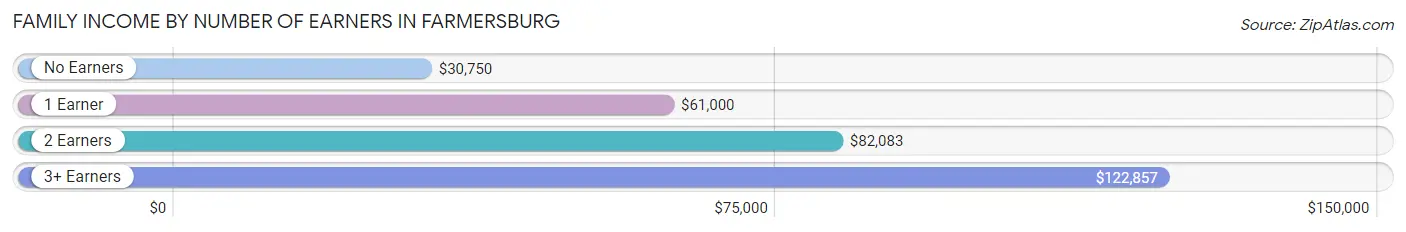
| Number of Earners | # Families | Median Income |
| No Earners | 103 (27.3%) | $30,750 |
| 1 Earner | 118 (31.2%) | $61,000 |
| 2 Earners | 127 (33.6%) | $82,083 |
| 3+ Earners | 30 (7.9%) | $122,857 |
| Total | 378 (100.0%) | $70,345 |
Household Income in Farmersburg
Household Income Brackets in Farmersburg
With 103 households falling in the category, the $50,000 to $74,999 income range is the most frequent in Farmersburg, accounting for 21.4% of all households. In contrast, only 2 households (0.4%) fall into the $200,000+ income bracket, making it the least populous group.
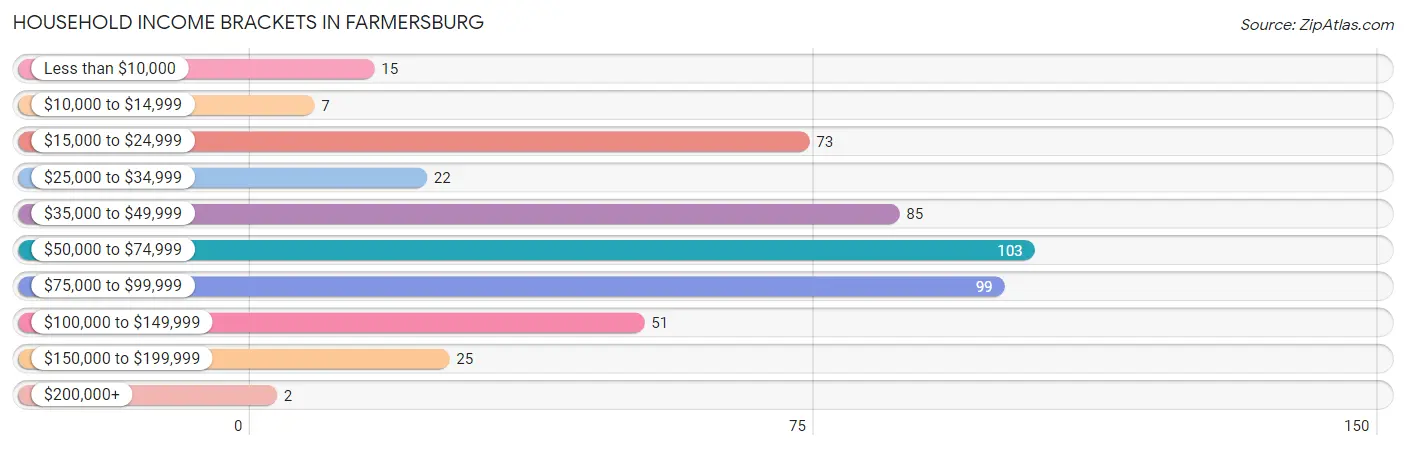
| Income Bracket | # Households | % Households |
| Less than $10,000 | 15 | 3.1% |
| $10,000 to $14,999 | 7 | 1.5% |
| $15,000 to $24,999 | 73 | 15.1% |
| $25,000 to $34,999 | 22 | 4.6% |
| $35,000 to $49,999 | 85 | 17.6% |
| $50,000 to $74,999 | 103 | 21.4% |
| $75,000 to $99,999 | 99 | 20.5% |
| $100,000 to $149,999 | 51 | 10.6% |
| $150,000 to $199,999 | 25 | 5.2% |
| $200,000+ | 2 | 0.4% |
Household Income by Householder Age in Farmersburg
The median household income in Farmersburg is $64,167, with the highest median household income of $80,536 found in the 45 to 64 years age bracket for the primary householder. A total of 182 households (37.8%) fall into this category. Meanwhile, the 15 to 24 years age bracket for the primary householder has the lowest median household income of $0, with 21 households (4.4%) in this group.
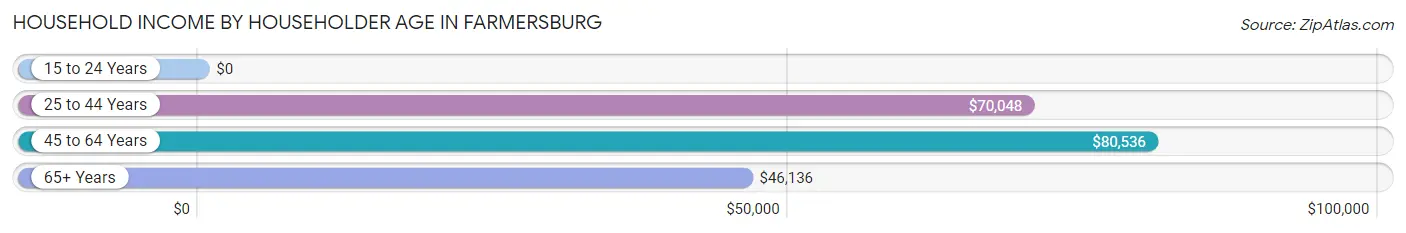
| Income Bracket | # Households | Median Income |
| 15 to 24 Years | 21 (4.4%) | $0 |
| 25 to 44 Years | 151 (31.3%) | $70,048 |
| 45 to 64 Years | 182 (37.8%) | $80,536 |
| 65+ Years | 128 (26.6%) | $46,136 |
| Total | 482 (100.0%) | $64,167 |
Poverty in Farmersburg
Income Below Poverty by Sex and Age in Farmersburg
With 7.5% poverty level for males and 8.4% for females among the residents of Farmersburg, under 5 year old males and 18 to 24 year old females are the most vulnerable to poverty, with 9 males (75.0%) and 20 females (64.5%) in their respective age groups living below the poverty level.
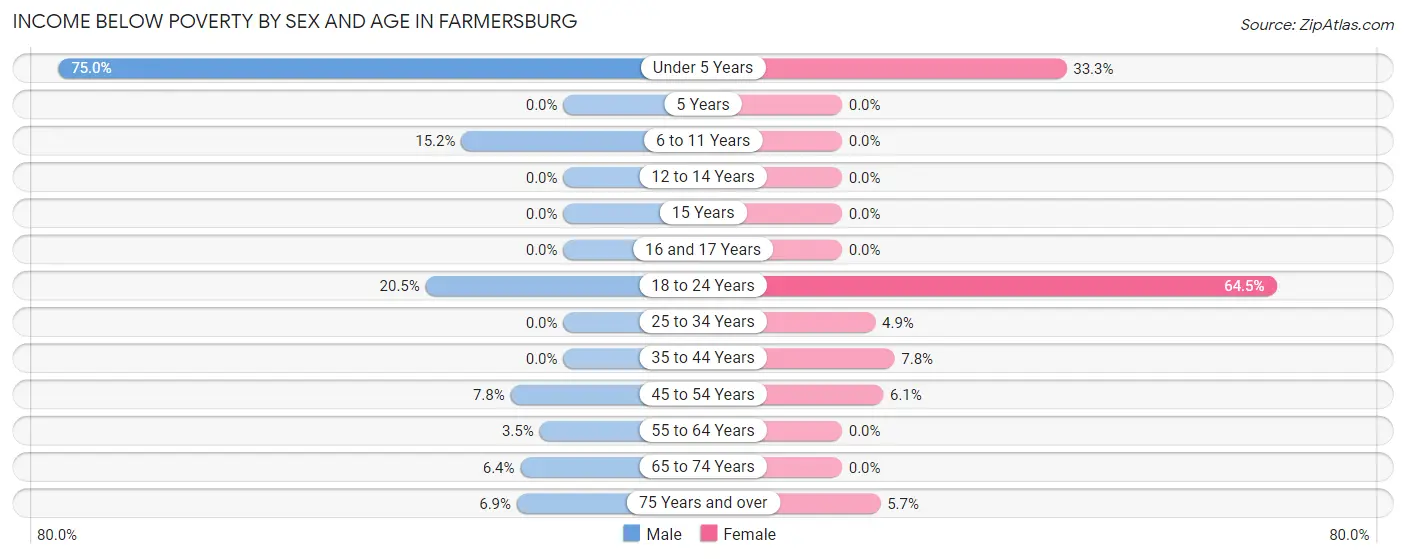
| Age Bracket | Male | Female |
| Under 5 Years | 9 (75.0%) | 12 (33.3%) |
| 5 Years | 0 (0.0%) | 0 (0.0%) |
| 6 to 11 Years | 5 (15.1%) | 0 (0.0%) |
| 12 to 14 Years | 0 (0.0%) | 0 (0.0%) |
| 15 Years | 0 (0.0%) | 0 (0.0%) |
| 16 and 17 Years | 0 (0.0%) | 0 (0.0%) |
| 18 to 24 Years | 18 (20.4%) | 20 (64.5%) |
| 25 to 34 Years | 0 (0.0%) | 4 (4.9%) |
| 35 to 44 Years | 0 (0.0%) | 5 (7.8%) |
| 45 to 54 Years | 4 (7.8%) | 3 (6.1%) |
| 55 to 64 Years | 3 (3.5%) | 0 (0.0%) |
| 65 to 74 Years | 3 (6.4%) | 0 (0.0%) |
| 75 Years and over | 4 (6.9%) | 6 (5.7%) |
| Total | 46 (7.5%) | 50 (8.4%) |
Income Above Poverty by Sex and Age in Farmersburg
According to the poverty statistics in Farmersburg, males aged 5 years and females aged 6 to 11 years are the age groups that are most secure financially, with 100.0% of males and 100.0% of females in these age groups living above the poverty line.
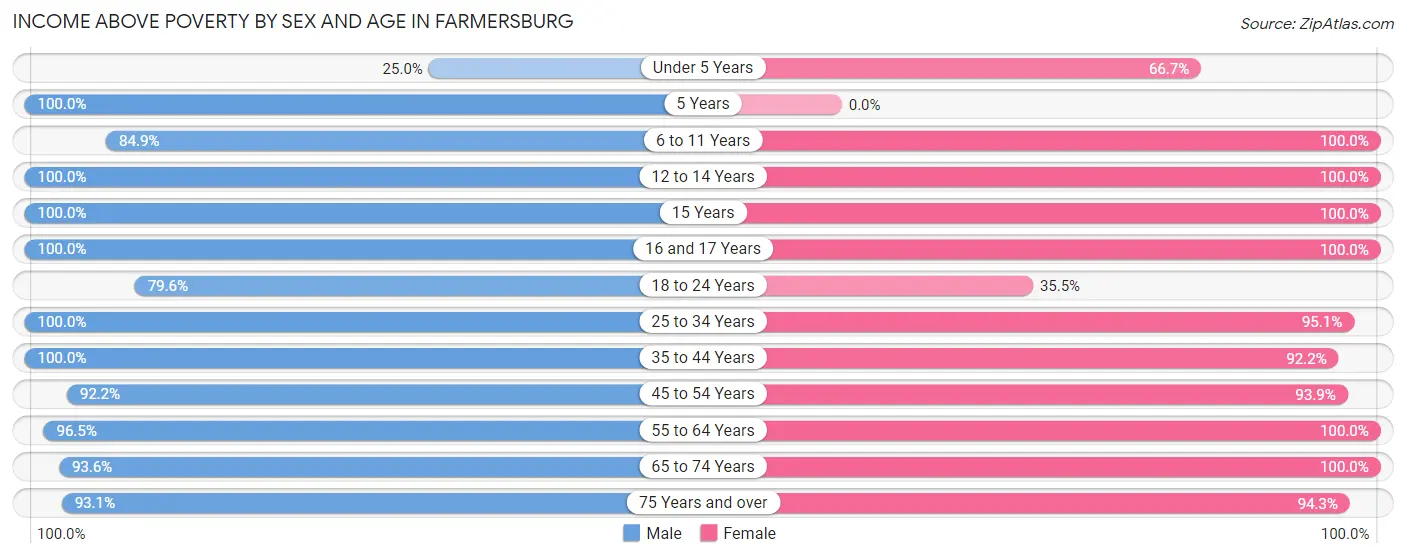
| Age Bracket | Male | Female |
| Under 5 Years | 3 (25.0%) | 24 (66.7%) |
| 5 Years | 27 (100.0%) | 0 (0.0%) |
| 6 to 11 Years | 28 (84.9%) | 19 (100.0%) |
| 12 to 14 Years | 42 (100.0%) | 8 (100.0%) |
| 15 Years | 3 (100.0%) | 9 (100.0%) |
| 16 and 17 Years | 12 (100.0%) | 18 (100.0%) |
| 18 to 24 Years | 70 (79.5%) | 11 (35.5%) |
| 25 to 34 Years | 57 (100.0%) | 77 (95.1%) |
| 35 to 44 Years | 97 (100.0%) | 59 (92.2%) |
| 45 to 54 Years | 47 (92.2%) | 46 (93.9%) |
| 55 to 64 Years | 82 (96.5%) | 130 (100.0%) |
| 65 to 74 Years | 44 (93.6%) | 47 (100.0%) |
| 75 Years and over | 54 (93.1%) | 99 (94.3%) |
| Total | 566 (92.5%) | 547 (91.6%) |
Income Below Poverty Among Married-Couple Families in Farmersburg
The poverty statistics for married-couple families in Farmersburg show that 0.9% or 3 of the total 327 families live below the poverty line. Families with 1 or 2 children have the highest poverty rate of 2.8%, comprising of 3 families. On the other hand, families with no children have the lowest poverty rate of 0.0%, which includes 0 families.
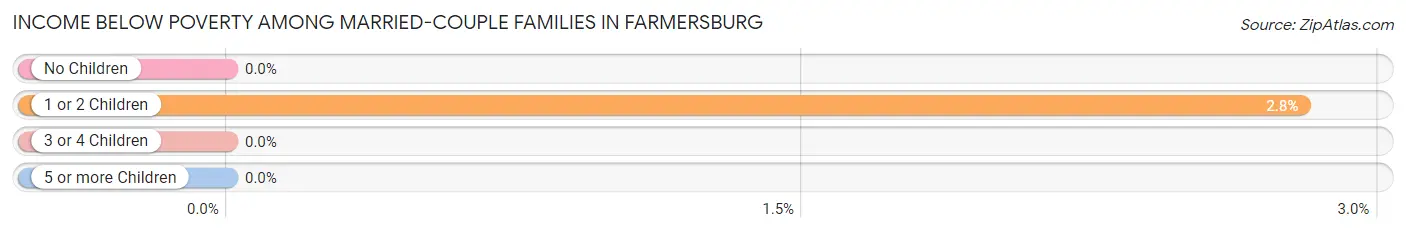
| Children | Above Poverty | Below Poverty |
| No Children | 210 (100.0%) | 0 (0.0%) |
| 1 or 2 Children | 104 (97.2%) | 3 (2.8%) |
| 3 or 4 Children | 10 (100.0%) | 0 (0.0%) |
| 5 or more Children | 0 (0.0%) | 0 (0.0%) |
| Total | 324 (99.1%) | 3 (0.9%) |
Income Below Poverty Among Single-Parent Households in Farmersburg
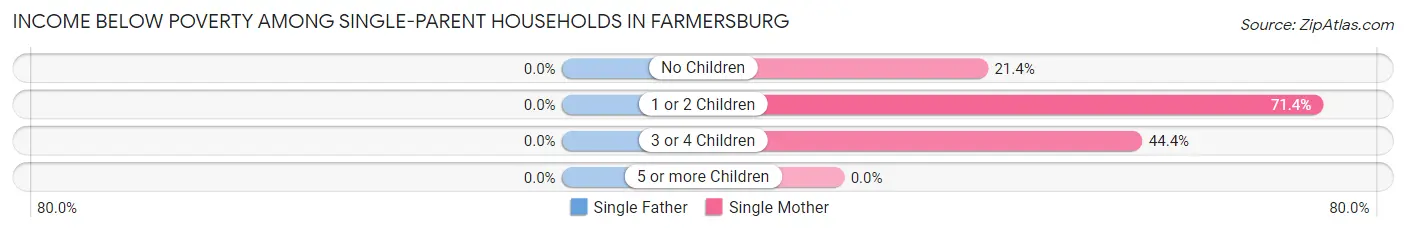
| Children | Single Father | Single Mother |
| No Children | 0 (0.0%) | 3 (21.4%) |
| 1 or 2 Children | 0 (0.0%) | 15 (71.4%) |
| 3 or 4 Children | 0 (0.0%) | 4 (44.4%) |
| 5 or more Children | 0 (0.0%) | 0 (0.0%) |
| Total | 0 (0.0%) | 22 (50.0%) |
Income Below Poverty Among Married-Couple vs Single-Parent Households in Farmersburg
The poverty data for Farmersburg shows that 3 of the married-couple family households (0.9%) and 22 of the single-parent households (43.1%) are living below the poverty level. Within the married-couple family households, those with 1 or 2 children have the highest poverty rate, with 3 households (2.8%) falling below the poverty line. Among the single-parent households, those with 1 or 2 children have the highest poverty rate, with 15 household (65.2%) living below poverty.
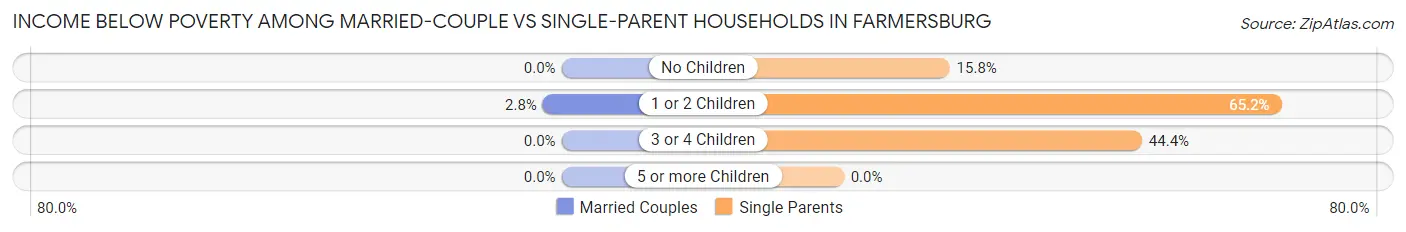
| Children | Married-Couple Families | Single-Parent Households |
| No Children | 0 (0.0%) | 3 (15.8%) |
| 1 or 2 Children | 3 (2.8%) | 15 (65.2%) |
| 3 or 4 Children | 0 (0.0%) | 4 (44.4%) |
| 5 or more Children | 0 (0.0%) | 0 (0.0%) |
| Total | 3 (0.9%) | 22 (43.1%) |
Race in Farmersburg
The most populous races in Farmersburg are White / Caucasian (1,195 | 97.6%), Two or more Races (21 | 1.7%), and Black / African American (8 | 0.6%).
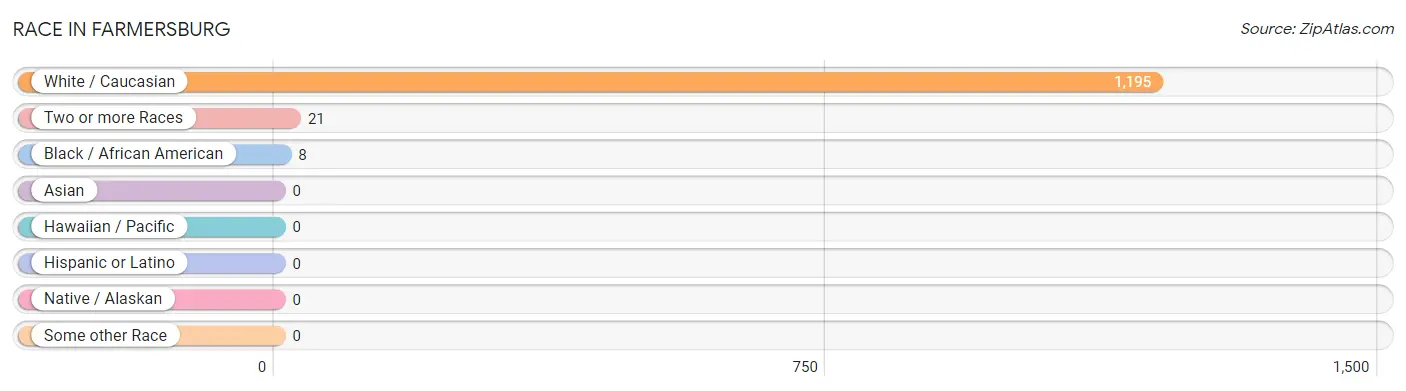
| Race | # Population | % Population |
| Asian | 0 | 0.0% |
| Black / African American | 8 | 0.6% |
| Hawaiian / Pacific | 0 | 0.0% |
| Hispanic or Latino | 0 | 0.0% |
| Native / Alaskan | 0 | 0.0% |
| White / Caucasian | 1,195 | 97.6% |
| Two or more Races | 21 | 1.7% |
| Some other Race | 0 | 0.0% |
| Total | 1,224 | 100.0% |
Ancestry in Farmersburg
The most populous ancestries reported in Farmersburg are German (199 | 16.3%), American (190 | 15.5%), English (134 | 11.0%), Irish (131 | 10.7%), and European (124 | 10.1%), together accounting for 63.6% of all Farmersburg residents.
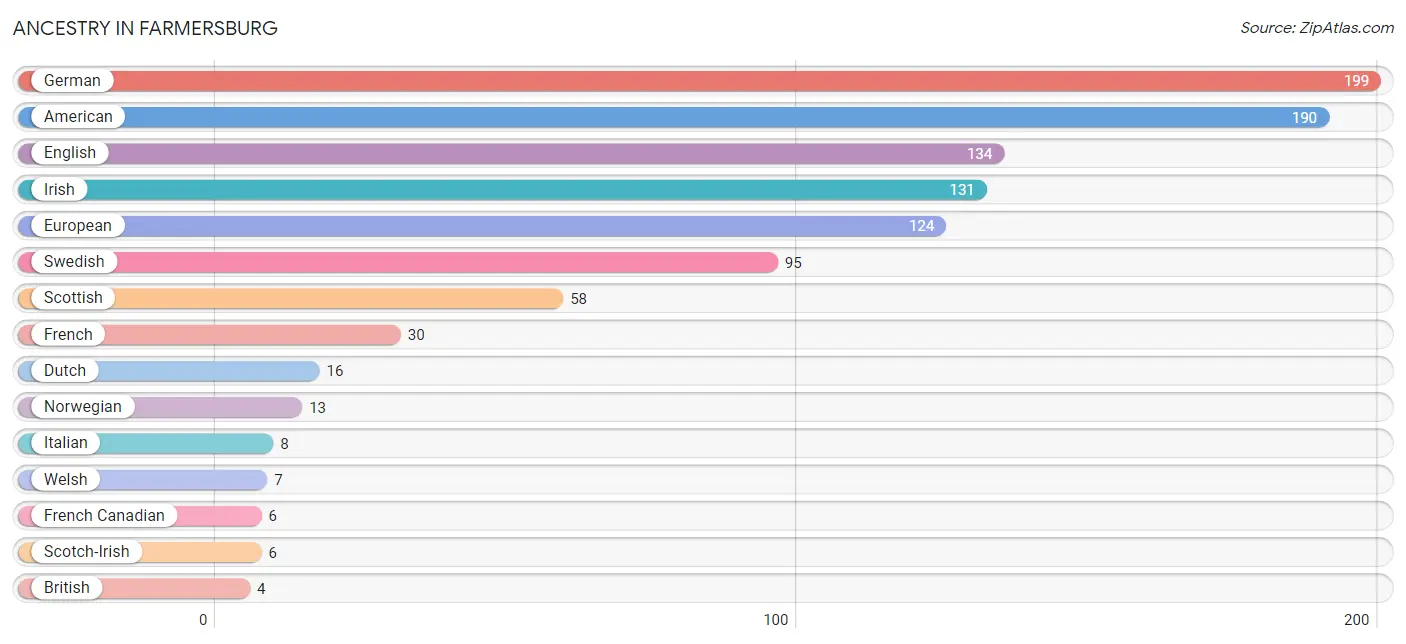
| Ancestry | # Population | % Population |
| American | 190 | 15.5% |
| Arab | 3 | 0.3% |
| British | 4 | 0.3% |
| Canadian | 4 | 0.3% |
| Dutch | 16 | 1.3% |
| English | 134 | 11.0% |
| European | 124 | 10.1% |
| French | 30 | 2.5% |
| French Canadian | 6 | 0.5% |
| German | 199 | 16.3% |
| Irish | 131 | 10.7% |
| Italian | 8 | 0.6% |
| Norwegian | 13 | 1.1% |
| Scotch-Irish | 6 | 0.5% |
| Scottish | 58 | 4.7% |
| Serbian | 3 | 0.3% |
| Slovak | 4 | 0.3% |
| Swedish | 95 | 7.8% |
| Welsh | 7 | 0.6% | View All 19 Rows |
Immigrants in Farmersburg
The most numerous immigrant groups reported in Farmersburg came from , and Canada (4 | 0.3%), together accounting for 0.3% of all Farmersburg residents.

| Immigration Origin | # Population | % Population |
| Canada | 4 | 0.3% | View All 1 Rows |
Sex and Age in Farmersburg
Sex and Age in Farmersburg
The most populous age groups in Farmersburg are 15 to 19 Years (84 | 13.4%) for men and 60 to 64 Years (70 | 11.7%) for women.
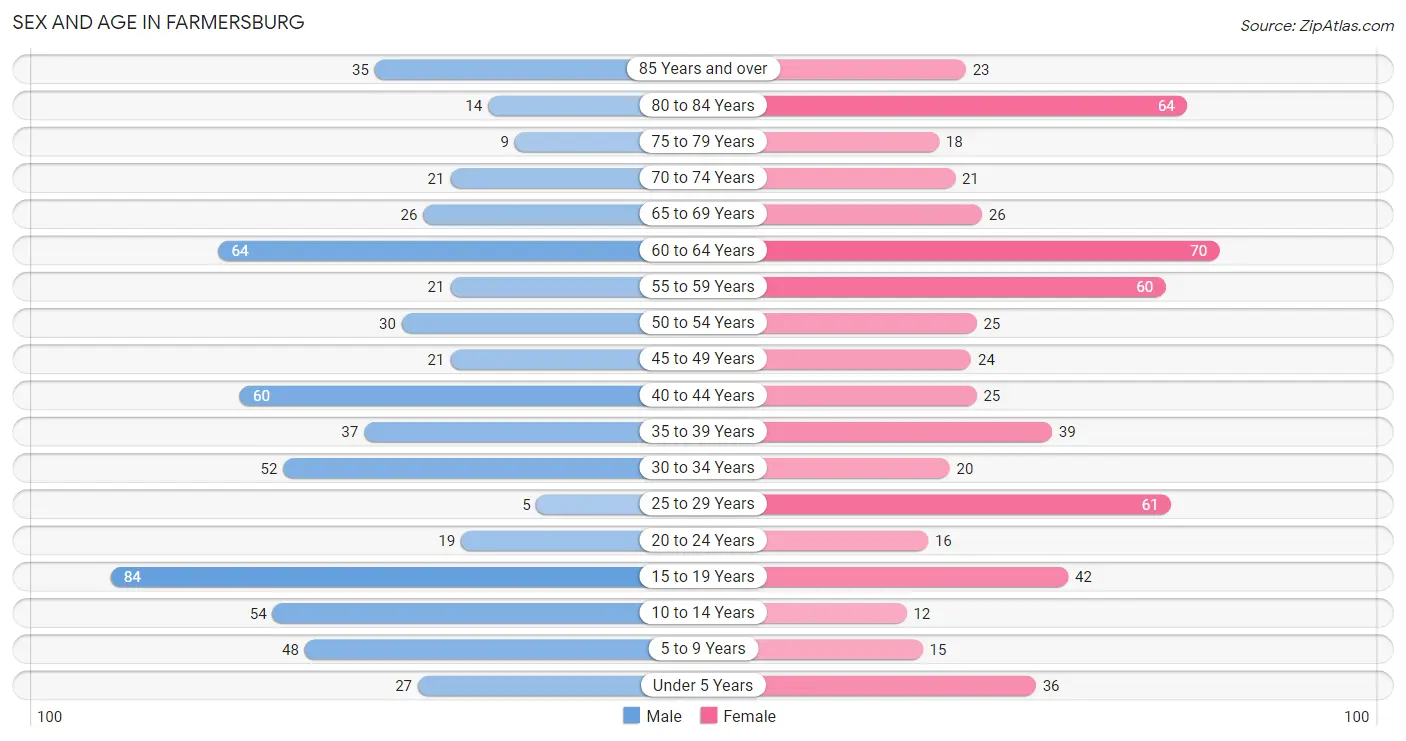
| Age Bracket | Male | Female |
| Under 5 Years | 27 (4.3%) | 36 (6.0%) |
| 5 to 9 Years | 48 (7.7%) | 15 (2.5%) |
| 10 to 14 Years | 54 (8.6%) | 12 (2.0%) |
| 15 to 19 Years | 84 (13.4%) | 42 (7.0%) |
| 20 to 24 Years | 19 (3.0%) | 16 (2.7%) |
| 25 to 29 Years | 5 (0.8%) | 61 (10.2%) |
| 30 to 34 Years | 52 (8.3%) | 20 (3.4%) |
| 35 to 39 Years | 37 (5.9%) | 39 (6.5%) |
| 40 to 44 Years | 60 (9.6%) | 25 (4.2%) |
| 45 to 49 Years | 21 (3.4%) | 24 (4.0%) |
| 50 to 54 Years | 30 (4.8%) | 25 (4.2%) |
| 55 to 59 Years | 21 (3.4%) | 60 (10.1%) |
| 60 to 64 Years | 64 (10.2%) | 70 (11.7%) |
| 65 to 69 Years | 26 (4.2%) | 26 (4.4%) |
| 70 to 74 Years | 21 (3.4%) | 21 (3.5%) |
| 75 to 79 Years | 9 (1.4%) | 18 (3.0%) |
| 80 to 84 Years | 14 (2.2%) | 64 (10.7%) |
| 85 Years and over | 35 (5.6%) | 23 (3.8%) |
| Total | 627 (100.0%) | 597 (100.0%) |
Families and Households in Farmersburg
Median Family Size in Farmersburg
The median family size in Farmersburg is 2.80 persons per family, with single female/mother families (44 | 11.6%) accounting for the largest median family size of 2.93 persons per family. On the other hand, single male/father families (7 | 1.8%) represent the smallest median family size with 2.29 persons per family.
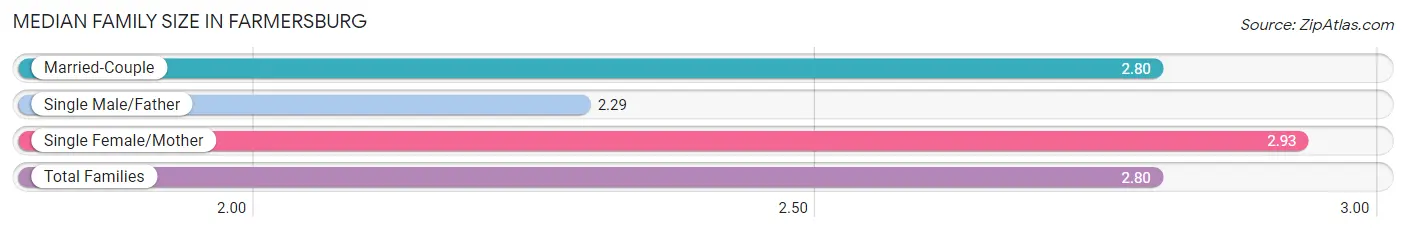
| Family Type | # Families | Family Size |
| Married-Couple | 327 (86.5%) | 2.80 |
| Single Male/Father | 7 (1.8%) | 2.29 |
| Single Female/Mother | 44 (11.6%) | 2.93 |
| Total Families | 378 (100.0%) | 2.80 |
Median Household Size in Farmersburg
The median household size in Farmersburg is 2.54 persons per household, with single female/mother households (44 | 9.1%) accounting for the largest median household size of 3.34 persons per household. non-family households (104 | 21.6%) represent the smallest median household size with 1.24 persons per household.
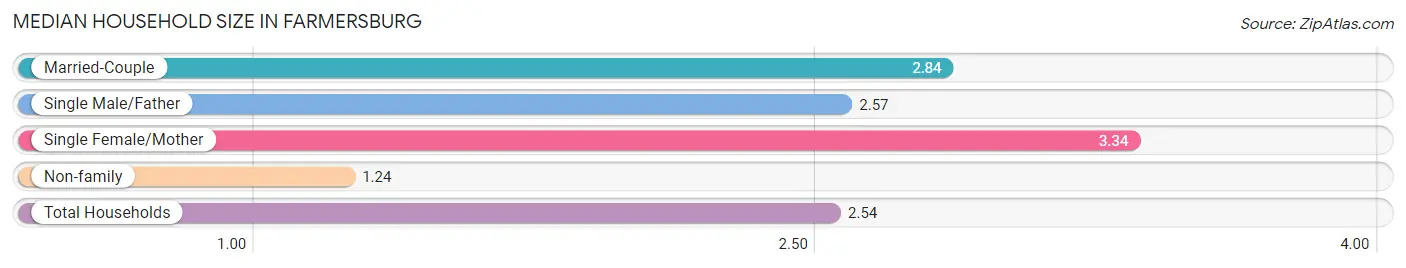
| Household Type | # Households | Household Size |
| Married-Couple | 327 (67.8%) | 2.84 |
| Single Male/Father | 7 (1.5%) | 2.57 |
| Single Female/Mother | 44 (9.1%) | 3.34 |
| Non-family | 104 (21.6%) | 1.24 |
| Total Households | 482 (100.0%) | 2.54 |
Household Size by Marriage Status in Farmersburg
Out of a total of 482 households in Farmersburg, 378 (78.4%) are family households, while 104 (21.6%) are nonfamily households. The most numerous type of family households are 2-person households, comprising 167, and the most common type of nonfamily households are 1-person households, comprising 81.
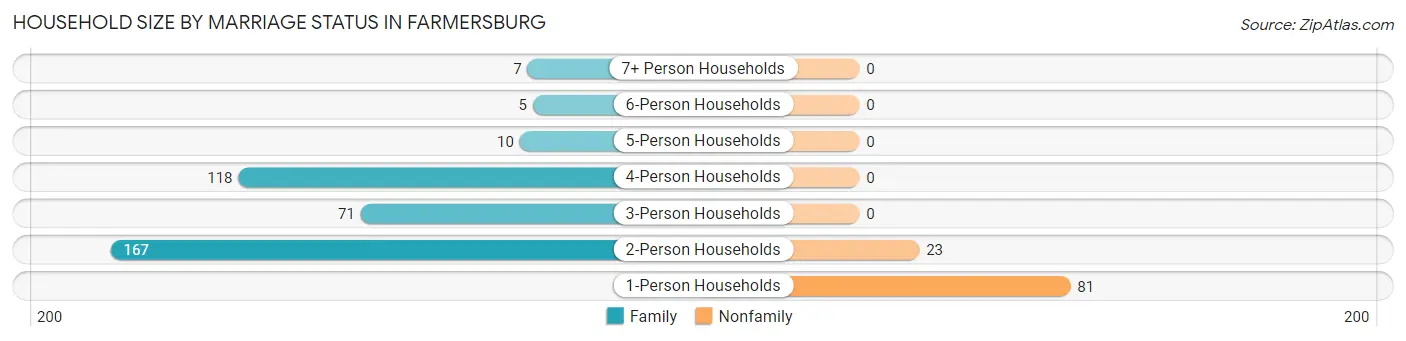
| Household Size | Family Households | Nonfamily Households |
| 1-Person Households | - | 81 (16.8%) |
| 2-Person Households | 167 (34.6%) | 23 (4.8%) |
| 3-Person Households | 71 (14.7%) | 0 (0.0%) |
| 4-Person Households | 118 (24.5%) | 0 (0.0%) |
| 5-Person Households | 10 (2.1%) | 0 (0.0%) |
| 6-Person Households | 5 (1.0%) | 0 (0.0%) |
| 7+ Person Households | 7 (1.5%) | 0 (0.0%) |
| Total | 378 (78.4%) | 104 (21.6%) |
Female Fertility in Farmersburg
Fertility by Age in Farmersburg
Average fertility rate in Farmersburg is 81.0 births per 1,000 women. Women in the age bracket of 15 to 19 years have the highest fertility rate with 214.0 births per 1,000 women. Women in the age bracket of 20 to 34 years acount for 52.6% of all women with births.
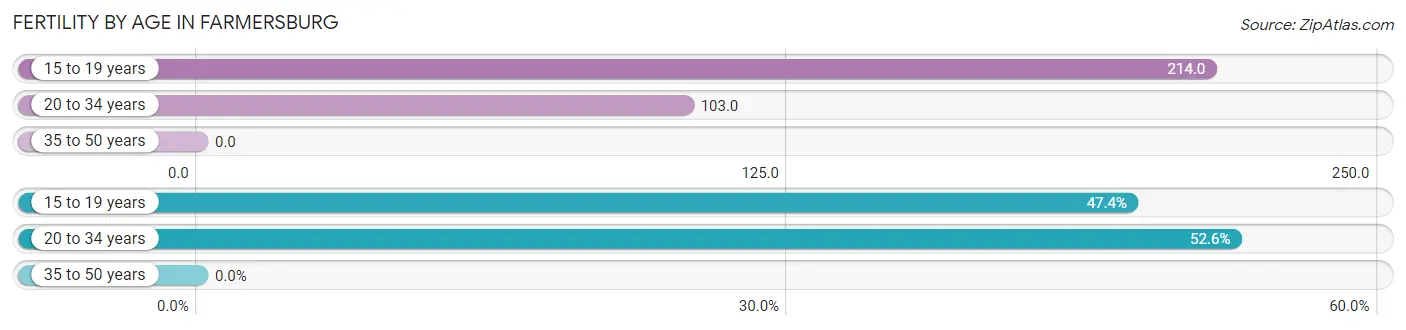
| Age Bracket | Women with Births | Births / 1,000 Women |
| 15 to 19 years | 9 (47.4%) | 214.0 |
| 20 to 34 years | 10 (52.6%) | 103.0 |
| 35 to 50 years | 0 (0.0%) | 0.0 |
| Total | 19 (100.0%) | 81.0 |
Fertility by Age by Marriage Status in Farmersburg
10.5% of women with births (19) in Farmersburg are married. The highest percentage of unmarried women with births falls into 20 to 34 years age bracket with 100.0% of them unmarried at the time of birth, while the lowest percentage of unmarried women with births belong to 15 to 19 years age bracket with 77.8% of them unmarried.
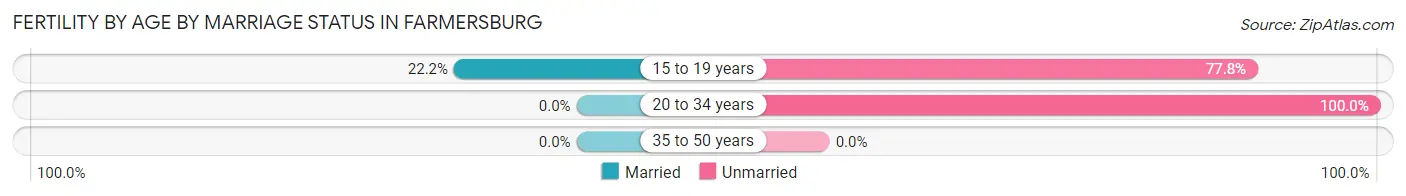
| Age Bracket | Married | Unmarried |
| 15 to 19 years | 2 (22.2%) | 7 (77.8%) |
| 20 to 34 years | 0 (0.0%) | 10 (100.0%) |
| 35 to 50 years | 0 (0.0%) | 0 (0.0%) |
| Total | 2 (10.5%) | 17 (89.5%) |
Fertility by Education in Farmersburg
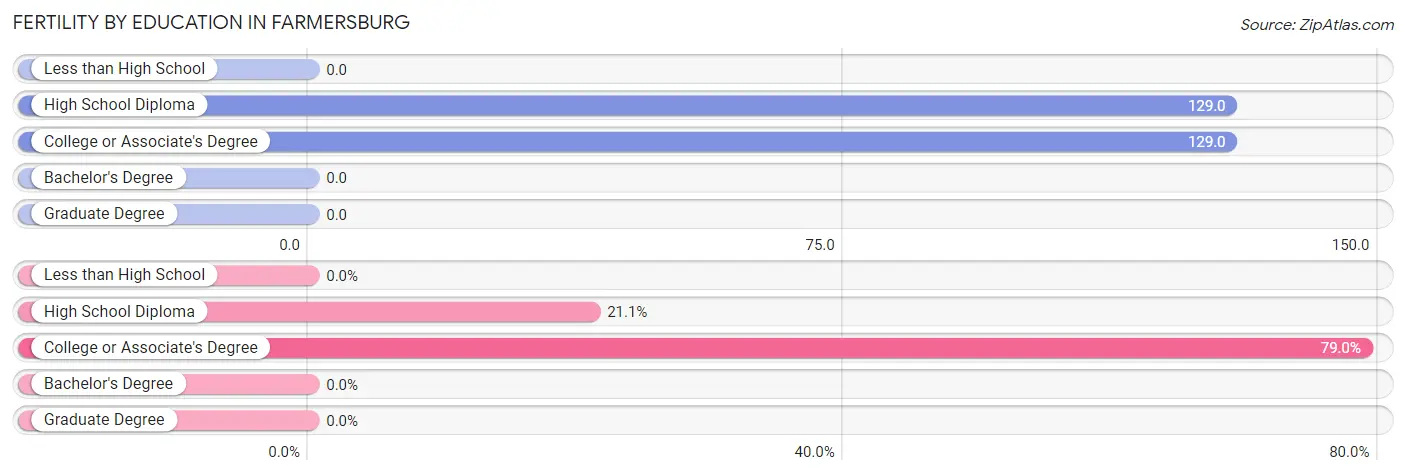
| Educational Attainment | Women with Births | Births / 1,000 Women |
| Less than High School | 0 (0.0%) | 0.0 |
| High School Diploma | 4 (21.0%) | 129.0 |
| College or Associate's Degree | 15 (78.9%) | 129.0 |
| Bachelor's Degree | 0 (0.0%) | 0.0 |
| Graduate Degree | 0 (0.0%) | 0.0 |
| Total | 19 (100.0%) | 81.0 |
Fertility by Education by Marriage Status in Farmersburg
89.5% of women with births in Farmersburg are unmarried. Women with the educational attainment of high school diploma are most likely to be married with 50.0% of them married at childbirth, while women with the educational attainment of college or associate's degree are least likely to be married with 100.0% of them unmarried at childbirth.
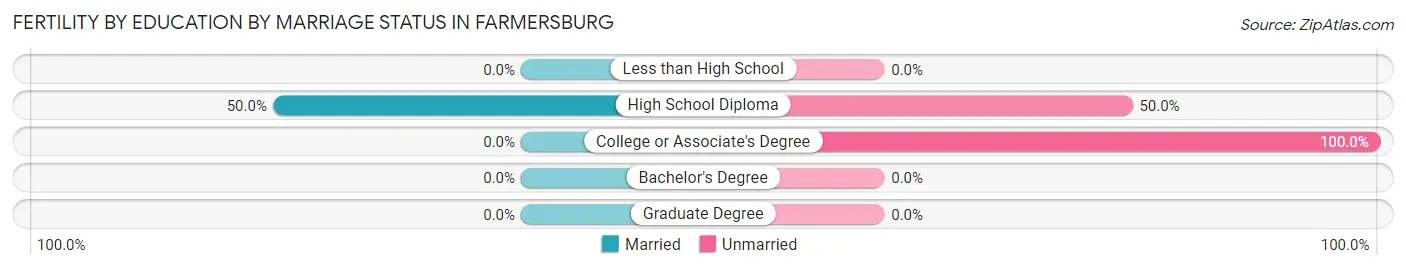
| Educational Attainment | Married | Unmarried |
| Less than High School | 0 (0.0%) | 0 (0.0%) |
| High School Diploma | 2 (50.0%) | 2 (50.0%) |
| College or Associate's Degree | 0 (0.0%) | 15 (100.0%) |
| Bachelor's Degree | 0 (0.0%) | 0 (0.0%) |
| Graduate Degree | 0 (0.0%) | 0 (0.0%) |
| Total | 2 (10.5%) | 17 (89.5%) |
Employment Characteristics in Farmersburg
Employment by Class of Employer in Farmersburg
Among the 520 employed individuals in Farmersburg, private company employees (333 | 64.0%), state government employees (48 | 9.2%), and self-employed (not incorporated) (45 | 8.6%) make up the most common classes of employment.
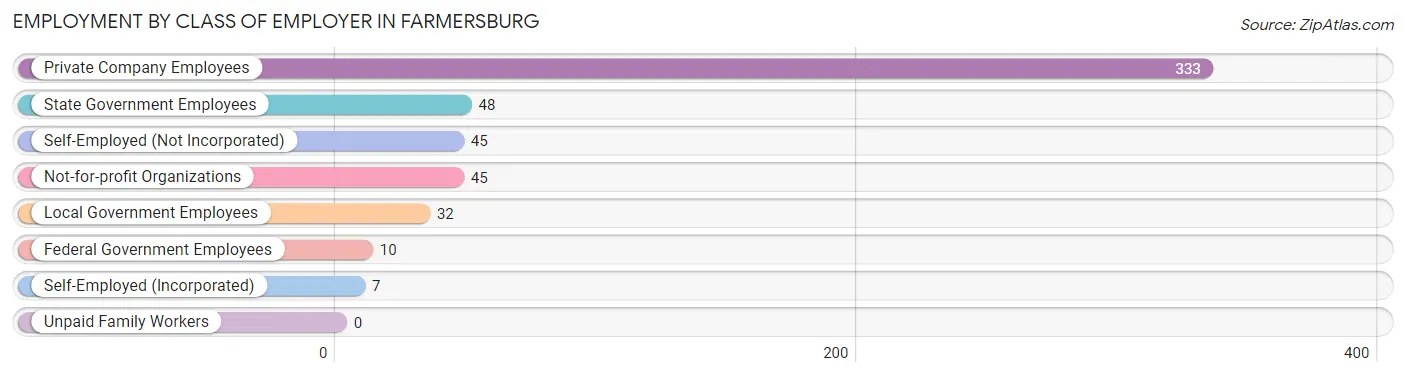
| Employer Class | # Employees | % Employees |
| Private Company Employees | 333 | 64.0% |
| Self-Employed (Incorporated) | 7 | 1.3% |
| Self-Employed (Not Incorporated) | 45 | 8.6% |
| Not-for-profit Organizations | 45 | 8.6% |
| Local Government Employees | 32 | 6.1% |
| State Government Employees | 48 | 9.2% |
| Federal Government Employees | 10 | 1.9% |
| Unpaid Family Workers | 0 | 0.0% |
| Total | 520 | 100.0% |
Employment Status by Age in Farmersburg
According to the labor force statistics for Farmersburg, out of the total population over 16 years of age (1,020), 52.4% or 534 individuals are in the labor force, with 1.7% or 9 of them unemployed. The age group with the highest labor force participation rate is 30 to 34 years, with 100.0% or 72 individuals in the labor force. Within the labor force, the 16 to 19 years age range has the highest percentage of unemployed individuals, with 17.1% or 7 of them being unemployed.
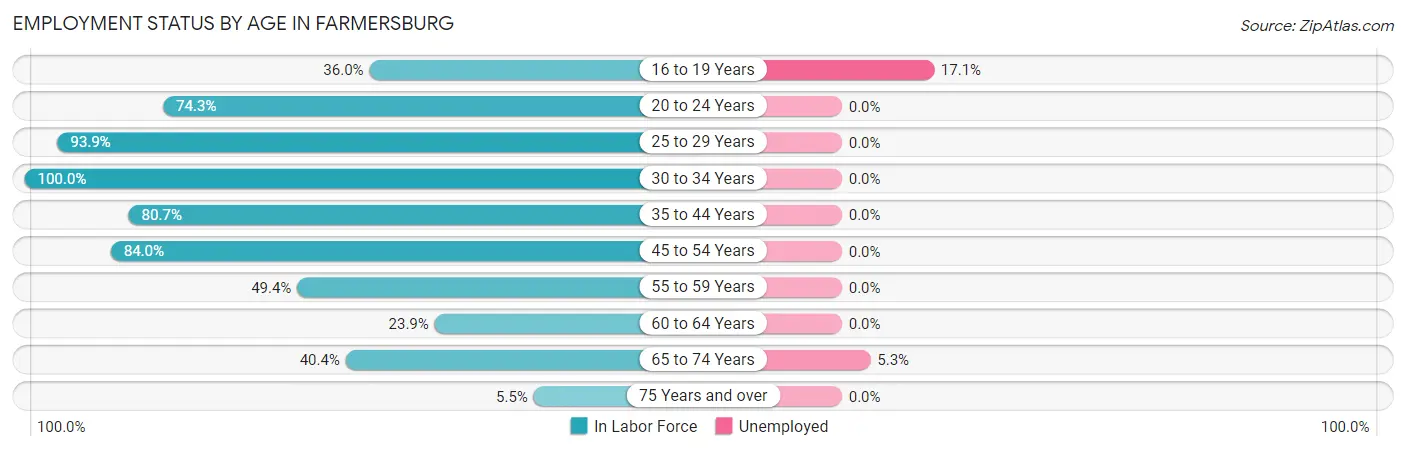
| Age Bracket | In Labor Force | Unemployed |
| 16 to 19 Years | 41 (36.0%) | 7 (17.1%) |
| 20 to 24 Years | 26 (74.3%) | 0 (0.0%) |
| 25 to 29 Years | 62 (93.9%) | 0 (0.0%) |
| 30 to 34 Years | 72 (100.0%) | 0 (0.0%) |
| 35 to 44 Years | 130 (80.7%) | 0 (0.0%) |
| 45 to 54 Years | 84 (84.0%) | 0 (0.0%) |
| 55 to 59 Years | 40 (49.4%) | 0 (0.0%) |
| 60 to 64 Years | 32 (23.9%) | 0 (0.0%) |
| 65 to 74 Years | 38 (40.4%) | 2 (5.3%) |
| 75 Years and over | 9 (5.5%) | 0 (0.0%) |
| Total | 534 (52.4%) | 9 (1.7%) |
Employment Status by Educational Attainment in Farmersburg
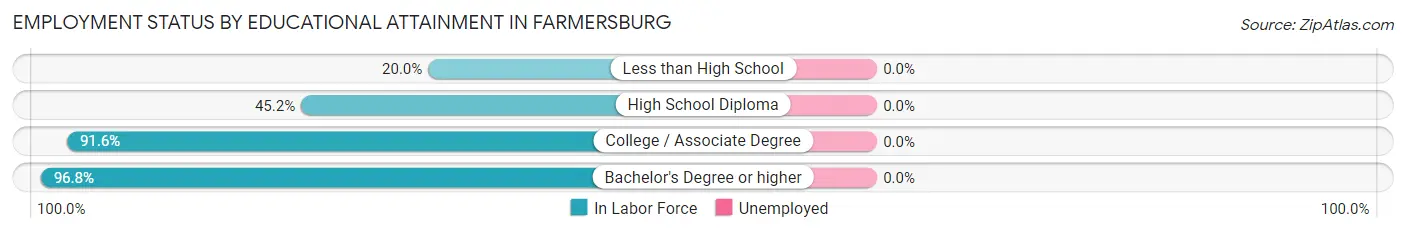
| Educational Attainment | In Labor Force | Unemployed |
| Less than High School | 13 (20.0%) | 0 (0.0%) |
| High School Diploma | 98 (45.2%) | 0 (0.0%) |
| College / Associate Degree | 218 (91.6%) | 0 (0.0%) |
| Bachelor's Degree or higher | 91 (96.8%) | 0 (0.0%) |
| Total | 420 (68.4%) | 0 (0.0%) |
Employment Occupations by Sex in Farmersburg
Management, Business, Science and Arts Occupations
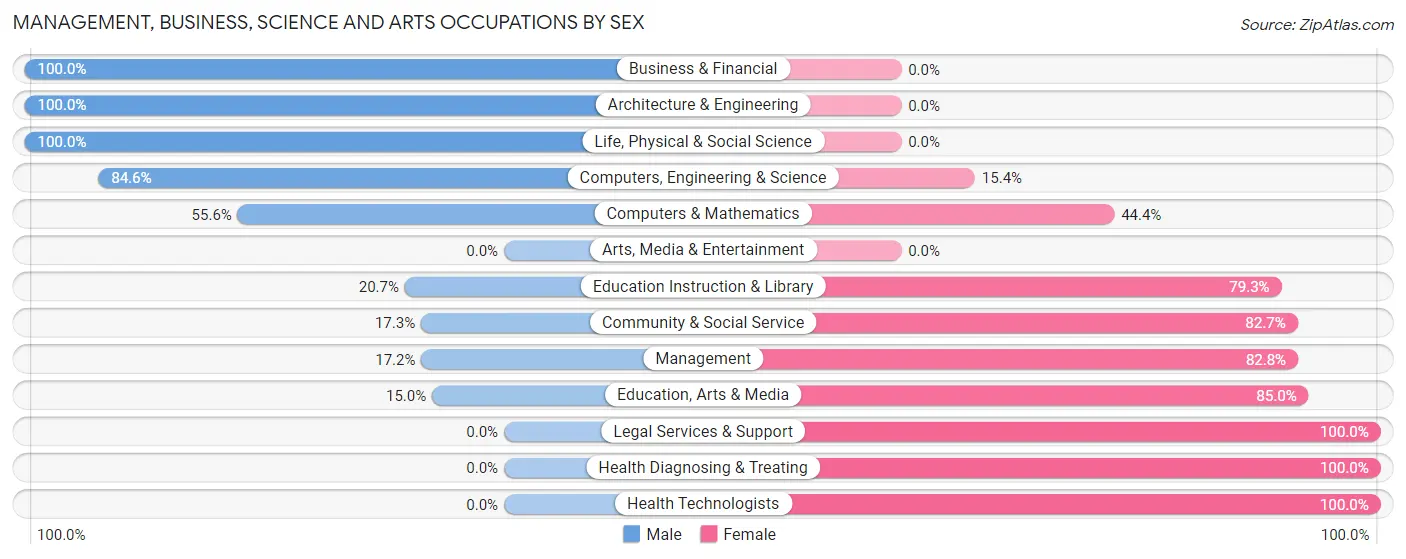
The most common Management, Business, Science and Arts occupations in Farmersburg are Community & Social Service (52 | 9.9%), Management (29 | 5.5%), Education Instruction & Library (29 | 5.5%), Computers, Engineering & Science (26 | 5.0%), and Education, Arts & Media (20 | 3.8%).
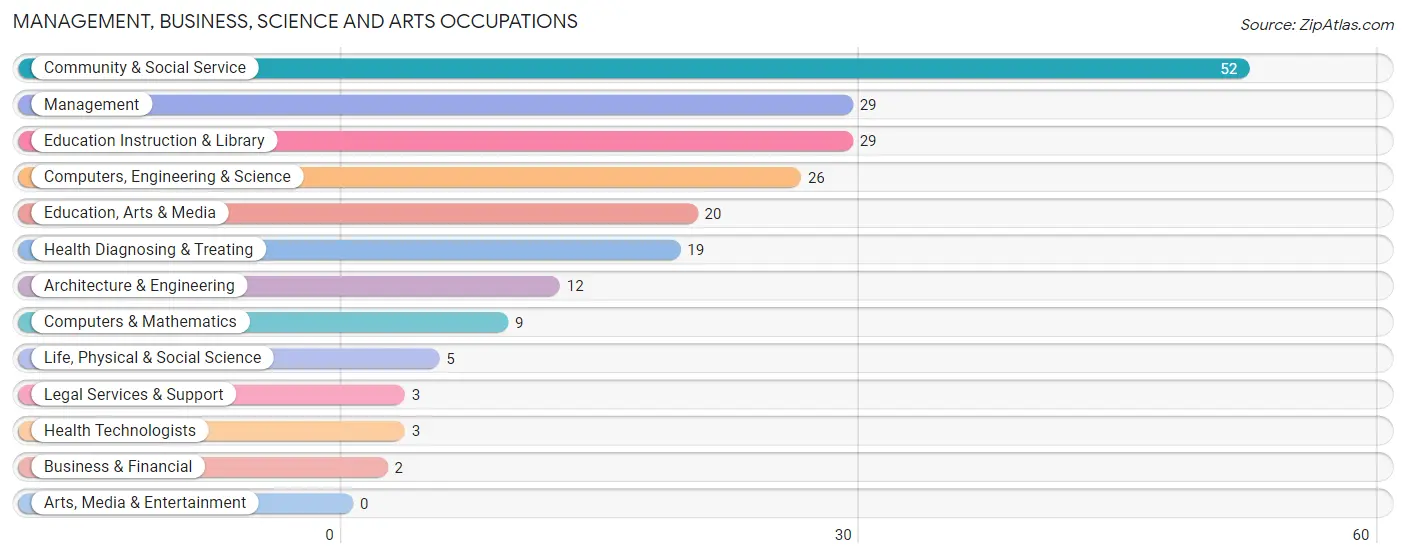
Management, Business, Science and Arts Occupations by Sex
Within the Management, Business, Science and Arts occupations in Farmersburg, the most male-oriented occupations are Business & Financial (100.0%), Architecture & Engineering (100.0%), and Life, Physical & Social Science (100.0%), while the most female-oriented occupations are Legal Services & Support (100.0%), Health Diagnosing & Treating (100.0%), and Health Technologists (100.0%).
| Occupation | Male | Female |
| Management | 5 (17.2%) | 24 (82.8%) |
| Business & Financial | 2 (100.0%) | 0 (0.0%) |
| Computers, Engineering & Science | 22 (84.6%) | 4 (15.4%) |
| Computers & Mathematics | 5 (55.6%) | 4 (44.4%) |
| Architecture & Engineering | 12 (100.0%) | 0 (0.0%) |
| Life, Physical & Social Science | 5 (100.0%) | 0 (0.0%) |
| Community & Social Service | 9 (17.3%) | 43 (82.7%) |
| Education, Arts & Media | 3 (15.0%) | 17 (85.0%) |
| Legal Services & Support | 0 (0.0%) | 3 (100.0%) |
| Education Instruction & Library | 6 (20.7%) | 23 (79.3%) |
| Arts, Media & Entertainment | 0 (0.0%) | 0 (0.0%) |
| Health Diagnosing & Treating | 0 (0.0%) | 19 (100.0%) |
| Health Technologists | 0 (0.0%) | 3 (100.0%) |
| Total (Category) | 38 (29.7%) | 90 (70.3%) |
| Total (Overall) | 277 (52.8%) | 248 (47.2%) |
Services Occupations
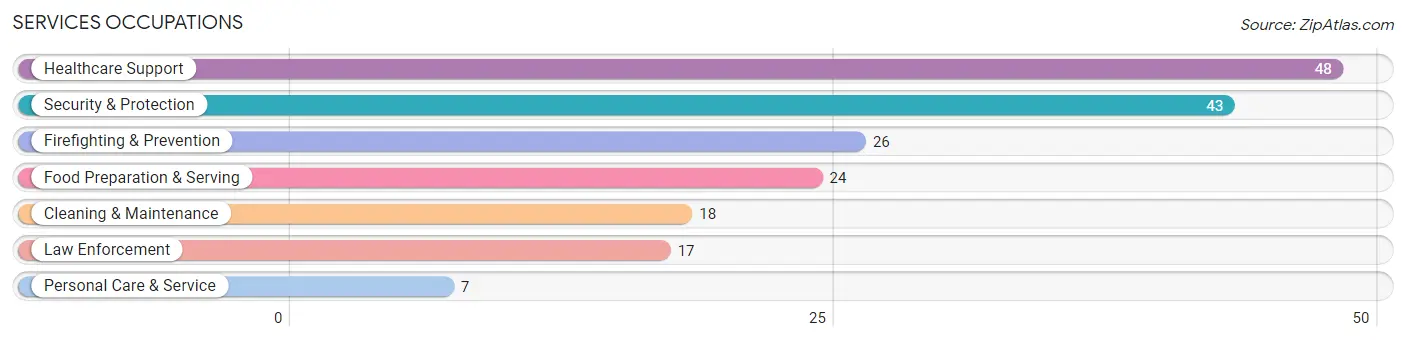
The most common Services occupations in Farmersburg are Healthcare Support (48 | 9.1%), Security & Protection (43 | 8.2%), Firefighting & Prevention (26 | 5.0%), Food Preparation & Serving (24 | 4.6%), and Cleaning & Maintenance (18 | 3.4%).
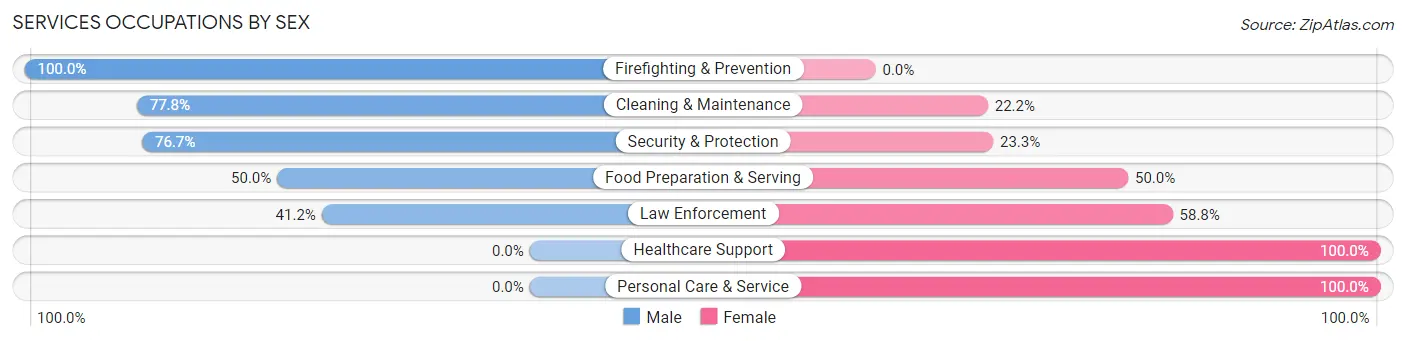
Services Occupations by Sex
Within the Services occupations in Farmersburg, the most male-oriented occupations are Firefighting & Prevention (100.0%), Cleaning & Maintenance (77.8%), and Security & Protection (76.7%), while the most female-oriented occupations are Healthcare Support (100.0%), Personal Care & Service (100.0%), and Law Enforcement (58.8%).
| Occupation | Male | Female |
| Healthcare Support | 0 (0.0%) | 48 (100.0%) |
| Security & Protection | 33 (76.7%) | 10 (23.3%) |
| Firefighting & Prevention | 26 (100.0%) | 0 (0.0%) |
| Law Enforcement | 7 (41.2%) | 10 (58.8%) |
| Food Preparation & Serving | 12 (50.0%) | 12 (50.0%) |
| Cleaning & Maintenance | 14 (77.8%) | 4 (22.2%) |
| Personal Care & Service | 0 (0.0%) | 7 (100.0%) |
| Total (Category) | 59 (42.1%) | 81 (57.9%) |
| Total (Overall) | 277 (52.8%) | 248 (47.2%) |
Sales and Office Occupations
The most common Sales and Office occupations in Farmersburg are Office & Administration (61 | 11.6%), and Sales & Related (50 | 9.5%).

Sales and Office Occupations by Sex

| Occupation | Male | Female |
| Sales & Related | 32 (64.0%) | 18 (36.0%) |
| Office & Administration | 7 (11.5%) | 54 (88.5%) |
| Total (Category) | 39 (35.1%) | 72 (64.9%) |
| Total (Overall) | 277 (52.8%) | 248 (47.2%) |
Natural Resources, Construction and Maintenance Occupations
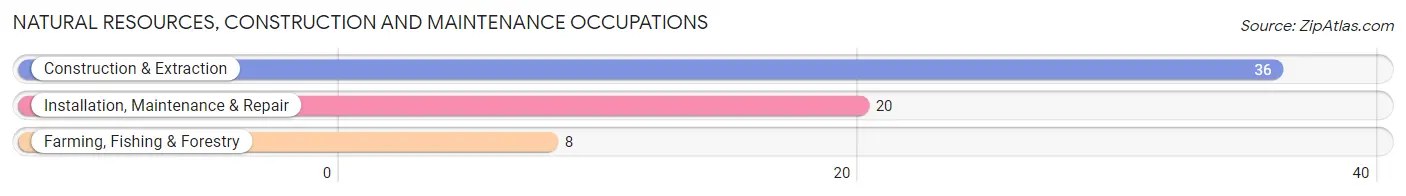
The most common Natural Resources, Construction and Maintenance occupations in Farmersburg are Construction & Extraction (36 | 6.9%), Installation, Maintenance & Repair (20 | 3.8%), and Farming, Fishing & Forestry (8 | 1.5%).
Natural Resources, Construction and Maintenance Occupations by Sex
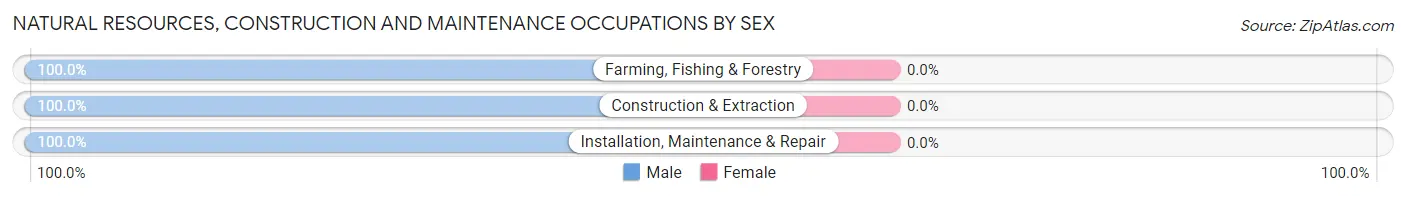
| Occupation | Male | Female |
| Farming, Fishing & Forestry | 8 (100.0%) | 0 (0.0%) |
| Construction & Extraction | 36 (100.0%) | 0 (0.0%) |
| Installation, Maintenance & Repair | 20 (100.0%) | 0 (0.0%) |
| Total (Category) | 64 (100.0%) | 0 (0.0%) |
| Total (Overall) | 277 (52.8%) | 248 (47.2%) |
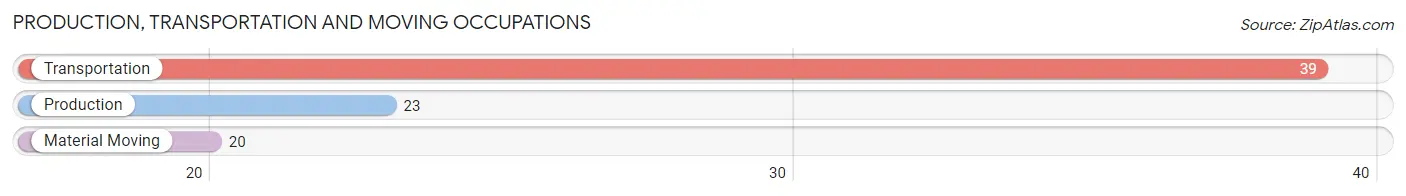
Production, Transportation and Moving Occupations
The most common Production, Transportation and Moving occupations in Farmersburg are Transportation (39 | 7.4%), Production (23 | 4.4%), and Material Moving (20 | 3.8%).
Production, Transportation and Moving Occupations by Sex
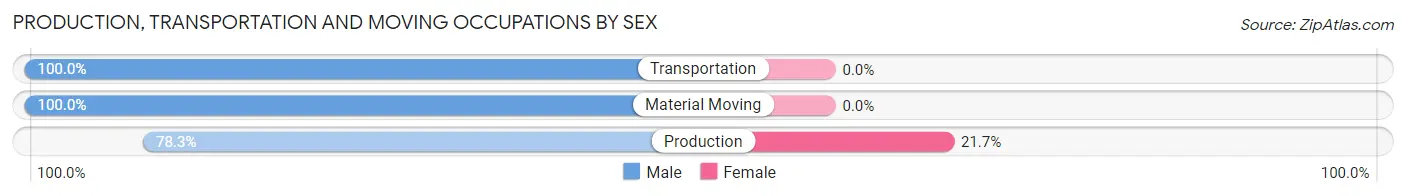
| Occupation | Male | Female |
| Production | 18 (78.3%) | 5 (21.7%) |
| Transportation | 39 (100.0%) | 0 (0.0%) |
| Material Moving | 20 (100.0%) | 0 (0.0%) |
| Total (Category) | 77 (93.9%) | 5 (6.1%) |
| Total (Overall) | 277 (52.8%) | 248 (47.2%) |
Employment Industries by Sex in Farmersburg
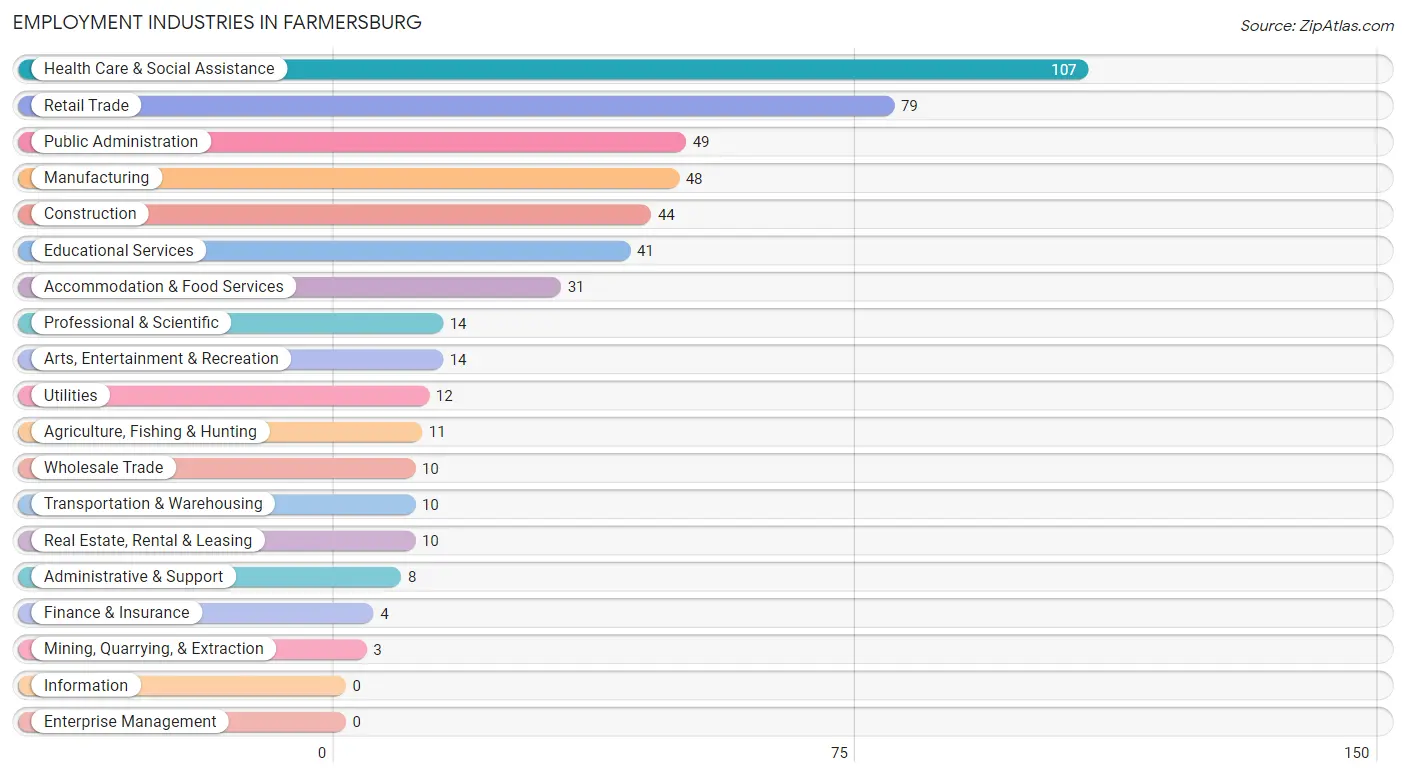
Employment Industries in Farmersburg
The major employment industries in Farmersburg include Health Care & Social Assistance (107 | 20.4%), Retail Trade (79 | 15.0%), Public Administration (49 | 9.3%), Manufacturing (48 | 9.1%), and Construction (44 | 8.4%).
Employment Industries by Sex in Farmersburg
The Farmersburg industries that see more men than women are Agriculture, Fishing & Hunting (100.0%), Mining, Quarrying, & Extraction (100.0%), and Construction (100.0%), whereas the industries that tend to have a higher number of women are Finance & Insurance (100.0%), Health Care & Social Assistance (100.0%), and Accommodation & Food Services (71.0%).
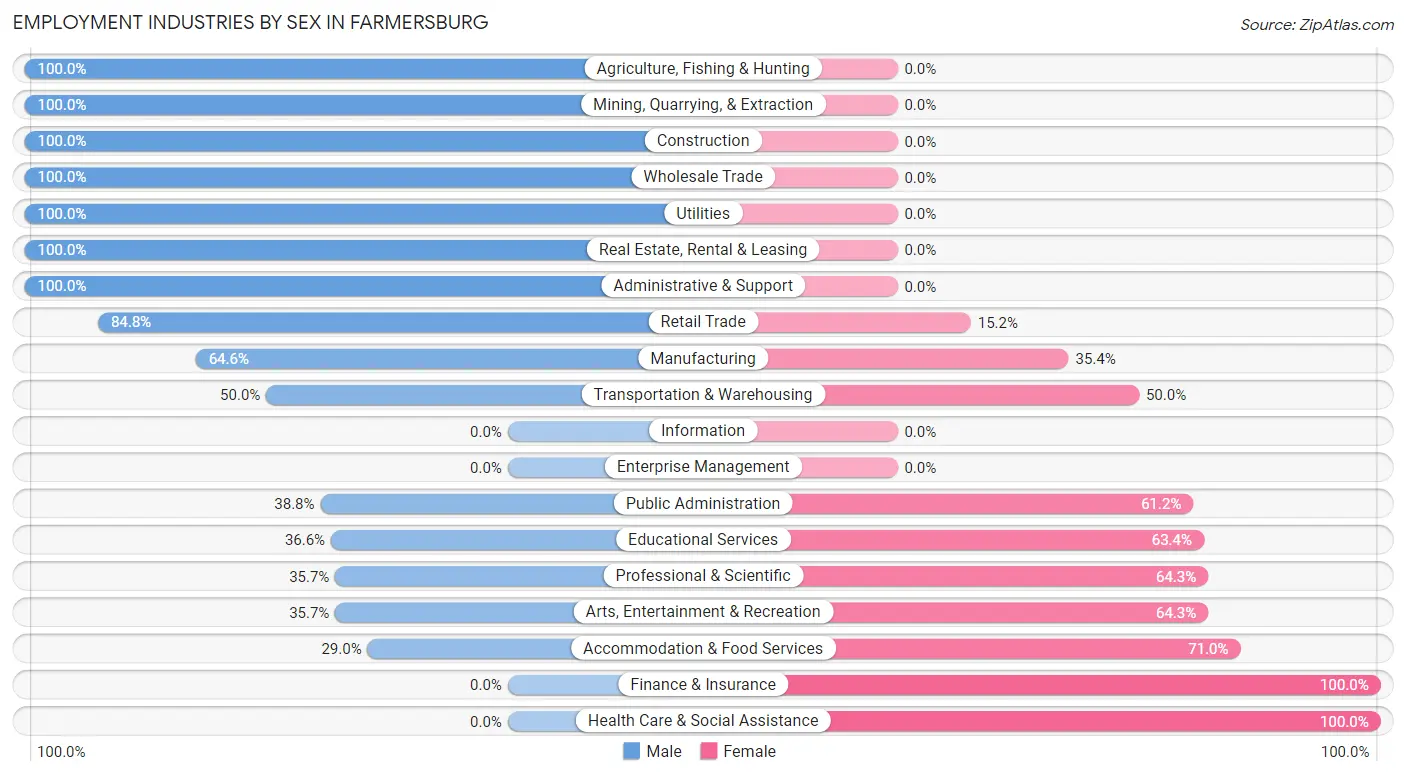
| Industry | Male | Female |
| Agriculture, Fishing & Hunting | 11 (100.0%) | 0 (0.0%) |
| Mining, Quarrying, & Extraction | 3 (100.0%) | 0 (0.0%) |
| Construction | 44 (100.0%) | 0 (0.0%) |
| Manufacturing | 31 (64.6%) | 17 (35.4%) |
| Wholesale Trade | 10 (100.0%) | 0 (0.0%) |
| Retail Trade | 67 (84.8%) | 12 (15.2%) |
| Transportation & Warehousing | 5 (50.0%) | 5 (50.0%) |
| Utilities | 12 (100.0%) | 0 (0.0%) |
| Information | 0 (0.0%) | 0 (0.0%) |
| Finance & Insurance | 0 (0.0%) | 4 (100.0%) |
| Real Estate, Rental & Leasing | 10 (100.0%) | 0 (0.0%) |
| Professional & Scientific | 5 (35.7%) | 9 (64.3%) |
| Enterprise Management | 0 (0.0%) | 0 (0.0%) |
| Administrative & Support | 8 (100.0%) | 0 (0.0%) |
| Educational Services | 15 (36.6%) | 26 (63.4%) |
| Health Care & Social Assistance | 0 (0.0%) | 107 (100.0%) |
| Arts, Entertainment & Recreation | 5 (35.7%) | 9 (64.3%) |
| Accommodation & Food Services | 9 (29.0%) | 22 (71.0%) |
| Public Administration | 19 (38.8%) | 30 (61.2%) |
| Total | 277 (52.8%) | 248 (47.2%) |
Education in Farmersburg
School Enrollment in Farmersburg
The most common levels of schooling among the 260 students in Farmersburg are high school (99 | 38.1%), middle school (61 | 23.5%), and elementary school (36 | 13.9%).
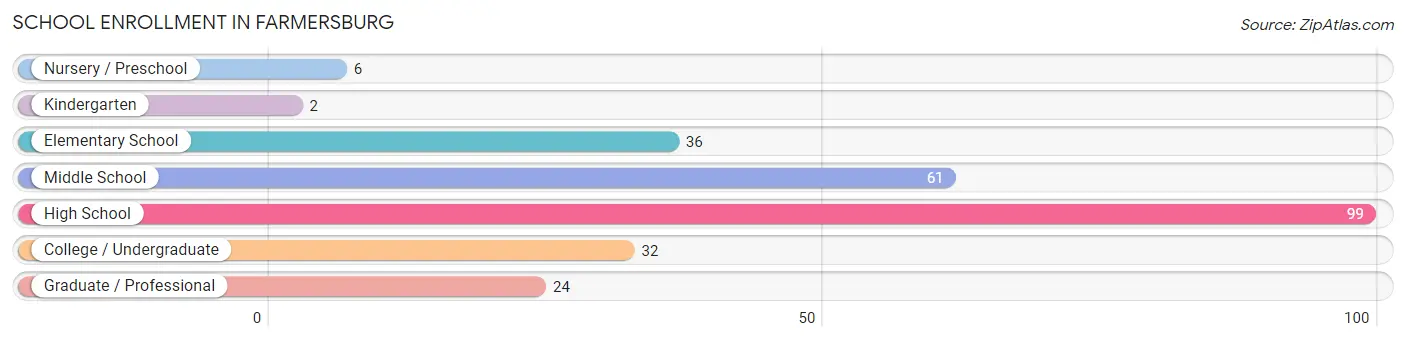
| School Level | # Students | % Students |
| Nursery / Preschool | 6 | 2.3% |
| Kindergarten | 2 | 0.8% |
| Elementary School | 36 | 13.9% |
| Middle School | 61 | 23.5% |
| High School | 99 | 38.1% |
| College / Undergraduate | 32 | 12.3% |
| Graduate / Professional | 24 | 9.2% |
| Total | 260 | 100.0% |
School Enrollment by Age by Funding Source in Farmersburg
Out of a total of 260 students who are enrolled in schools in Farmersburg, 17 (6.5%) attend a private institution, while the remaining 243 (93.5%) are enrolled in public schools. The age group of 15 to 17 year olds has the highest likelihood of being enrolled in private schools, with 6 (14.3% in the age bracket) enrolled. Conversely, the age group of 5 to 9 year old has the lowest likelihood of being enrolled in a private school, with 39 (100.0% in the age bracket) attending a public institution.
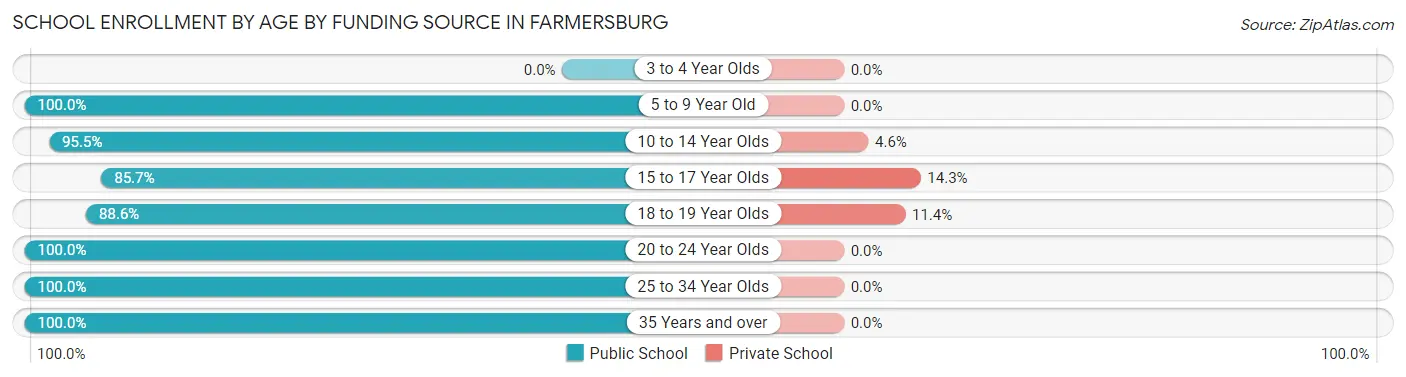
| Age Bracket | Public School | Private School |
| 3 to 4 Year Olds | 0 (0.0%) | 0 (0.0%) |
| 5 to 9 Year Old | 39 (100.0%) | 0 (0.0%) |
| 10 to 14 Year Olds | 63 (95.5%) | 3 (4.5%) |
| 15 to 17 Year Olds | 36 (85.7%) | 6 (14.3%) |
| 18 to 19 Year Olds | 62 (88.6%) | 8 (11.4%) |
| 20 to 24 Year Olds | 15 (100.0%) | 0 (0.0%) |
| 25 to 34 Year Olds | 5 (100.0%) | 0 (0.0%) |
| 35 Years and over | 23 (100.0%) | 0 (0.0%) |
| Total | 243 (93.5%) | 17 (6.5%) |
Educational Attainment by Field of Study in Farmersburg
Business (27 | 19.6%), science & technology (26 | 18.8%), social sciences (20 | 14.5%), education (16 | 11.6%), and psychology (13 | 9.4%) are the most common fields of study among 138 individuals in Farmersburg who have obtained a bachelor's degree or higher.
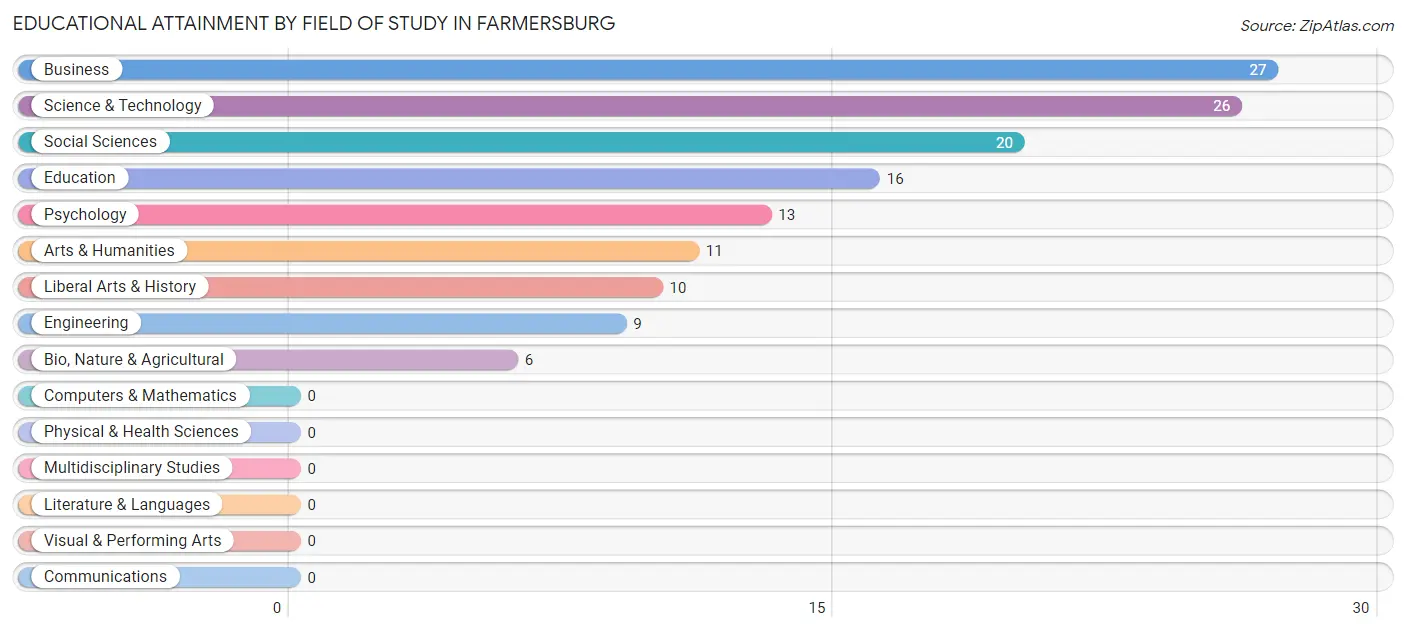
| Field of Study | # Graduates | % Graduates |
| Computers & Mathematics | 0 | 0.0% |
| Bio, Nature & Agricultural | 6 | 4.3% |
| Physical & Health Sciences | 0 | 0.0% |
| Psychology | 13 | 9.4% |
| Social Sciences | 20 | 14.5% |
| Engineering | 9 | 6.5% |
| Multidisciplinary Studies | 0 | 0.0% |
| Science & Technology | 26 | 18.8% |
| Business | 27 | 19.6% |
| Education | 16 | 11.6% |
| Literature & Languages | 0 | 0.0% |
| Liberal Arts & History | 10 | 7.2% |
| Visual & Performing Arts | 0 | 0.0% |
| Communications | 0 | 0.0% |
| Arts & Humanities | 11 | 8.0% |
| Total | 138 | 100.0% |
Transportation & Commute in Farmersburg
Vehicle Availability by Sex in Farmersburg
The most prevalent vehicle ownership categories in Farmersburg are males with 2 vehicles (91, accounting for 32.9%) and females with 2 vehicles (81, making up 37.4%).
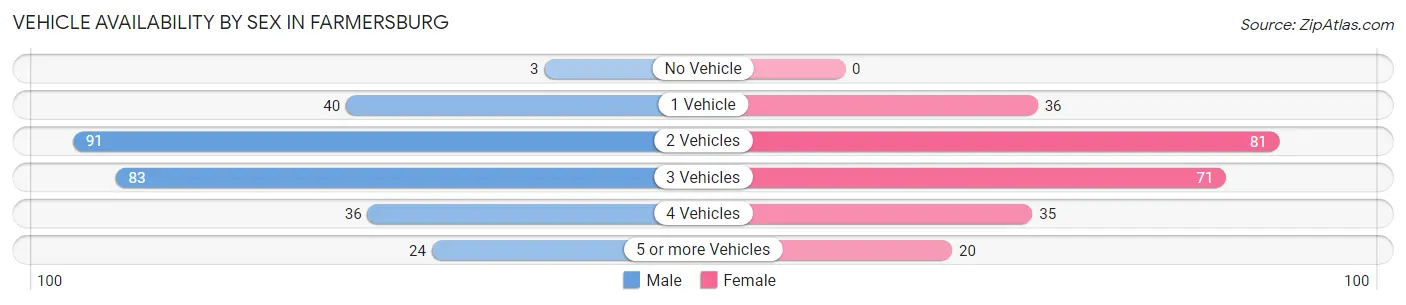
| Vehicles Available | Male | Female |
| No Vehicle | 3 (1.1%) | 0 (0.0%) |
| 1 Vehicle | 40 (14.4%) | 36 (14.8%) |
| 2 Vehicles | 91 (32.9%) | 81 (33.3%) |
| 3 Vehicles | 83 (30.0%) | 71 (29.2%) |
| 4 Vehicles | 36 (13.0%) | 35 (14.4%) |
| 5 or more Vehicles | 24 (8.7%) | 20 (8.2%) |
| Total | 277 (100.0%) | 243 (100.0%) |
Commute Time in Farmersburg
The most frequently occuring commute durations in Farmersburg are 20 to 24 minutes (103 commuters, 20.3%), 25 to 29 minutes (86 commuters, 16.9%), and 30 to 34 minutes (74 commuters, 14.6%).
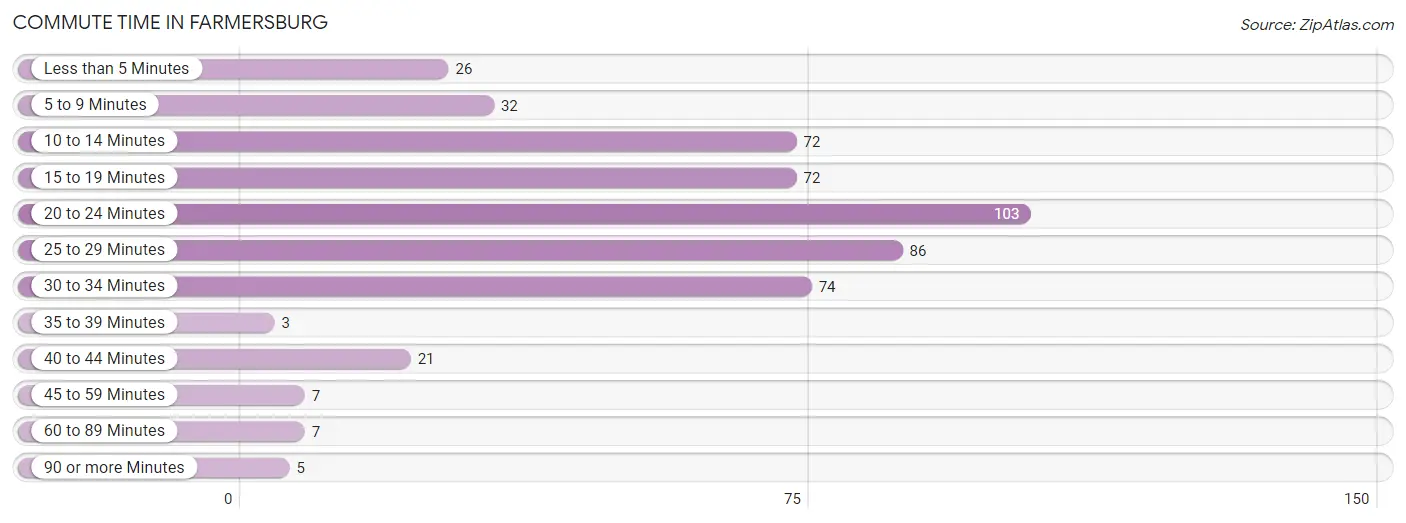
| Commute Time | # Commuters | % Commuters |
| Less than 5 Minutes | 26 | 5.1% |
| 5 to 9 Minutes | 32 | 6.3% |
| 10 to 14 Minutes | 72 | 14.2% |
| 15 to 19 Minutes | 72 | 14.2% |
| 20 to 24 Minutes | 103 | 20.3% |
| 25 to 29 Minutes | 86 | 16.9% |
| 30 to 34 Minutes | 74 | 14.6% |
| 35 to 39 Minutes | 3 | 0.6% |
| 40 to 44 Minutes | 21 | 4.1% |
| 45 to 59 Minutes | 7 | 1.4% |
| 60 to 89 Minutes | 7 | 1.4% |
| 90 or more Minutes | 5 | 1.0% |
Commute Time by Sex in Farmersburg
The most common commute times in Farmersburg are 10 to 14 minutes (62 commuters, 23.0%) for males and 25 to 29 minutes (79 commuters, 33.2%) for females.
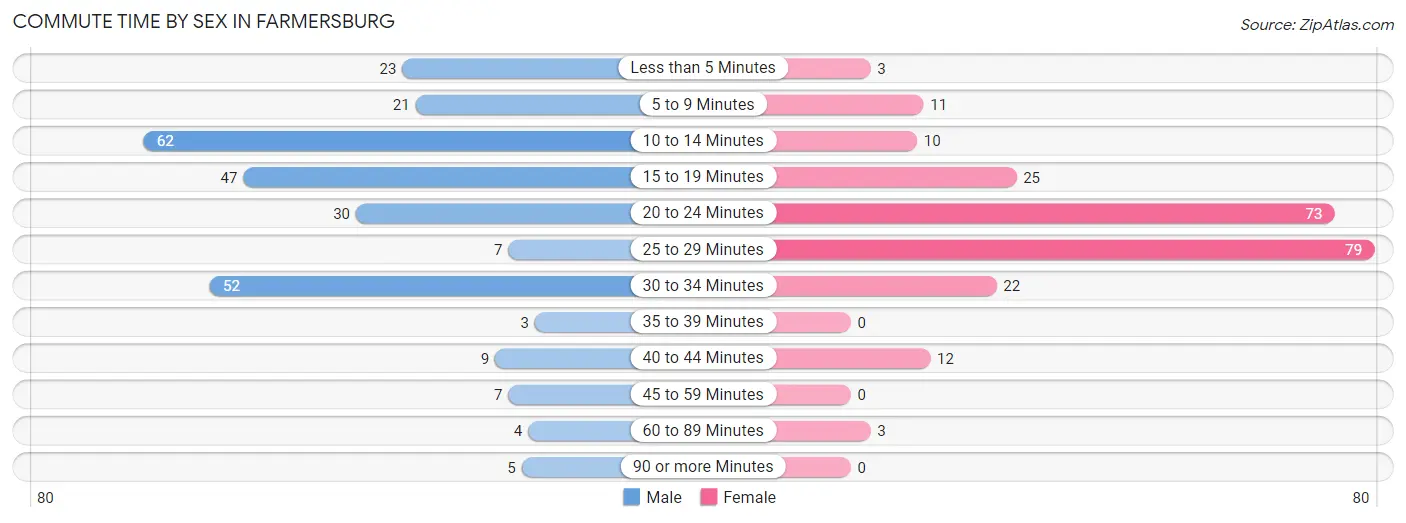
| Commute Time | Male | Female |
| Less than 5 Minutes | 23 (8.5%) | 3 (1.3%) |
| 5 to 9 Minutes | 21 (7.8%) | 11 (4.6%) |
| 10 to 14 Minutes | 62 (23.0%) | 10 (4.2%) |
| 15 to 19 Minutes | 47 (17.4%) | 25 (10.5%) |
| 20 to 24 Minutes | 30 (11.1%) | 73 (30.7%) |
| 25 to 29 Minutes | 7 (2.6%) | 79 (33.2%) |
| 30 to 34 Minutes | 52 (19.3%) | 22 (9.2%) |
| 35 to 39 Minutes | 3 (1.1%) | 0 (0.0%) |
| 40 to 44 Minutes | 9 (3.3%) | 12 (5.0%) |
| 45 to 59 Minutes | 7 (2.6%) | 0 (0.0%) |
| 60 to 89 Minutes | 4 (1.5%) | 3 (1.3%) |
| 90 or more Minutes | 5 (1.8%) | 0 (0.0%) |
Time of Departure to Work by Sex in Farmersburg
The most frequent times of departure to work in Farmersburg are 7:00 AM to 7:29 AM (70, 25.9%) for males and 7:00 AM to 7:29 AM (52, 21.8%) for females.
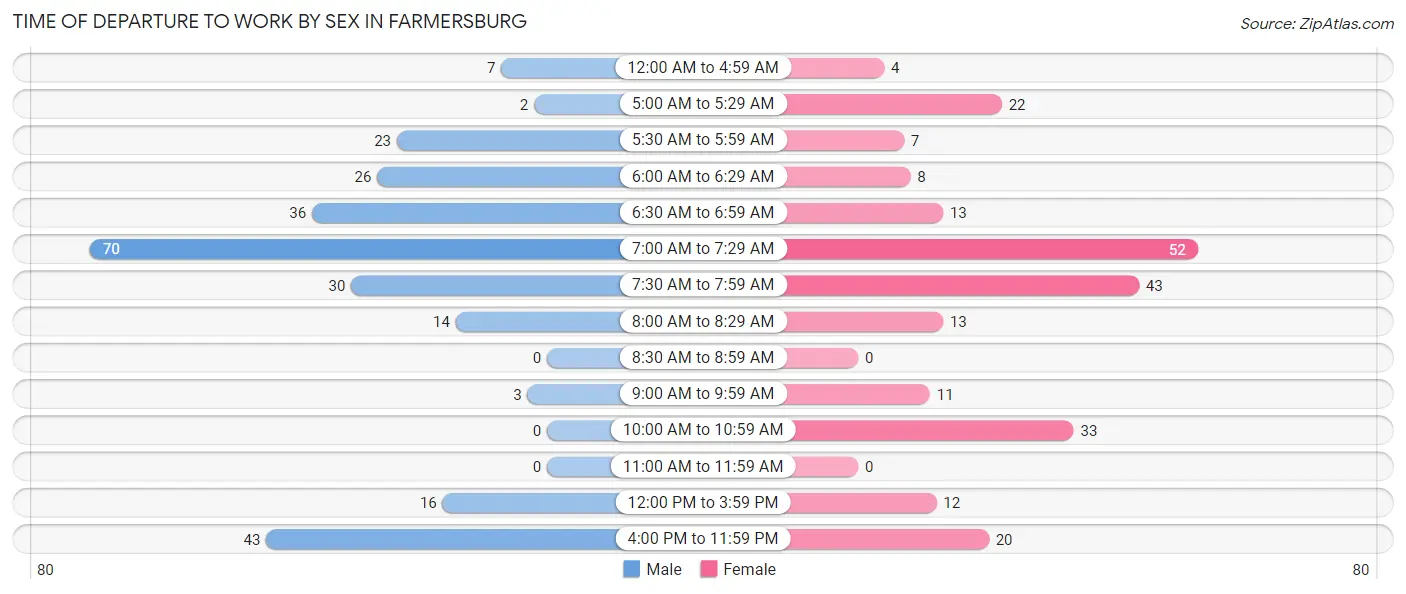
| Time of Departure | Male | Female |
| 12:00 AM to 4:59 AM | 7 (2.6%) | 4 (1.7%) |
| 5:00 AM to 5:29 AM | 2 (0.7%) | 22 (9.2%) |
| 5:30 AM to 5:59 AM | 23 (8.5%) | 7 (2.9%) |
| 6:00 AM to 6:29 AM | 26 (9.6%) | 8 (3.4%) |
| 6:30 AM to 6:59 AM | 36 (13.3%) | 13 (5.5%) |
| 7:00 AM to 7:29 AM | 70 (25.9%) | 52 (21.8%) |
| 7:30 AM to 7:59 AM | 30 (11.1%) | 43 (18.1%) |
| 8:00 AM to 8:29 AM | 14 (5.2%) | 13 (5.5%) |
| 8:30 AM to 8:59 AM | 0 (0.0%) | 0 (0.0%) |
| 9:00 AM to 9:59 AM | 3 (1.1%) | 11 (4.6%) |
| 10:00 AM to 10:59 AM | 0 (0.0%) | 33 (13.9%) |
| 11:00 AM to 11:59 AM | 0 (0.0%) | 0 (0.0%) |
| 12:00 PM to 3:59 PM | 16 (5.9%) | 12 (5.0%) |
| 4:00 PM to 11:59 PM | 43 (15.9%) | 20 (8.4%) |
| Total | 270 (100.0%) | 238 (100.0%) |
Housing Occupancy in Farmersburg
Occupancy by Ownership in Farmersburg
Of the total 482 dwellings in Farmersburg, owner-occupied units account for 392 (81.3%), while renter-occupied units make up 90 (18.7%).
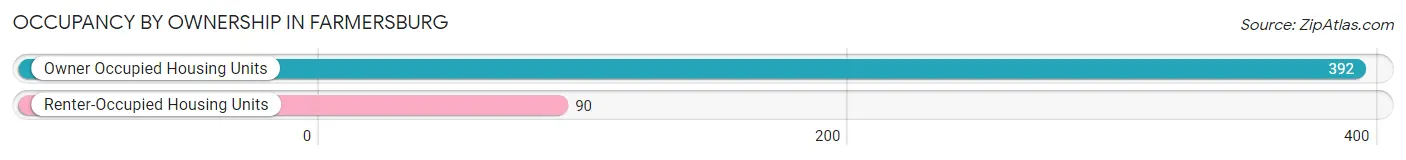
| Occupancy | # Housing Units | % Housing Units |
| Owner Occupied Housing Units | 392 | 81.3% |
| Renter-Occupied Housing Units | 90 | 18.7% |
| Total Occupied Housing Units | 482 | 100.0% |
Occupancy by Household Size in Farmersburg
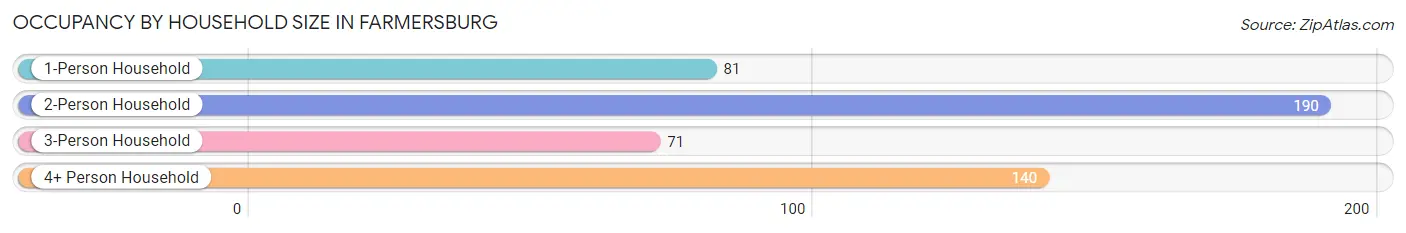
| Household Size | # Housing Units | % Housing Units |
| 1-Person Household | 81 | 16.8% |
| 2-Person Household | 190 | 39.4% |
| 3-Person Household | 71 | 14.7% |
| 4+ Person Household | 140 | 29.0% |
| Total Housing Units | 482 | 100.0% |
Occupancy by Ownership by Household Size in Farmersburg
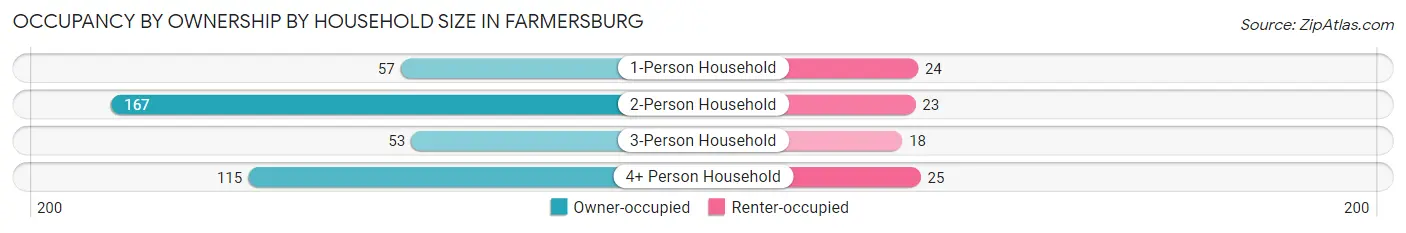
| Household Size | Owner-occupied | Renter-occupied |
| 1-Person Household | 57 (70.4%) | 24 (29.6%) |
| 2-Person Household | 167 (87.9%) | 23 (12.1%) |
| 3-Person Household | 53 (74.7%) | 18 (25.4%) |
| 4+ Person Household | 115 (82.1%) | 25 (17.9%) |
| Total Housing Units | 392 (81.3%) | 90 (18.7%) |
Occupancy by Educational Attainment in Farmersburg
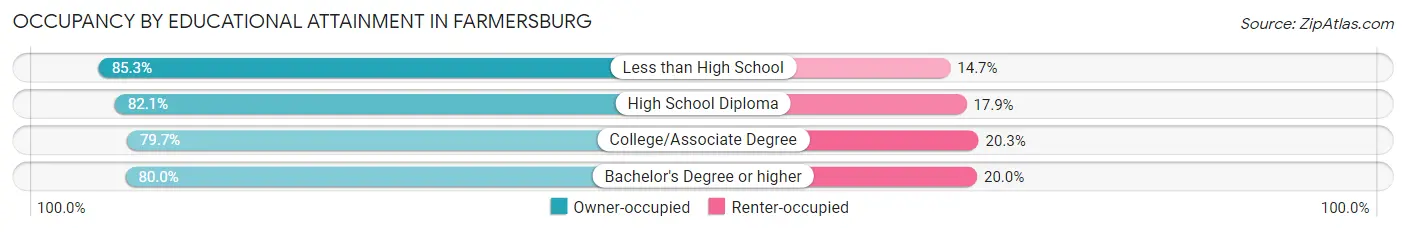
| Household Size | Owner-occupied | Renter-occupied |
| Less than High School | 58 (85.3%) | 10 (14.7%) |
| High School Diploma | 133 (82.1%) | 29 (17.9%) |
| College/Associate Degree | 161 (79.7%) | 41 (20.3%) |
| Bachelor's Degree or higher | 40 (80.0%) | 10 (20.0%) |
Occupancy by Age of Householder in Farmersburg
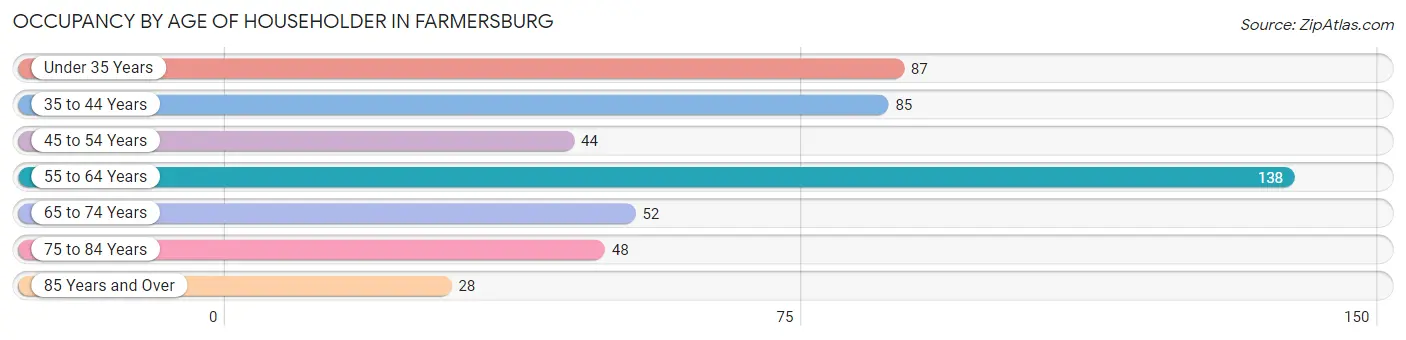
| Age Bracket | # Households | % Households |
| Under 35 Years | 87 | 18.0% |
| 35 to 44 Years | 85 | 17.6% |
| 45 to 54 Years | 44 | 9.1% |
| 55 to 64 Years | 138 | 28.6% |
| 65 to 74 Years | 52 | 10.8% |
| 75 to 84 Years | 48 | 10.0% |
| 85 Years and Over | 28 | 5.8% |
| Total | 482 | 100.0% |
Housing Finances in Farmersburg
Median Income by Occupancy in Farmersburg
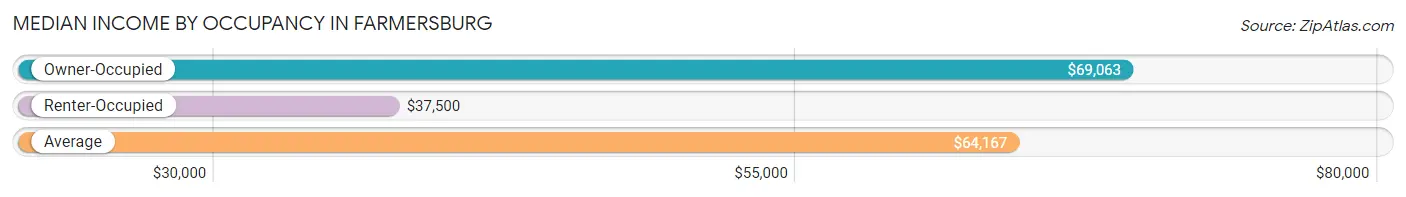
| Occupancy Type | # Households | Median Income |
| Owner-Occupied | 392 (81.3%) | $69,063 |
| Renter-Occupied | 90 (18.7%) | $37,500 |
| Average | 482 (100.0%) | $64,167 |
Occupancy by Householder Income Bracket in Farmersburg
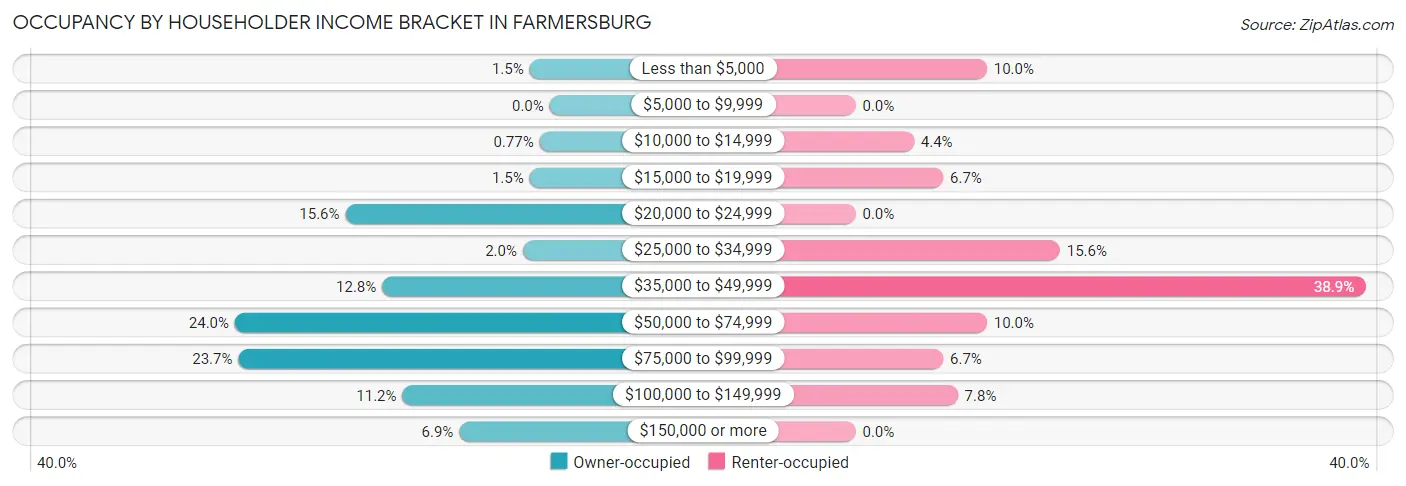
| Income Bracket | Owner-occupied | Renter-occupied |
| Less than $5,000 | 6 (1.5%) | 9 (10.0%) |
| $5,000 to $9,999 | 0 (0.0%) | 0 (0.0%) |
| $10,000 to $14,999 | 3 (0.8%) | 4 (4.4%) |
| $15,000 to $19,999 | 6 (1.5%) | 6 (6.7%) |
| $20,000 to $24,999 | 61 (15.6%) | 0 (0.0%) |
| $25,000 to $34,999 | 8 (2.0%) | 14 (15.6%) |
| $35,000 to $49,999 | 50 (12.8%) | 35 (38.9%) |
| $50,000 to $74,999 | 94 (24.0%) | 9 (10.0%) |
| $75,000 to $99,999 | 93 (23.7%) | 6 (6.7%) |
| $100,000 to $149,999 | 44 (11.2%) | 7 (7.8%) |
| $150,000 or more | 27 (6.9%) | 0 (0.0%) |
| Total | 392 (100.0%) | 90 (100.0%) |
Monthly Housing Cost Tiers in Farmersburg
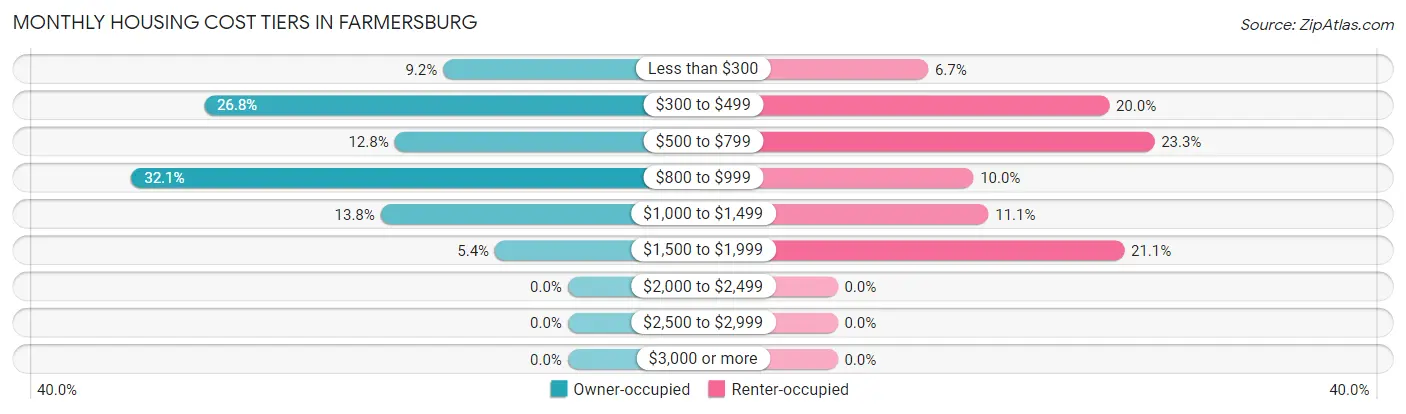
| Monthly Cost | Owner-occupied | Renter-occupied |
| Less than $300 | 36 (9.2%) | 6 (6.7%) |
| $300 to $499 | 105 (26.8%) | 18 (20.0%) |
| $500 to $799 | 50 (12.8%) | 21 (23.3%) |
| $800 to $999 | 126 (32.1%) | 9 (10.0%) |
| $1,000 to $1,499 | 54 (13.8%) | 10 (11.1%) |
| $1,500 to $1,999 | 21 (5.4%) | 19 (21.1%) |
| $2,000 to $2,499 | 0 (0.0%) | 0 (0.0%) |
| $2,500 to $2,999 | 0 (0.0%) | 0 (0.0%) |
| $3,000 or more | 0 (0.0%) | 0 (0.0%) |
| Total | 392 (100.0%) | 90 (100.0%) |
Physical Housing Characteristics in Farmersburg
Housing Structures in Farmersburg
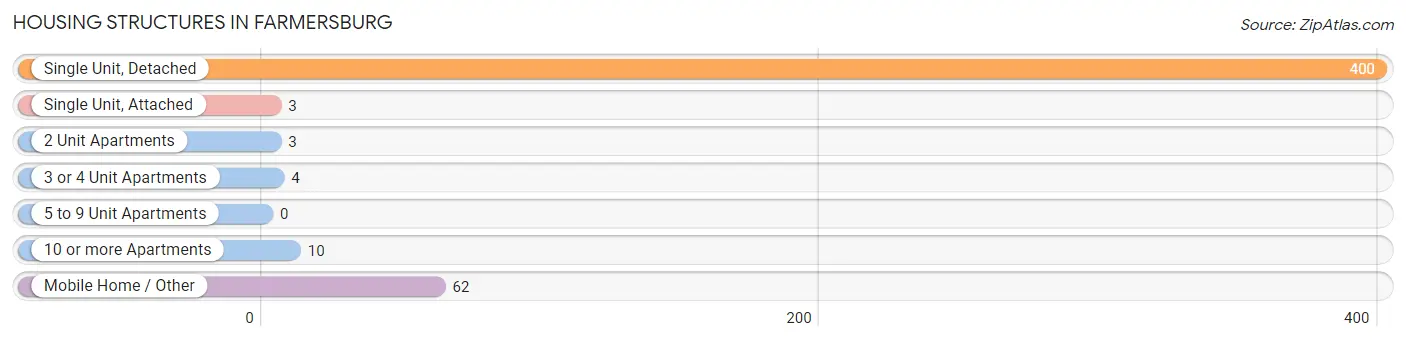
| Structure Type | # Housing Units | % Housing Units |
| Single Unit, Detached | 400 | 83.0% |
| Single Unit, Attached | 3 | 0.6% |
| 2 Unit Apartments | 3 | 0.6% |
| 3 or 4 Unit Apartments | 4 | 0.8% |
| 5 to 9 Unit Apartments | 0 | 0.0% |
| 10 or more Apartments | 10 | 2.1% |
| Mobile Home / Other | 62 | 12.9% |
| Total | 482 | 100.0% |
Housing Structures by Occupancy in Farmersburg
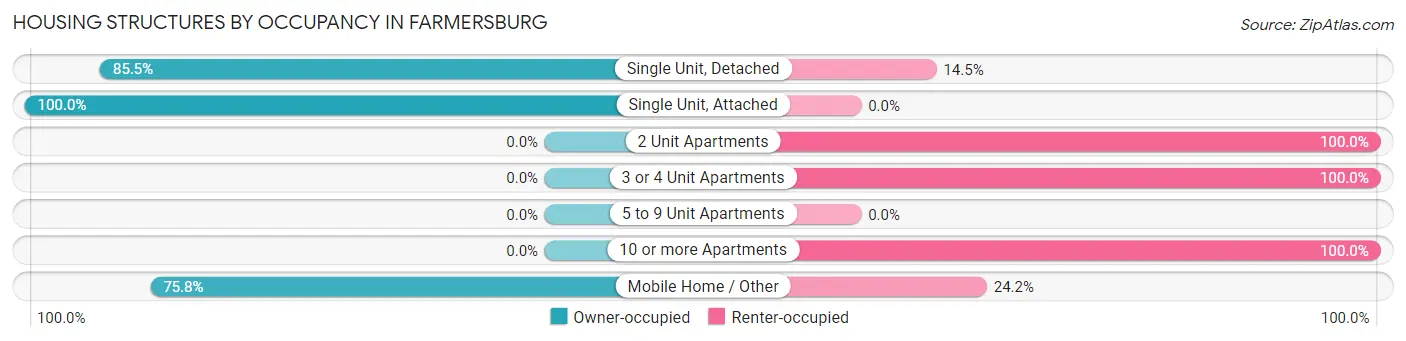
| Structure Type | Owner-occupied | Renter-occupied |
| Single Unit, Detached | 342 (85.5%) | 58 (14.5%) |
| Single Unit, Attached | 3 (100.0%) | 0 (0.0%) |
| 2 Unit Apartments | 0 (0.0%) | 3 (100.0%) |
| 3 or 4 Unit Apartments | 0 (0.0%) | 4 (100.0%) |
| 5 to 9 Unit Apartments | 0 (0.0%) | 0 (0.0%) |
| 10 or more Apartments | 0 (0.0%) | 10 (100.0%) |
| Mobile Home / Other | 47 (75.8%) | 15 (24.2%) |
| Total | 392 (81.3%) | 90 (18.7%) |
Housing Structures by Number of Rooms in Farmersburg
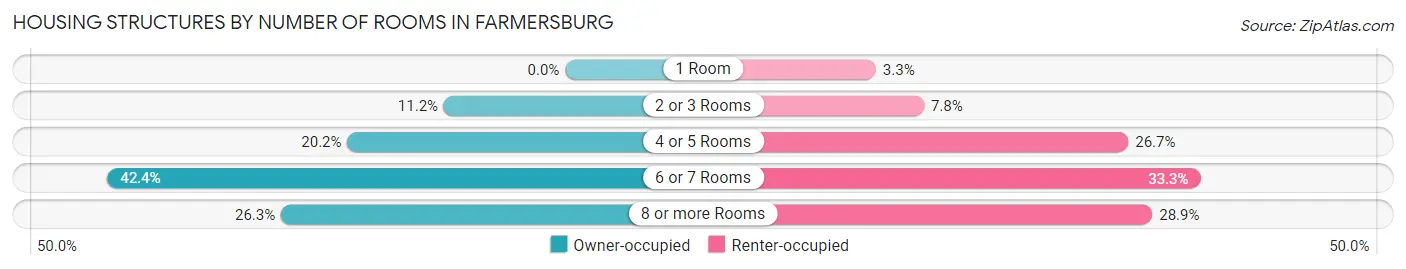
| Number of Rooms | Owner-occupied | Renter-occupied |
| 1 Room | 0 (0.0%) | 3 (3.3%) |
| 2 or 3 Rooms | 44 (11.2%) | 7 (7.8%) |
| 4 or 5 Rooms | 79 (20.2%) | 24 (26.7%) |
| 6 or 7 Rooms | 166 (42.3%) | 30 (33.3%) |
| 8 or more Rooms | 103 (26.3%) | 26 (28.9%) |
| Total | 392 (100.0%) | 90 (100.0%) |
Housing Structure by Heating Type in Farmersburg
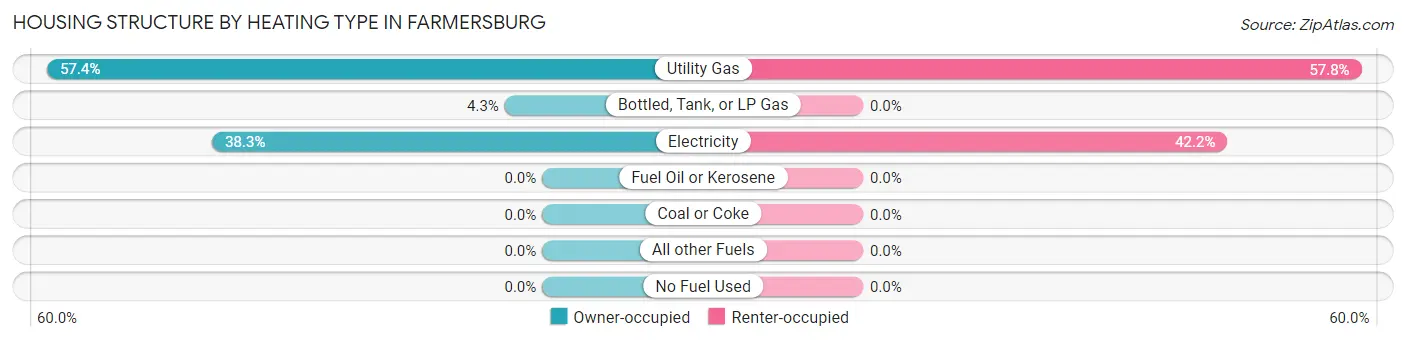
| Heating Type | Owner-occupied | Renter-occupied |
| Utility Gas | 225 (57.4%) | 52 (57.8%) |
| Bottled, Tank, or LP Gas | 17 (4.3%) | 0 (0.0%) |
| Electricity | 150 (38.3%) | 38 (42.2%) |
| Fuel Oil or Kerosene | 0 (0.0%) | 0 (0.0%) |
| Coal or Coke | 0 (0.0%) | 0 (0.0%) |
| All other Fuels | 0 (0.0%) | 0 (0.0%) |
| No Fuel Used | 0 (0.0%) | 0 (0.0%) |
| Total | 392 (100.0%) | 90 (100.0%) |
Household Vehicle Usage in Farmersburg
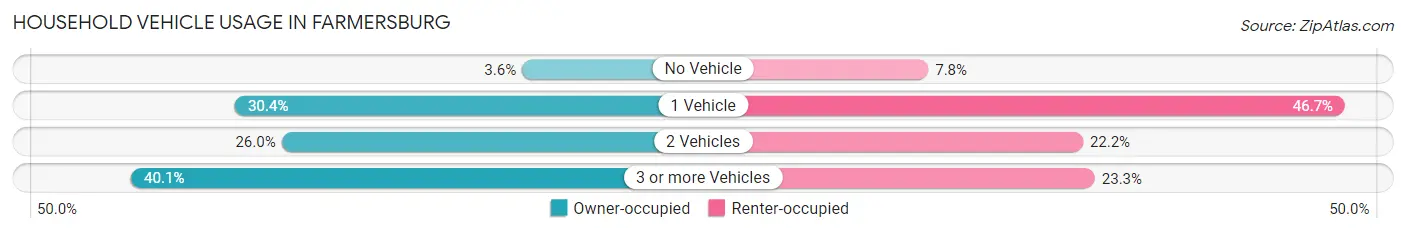
| Vehicles per Household | Owner-occupied | Renter-occupied |
| No Vehicle | 14 (3.6%) | 7 (7.8%) |
| 1 Vehicle | 119 (30.4%) | 42 (46.7%) |
| 2 Vehicles | 102 (26.0%) | 20 (22.2%) |
| 3 or more Vehicles | 157 (40.1%) | 21 (23.3%) |
| Total | 392 (100.0%) | 90 (100.0%) |
Real Estate & Mortgages in Farmersburg
Real Estate and Mortgage Overview in Farmersburg
| Characteristic | Without Mortgage | With Mortgage |
| Housing Units | 136 | 256 |
| Median Property Value | $66,100 | $75,400 |
| Median Household Income | $55,192 | $27 |
| Monthly Housing Costs | $440 | $0 |
| Real Estate Taxes | $442 | $48 |
Property Value by Mortgage Status in Farmersburg
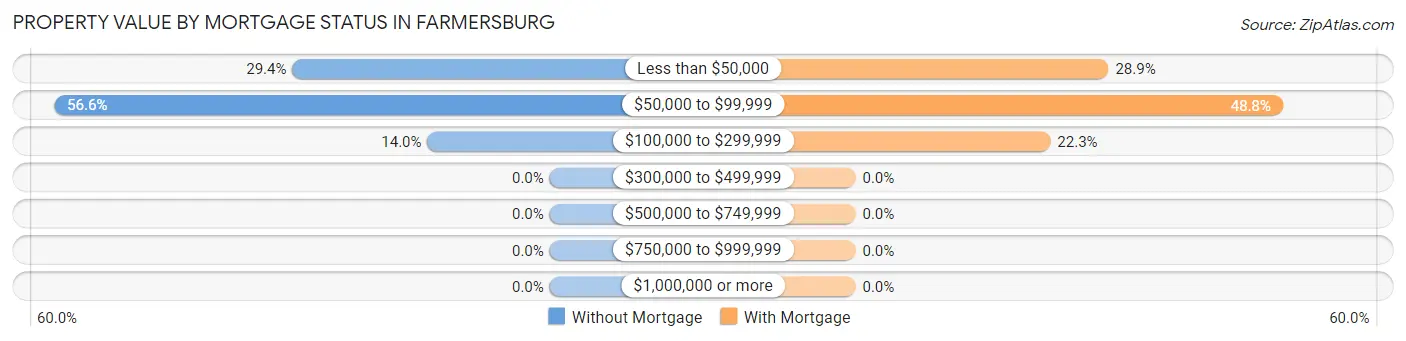
| Property Value | Without Mortgage | With Mortgage |
| Less than $50,000 | 40 (29.4%) | 74 (28.9%) |
| $50,000 to $99,999 | 77 (56.6%) | 125 (48.8%) |
| $100,000 to $299,999 | 19 (14.0%) | 57 (22.3%) |
| $300,000 to $499,999 | 0 (0.0%) | 0 (0.0%) |
| $500,000 to $749,999 | 0 (0.0%) | 0 (0.0%) |
| $750,000 to $999,999 | 0 (0.0%) | 0 (0.0%) |
| $1,000,000 or more | 0 (0.0%) | 0 (0.0%) |
| Total | 136 (100.0%) | 256 (100.0%) |
Household Income by Mortgage Status in Farmersburg
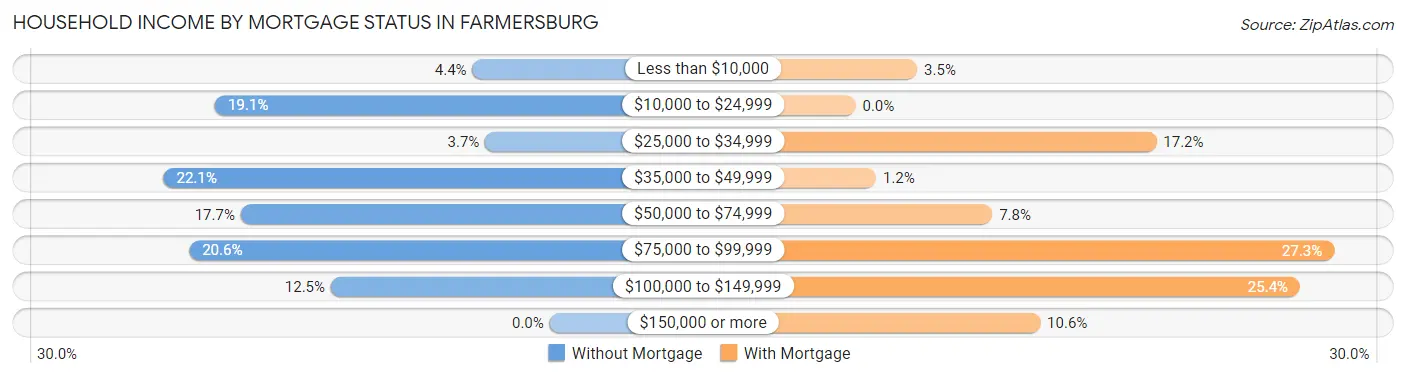
| Household Income | Without Mortgage | With Mortgage |
| Less than $10,000 | 6 (4.4%) | 9 (3.5%) |
| $10,000 to $24,999 | 26 (19.1%) | 0 (0.0%) |
| $25,000 to $34,999 | 5 (3.7%) | 44 (17.2%) |
| $35,000 to $49,999 | 30 (22.1%) | 3 (1.2%) |
| $50,000 to $74,999 | 24 (17.6%) | 20 (7.8%) |
| $75,000 to $99,999 | 28 (20.6%) | 70 (27.3%) |
| $100,000 to $149,999 | 17 (12.5%) | 65 (25.4%) |
| $150,000 or more | 0 (0.0%) | 27 (10.5%) |
| Total | 136 (100.0%) | 256 (100.0%) |
Property Value to Household Income Ratio in Farmersburg
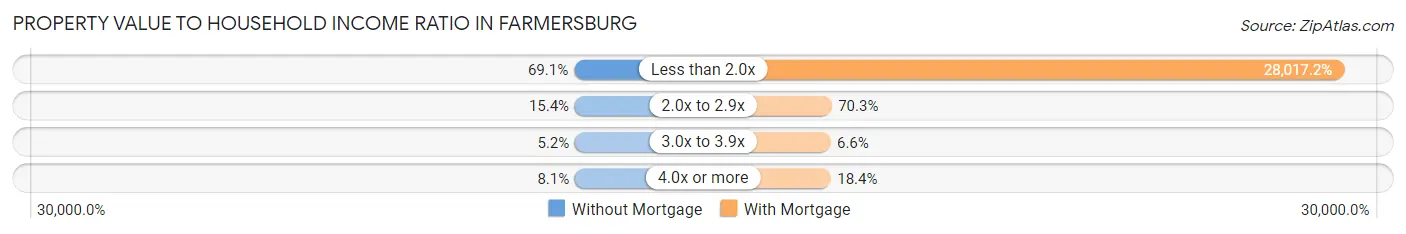
| Value-to-Income Ratio | Without Mortgage | With Mortgage |
| Less than 2.0x | 94 (69.1%) | 71,724 (28,017.2%) |
| 2.0x to 2.9x | 21 (15.4%) | 180 (70.3%) |
| 3.0x to 3.9x | 7 (5.1%) | 17 (6.6%) |
| 4.0x or more | 11 (8.1%) | 47 (18.4%) |
| Total | 136 (100.0%) | 256 (100.0%) |
Real Estate Taxes by Mortgage Status in Farmersburg
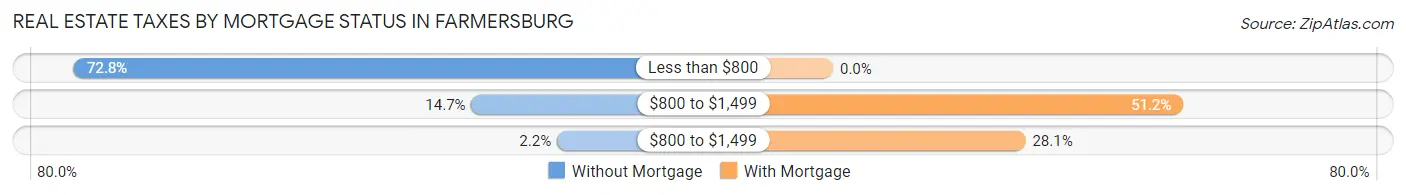
| Property Taxes | Without Mortgage | With Mortgage |
| Less than $800 | 99 (72.8%) | 0 (0.0%) |
| $800 to $1,499 | 20 (14.7%) | 131 (51.2%) |
| $800 to $1,499 | 3 (2.2%) | 72 (28.1%) |
| Total | 136 (100.0%) | 256 (100.0%) |
Health & Disability in Farmersburg
Health Insurance Coverage by Age in Farmersburg
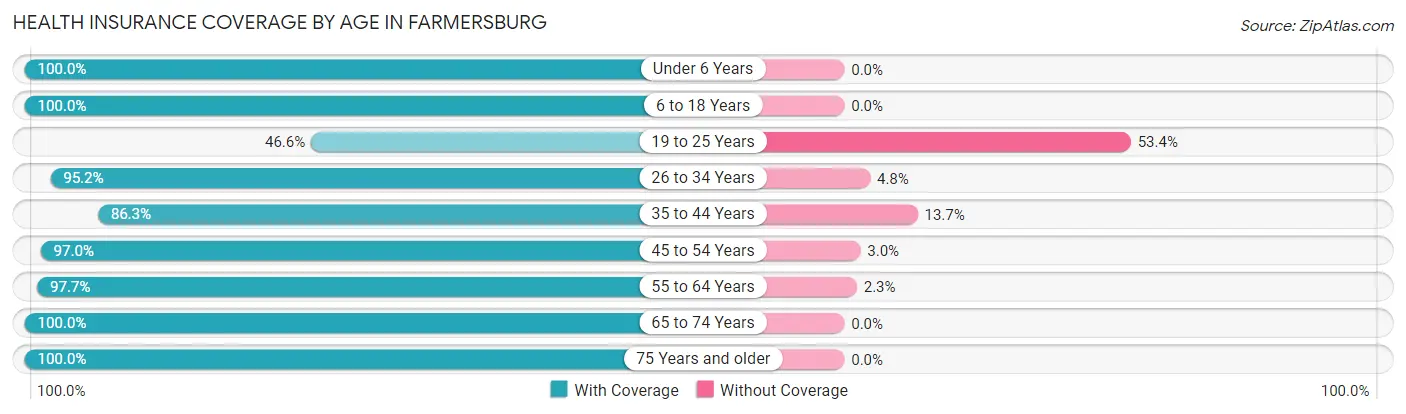
| Age Bracket | With Coverage | Without Coverage |
| Under 6 Years | 90 (100.0%) | 0 (0.0%) |
| 6 to 18 Years | 203 (100.0%) | 0 (0.0%) |
| 19 to 25 Years | 34 (46.6%) | 39 (53.4%) |
| 26 to 34 Years | 119 (95.2%) | 6 (4.8%) |
| 35 to 44 Years | 139 (86.3%) | 22 (13.7%) |
| 45 to 54 Years | 97 (97.0%) | 3 (3.0%) |
| 55 to 64 Years | 210 (97.7%) | 5 (2.3%) |
| 65 to 74 Years | 94 (100.0%) | 0 (0.0%) |
| 75 Years and older | 163 (100.0%) | 0 (0.0%) |
| Total | 1,149 (93.9%) | 75 (6.1%) |
Health Insurance Coverage by Citizenship Status in Farmersburg
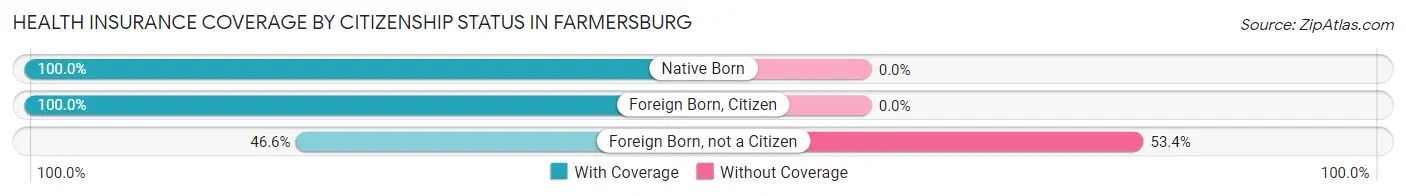
| Citizenship Status | With Coverage | Without Coverage |
| Native Born | 90 (100.0%) | 0 (0.0%) |
| Foreign Born, Citizen | 203 (100.0%) | 0 (0.0%) |
| Foreign Born, not a Citizen | 34 (46.6%) | 39 (53.4%) |
Health Insurance Coverage by Household Income in Farmersburg
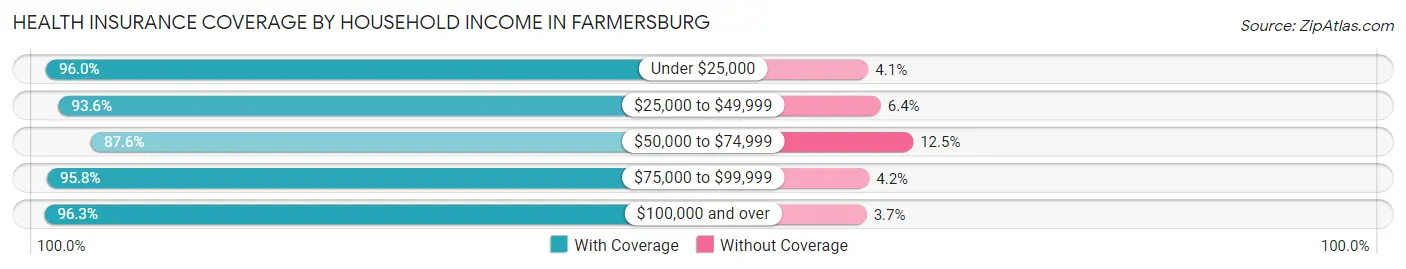
| Household Income | With Coverage | Without Coverage |
| Under $25,000 | 166 (96.0%) | 7 (4.1%) |
| $25,000 to $49,999 | 220 (93.6%) | 15 (6.4%) |
| $50,000 to $74,999 | 211 (87.5%) | 30 (12.4%) |
| $75,000 to $99,999 | 294 (95.8%) | 13 (4.2%) |
| $100,000 and over | 258 (96.3%) | 10 (3.7%) |
Public vs Private Health Insurance Coverage by Age in Farmersburg
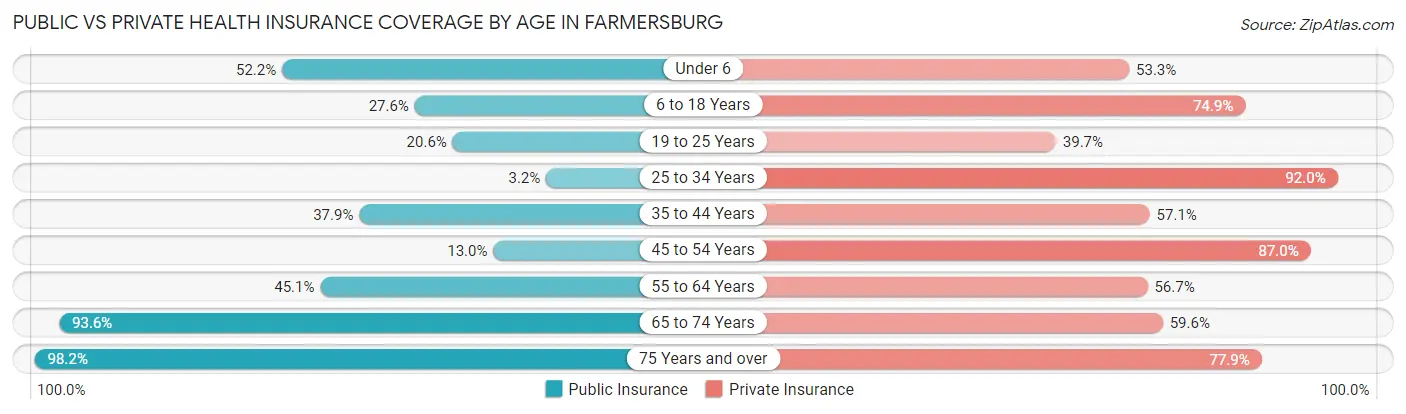
| Age Bracket | Public Insurance | Private Insurance |
| Under 6 | 47 (52.2%) | 48 (53.3%) |
| 6 to 18 Years | 56 (27.6%) | 152 (74.9%) |
| 19 to 25 Years | 15 (20.5%) | 29 (39.7%) |
| 25 to 34 Years | 4 (3.2%) | 115 (92.0%) |
| 35 to 44 Years | 61 (37.9%) | 92 (57.1%) |
| 45 to 54 Years | 13 (13.0%) | 87 (87.0%) |
| 55 to 64 Years | 97 (45.1%) | 122 (56.7%) |
| 65 to 74 Years | 88 (93.6%) | 56 (59.6%) |
| 75 Years and over | 160 (98.2%) | 127 (77.9%) |
| Total | 541 (44.2%) | 828 (67.6%) |
Disability Status by Sex by Age in Farmersburg
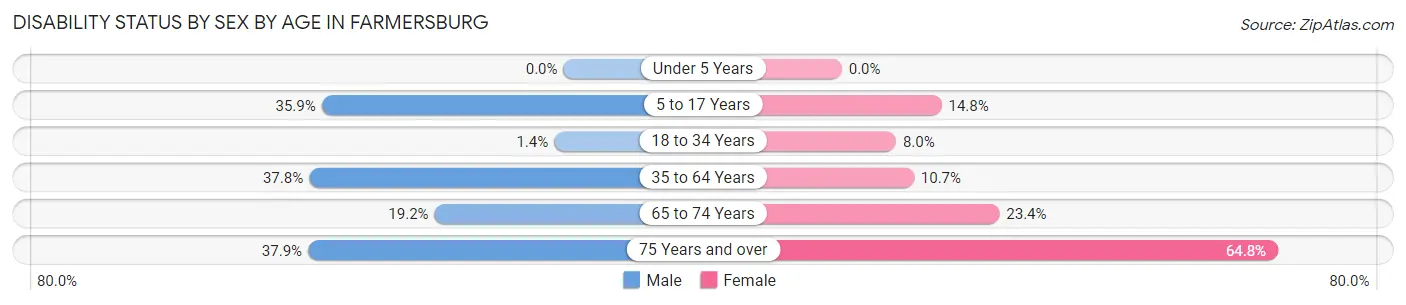
| Age Bracket | Male | Female |
| Under 5 Years | 0 (0.0%) | 0 (0.0%) |
| 5 to 17 Years | 42 (35.9%) | 8 (14.8%) |
| 18 to 34 Years | 2 (1.4%) | 9 (8.0%) |
| 35 to 64 Years | 88 (37.8%) | 26 (10.7%) |
| 65 to 74 Years | 9 (19.2%) | 11 (23.4%) |
| 75 Years and over | 22 (37.9%) | 68 (64.8%) |
Disability Class by Sex by Age in Farmersburg
Disability Class: Hearing Difficulty
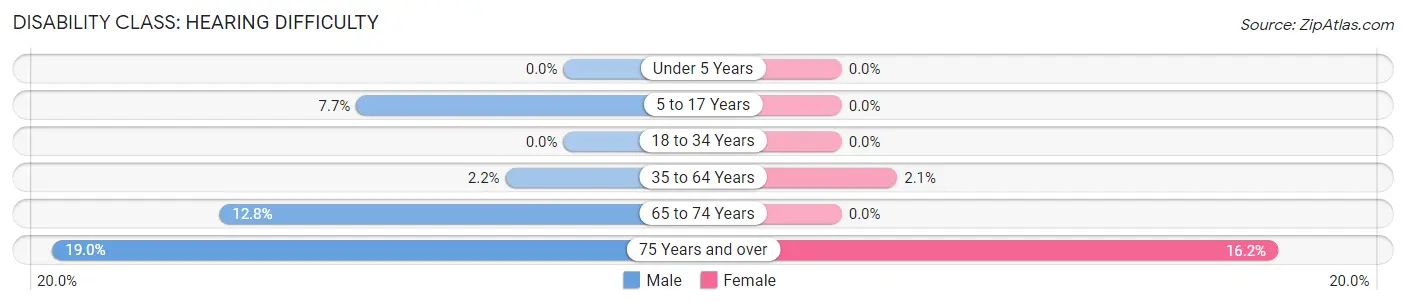
| Age Bracket | Male | Female |
| Under 5 Years | 0 (0.0%) | 0 (0.0%) |
| 5 to 17 Years | 9 (7.7%) | 0 (0.0%) |
| 18 to 34 Years | 0 (0.0%) | 0 (0.0%) |
| 35 to 64 Years | 5 (2.1%) | 5 (2.1%) |
| 65 to 74 Years | 6 (12.8%) | 0 (0.0%) |
| 75 Years and over | 11 (19.0%) | 17 (16.2%) |
Disability Class: Vision Difficulty
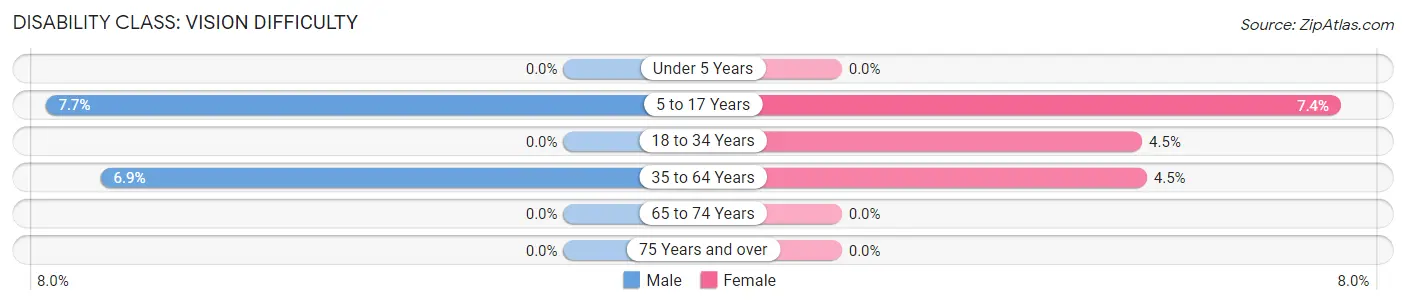
| Age Bracket | Male | Female |
| Under 5 Years | 0 (0.0%) | 0 (0.0%) |
| 5 to 17 Years | 9 (7.7%) | 4 (7.4%) |
| 18 to 34 Years | 0 (0.0%) | 5 (4.5%) |
| 35 to 64 Years | 16 (6.9%) | 11 (4.5%) |
| 65 to 74 Years | 0 (0.0%) | 0 (0.0%) |
| 75 Years and over | 0 (0.0%) | 0 (0.0%) |
Disability Class: Cognitive Difficulty
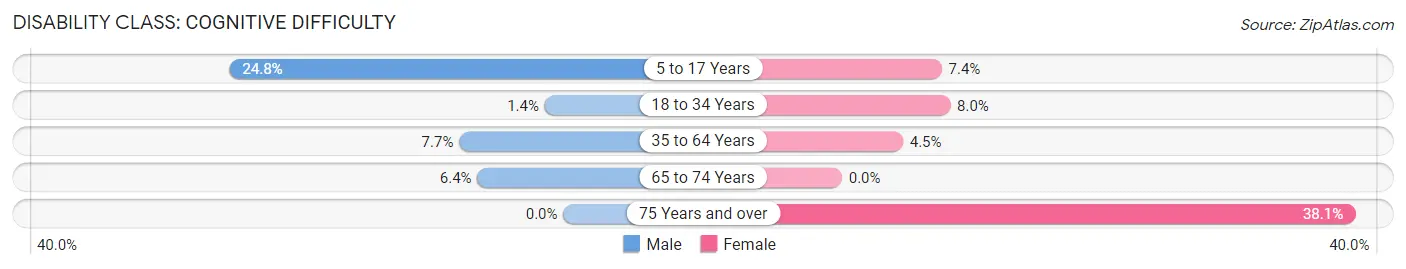
| Age Bracket | Male | Female |
| 5 to 17 Years | 29 (24.8%) | 4 (7.4%) |
| 18 to 34 Years | 2 (1.4%) | 9 (8.0%) |
| 35 to 64 Years | 18 (7.7%) | 11 (4.5%) |
| 65 to 74 Years | 3 (6.4%) | 0 (0.0%) |
| 75 Years and over | 0 (0.0%) | 40 (38.1%) |
Disability Class: Ambulatory Difficulty
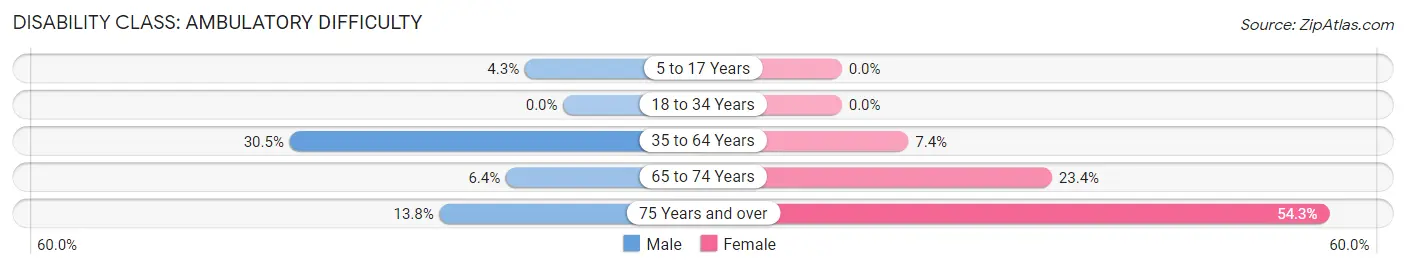
| Age Bracket | Male | Female |
| 5 to 17 Years | 5 (4.3%) | 0 (0.0%) |
| 18 to 34 Years | 0 (0.0%) | 0 (0.0%) |
| 35 to 64 Years | 71 (30.5%) | 18 (7.4%) |
| 65 to 74 Years | 3 (6.4%) | 11 (23.4%) |
| 75 Years and over | 8 (13.8%) | 57 (54.3%) |
Disability Class: Self-Care Difficulty
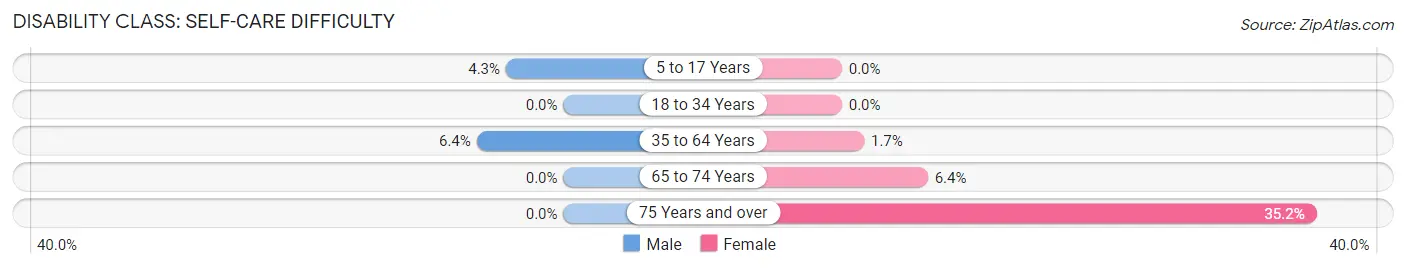
| Age Bracket | Male | Female |
| 5 to 17 Years | 5 (4.3%) | 0 (0.0%) |
| 18 to 34 Years | 0 (0.0%) | 0 (0.0%) |
| 35 to 64 Years | 15 (6.4%) | 4 (1.7%) |
| 65 to 74 Years | 0 (0.0%) | 3 (6.4%) |
| 75 Years and over | 0 (0.0%) | 37 (35.2%) |
Technology Access in Farmersburg
Computing Device Access in Farmersburg
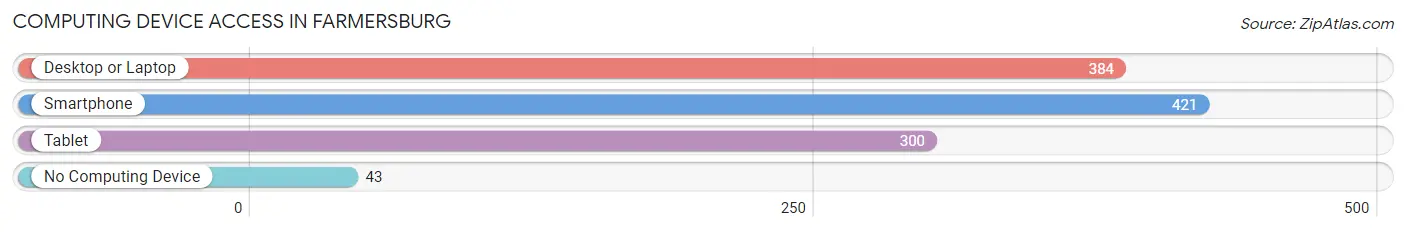
| Device Type | # Households | % Households |
| Desktop or Laptop | 384 | 79.7% |
| Smartphone | 421 | 87.3% |
| Tablet | 300 | 62.2% |
| No Computing Device | 43 | 8.9% |
| Total | 482 | 100.0% |
Internet Access in Farmersburg
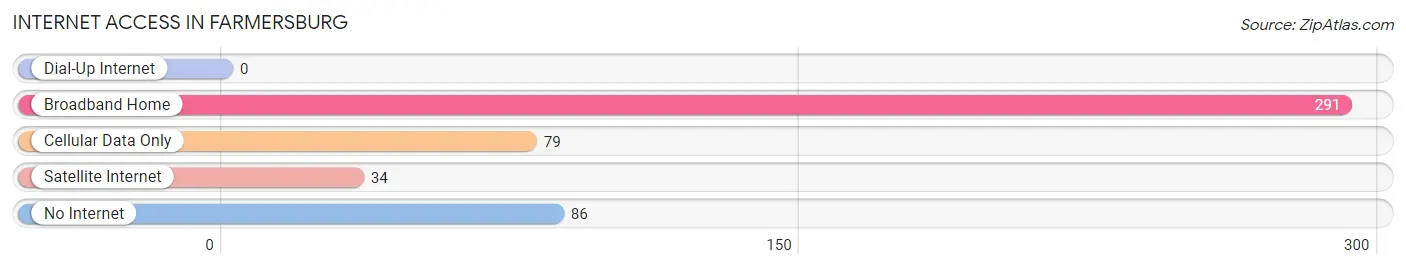
| Internet Type | # Households | % Households |
| Dial-Up Internet | 0 | 0.0% |
| Broadband Home | 291 | 60.4% |
| Cellular Data Only | 79 | 16.4% |
| Satellite Internet | 34 | 7.0% |
| No Internet | 86 | 17.8% |
| Total | 482 | 100.0% |
Farmersburg Summary
Farmersburg, Indiana is a small town located in the southwestern corner of the state, in Sullivan County. It is situated along the Wabash River, and is part of the Terre Haute Metropolitan Statistical Area. The town has a population of approximately 1,000 people, and is known for its rural charm and friendly atmosphere.
History
The area that is now Farmersburg was first settled in the early 1800s by a group of settlers from North Carolina. The town was originally known as “New Hope”, and was later renamed “Farmersburg” in 1837. The town was officially incorporated in 1845.
The town was a major agricultural center in the 19th century, and was home to several large farms. The town also had a number of small businesses, including a sawmill, a gristmill, and a blacksmith shop.
In the early 20th century, the town began to decline as the agricultural industry shifted away from the area. The town’s population decreased, and many of the businesses closed. However, the town was able to remain afloat due to its proximity to the Wabash River, which provided a steady source of income from the riverboat trade.
Geography
Farmersburg is located in the southwestern corner of Indiana, in Sullivan County. It is situated along the Wabash River, and is part of the Terre Haute Metropolitan Statistical Area. The town is located approximately 40 miles from Indianapolis, and is about an hour’s drive from both St. Louis and Chicago.
The town is situated on a flat plain, with an elevation of approximately 600 feet. The climate is generally mild, with hot summers and cold winters. The average annual temperature is around 50 degrees Fahrenheit.
Economy
The economy of Farmersburg is largely based on agriculture. The town is home to several large farms, which produce a variety of crops, including corn, soybeans, and wheat. The town also has a number of small businesses, including a sawmill, a gristmill, and a blacksmith shop.
In addition, the town is home to a number of manufacturing companies, including a plastics factory and a metal fabrication plant. The town also has a number of retail stores, including a grocery store, a hardware store, and a pharmacy.
Demographics
As of the 2010 census, the population of Farmersburg was 1,000 people. The racial makeup of the town was 97.2% White, 0.7% African American, 0.3% Native American, 0.2% Asian, and 1.6% from other races. The median household income was $37,500, and the median home value was $90,000.
The town is served by the Farmersburg-Sullivan County School District, which consists of two elementary schools, one middle school, and one high school. The town also has a public library, a post office, and a number of churches.
Conclusion
Farmersburg, Indiana is a small town located in the southwestern corner of the state, in Sullivan County. It is situated along the Wabash River, and is part of the Terre Haute Metropolitan Statistical Area. The town has a population of approximately 1,000 people, and is known for its rural charm and friendly atmosphere. The economy of the town is largely based on agriculture, and the town also has a number of small businesses and manufacturing companies. The town is served by the Farmersburg-Sullivan County School District, and has a public library, a post office, and a number of churches.
Common Questions
What is Per Capita Income in Farmersburg?
Per Capita income in Farmersburg is $25,733.
What is the Median Family Income in Farmersburg?
Median Family Income in Farmersburg is $70,345.
What is the Median Household income in Farmersburg?
Median Household Income in Farmersburg is $64,167.
What is Income or Wage Gap in Farmersburg?
Income or Wage Gap in Farmersburg is 9.2%.
Women in Farmersburg earn 90.8 cents for every dollar earned by a man.
What is Inequality or Gini Index in Farmersburg?
Inequality or Gini Index in Farmersburg is 0.37.
What is the Total Population of Farmersburg?
Total Population of Farmersburg is 1,224.
What is the Total Male Population of Farmersburg?
Total Male Population of Farmersburg is 627.
What is the Total Female Population of Farmersburg?
Total Female Population of Farmersburg is 597.
What is the Ratio of Males per 100 Females in Farmersburg?
There are 105.03 Males per 100 Females in Farmersburg.
What is the Ratio of Females per 100 Males in Farmersburg?
There are 95.22 Females per 100 Males in Farmersburg.
What is the Median Population Age in Farmersburg?
Median Population Age in Farmersburg is 42.0 Years.
What is the Average Family Size in Farmersburg
Average Family Size in Farmersburg is 2.8 People.
What is the Average Household Size in Farmersburg
Average Household Size in Farmersburg is 2.5 People.
How Large is the Labor Force in Farmersburg?
There are 534 People in the Labor Forcein in Farmersburg.
What is the Percentage of People in the Labor Force in Farmersburg?
52.4% of People are in the Labor Force in Farmersburg.
What is the Unemployment Rate in Farmersburg?
Unemployment Rate in Farmersburg is 1.7%.